
#thebillionairetrades
thebillionairetrades
29,978 views
197 Discussing
Hot
Latest

Sourced by user sharing on Binance
1
92
Billions Network (BILL) has experienced a further breakdown, dropping to a new all-time low of $0.004716.
Overview
• The Breakdown: The token has continued its downward trajectory, dropping significantly below the previous stabilization levels and hitting an absolute historic floor of $0.004716 USD.
• Current Standing: As of November 4, 2026, BILL is trading at approximately $0.00485 USD across major platforms. This marks an additional decline from the previous alert's $0.00535 floor.
• Technical Impact: The token remains in an aggressive macro down-trend, trading roughly 97.9% below its structural all-time high of $0.23 USD. Momentum indicators indicate deep, persistent selling pressure with no immediate sign of a reversal structure.
Market Digest & Insights
• New Floor Discovery: Market tracking from CryptoSlate confirms that the token recorded its absolute all-time low during this observation window.
• Volume Distribution: Aggregated derivatives data from CoinGecko shows active short positions maintaining dominance, with millions in 24-hour volume concentrated across Binance and OKX futures contracts.
• Immediate Outlook: The token is currently attempting a low-volume drift. Near-term structural charts indicate that any potential recovery must first reclaim and hold the $0.0050–$0.0055 liquidity range before buyers can target a broader trend.
#TheBillionaireTrades
{future}(BILLUSDT)
Billions Network (BILL) has experienced a further breakdown, dropping to a new all-time low of $0.004716.
Overview
• The Breakdown: The token has continued its downward trajectory, dropping significantly below the previous stabilization levels and hitting an absolute historic floor of $0.004716 USD.
• Current Standing: As of November 4, 2026, BILL is trading at approximately $0.00485 USD across major platforms. This marks an additional decline from the previous alert's $0.00535 floor.
• Technical Impact: The token remains in an aggressive macro down-trend, trading roughly 97.9% below its structural all-time high of $0.23 USD. Momentum indicators indicate deep, persistent selling pressure with no immediate sign of a reversal structure.
Market Digest & Insights
• New Floor Discovery: Market tracking from CryptoSlate confirms that the token recorded its absolute all-time low during this observation window.
• Volume Distribution: Aggregated derivatives data from CoinGecko shows active short positions maintaining dominance, with millions in 24-hour volume concentrated across Binance and OKX futures contracts.
• Immediate Outlook: The token is currently attempting a low-volume drift. Near-term structural charts indicate that any potential recovery must first reclaim and hold the $0.0050–$0.0055 liquidity range before buyers can target a broader trend.
#TheBillionaireTrades
Overview
• The Breakdown: The token has continued its downward trajectory, dropping significantly below the previous stabilization levels and hitting an absolute historic floor of $0.004716 USD.
• Current Standing: As of November 4, 2026, BILL is trading at approximately $0.00485 USD across major platforms. This marks an additional decline from the previous alert's $0.00535 floor.
• Technical Impact: The token remains in an aggressive macro down-trend, trading roughly 97.9% below its structural all-time high of $0.23 USD. Momentum indicators indicate deep, persistent selling pressure with no immediate sign of a reversal structure.
Market Digest & Insights
• New Floor Discovery: Market tracking from CryptoSlate confirms that the token recorded its absolute all-time low during this observation window.
• Volume Distribution: Aggregated derivatives data from CoinGecko shows active short positions maintaining dominance, with millions in 24-hour volume concentrated across Binance and OKX futures contracts.
• Immediate Outlook: The token is currently attempting a low-volume drift. Near-term structural charts indicate that any potential recovery must first reclaim and hold the $0.0050–$0.0055 liquidity range before buyers can target a broader trend.
#TheBillionaireTrades
665
Russia loses ground as Europe's 4th-largest economy doubles exports to Africa's largest oil reserve holder, with Italy–Libya trade hitting €6.8 billion
Bilateral trade between Italy, Europe's 4th-largest economy (statista ranking), and Libya, Africa's largest oil reserve holder, experienced dramatic growth during the first seven months of 2026, driven by a surge in commercial shipments and refined petroleum sales.
Bilateral trade between Italy and Libya saw a significant 44.9% increase in the first seven months of 2026, reaching nearly €6.8 billion.
Italian exports to Libya doubled, with refined petroleum products making up 58.8% of total exports and non-energy sectors also growing.
Italy became Libya's largest foreign trading partner, supplying 17% of all Libyan imports and diversifying into sectors like construction materials and consumer goods.
As a result, Russian fuel exports to Libya plummeted from 56,000 to about 5,000 barrels per day, with Italy now providing most of Libya's imported fuel.
#TheBillionaireTrades
Russia loses ground as Europe's 4th-largest economy doubles exports to Africa's largest oil reserve holder, with Italy–Libya trade hitting €6.8 billion
Bilateral trade between Italy, Europe's 4th-largest economy (statista ranking), and Libya, Africa's largest oil reserve holder, experienced dramatic growth during the first seven months of 2026, driven by a surge in commercial shipments and refined petroleum sales.
Bilateral trade between Italy and Libya saw a significant 44.9% increase in the first seven months of 2026, reaching nearly €6.8 billion.
Italian exports to Libya doubled, with refined petroleum products making up 58.8% of total exports and non-energy sectors also growing.
Italy became Libya's largest foreign trading partner, supplying 17% of all Libyan imports and diversifying into sectors like construction materials and consumer goods.
As a result, Russian fuel exports to Libya plummeted from 56,000 to about 5,000 barrels per day, with Italy now providing most of Libya's imported fuel.
#TheBillionaireTrades
Bilateral trade between Italy, Europe's 4th-largest economy (statista ranking), and Libya, Africa's largest oil reserve holder, experienced dramatic growth during the first seven months of 2026, driven by a surge in commercial shipments and refined petroleum sales.
Bilateral trade between Italy and Libya saw a significant 44.9% increase in the first seven months of 2026, reaching nearly €6.8 billion.
Italian exports to Libya doubled, with refined petroleum products making up 58.8% of total exports and non-energy sectors also growing.
Italy became Libya's largest foreign trading partner, supplying 17% of all Libyan imports and diversifying into sectors like construction materials and consumer goods.
As a result, Russian fuel exports to Libya plummeted from 56,000 to about 5,000 barrels per day, with Italy now providing most of Libya's imported fuel.
#TheBillionaireTrades
43
Bitcoin Retreats as Nvidia Turmoil Weighs on Risk Appetite
Bitcoin $BTC retreated Thursday as renewed unease over technology stocks weighed on risk appetite, with persistent withdrawals from US spot exchange-traded funds adding to the pressure.
The original cryptocurrency fell as much as 2.2% and was trading around $72,900 as of early morning in New York. Other cryptocurrencies also weakened along with US stock futures, which were dragged lower as concerns over leadership turmoil at Nvidia Corp. weighed on the artificial intelligence trade.
#TheBillionaireTrades
{spot}(BTCUSDT)
Bitcoin Retreats as Nvidia Turmoil Weighs on Risk Appetite
Bitcoin $BTC retreated Thursday as renewed unease over technology stocks weighed on risk appetite, with persistent withdrawals from US spot exchange-traded funds adding to the pressure.
The original cryptocurrency fell as much as 2.2% and was trading around $72,900 as of early morning in New York. Other cryptocurrencies also weakened along with US stock futures, which were dragged lower as concerns over leadership turmoil at Nvidia Corp. weighed on the artificial intelligence trade.
#TheBillionaireTrades
Bitcoin $BTC retreated Thursday as renewed unease over technology stocks weighed on risk appetite, with persistent withdrawals from US spot exchange-traded funds adding to the pressure.
The original cryptocurrency fell as much as 2.2% and was trading around $72,900 as of early morning in New York. Other cryptocurrencies also weakened along with US stock futures, which were dragged lower as concerns over leadership turmoil at Nvidia Corp. weighed on the artificial intelligence trade.
#TheBillionaireTrades
283

Article
Top Altcoins Price Forecast: Ripple, Cardano, and Solana remain vulnerable to further lossesRipple holds steady above its $1.00 psychological support on Tuesday, after five consecutive days of decline.
Cardano hovers above $0.1700 with buyers defending the $0.1712 support level in focus.
Solana continues its downtrend after breaking below a long-term support trendline.
Ripple $XRP , Cardano $ADA , and Solana $SOL struggle to find their footing after last week’s decline amid a decline in institutional investors’ risk appetite. Ripple is close to testing its $1.00 psychological threshold, Cardano is putting a crucial horizontal level to the test, while Solana remains at risk of extending its downtrend after breaking a crucial support trendline.
Market sentiment is weak as ceasefire talks between the US and Iran struggle to advance, while the odds of a truce have increased following Democrats’ majority in the US midterms. CoinMarketCap’s Fear and Greed Index is down to 28 on Tuesday, from 35 last week, suggesting a rise in risk-off sentiment among investors.
XRP and SOL ETFs face outflows while Cardano regains retail support
Ripple- and Solana-focused Exchange-Traded Funds (ETFs) face intense selling pressure. SoSoValue data shows that XRP ETFs recorded their largest daily outflow in eight months, at $10.42 million on Monday, while eight US SOL spot ETFs recorded $7.68 million in withdrawals, except for the 21shares TSOL, for which the numbers are still in the air.
Meanwhile, Cardano shows signs of renewed demand in the derivatives market. CoinGlass data shows the ADA taker buy-to-sell ratio rising to 1.06, from 0.86 the previous day, indicating renewed buying pressure as traders are now aggressively crossing the spread and consuming liquidity faster than sellers.
Taken together, Cardano shows signs of near-term resilience, while Ripple and Solana could be exposed to deeper corrections.
Meanwhile, Cardano shows signs of renewed demand in the derivatives market. CoinGlass data shows the ADA taker buy-to-sell ratio rising to 1.06, from 0.86 the previous day, indicating renewed buying pressure as traders are now aggressively crossing the spread and consuming liquidity faster than sellers.
Taken together, Cardano shows signs of near-term resilience, while Ripple and Solana could be exposed to deeper corrections.
Technical analysis: Ripple risks breaking below $1
XRP trades at $1.0977 at press time on Tuesday, maintaining a bearish near-term tone. The cross-border remittance token holds well below the 50-day Exponential Moving Average (EMA) at $1.2945 and the 200-day EMA at $1.3656.
Momentum is weak, with the Relative Strength Index (RSI) hovering near oversold territory at 26 and the Moving Average Convergence Divergence (MACD) in negative territory, both of which suggest that selling pressure remains dominant.
horizontal level around $1.0692, ahead of a deeper structural floor near $0.9862, where buyers previously emerged.
The immediate support is seen at the horizontal level around $1.0692, ahead of a deeper structural floor near $0.9862, where buyers previously emerged.
Looking up, initial resistance is defined by the downward trendline reference near $1.2259, followed by the 50-day EMA at $1.2945 and the 200-day EMA at $1.3656.
Cardano technical analysis: ADA wanes
Cardano trades at $0.1787, holding above its $0.1712 support floor after last week's 9% decline. From a technical perspective, the steady decline in ADA over the last five weeks takes a mild breather at a near-term support after breaking below a long-term support trendline around $0.2058. A slip below the $0.1712 immediate support could expose ADA to a more important base at $0.1537, with $0.1385 underpinning the broader bearish structure.
On the topside, initial resistance emerges at $87.46, ahead of the former trendline support, now turned resistance, around $90.62, with a more significant cap at the horizontal barrier near $95.82.
In addition, ADA holds both the 50-day EMA at $0.2081 and the 200-day EMA below at $0.2321, which now acts as resistance. Meanwhile, momentum remains fragile, with the RSI hovering near 33, just above oversold territory, and the MACD negative and below its signal line.
On the flip side, initial resistance is seen at $0.1894, with the former trendline floor at $0.2058 and the 50-day EMA at $0.2081.
Technical outlook: Death Cross looms over Solana
Solana hovers around $86.14, maintaining a medium-term declining trend since early October. SOL trades below both the 50-day and 200-day EMAs, now clustered around $99–$100, with overhead resistance and a risk of a bearish crossover.
The recent break beneath the rising trendline near $90.62 reinforces a corrective phase. SOL's path of least resistance suggests a steeper correction toward the $77.60 support floor.
The RSI hovering around 27 signals oversold conditions but not yet a confirmed rebound, and the MACD remains below the zero line, hinting at persistent downside pressure.
On the topside, initial resistance emerges at $87.46, ahead of the former trendline support, now turned resistance, around $90.62, with a more significant cap at the horizontal barrier near $95.82.
#TheBillionaireTrades #TheBillionaireTradesMarketInsights
{spot}(XRPUSDT)
{spot}(SOLUSDT)
{spot}(ADAUSDT)
Top Altcoins Price Forecast: Ripple, Cardano, and Solana remain vulnerable to further losses
Ripple holds steady above its $1.00 psychological support on Tuesday, after five consecutive days of decline.
Cardano hovers above $0.1700 with buyers defending the $0.1712 support level in focus.
Solana continues its downtrend after breaking below a long-term support trendline.
Ripple $XRP , Cardano $ADA , and Solana $SOL struggle to find their footing after last week’s decline amid a decline in institutional investors’ risk appetite. Ripple is close to testing its $1.00 psychological threshold, Cardano is putting a crucial horizontal level to the test, while Solana remains at risk of extending its downtrend after breaking a crucial support trendline.
Market sentiment is weak as ceasefire talks between the US and Iran struggle to advance, while the odds of a truce have increased following Democrats’ majority in the US midterms. CoinMarketCap’s Fear and Greed Index is down to 28 on Tuesday, from 35 last week, suggesting a rise in risk-off sentiment among investors.
XRP and SOL ETFs face outflows while Cardano regains retail support
Ripple- and Solana-focused Exchange-Traded Funds (ETFs) face intense selling pressure. SoSoValue data shows that XRP ETFs recorded their largest daily outflow in eight months, at $10.42 million on Monday, while eight US SOL spot ETFs recorded $7.68 million in withdrawals, except for the 21shares TSOL, for which the numbers are still in the air.
Meanwhile, Cardano shows signs of renewed demand in the derivatives market. CoinGlass data shows the ADA taker buy-to-sell ratio rising to 1.06, from 0.86 the previous day, indicating renewed buying pressure as traders are now aggressively crossing the spread and consuming liquidity faster than sellers.
Taken together, Cardano shows signs of near-term resilience, while Ripple and Solana could be exposed to deeper corrections.
Meanwhile, Cardano shows signs of renewed demand in the derivatives market. CoinGlass data shows the ADA taker buy-to-sell ratio rising to 1.06, from 0.86 the previous day, indicating renewed buying pressure as traders are now aggressively crossing the spread and consuming liquidity faster than sellers.
Taken together, Cardano shows signs of near-term resilience, while Ripple and Solana could be exposed to deeper corrections.
Technical analysis: Ripple risks breaking below $1
XRP trades at $1.0977 at press time on Tuesday, maintaining a bearish near-term tone. The cross-border remittance token holds well below the 50-day Exponential Moving Average (EMA) at $1.2945 and the 200-day EMA at $1.3656.
Momentum is weak, with the Relative Strength Index (RSI) hovering near oversold territory at 26 and the Moving Average Convergence Divergence (MACD) in negative territory, both of which suggest that selling pressure remains dominant.
horizontal level around $1.0692, ahead of a deeper structural floor near $0.9862, where buyers previously emerged.
The immediate support is seen at the horizontal level around $1.0692, ahead of a deeper structural floor near $0.9862, where buyers previously emerged.
Looking up, initial resistance is defined by the downward trendline reference near $1.2259, followed by the 50-day EMA at $1.2945 and the 200-day EMA at $1.3656.
Cardano technical analysis: ADA wanes
Cardano trades at $0.1787, holding above its $0.1712 support floor after last week's 9% decline. From a technical perspective, the steady decline in ADA over the last five weeks takes a mild breather at a near-term support after breaking below a long-term support trendline around $0.2058. A slip below the $0.1712 immediate support could expose ADA to a more important base at $0.1537, with $0.1385 underpinning the broader bearish structure.
On the topside, initial resistance emerges at $87.46, ahead of the former trendline support, now turned resistance, around $90.62, with a more significant cap at the horizontal barrier near $95.82.
In addition, ADA holds both the 50-day EMA at $0.2081 and the 200-day EMA below at $0.2321, which now acts as resistance. Meanwhile, momentum remains fragile, with the RSI hovering near 33, just above oversold territory, and the MACD negative and below its signal line.
On the flip side, initial resistance is seen at $0.1894, with the former trendline floor at $0.2058 and the 50-day EMA at $0.2081.
Technical outlook: Death Cross looms over Solana
Solana hovers around $86.14, maintaining a medium-term declining trend since early October. SOL trades below both the 50-day and 200-day EMAs, now clustered around $99–$100, with overhead resistance and a risk of a bearish crossover.
The recent break beneath the rising trendline near $90.62 reinforces a corrective phase. SOL's path of least resistance suggests a steeper correction toward the $77.60 support floor.
The RSI hovering around 27 signals oversold conditions but not yet a confirmed rebound, and the MACD remains below the zero line, hinting at persistent downside pressure.
On the topside, initial resistance emerges at $87.46, ahead of the former trendline support, now turned resistance, around $90.62, with a more significant cap at the horizontal barrier near $95.82.
#TheBillionaireTrades #TheBillionaireTradesMarketInsights
Cardano hovers above $0.1700 with buyers defending the $0.1712 support level in focus.
Solana continues its downtrend after breaking below a long-term support trendline.
Ripple $XRP , Cardano $ADA , and Solana $SOL struggle to find their footing after last week’s decline amid a decline in institutional investors’ risk appetite. Ripple is close to testing its $1.00 psychological threshold, Cardano is putting a crucial horizontal level to the test, while Solana remains at risk of extending its downtrend after breaking a crucial support trendline.
Market sentiment is weak as ceasefire talks between the US and Iran struggle to advance, while the odds of a truce have increased following Democrats’ majority in the US midterms. CoinMarketCap’s Fear and Greed Index is down to 28 on Tuesday, from 35 last week, suggesting a rise in risk-off sentiment among investors.
XRP and SOL ETFs face outflows while Cardano regains retail support
Ripple- and Solana-focused Exchange-Traded Funds (ETFs) face intense selling pressure. SoSoValue data shows that XRP ETFs recorded their largest daily outflow in eight months, at $10.42 million on Monday, while eight US SOL spot ETFs recorded $7.68 million in withdrawals, except for the 21shares TSOL, for which the numbers are still in the air.
Meanwhile, Cardano shows signs of renewed demand in the derivatives market. CoinGlass data shows the ADA taker buy-to-sell ratio rising to 1.06, from 0.86 the previous day, indicating renewed buying pressure as traders are now aggressively crossing the spread and consuming liquidity faster than sellers.
Taken together, Cardano shows signs of near-term resilience, while Ripple and Solana could be exposed to deeper corrections.
Meanwhile, Cardano shows signs of renewed demand in the derivatives market. CoinGlass data shows the ADA taker buy-to-sell ratio rising to 1.06, from 0.86 the previous day, indicating renewed buying pressure as traders are now aggressively crossing the spread and consuming liquidity faster than sellers.
Taken together, Cardano shows signs of near-term resilience, while Ripple and Solana could be exposed to deeper corrections.
Technical analysis: Ripple risks breaking below $1
XRP trades at $1.0977 at press time on Tuesday, maintaining a bearish near-term tone. The cross-border remittance token holds well below the 50-day Exponential Moving Average (EMA) at $1.2945 and the 200-day EMA at $1.3656.
Momentum is weak, with the Relative Strength Index (RSI) hovering near oversold territory at 26 and the Moving Average Convergence Divergence (MACD) in negative territory, both of which suggest that selling pressure remains dominant.
horizontal level around $1.0692, ahead of a deeper structural floor near $0.9862, where buyers previously emerged.
The immediate support is seen at the horizontal level around $1.0692, ahead of a deeper structural floor near $0.9862, where buyers previously emerged.
Looking up, initial resistance is defined by the downward trendline reference near $1.2259, followed by the 50-day EMA at $1.2945 and the 200-day EMA at $1.3656.
Cardano technical analysis: ADA wanes
Cardano trades at $0.1787, holding above its $0.1712 support floor after last week's 9% decline. From a technical perspective, the steady decline in ADA over the last five weeks takes a mild breather at a near-term support after breaking below a long-term support trendline around $0.2058. A slip below the $0.1712 immediate support could expose ADA to a more important base at $0.1537, with $0.1385 underpinning the broader bearish structure.
On the topside, initial resistance emerges at $87.46, ahead of the former trendline support, now turned resistance, around $90.62, with a more significant cap at the horizontal barrier near $95.82.
In addition, ADA holds both the 50-day EMA at $0.2081 and the 200-day EMA below at $0.2321, which now acts as resistance. Meanwhile, momentum remains fragile, with the RSI hovering near 33, just above oversold territory, and the MACD negative and below its signal line.
On the flip side, initial resistance is seen at $0.1894, with the former trendline floor at $0.2058 and the 50-day EMA at $0.2081.
Technical outlook: Death Cross looms over Solana
Solana hovers around $86.14, maintaining a medium-term declining trend since early October. SOL trades below both the 50-day and 200-day EMAs, now clustered around $99–$100, with overhead resistance and a risk of a bearish crossover.
The recent break beneath the rising trendline near $90.62 reinforces a corrective phase. SOL's path of least resistance suggests a steeper correction toward the $77.60 support floor.
The RSI hovering around 27 signals oversold conditions but not yet a confirmed rebound, and the MACD remains below the zero line, hinting at persistent downside pressure.
On the topside, initial resistance emerges at $87.46, ahead of the former trendline support, now turned resistance, around $90.62, with a more significant cap at the horizontal barrier near $95.82.
#TheBillionaireTrades #TheBillionaireTradesMarketInsights
256

Article
Nvidia’s Sell-Off Is Accelerating. What’s Next for the Stock?Shares of the chip giant finished Tuesday down 5.5%, falling for a second day this week to levels last seen in the spring. As of Tuesday’s close of $168.47 recent prices around $168, they’re off about 10% since Friday’s close, with investors digesting news that CEO Jensen Huang is under investigation for reported connections to a Chinese spy and working through broader bearishness sparked in part by fresh rate-hike worries.
The latest move has the stock off some 18% this month. What’s next for Huang—and Nvidia (NVDA)—remains a moving target.
President Donald Trump yesterday said the FBI was looking into the affair, adding that he had spoken with Huang since the allegations were first reported.
On prediction markets, traders seem to think he’s safe for now, though the perceived odds of him departing have moved slightly higher since yesterday on Kalshi.
That may leave investors in an uncertain position for some time. Bank of America analysts yesterday referred to the latest events as an “overhang, not yet an earnings event.” The analysts suggested three scenarios, listing “ 1) containment, with leadership continuity and no material findings allowing fundamentals to regain focus; 2) prolonged uncertainty, pressuring valuation before earnings; 3) escalation, with adverse findings, leadership disruption or tighter restrictions requiring earnings reassessment.”
Some market participants used yesterday’s action to build stakes. Ark Investment Management funds, including the Ark Innovation ETF (ARKK), together bought more than 90,000 shares on Monday, according to trade disclosures.
Nvidia is set to report its latest results next week.
#TheBillionaireTrades
#TheBillionaireTradesMarketInsights
{spot}(NVDABUSDT)
Nvidia’s Sell-Off Is Accelerating. What’s Next for the Stock?
Shares of the chip giant finished Tuesday down 5.5%, falling for a second day this week to levels last seen in the spring. As of Tuesday’s close of $168.47 recent prices around $168, they’re off about 10% since Friday’s close, with investors digesting news that CEO Jensen Huang is under investigation for reported connections to a Chinese spy and working through broader bearishness sparked in part by fresh rate-hike worries.
The latest move has the stock off some 18% this month. What’s next for Huang—and Nvidia (NVDA)—remains a moving target.
President Donald Trump yesterday said the FBI was looking into the affair, adding that he had spoken with Huang since the allegations were first reported.
On prediction markets, traders seem to think he’s safe for now, though the perceived odds of him departing have moved slightly higher since yesterday on Kalshi.
That may leave investors in an uncertain position for some time. Bank of America analysts yesterday referred to the latest events as an “overhang, not yet an earnings event.” The analysts suggested three scenarios, listing “ 1) containment, with leadership continuity and no material findings allowing fundamentals to regain focus; 2) prolonged uncertainty, pressuring valuation before earnings; 3) escalation, with adverse findings, leadership disruption or tighter restrictions requiring earnings reassessment.”
Some market participants used yesterday’s action to build stakes. Ark Investment Management funds, including the Ark Innovation ETF (ARKK), together bought more than 90,000 shares on Monday, according to trade disclosures.
Nvidia is set to report its latest results next week.
#TheBillionaireTrades
#TheBillionaireTradesMarketInsights
The latest move has the stock off some 18% this month. What’s next for Huang—and Nvidia (NVDA)—remains a moving target.
President Donald Trump yesterday said the FBI was looking into the affair, adding that he had spoken with Huang since the allegations were first reported.
On prediction markets, traders seem to think he’s safe for now, though the perceived odds of him departing have moved slightly higher since yesterday on Kalshi.
That may leave investors in an uncertain position for some time. Bank of America analysts yesterday referred to the latest events as an “overhang, not yet an earnings event.” The analysts suggested three scenarios, listing “ 1) containment, with leadership continuity and no material findings allowing fundamentals to regain focus; 2) prolonged uncertainty, pressuring valuation before earnings; 3) escalation, with adverse findings, leadership disruption or tighter restrictions requiring earnings reassessment.”
Some market participants used yesterday’s action to build stakes. Ark Investment Management funds, including the Ark Innovation ETF (ARKK), together bought more than 90,000 shares on Monday, according to trade disclosures.
Nvidia is set to report its latest results next week.
#TheBillionaireTrades
#TheBillionaireTradesMarketInsights
NVDAB+0.56%
ARKKETF-0.91%
113
Billions Network $BILL is displaying a Strong Sell overall technical rating across daily and weekly timeframes, driven by steep multi-month downtrends and heavy supply concentration.
Current Price & Market Snapshot
• Current Price: ~$0.0045 – $0.0055 USD
• All-Time High (May 2026): $0.23 – $0.24 USD (down over 96% from peak)
• Market Capitalization: ~$13.26M USD (#555 rank)
• Fully Diluted Valuation (FDV): ~$42.5M – $54.7M USD
• Circulating Supply: ~2 Billion / 10 Billion total tokens (24.2%)
Key Technical & Fundamental Risks
• Supply Concentration: On-chain metrics reveal that the core team and top 10 wallets control roughly 94% to 97% of the total 10 billion token supply.
• Sell-Side Pressure: Low circulating float (24.2%) paired with upcoming token unlocks creates persistent downward distribution and thin liquidity.
• Key Levels to Watch:
• Support: Immediate downside risk tests levels below $0.0045 if selling persists.
• Resistance: A reclaim and daily close above $0.0050 – $0.0051 is required to signal initial short-term stabilization.
#TheBillionaireTrades
{future}(BILLUSDT)
Billions Network $BILL is displaying a Strong Sell overall technical rating across daily and weekly timeframes, driven by steep multi-month downtrends and heavy supply concentration.
Current Price & Market Snapshot
• Current Price: ~$0.0045 – $0.0055 USD
• All-Time High (May 2026): $0.23 – $0.24 USD (down over 96% from peak)
• Market Capitalization: ~$13.26M USD (#555 rank)
• Fully Diluted Valuation (FDV): ~$42.5M – $54.7M USD
• Circulating Supply: ~2 Billion / 10 Billion total tokens (24.2%)
Key Technical & Fundamental Risks
• Supply Concentration: On-chain metrics reveal that the core team and top 10 wallets control roughly 94% to 97% of the total 10 billion token supply.
• Sell-Side Pressure: Low circulating float (24.2%) paired with upcoming token unlocks creates persistent downward distribution and thin liquidity.
• Key Levels to Watch:
• Support: Immediate downside risk tests levels below $0.0045 if selling persists.
• Resistance: A reclaim and daily close above $0.0050 – $0.0051 is required to signal initial short-term stabilization.
#TheBillionaireTrades
Current Price & Market Snapshot
• Current Price: ~$0.0045 – $0.0055 USD
• All-Time High (May 2026): $0.23 – $0.24 USD (down over 96% from peak)
• Market Capitalization: ~$13.26M USD (#555 rank)
• Fully Diluted Valuation (FDV): ~$42.5M – $54.7M USD
• Circulating Supply: ~2 Billion / 10 Billion total tokens (24.2%)
Key Technical & Fundamental Risks
• Supply Concentration: On-chain metrics reveal that the core team and top 10 wallets control roughly 94% to 97% of the total 10 billion token supply.
• Sell-Side Pressure: Low circulating float (24.2%) paired with upcoming token unlocks creates persistent downward distribution and thin liquidity.
• Key Levels to Watch:
• Support: Immediate downside risk tests levels below $0.0045 if selling persists.
• Resistance: A reclaim and daily close above $0.0050 – $0.0051 is required to signal initial short-term stabilization.
#TheBillionaireTrades
568
The live price of Billions Network $BILL / BILLIONSN is approximately $0.0043 to $0.0059 USD, reflecting a downward trend over the past 24 hours.
News & Market Analysis
• Downward Momentum: Billions Network has experienced significant multi-week and monthly pullbacks, declining roughly 48% to 52% over the past month and down over 75% across the last 3 months.
• Technical Outlook: Overall technical indicators, oscillators, and moving averages lean neutral to bearish in the short term as the token consolidates after its earlier 2026 highs.
• Ecosystem Role: Billions Network operates as a mobile-first universal Human and AI network utilizing zero-knowledge proofs for privacy-preserving human verification and AI agent validation, trading across major centralized and decentralized exchanges.
#TheBillionaireTrades
{future}(BILLUSDT)
The live price of Billions Network $BILL / BILLIONSN is approximately $0.0043 to $0.0059 USD, reflecting a downward trend over the past 24 hours.
News & Market Analysis
• Downward Momentum: Billions Network has experienced significant multi-week and monthly pullbacks, declining roughly 48% to 52% over the past month and down over 75% across the last 3 months.
• Technical Outlook: Overall technical indicators, oscillators, and moving averages lean neutral to bearish in the short term as the token consolidates after its earlier 2026 highs.
• Ecosystem Role: Billions Network operates as a mobile-first universal Human and AI network utilizing zero-knowledge proofs for privacy-preserving human verification and AI agent validation, trading across major centralized and decentralized exchanges.
#TheBillionaireTrades
News & Market Analysis
• Downward Momentum: Billions Network has experienced significant multi-week and monthly pullbacks, declining roughly 48% to 52% over the past month and down over 75% across the last 3 months.
• Technical Outlook: Overall technical indicators, oscillators, and moving averages lean neutral to bearish in the short term as the token consolidates after its earlier 2026 highs.
• Ecosystem Role: Billions Network operates as a mobile-first universal Human and AI network utilizing zero-knowledge proofs for privacy-preserving human verification and AI agent validation, trading across major centralized and decentralized exchanges.
#TheBillionaireTrades
390

Article
Vitalik Buterin says ETH should be valued as a store of value, not a fee-burning tokenThe Ethereum co-founder said the case for valuing $ETH as a fee-burning token "never was as strong as it seemed" and that maximizing fees would force Ethereum to operate like a major corporation.
Ethereum co-founder Vitalik Buterin said he believes ether
EthereumETH+0.23% should be treated primarily as a store of value, arguing that the case for valuing it as a fee-burning token was weaker than it appeared during the last market cycle.
In an X thread on Sunday morning, Buterin said "ETH as store of value" makes "much more sense to focus on" than "ETH as fee-burning token." He said EIP-1559, the 2021 upgrade that burns part of every transaction fee, "is fine and good," and the network should keep the mechanism and its burn, even if the burn only partially offsets the issuance of new ETH. "But we should not feel sad if fee burn is < 10% of breakeven indefinitely; the value of ETH comes from elsewhere," he wrote.
Buterin argued instead that the main thing users appreciate about Ethereum is its decentralization and efforts toward censorship resistance, privacy, and security, and that the network's main practical benefit to the financial ecosystem is its stability. "In the era of AI disruption, stability will be highly valued," he wrote.
The burn 'floor'
The fee burn was the basis of the "ultrasound money" thesis that gained traction among ETH holders during the 2021 bull market. Buterin, in his thread, laid out the valuation model behind fee-burning tokens, in which a token's market cap would equal the annual burn divided by a discount rate. Under that model, a token burning $1 billion a year at a 4% discount rate would have a natural valuation floor of $25 billion, he wrote.
"But here's the problem: this was never a true floor," Buterin wrote. He said most of the ETH burned in 2021 through 2023 came from "crypto-internal use cases" whose revenue would have fallen alongside ETH's price, citing the network "randomly [going] crazy" for a "digital monkey sale" that burned $180 million in fees in a single day. "The floor argument only works if the backing of the revenue stream is external," he wrote.
(Actually, the sale Buterin referenced was for digital land in the Otherside metaverse from Yuga Labs, the creators of the Bored Ape Yacht Club NFT collection. The sale saw users paying up to $10,000 in transaction fees for Otherdeed NFTs that currently sell for around $150.)
Buterin said Ethereum now has a "better claim to this external backing" because of the growing market for tokenized real-world assets. But as a "normal stable mature business," that activity is unlikely to produce the same fee spikes, he added.
The amount of ETH burned each day has fallen sharply since then, according to The Block's data. Ethereum burned about 1.48 million ETH in 2022, worth roughly $3.6 billion, compared with about 19,200 ETH, or $43 million, so far this year.
The corporate comparison
Buterin said that justifying ETH's market cap, which he put at about $270 billion, through fee burn alone would make Ethereum comparable to a company like L'Oreal. Ether's market cap stood at $273.3 billion on Sunday morning, according to The Block's ETH price page.
Companies of that size spend heavily to keep their positions, Buterin wrote. Citing an AI estimate that L’Oreal spends about 0.58% of its market cap on research and development each year, he said matching that rate would “bankrupt the [Ethereum Foundation] almost immediately,” so it would instead require in-protocol funding of about 700,000 ETH a year, cutting validator revenue by two-thirds.
What Buterin left unstated: the level of funding received by the Ethereum Foundation (EF) is already somewhat controversial in the crypto community.
The EF's ETH sales have regularly drawn criticism from holders, including after it sold 20,000 ETH worth about $47 million to Bitmine over two weeks in April and May. Buterin said in May that he regularly hears from community members who feel the EF's actions don't match its public commitments.
The EF began staking part of its treasury earlier this year to generate yield, and in March it published a mandate describing itself as "one of many stewards" of the network. Amid a wave of senior staff departures in May, Buterin said the foundation would become "a smaller ship" that sells less ETH and focuses on work that "would not happen otherwise."
Buterin also said that an Ethereum optimizing for token burn would need "highly interventionist governance, for the long term," and that neither requirement is compatible with his goals for the network of capture resistance and decentralization. Buterin added that optimizing for fee burn means optimizing for higher gas prices to some degree, which "may price out users, including some users who may need privacy and security the most."
Survival as a metric
Buterin said that when he asks people what they value most about Ethereum, they most often cite decentralization and what he calls CROPS (censorship and capture resistance, open source, privacy and security). For an investor holding ETH as a store of value (SoV), "the first and most important SoV-ish metric" is "to survive," he wrote.
He tied that goal to themes from the most recent of the network's developer conferences, including post-quantum security, partial ossification of the base layer and a high bar for adding new precompiles or in-protocol rewards. Buterin listed work on multisig wallets, the Kohaku privacy project, the FOCIL censorship-resistance proposal and lightweight nodes as examples, noting that he runs a node on his laptop that synced in under six hours and takes up "only 1/8 of my hard drive."
Buterin said growth in assets issued natively on Ethereum's base layer, including real-world assets, is "highly synergistic" with the store-of-value case because it expands what holders can do with ETH, such as using it as collateral.
Buterin views Ethereum as "really not just a blockchain anymore," but rather "a hybrid architecture that combines together blockchains and modern cryptography." In September, he mapped out Ethereum's roadmap through 2030 and said the upcoming Hegota upgrade is likely to be the network's last "normal" fork.
Industry reactions
Buterin's post garnered support from other influential figures in crypto. Solana co-founder Anatoly Yakovenko said Buterin "is absolutely right that you can't focus on fees as the product." Attorney Gabriel Shapiro of MetaLeX called the thread "a 'nature is healing' moment," while Moonrock Capital founder Simon Dedic argued that ETH as a store of value would be "the biggest bull case for Ethereum. And at the same time the easiest story to sell to institutional capital."
The thread comes about five weeks after the co-authors of controversial proposal EIP-8363 withdrew it from consideration for the network's forthcoming Hegota upgrade, which will follow the behind-schedule Glamsterdam hard fork. The proposal, which would have burned a rising share of validator rewards as more ETH is staked, cited the risk a high staking ratio poses to "ETH's role as money" and drew opposition from SharpLink CEO Joseph Chalom and Aave founder Stani Kulechov. Its authors plan to hold a separate issuance process that runs through EthCC in April.
ETH traded at $2,236 as of 9:23 a.m. ET, down 0.3% on the day, according to The Block's price page.
#TheBillionaireTrades #TheBillionaireTradesMarketInsights
{spot}(ETHUSDT)
Vitalik Buterin says ETH should be valued as a store of value, not a fee-burning token
The Ethereum co-founder said the case for valuing $ETH as a fee-burning token "never was as strong as it seemed" and that maximizing fees would force Ethereum to operate like a major corporation.
Ethereum co-founder Vitalik Buterin said he believes ether
EthereumETH+0.23% should be treated primarily as a store of value, arguing that the case for valuing it as a fee-burning token was weaker than it appeared during the last market cycle.
In an X thread on Sunday morning, Buterin said "ETH as store of value" makes "much more sense to focus on" than "ETH as fee-burning token." He said EIP-1559, the 2021 upgrade that burns part of every transaction fee, "is fine and good," and the network should keep the mechanism and its burn, even if the burn only partially offsets the issuance of new ETH. "But we should not feel sad if fee burn is < 10% of breakeven indefinitely; the value of ETH comes from elsewhere," he wrote.
Buterin argued instead that the main thing users appreciate about Ethereum is its decentralization and efforts toward censorship resistance, privacy, and security, and that the network's main practical benefit to the financial ecosystem is its stability. "In the era of AI disruption, stability will be highly valued," he wrote.
The burn 'floor'
The fee burn was the basis of the "ultrasound money" thesis that gained traction among ETH holders during the 2021 bull market. Buterin, in his thread, laid out the valuation model behind fee-burning tokens, in which a token's market cap would equal the annual burn divided by a discount rate. Under that model, a token burning $1 billion a year at a 4% discount rate would have a natural valuation floor of $25 billion, he wrote.
"But here's the problem: this was never a true floor," Buterin wrote. He said most of the ETH burned in 2021 through 2023 came from "crypto-internal use cases" whose revenue would have fallen alongside ETH's price, citing the network "randomly [going] crazy" for a "digital monkey sale" that burned $180 million in fees in a single day. "The floor argument only works if the backing of the revenue stream is external," he wrote.
(Actually, the sale Buterin referenced was for digital land in the Otherside metaverse from Yuga Labs, the creators of the Bored Ape Yacht Club NFT collection. The sale saw users paying up to $10,000 in transaction fees for Otherdeed NFTs that currently sell for around $150.)
Buterin said Ethereum now has a "better claim to this external backing" because of the growing market for tokenized real-world assets. But as a "normal stable mature business," that activity is unlikely to produce the same fee spikes, he added.
The amount of ETH burned each day has fallen sharply since then, according to The Block's data. Ethereum burned about 1.48 million ETH in 2022, worth roughly $3.6 billion, compared with about 19,200 ETH, or $43 million, so far this year.
The corporate comparison
Buterin said that justifying ETH's market cap, which he put at about $270 billion, through fee burn alone would make Ethereum comparable to a company like L'Oreal. Ether's market cap stood at $273.3 billion on Sunday morning, according to The Block's ETH price page.
Companies of that size spend heavily to keep their positions, Buterin wrote. Citing an AI estimate that L’Oreal spends about 0.58% of its market cap on research and development each year, he said matching that rate would “bankrupt the [Ethereum Foundation] almost immediately,” so it would instead require in-protocol funding of about 700,000 ETH a year, cutting validator revenue by two-thirds.
What Buterin left unstated: the level of funding received by the Ethereum Foundation (EF) is already somewhat controversial in the crypto community.
The EF's ETH sales have regularly drawn criticism from holders, including after it sold 20,000 ETH worth about $47 million to Bitmine over two weeks in April and May. Buterin said in May that he regularly hears from community members who feel the EF's actions don't match its public commitments.
The EF began staking part of its treasury earlier this year to generate yield, and in March it published a mandate describing itself as "one of many stewards" of the network. Amid a wave of senior staff departures in May, Buterin said the foundation would become "a smaller ship" that sells less ETH and focuses on work that "would not happen otherwise."
Buterin also said that an Ethereum optimizing for token burn would need "highly interventionist governance, for the long term," and that neither requirement is compatible with his goals for the network of capture resistance and decentralization. Buterin added that optimizing for fee burn means optimizing for higher gas prices to some degree, which "may price out users, including some users who may need privacy and security the most."
Survival as a metric
Buterin said that when he asks people what they value most about Ethereum, they most often cite decentralization and what he calls CROPS (censorship and capture resistance, open source, privacy and security). For an investor holding ETH as a store of value (SoV), "the first and most important SoV-ish metric" is "to survive," he wrote.
He tied that goal to themes from the most recent of the network's developer conferences, including post-quantum security, partial ossification of the base layer and a high bar for adding new precompiles or in-protocol rewards. Buterin listed work on multisig wallets, the Kohaku privacy project, the FOCIL censorship-resistance proposal and lightweight nodes as examples, noting that he runs a node on his laptop that synced in under six hours and takes up "only 1/8 of my hard drive."
Buterin said growth in assets issued natively on Ethereum's base layer, including real-world assets, is "highly synergistic" with the store-of-value case because it expands what holders can do with ETH, such as using it as collateral.
Buterin views Ethereum as "really not just a blockchain anymore," but rather "a hybrid architecture that combines together blockchains and modern cryptography." In September, he mapped out Ethereum's roadmap through 2030 and said the upcoming Hegota upgrade is likely to be the network's last "normal" fork.
Industry reactions
Buterin's post garnered support from other influential figures in crypto. Solana co-founder Anatoly Yakovenko said Buterin "is absolutely right that you can't focus on fees as the product." Attorney Gabriel Shapiro of MetaLeX called the thread "a 'nature is healing' moment," while Moonrock Capital founder Simon Dedic argued that ETH as a store of value would be "the biggest bull case for Ethereum. And at the same time the easiest story to sell to institutional capital."
The thread comes about five weeks after the co-authors of controversial proposal EIP-8363 withdrew it from consideration for the network's forthcoming Hegota upgrade, which will follow the behind-schedule Glamsterdam hard fork. The proposal, which would have burned a rising share of validator rewards as more ETH is staked, cited the risk a high staking ratio poses to "ETH's role as money" and drew opposition from SharpLink CEO Joseph Chalom and Aave founder Stani Kulechov. Its authors plan to hold a separate issuance process that runs through EthCC in April.
ETH traded at $2,236 as of 9:23 a.m. ET, down 0.3% on the day, according to The Block's price page.
#TheBillionaireTrades #TheBillionaireTradesMarketInsights
Ethereum co-founder Vitalik Buterin said he believes ether
EthereumETH+0.23% should be treated primarily as a store of value, arguing that the case for valuing it as a fee-burning token was weaker than it appeared during the last market cycle.
In an X thread on Sunday morning, Buterin said "ETH as store of value" makes "much more sense to focus on" than "ETH as fee-burning token." He said EIP-1559, the 2021 upgrade that burns part of every transaction fee, "is fine and good," and the network should keep the mechanism and its burn, even if the burn only partially offsets the issuance of new ETH. "But we should not feel sad if fee burn is < 10% of breakeven indefinitely; the value of ETH comes from elsewhere," he wrote.
Buterin argued instead that the main thing users appreciate about Ethereum is its decentralization and efforts toward censorship resistance, privacy, and security, and that the network's main practical benefit to the financial ecosystem is its stability. "In the era of AI disruption, stability will be highly valued," he wrote.
The burn 'floor'
The fee burn was the basis of the "ultrasound money" thesis that gained traction among ETH holders during the 2021 bull market. Buterin, in his thread, laid out the valuation model behind fee-burning tokens, in which a token's market cap would equal the annual burn divided by a discount rate. Under that model, a token burning $1 billion a year at a 4% discount rate would have a natural valuation floor of $25 billion, he wrote.
"But here's the problem: this was never a true floor," Buterin wrote. He said most of the ETH burned in 2021 through 2023 came from "crypto-internal use cases" whose revenue would have fallen alongside ETH's price, citing the network "randomly [going] crazy" for a "digital monkey sale" that burned $180 million in fees in a single day. "The floor argument only works if the backing of the revenue stream is external," he wrote.
(Actually, the sale Buterin referenced was for digital land in the Otherside metaverse from Yuga Labs, the creators of the Bored Ape Yacht Club NFT collection. The sale saw users paying up to $10,000 in transaction fees for Otherdeed NFTs that currently sell for around $150.)
Buterin said Ethereum now has a "better claim to this external backing" because of the growing market for tokenized real-world assets. But as a "normal stable mature business," that activity is unlikely to produce the same fee spikes, he added.
The amount of ETH burned each day has fallen sharply since then, according to The Block's data. Ethereum burned about 1.48 million ETH in 2022, worth roughly $3.6 billion, compared with about 19,200 ETH, or $43 million, so far this year.
The corporate comparison
Buterin said that justifying ETH's market cap, which he put at about $270 billion, through fee burn alone would make Ethereum comparable to a company like L'Oreal. Ether's market cap stood at $273.3 billion on Sunday morning, according to The Block's ETH price page.
Companies of that size spend heavily to keep their positions, Buterin wrote. Citing an AI estimate that L’Oreal spends about 0.58% of its market cap on research and development each year, he said matching that rate would “bankrupt the [Ethereum Foundation] almost immediately,” so it would instead require in-protocol funding of about 700,000 ETH a year, cutting validator revenue by two-thirds.
What Buterin left unstated: the level of funding received by the Ethereum Foundation (EF) is already somewhat controversial in the crypto community.
The EF's ETH sales have regularly drawn criticism from holders, including after it sold 20,000 ETH worth about $47 million to Bitmine over two weeks in April and May. Buterin said in May that he regularly hears from community members who feel the EF's actions don't match its public commitments.
The EF began staking part of its treasury earlier this year to generate yield, and in March it published a mandate describing itself as "one of many stewards" of the network. Amid a wave of senior staff departures in May, Buterin said the foundation would become "a smaller ship" that sells less ETH and focuses on work that "would not happen otherwise."
Buterin also said that an Ethereum optimizing for token burn would need "highly interventionist governance, for the long term," and that neither requirement is compatible with his goals for the network of capture resistance and decentralization. Buterin added that optimizing for fee burn means optimizing for higher gas prices to some degree, which "may price out users, including some users who may need privacy and security the most."
Survival as a metric
Buterin said that when he asks people what they value most about Ethereum, they most often cite decentralization and what he calls CROPS (censorship and capture resistance, open source, privacy and security). For an investor holding ETH as a store of value (SoV), "the first and most important SoV-ish metric" is "to survive," he wrote.
He tied that goal to themes from the most recent of the network's developer conferences, including post-quantum security, partial ossification of the base layer and a high bar for adding new precompiles or in-protocol rewards. Buterin listed work on multisig wallets, the Kohaku privacy project, the FOCIL censorship-resistance proposal and lightweight nodes as examples, noting that he runs a node on his laptop that synced in under six hours and takes up "only 1/8 of my hard drive."
Buterin said growth in assets issued natively on Ethereum's base layer, including real-world assets, is "highly synergistic" with the store-of-value case because it expands what holders can do with ETH, such as using it as collateral.
Buterin views Ethereum as "really not just a blockchain anymore," but rather "a hybrid architecture that combines together blockchains and modern cryptography." In September, he mapped out Ethereum's roadmap through 2030 and said the upcoming Hegota upgrade is likely to be the network's last "normal" fork.
Industry reactions
Buterin's post garnered support from other influential figures in crypto. Solana co-founder Anatoly Yakovenko said Buterin "is absolutely right that you can't focus on fees as the product." Attorney Gabriel Shapiro of MetaLeX called the thread "a 'nature is healing' moment," while Moonrock Capital founder Simon Dedic argued that ETH as a store of value would be "the biggest bull case for Ethereum. And at the same time the easiest story to sell to institutional capital."
The thread comes about five weeks after the co-authors of controversial proposal EIP-8363 withdrew it from consideration for the network's forthcoming Hegota upgrade, which will follow the behind-schedule Glamsterdam hard fork. The proposal, which would have burned a rising share of validator rewards as more ETH is staked, cited the risk a high staking ratio poses to "ETH's role as money" and drew opposition from SharpLink CEO Joseph Chalom and Aave founder Stani Kulechov. Its authors plan to hold a separate issuance process that runs through EthCC in April.
ETH traded at $2,236 as of 9:23 a.m. ET, down 0.3% on the day, according to The Block's price page.
#TheBillionaireTrades #TheBillionaireTradesMarketInsights
54

Article
$1B liquidated from crypto market as Bitcoin, Ethereum dropCrypto traders who bet on higher prices just had a very expensive couple of days.
More than $1 billion in leveraged positions were liquidated as Bitcoin $BTC , Ethereum $ETH , $XRP , and Solana all fell below key price levels. A widely shared market post put the wipeout at $1 billion in just 10 minutes. Broader derivatives data showed over $1.05 billion liquidated in the 24 hours leading up to November 6, 2026.
The trigger wasn't a hack, a collapsed exchange, or a rogue tweet. It came from Wall Street, where a sharp selloff in US tech and AI stocks dragged crypto down with it.
Bitcoin hit an intraday low of $74,780.91 on November 6. That marked its weakest intraday level since August 21.
The world's largest crypto fell nearly 6% during the episode. Ethereum had it worse, sliding more than 7% to about $2,247.
XRP and Solana also broke below critical support levels.
Long positions accounted for approximately $930 million of the total, or 88.2%.
Bitcoin positions accounted for around $267 million in liquidations during the key session. Ethereum followed with approximately $167 million, and XRP and Solana added further losses on top.
Nearly 211,000 traders were hit by the liquidations. Most of the damage landed on major exchanges like Binance.
When a trader borrows to amplify a bet and the price moves against them, the exchange automatically closes the position once collateral runs thin. That forced closure is a liquidation.
The problem is that liquidating a long position means selling. That selling pushes prices lower, which triggers the next batch of liquidations, which means more selling.
That chain reaction is how a market can shed $1 billion in leveraged bets in a matter of minutes, as the viral post described.
The Nasdaq Composite fell 5.5% amid turmoil across AI and chip stocks. Escalating worries about the AI sector's growth prospects collided with uncertainty in the post-midterm election landscape.
Bitcoin ETFs added to the pressure. The selloff coincided with hefty outflows from the funds, giving prices another downward shove.
Sentiment followed price. The Fear & Greed Index, a popular gauge of crypto market mood, slipped into "fear" territory, resetting the bullish tone that had been building.
The most immediate takeaway is about leverage, not direction. A nearly 6% move in Bitcoin is unremarkable by crypto standards. The lopsided 88.2% share of long liquidations suggests the market was crowded on one side heading into the drop.
The bigger story for investors is correlation. Crypto's fate this week was decided largely by what happened to AI and chip stocks, not by anything happening on a blockchain.
#TheBillionaireTrades #TheBillionaireTradesMarketInsights
{spot}(BTCUSDT)
{spot}(ETHUSDT)
{spot}(XRPUSDT)
$1B liquidated from crypto market as Bitcoin, Ethereum drop
Crypto traders who bet on higher prices just had a very expensive couple of days.
More than $1 billion in leveraged positions were liquidated as Bitcoin $BTC , Ethereum $ETH , $XRP , and Solana all fell below key price levels. A widely shared market post put the wipeout at $1 billion in just 10 minutes. Broader derivatives data showed over $1.05 billion liquidated in the 24 hours leading up to November 6, 2026.
The trigger wasn't a hack, a collapsed exchange, or a rogue tweet. It came from Wall Street, where a sharp selloff in US tech and AI stocks dragged crypto down with it.
Bitcoin hit an intraday low of $74,780.91 on November 6. That marked its weakest intraday level since August 21.
The world's largest crypto fell nearly 6% during the episode. Ethereum had it worse, sliding more than 7% to about $2,247.
XRP and Solana also broke below critical support levels.
Long positions accounted for approximately $930 million of the total, or 88.2%.
Bitcoin positions accounted for around $267 million in liquidations during the key session. Ethereum followed with approximately $167 million, and XRP and Solana added further losses on top.
Nearly 211,000 traders were hit by the liquidations. Most of the damage landed on major exchanges like Binance.
When a trader borrows to amplify a bet and the price moves against them, the exchange automatically closes the position once collateral runs thin. That forced closure is a liquidation.
The problem is that liquidating a long position means selling. That selling pushes prices lower, which triggers the next batch of liquidations, which means more selling.
That chain reaction is how a market can shed $1 billion in leveraged bets in a matter of minutes, as the viral post described.
The Nasdaq Composite fell 5.5% amid turmoil across AI and chip stocks. Escalating worries about the AI sector's growth prospects collided with uncertainty in the post-midterm election landscape.
Bitcoin ETFs added to the pressure. The selloff coincided with hefty outflows from the funds, giving prices another downward shove.
Sentiment followed price. The Fear & Greed Index, a popular gauge of crypto market mood, slipped into "fear" territory, resetting the bullish tone that had been building.
The most immediate takeaway is about leverage, not direction. A nearly 6% move in Bitcoin is unremarkable by crypto standards. The lopsided 88.2% share of long liquidations suggests the market was crowded on one side heading into the drop.
The bigger story for investors is correlation. Crypto's fate this week was decided largely by what happened to AI and chip stocks, not by anything happening on a blockchain.
#TheBillionaireTrades #TheBillionaireTradesMarketInsights
More than $1 billion in leveraged positions were liquidated as Bitcoin $BTC , Ethereum $ETH , $XRP , and Solana all fell below key price levels. A widely shared market post put the wipeout at $1 billion in just 10 minutes. Broader derivatives data showed over $1.05 billion liquidated in the 24 hours leading up to November 6, 2026.
The trigger wasn't a hack, a collapsed exchange, or a rogue tweet. It came from Wall Street, where a sharp selloff in US tech and AI stocks dragged crypto down with it.
Bitcoin hit an intraday low of $74,780.91 on November 6. That marked its weakest intraday level since August 21.
The world's largest crypto fell nearly 6% during the episode. Ethereum had it worse, sliding more than 7% to about $2,247.
XRP and Solana also broke below critical support levels.
Long positions accounted for approximately $930 million of the total, or 88.2%.
Bitcoin positions accounted for around $267 million in liquidations during the key session. Ethereum followed with approximately $167 million, and XRP and Solana added further losses on top.
Nearly 211,000 traders were hit by the liquidations. Most of the damage landed on major exchanges like Binance.
When a trader borrows to amplify a bet and the price moves against them, the exchange automatically closes the position once collateral runs thin. That forced closure is a liquidation.
The problem is that liquidating a long position means selling. That selling pushes prices lower, which triggers the next batch of liquidations, which means more selling.
That chain reaction is how a market can shed $1 billion in leveraged bets in a matter of minutes, as the viral post described.
The Nasdaq Composite fell 5.5% amid turmoil across AI and chip stocks. Escalating worries about the AI sector's growth prospects collided with uncertainty in the post-midterm election landscape.
Bitcoin ETFs added to the pressure. The selloff coincided with hefty outflows from the funds, giving prices another downward shove.
Sentiment followed price. The Fear & Greed Index, a popular gauge of crypto market mood, slipped into "fear" territory, resetting the bullish tone that had been building.
The most immediate takeaway is about leverage, not direction. A nearly 6% move in Bitcoin is unremarkable by crypto standards. The lopsided 88.2% share of long liquidations suggests the market was crowded on one side heading into the drop.
The bigger story for investors is correlation. Crypto's fate this week was decided largely by what happened to AI and chip stocks, not by anything happening on a blockchain.
#TheBillionaireTrades #TheBillionaireTradesMarketInsights
85
Ripple rebounds on renewed buying pressure
Ripple trades at $1.3191 at press time on Thursday, extending gains for the third consecutive day. $XRP breaks above a near-term resistance trendline, connecting the September 23 and October 28 highs, around $1.2691.
The price remains capped in the near term below both the 50-period Exponential Moving Average (EMA) at $1.3357 and the 200-period EMA at $1.3580, keeping the broader tone bearish despite the latest bounce.
Momentum has improved on the daily chart, with the Moving Average Convergence Divergence (MACD) crossing above its signal line and the Relative Strength Index (RSI) hovering around the neutral 50 level, hinting at rebuilding buying interest but not yet enough to shift the trend.
Initial resistance for XRP is at the 50-period EMA at $1.3357; a break there would expose the more significant barrier at the 200-period EMA at $1.3579.
On the flip side, immediate support aligns with the former downward resistance trendline, now turned into support around the $1.2691 region, while deeper cushions sit at the $1.0000 psychological threshold if selling pressure resumes.
#TheBillionaireTrades
{spot}(XRPUSDT)
Ripple rebounds on renewed buying pressure
Ripple trades at $1.3191 at press time on Thursday, extending gains for the third consecutive day. $XRP breaks above a near-term resistance trendline, connecting the September 23 and October 28 highs, around $1.2691.
The price remains capped in the near term below both the 50-period Exponential Moving Average (EMA) at $1.3357 and the 200-period EMA at $1.3580, keeping the broader tone bearish despite the latest bounce.
Momentum has improved on the daily chart, with the Moving Average Convergence Divergence (MACD) crossing above its signal line and the Relative Strength Index (RSI) hovering around the neutral 50 level, hinting at rebuilding buying interest but not yet enough to shift the trend.
Initial resistance for XRP is at the 50-period EMA at $1.3357; a break there would expose the more significant barrier at the 200-period EMA at $1.3579.
On the flip side, immediate support aligns with the former downward resistance trendline, now turned into support around the $1.2691 region, while deeper cushions sit at the $1.0000 psychological threshold if selling pressure resumes.
#TheBillionaireTrades
Ripple trades at $1.3191 at press time on Thursday, extending gains for the third consecutive day. $XRP breaks above a near-term resistance trendline, connecting the September 23 and October 28 highs, around $1.2691.
The price remains capped in the near term below both the 50-period Exponential Moving Average (EMA) at $1.3357 and the 200-period EMA at $1.3580, keeping the broader tone bearish despite the latest bounce.
Momentum has improved on the daily chart, with the Moving Average Convergence Divergence (MACD) crossing above its signal line and the Relative Strength Index (RSI) hovering around the neutral 50 level, hinting at rebuilding buying interest but not yet enough to shift the trend.
Initial resistance for XRP is at the 50-period EMA at $1.3357; a break there would expose the more significant barrier at the 200-period EMA at $1.3579.
On the flip side, immediate support aligns with the former downward resistance trendline, now turned into support around the $1.2691 region, while deeper cushions sit at the $1.0000 psychological threshold if selling pressure resumes.
#TheBillionaireTrades
340
Top Altcoins Price Forecast: Ripple, Cardano and Solana extend post-midterms rally
$XRP extends gains above $1.3100 on Thursday, with bulls focused on reclaiming the 50-day EMA around $1.3357.
Cardano advances its 4% gains from the previous day, aiming to reclaim the broken trendline near $0.2040.
Solana’s recovery remains capped below the 200-day EMA at $98.07 while momentum regains bullish traction.
Top altcoins, including Ripple (XRP), Cardano ($ADA ), and Solana ($SOL ) are trading in the green on Thursday, extending a steady recovery so far this week, driven by the post-US midterms relief. XRP tests its 50-day EMA near $1.3357, ADA eyes reclaiming the lost trendline near $0.2040, while SOL pushes toward its 200-day EMA at $98.07. The technical outlook for these top altcoins is bullish as selling pressure wanes.
#TheBillionaireTrades
{spot}(XRPUSDT)
{spot}(SOLUSDT)
{spot}(ADAUSDT)
Top Altcoins Price Forecast: Ripple, Cardano and Solana extend post-midterms rally
$XRP extends gains above $1.3100 on Thursday, with bulls focused on reclaiming the 50-day EMA around $1.3357.
Cardano advances its 4% gains from the previous day, aiming to reclaim the broken trendline near $0.2040.
Solana’s recovery remains capped below the 200-day EMA at $98.07 while momentum regains bullish traction.
Top altcoins, including Ripple (XRP), Cardano ($ADA ), and Solana ($SOL ) are trading in the green on Thursday, extending a steady recovery so far this week, driven by the post-US midterms relief. XRP tests its 50-day EMA near $1.3357, ADA eyes reclaiming the lost trendline near $0.2040, while SOL pushes toward its 200-day EMA at $98.07. The technical outlook for these top altcoins is bullish as selling pressure wanes.
#TheBillionaireTrades
$XRP extends gains above $1.3100 on Thursday, with bulls focused on reclaiming the 50-day EMA around $1.3357.
Cardano advances its 4% gains from the previous day, aiming to reclaim the broken trendline near $0.2040.
Solana’s recovery remains capped below the 200-day EMA at $98.07 while momentum regains bullish traction.
Top altcoins, including Ripple (XRP), Cardano ($ADA ), and Solana ($SOL ) are trading in the green on Thursday, extending a steady recovery so far this week, driven by the post-US midterms relief. XRP tests its 50-day EMA near $1.3357, ADA eyes reclaiming the lost trendline near $0.2040, while SOL pushes toward its 200-day EMA at $98.07. The technical outlook for these top altcoins is bullish as selling pressure wanes.
#TheBillionaireTrades
169
Solana takes off from a key support trendline
Solana trades around $96.80 at press time on Thursday, testing its 200-day EMA at $98.08 after bouncing off its rising support trendline around $89.69.
Momentum conditions are recovering on the daily chart, with the RSI hovering near 40 and the MACD line ready to cross above its signal line, hinting that downside pressure persists.
Looking up, a daily close back above the 200-day EMA at $98.08 would be the first sign of easing pressure, though stronger resistance is aligned at the 50-day EMA near $102.71, followed by the previous horizontal caps at $110.60 and $122.94.
On the downside, the initial support is seen at the rising trendline around $89.69, with the next horizontal floor at $87.21. Deeper losses would expose the more distant supports at $70.58 and $60.13.
#TheBillionaireTrades
{spot}(SOLUSDT)
Solana takes off from a key support trendline
Solana trades around $96.80 at press time on Thursday, testing its 200-day EMA at $98.08 after bouncing off its rising support trendline around $89.69.
Momentum conditions are recovering on the daily chart, with the RSI hovering near 40 and the MACD line ready to cross above its signal line, hinting that downside pressure persists.
Looking up, a daily close back above the 200-day EMA at $98.08 would be the first sign of easing pressure, though stronger resistance is aligned at the 50-day EMA near $102.71, followed by the previous horizontal caps at $110.60 and $122.94.
On the downside, the initial support is seen at the rising trendline around $89.69, with the next horizontal floor at $87.21. Deeper losses would expose the more distant supports at $70.58 and $60.13.
#TheBillionaireTrades
Solana trades around $96.80 at press time on Thursday, testing its 200-day EMA at $98.08 after bouncing off its rising support trendline around $89.69.
Momentum conditions are recovering on the daily chart, with the RSI hovering near 40 and the MACD line ready to cross above its signal line, hinting that downside pressure persists.
Looking up, a daily close back above the 200-day EMA at $98.08 would be the first sign of easing pressure, though stronger resistance is aligned at the 50-day EMA near $102.71, followed by the previous horizontal caps at $110.60 and $122.94.
On the downside, the initial support is seen at the rising trendline around $89.69, with the next horizontal floor at $87.21. Deeper losses would expose the more distant supports at $70.58 and $60.13.
#TheBillionaireTrades
34
Cardano defends key support level
Cardano holds steady around $0.1985 after a 4% rise the previous day. Still, $ADA maintains a bearish near-term tone as price holds below the former rising trendline support at $0.2034 and remains capped by both the 50-day EMA at $0.2151 and the 200-day EMA at $0.2381.
The price configuration below these major averages suggests rallies are likely to be sold, even as the MACD has inched closer to the signal line for a bullish crossover, and the RSI, near 40, recovers modestly from recent oversold territory, hinting at only tentative stabilization rather than a decisive reversal.
Cardano must reclaim the lost trendline near $0.2034 to reestablish an upward trendline, which could pave the way toward the 50-day EMA at $0.2151.
The horizontal level around $0.1894 has remained intact since August 30, providing key support and guarding the downside to the August 18 low at $0.1712.
#TheBillionaireTrades
{spot}(ADAUSDT)
Cardano defends key support level
Cardano holds steady around $0.1985 after a 4% rise the previous day. Still, $ADA maintains a bearish near-term tone as price holds below the former rising trendline support at $0.2034 and remains capped by both the 50-day EMA at $0.2151 and the 200-day EMA at $0.2381.
The price configuration below these major averages suggests rallies are likely to be sold, even as the MACD has inched closer to the signal line for a bullish crossover, and the RSI, near 40, recovers modestly from recent oversold territory, hinting at only tentative stabilization rather than a decisive reversal.
Cardano must reclaim the lost trendline near $0.2034 to reestablish an upward trendline, which could pave the way toward the 50-day EMA at $0.2151.
The horizontal level around $0.1894 has remained intact since August 30, providing key support and guarding the downside to the August 18 low at $0.1712.
#TheBillionaireTrades
Cardano holds steady around $0.1985 after a 4% rise the previous day. Still, $ADA maintains a bearish near-term tone as price holds below the former rising trendline support at $0.2034 and remains capped by both the 50-day EMA at $0.2151 and the 200-day EMA at $0.2381.
The price configuration below these major averages suggests rallies are likely to be sold, even as the MACD has inched closer to the signal line for a bullish crossover, and the RSI, near 40, recovers modestly from recent oversold territory, hinting at only tentative stabilization rather than a decisive reversal.
Cardano must reclaim the lost trendline near $0.2034 to reestablish an upward trendline, which could pave the way toward the 50-day EMA at $0.2151.
The horizontal level around $0.1894 has remained intact since August 30, providing key support and guarding the downside to the August 18 low at $0.1712.
#TheBillionaireTrades
127
Article
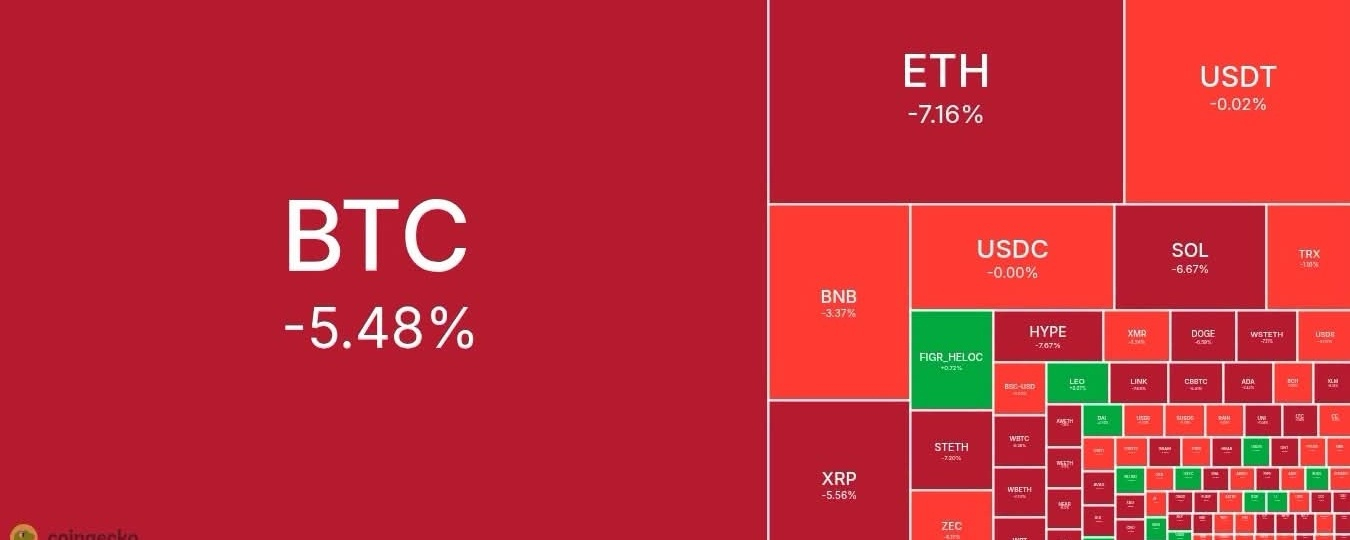
Bitcoin Sinks to Seven-Week Low as Risk-Off Mood DeepensBitcoin $BTC tumbled to a seven-week low as a rout in technology shares spilled into risky assets, hurting sentiment in digital assets already under pressure from industry-specific woes.
The original cryptocurrency traded below $76,000 after dropping as much as 5.8%. Ether tumbled around 8%. The selloff came as the Nasdaq 100 plunged 6.4%, led by chipmakers amid underwhelming earnings outlooks and concerns that Democratic control of Congress could bring tighter oversight of the artificial-intelligence industry.
Crypto is grappling with the fallout from the Binance hack and waning retail enthusiasm. The volatility in technology stocks has added to those pressures, despite an easing in Treasury yields that might otherwise support speculative assets.
Vetle Lunde, head of research at K33, says Bitcoin’s move is related to the wider tech selloff. It’s a “huge correlated move,” he said. “It’s all probably a reaction to the midterms with broad markets staying extraordinarily volatile as it tries to assess the consequence of the Dem Sweep.
Crypto-related stocks also joined the selloff. Mining and AI data center companies including CleanSpark Inc., Cipher Digital Inc. and MARA Holdings Inc. shed more than 14% on Thursday, while crypto trading platforms such as Coinbase Global Inc. and Robinhood Markets Inc. lost around 10% each.
James Butterfill, head of research at CoinShares, said that Bitcoin miners’ expansion into the AI-infrastructure space has tied their fortunes to that industry, leaving them vulnerable during downturns.
Bitcoin and Ether have been caught up in the broader technology selloff, with concerns about politics, AI-related leverage and financing spilling into crypto,” he said. “Bitcoin itself does not depend on technology companies’ earnings, but investors often sell these exposures together when reducing risk, with leveraged liquidations amplifying the move.
In the days after the Binance hack through Wednesday, investors pulled a net $1 billion from spot-Bitcoin ETFs, data compiled by Bloomberg show. BlackRock’s IBIT was the biggest casualty, with some $900 million flowing out over the span.
As recently as a month ago, nearly every coin held by short-term holders — or those who bought within the last 155 days — was in profit, according to analysts at Glassnode. But that picture is looking decidedly different now: amid the pullback, that share has sharply fallen, they wrote in a report this week. “Most short-term holder coins are now held at a loss,” they said.
“It is part of the general de-risking in the tape and it never should have rallied yesterday,” said JonesTrading Chief Market Strategist Michael O’Rourke of Bitcoin’s move.
Still, because much of Bitcoin’s latest decline has been driven by forces outside the crypto market, Norberto Giudice, a crypto and blockchain specialist, sees reason for optimism once the broader turbulence subsides.
“This pullback is due to factors unrelated to Bitcoin — factors that have nothing to do with its price cycle or its fundamental values,” he said. “And, therefore, I would expect that once the market calms down, Bitcoin will continue its long-term upward trend.”
#TheBillionaireTrades #TheBillionaireTradesMarketInsights
{spot}(BTCUSDT)
Bitcoin Sinks to Seven-Week Low as Risk-Off Mood Deepens
Bitcoin $BTC tumbled to a seven-week low as a rout in technology shares spilled into risky assets, hurting sentiment in digital assets already under pressure from industry-specific woes.
The original cryptocurrency traded below $76,000 after dropping as much as 5.8%. Ether tumbled around 8%. The selloff came as the Nasdaq 100 plunged 6.4%, led by chipmakers amid underwhelming earnings outlooks and concerns that Democratic control of Congress could bring tighter oversight of the artificial-intelligence industry.
Crypto is grappling with the fallout from the Binance hack and waning retail enthusiasm. The volatility in technology stocks has added to those pressures, despite an easing in Treasury yields that might otherwise support speculative assets.
Vetle Lunde, head of research at K33, says Bitcoin’s move is related to the wider tech selloff. It’s a “huge correlated move,” he said. “It’s all probably a reaction to the midterms with broad markets staying extraordinarily volatile as it tries to assess the consequence of the Dem Sweep.
Crypto-related stocks also joined the selloff. Mining and AI data center companies including CleanSpark Inc., Cipher Digital Inc. and MARA Holdings Inc. shed more than 14% on Thursday, while crypto trading platforms such as Coinbase Global Inc. and Robinhood Markets Inc. lost around 10% each.
James Butterfill, head of research at CoinShares, said that Bitcoin miners’ expansion into the AI-infrastructure space has tied their fortunes to that industry, leaving them vulnerable during downturns.
Bitcoin and Ether have been caught up in the broader technology selloff, with concerns about politics, AI-related leverage and financing spilling into crypto,” he said. “Bitcoin itself does not depend on technology companies’ earnings, but investors often sell these exposures together when reducing risk, with leveraged liquidations amplifying the move.
In the days after the Binance hack through Wednesday, investors pulled a net $1 billion from spot-Bitcoin ETFs, data compiled by Bloomberg show. BlackRock’s IBIT was the biggest casualty, with some $900 million flowing out over the span.
As recently as a month ago, nearly every coin held by short-term holders — or those who bought within the last 155 days — was in profit, according to analysts at Glassnode. But that picture is looking decidedly different now: amid the pullback, that share has sharply fallen, they wrote in a report this week. “Most short-term holder coins are now held at a loss,” they said.
“It is part of the general de-risking in the tape and it never should have rallied yesterday,” said JonesTrading Chief Market Strategist Michael O’Rourke of Bitcoin’s move.
Still, because much of Bitcoin’s latest decline has been driven by forces outside the crypto market, Norberto Giudice, a crypto and blockchain specialist, sees reason for optimism once the broader turbulence subsides.
“This pullback is due to factors unrelated to Bitcoin — factors that have nothing to do with its price cycle or its fundamental values,” he said. “And, therefore, I would expect that once the market calms down, Bitcoin will continue its long-term upward trend.”
#TheBillionaireTrades #TheBillionaireTradesMarketInsights
The original cryptocurrency traded below $76,000 after dropping as much as 5.8%. Ether tumbled around 8%. The selloff came as the Nasdaq 100 plunged 6.4%, led by chipmakers amid underwhelming earnings outlooks and concerns that Democratic control of Congress could bring tighter oversight of the artificial-intelligence industry.
Crypto is grappling with the fallout from the Binance hack and waning retail enthusiasm. The volatility in technology stocks has added to those pressures, despite an easing in Treasury yields that might otherwise support speculative assets.
Vetle Lunde, head of research at K33, says Bitcoin’s move is related to the wider tech selloff. It’s a “huge correlated move,” he said. “It’s all probably a reaction to the midterms with broad markets staying extraordinarily volatile as it tries to assess the consequence of the Dem Sweep.
Crypto-related stocks also joined the selloff. Mining and AI data center companies including CleanSpark Inc., Cipher Digital Inc. and MARA Holdings Inc. shed more than 14% on Thursday, while crypto trading platforms such as Coinbase Global Inc. and Robinhood Markets Inc. lost around 10% each.
James Butterfill, head of research at CoinShares, said that Bitcoin miners’ expansion into the AI-infrastructure space has tied their fortunes to that industry, leaving them vulnerable during downturns.
Bitcoin and Ether have been caught up in the broader technology selloff, with concerns about politics, AI-related leverage and financing spilling into crypto,” he said. “Bitcoin itself does not depend on technology companies’ earnings, but investors often sell these exposures together when reducing risk, with leveraged liquidations amplifying the move.
In the days after the Binance hack through Wednesday, investors pulled a net $1 billion from spot-Bitcoin ETFs, data compiled by Bloomberg show. BlackRock’s IBIT was the biggest casualty, with some $900 million flowing out over the span.
As recently as a month ago, nearly every coin held by short-term holders — or those who bought within the last 155 days — was in profit, according to analysts at Glassnode. But that picture is looking decidedly different now: amid the pullback, that share has sharply fallen, they wrote in a report this week. “Most short-term holder coins are now held at a loss,” they said.
“It is part of the general de-risking in the tape and it never should have rallied yesterday,” said JonesTrading Chief Market Strategist Michael O’Rourke of Bitcoin’s move.
Still, because much of Bitcoin’s latest decline has been driven by forces outside the crypto market, Norberto Giudice, a crypto and blockchain specialist, sees reason for optimism once the broader turbulence subsides.
“This pullback is due to factors unrelated to Bitcoin — factors that have nothing to do with its price cycle or its fundamental values,” he said. “And, therefore, I would expect that once the market calms down, Bitcoin will continue its long-term upward trend.”
#TheBillionaireTrades #TheBillionaireTradesMarketInsights
136
Billions Network $BILL has experienced a further breakdown, dropping to a new all-time low of $0.004716.
Overview
The Breakdown: The token has continued its downward trajectory, dropping significantly below the previous stabilization levels and hitting an absolute historic floor of $0.004716 USD.
Current Standing: As of November 4, 2026, BILL is trading at approximately $0.00485 USD across major platforms. This marks an additional decline from the previous alert's $0.00535 floor.
Technical Impact: The token remains in an aggressive macro down-trend, trading roughly 97.9% below its structural all-time high of $0.23 USD. Momentum indicators indicate deep, persistent selling pressure with no immediate sign of a reversal structure
Market Digest & Insights
• New Floor Discovery: Market tracking from CryptoSlate confirms that the token recorded its absolute all-time low during this observation window.
• Volume Distribution: Aggregated derivatives data from CoinGecko shows active short positions maintaining dominance, with millions in 24-hour volume concentrated across Binance and OKX futures contracts.
• Immediate Outlook: The token is currently attempting a low-volume drift. Near-term structural charts indicate that any potential recovery must first reclaim and hold the $0.0050–$0.0055 liquidity range before buyers can target a broader trend shift.
#TheBillionaireTrades
{future}(BILLUSDT)
Billions Network $BILL has experienced a further breakdown, dropping to a new all-time low of $0.004716.
Overview
The Breakdown: The token has continued its downward trajectory, dropping significantly below the previous stabilization levels and hitting an absolute historic floor of $0.004716 USD.
Current Standing: As of November 4, 2026, BILL is trading at approximately $0.00485 USD across major platforms. This marks an additional decline from the previous alert's $0.00535 floor.
Technical Impact: The token remains in an aggressive macro down-trend, trading roughly 97.9% below its structural all-time high of $0.23 USD. Momentum indicators indicate deep, persistent selling pressure with no immediate sign of a reversal structure
Market Digest & Insights
• New Floor Discovery: Market tracking from CryptoSlate confirms that the token recorded its absolute all-time low during this observation window.
• Volume Distribution: Aggregated derivatives data from CoinGecko shows active short positions maintaining dominance, with millions in 24-hour volume concentrated across Binance and OKX futures contracts.
• Immediate Outlook: The token is currently attempting a low-volume drift. Near-term structural charts indicate that any potential recovery must first reclaim and hold the $0.0050–$0.0055 liquidity range before buyers can target a broader trend shift.
#TheBillionaireTrades
Overview
The Breakdown: The token has continued its downward trajectory, dropping significantly below the previous stabilization levels and hitting an absolute historic floor of $0.004716 USD.
Current Standing: As of November 4, 2026, BILL is trading at approximately $0.00485 USD across major platforms. This marks an additional decline from the previous alert's $0.00535 floor.
Technical Impact: The token remains in an aggressive macro down-trend, trading roughly 97.9% below its structural all-time high of $0.23 USD. Momentum indicators indicate deep, persistent selling pressure with no immediate sign of a reversal structure
Market Digest & Insights
• New Floor Discovery: Market tracking from CryptoSlate confirms that the token recorded its absolute all-time low during this observation window.
• Volume Distribution: Aggregated derivatives data from CoinGecko shows active short positions maintaining dominance, with millions in 24-hour volume concentrated across Binance and OKX futures contracts.
• Immediate Outlook: The token is currently attempting a low-volume drift. Near-term structural charts indicate that any potential recovery must first reclaim and hold the $0.0050–$0.0055 liquidity range before buyers can target a broader trend shift.
#TheBillionaireTrades
695
Technical analysis: $XRP maintains stronger bearish bias
XRP trades above $1.25, extending its retreat beneath a dense band of moving average and trendline resistance. The pair is now clearly below the 50-day EMA at $1.34, the 100-day EMA at $1.32 and the 200-day EMA at $1.36, which collectively suggest the broader bias has turned bearish while price remains capped under the broken downward resistance trendline at $1.29.
The SuperTrend indicator at $1.39 stays firmly above spot, reinforcing persistent selling pressure. Similarly, the RSI near 37 hints at weak momentum but not outright oversold conditions.
Initial resistance lies at the former trendline break area around $1.29, followed by the 100-day EMA at $1.32 and the 50-day EMA at $1.34. Above these levels, the 200-day EMA at $1.36 and the SuperTrend line at $1.39 define a broader supply zone that would need to be decisively reclaimed to ease the current bearish tone. With no clear technical support levels defined below the prevailing price on the daily chart, any further slide would leave the pair exposed to discovering fresh demand zones on lower time frames or previous swing lows not captured here.
#TheBillionaireTrades
{spot}(XRPUSDT)
Technical analysis: $XRP maintains stronger bearish bias
XRP trades above $1.25, extending its retreat beneath a dense band of moving average and trendline resistance. The pair is now clearly below the 50-day EMA at $1.34, the 100-day EMA at $1.32 and the 200-day EMA at $1.36, which collectively suggest the broader bias has turned bearish while price remains capped under the broken downward resistance trendline at $1.29.
The SuperTrend indicator at $1.39 stays firmly above spot, reinforcing persistent selling pressure. Similarly, the RSI near 37 hints at weak momentum but not outright oversold conditions.
Initial resistance lies at the former trendline break area around $1.29, followed by the 100-day EMA at $1.32 and the 50-day EMA at $1.34. Above these levels, the 200-day EMA at $1.36 and the SuperTrend line at $1.39 define a broader supply zone that would need to be decisively reclaimed to ease the current bearish tone. With no clear technical support levels defined below the prevailing price on the daily chart, any further slide would leave the pair exposed to discovering fresh demand zones on lower time frames or previous swing lows not captured here.
#TheBillionaireTrades
XRP trades above $1.25, extending its retreat beneath a dense band of moving average and trendline resistance. The pair is now clearly below the 50-day EMA at $1.34, the 100-day EMA at $1.32 and the 200-day EMA at $1.36, which collectively suggest the broader bias has turned bearish while price remains capped under the broken downward resistance trendline at $1.29.
The SuperTrend indicator at $1.39 stays firmly above spot, reinforcing persistent selling pressure. Similarly, the RSI near 37 hints at weak momentum but not outright oversold conditions.
Initial resistance lies at the former trendline break area around $1.29, followed by the 100-day EMA at $1.32 and the 50-day EMA at $1.34. Above these levels, the 200-day EMA at $1.36 and the SuperTrend line at $1.39 define a broader supply zone that would need to be decisively reclaimed to ease the current bearish tone. With no clear technical support levels defined below the prevailing price on the daily chart, any further slide would leave the pair exposed to discovering fresh demand zones on lower time frames or previous swing lows not captured here.
#TheBillionaireTrades
76
Ethereum technical analysis: $ETH upholds lower support level
Ethereum trades at $2,257, extending a bearish phase after slipping below all key moving averages. The 200-day EMA at $2,307 is the nearest overhead cap, followed by the prior upward trendline break level at $2,341 and the 100-day EMA at $2,351, collectively suggesting any rebounds are likely to meet supply.
The 50-day EMA at $2,410 and the SuperTrend line at $2,475 reinforce broader topside pressure, while the Relative Strength Index (RSI) at 33 shows weak momentum just above oversold territory and the MACD histogram is negative but contracting, hinting at slowing downside rather than a reversal.
Immediate resistance lies at the 200-day EMA near $2,307, with subsequent barriers at the broken rising trendline around $2,341 and the 100-day EMA near $2,351. Further up, the 50-day EMA at roughly $2,410 precedes a stronger supply zone at the SuperTrend line around $2,475, where sellers could reassert control if price manages a deeper corrective bounce. On the downside, the lack of nearby mapped supports in the provided dataset leaves ETH vulnerable to further declines, so traders may look for new horizontal floors to emerge from price action before expecting a more durable recovery.
#TheBillionaireTrades
{spot}(ETHUSDT)
Ethereum technical analysis: $ETH upholds lower support level
Ethereum trades at $2,257, extending a bearish phase after slipping below all key moving averages. The 200-day EMA at $2,307 is the nearest overhead cap, followed by the prior upward trendline break level at $2,341 and the 100-day EMA at $2,351, collectively suggesting any rebounds are likely to meet supply.
The 50-day EMA at $2,410 and the SuperTrend line at $2,475 reinforce broader topside pressure, while the Relative Strength Index (RSI) at 33 shows weak momentum just above oversold territory and the MACD histogram is negative but contracting, hinting at slowing downside rather than a reversal.
Immediate resistance lies at the 200-day EMA near $2,307, with subsequent barriers at the broken rising trendline around $2,341 and the 100-day EMA near $2,351. Further up, the 50-day EMA at roughly $2,410 precedes a stronger supply zone at the SuperTrend line around $2,475, where sellers could reassert control if price manages a deeper corrective bounce. On the downside, the lack of nearby mapped supports in the provided dataset leaves ETH vulnerable to further declines, so traders may look for new horizontal floors to emerge from price action before expecting a more durable recovery.
#TheBillionaireTrades
Ethereum trades at $2,257, extending a bearish phase after slipping below all key moving averages. The 200-day EMA at $2,307 is the nearest overhead cap, followed by the prior upward trendline break level at $2,341 and the 100-day EMA at $2,351, collectively suggesting any rebounds are likely to meet supply.
The 50-day EMA at $2,410 and the SuperTrend line at $2,475 reinforce broader topside pressure, while the Relative Strength Index (RSI) at 33 shows weak momentum just above oversold territory and the MACD histogram is negative but contracting, hinting at slowing downside rather than a reversal.
Immediate resistance lies at the 200-day EMA near $2,307, with subsequent barriers at the broken rising trendline around $2,341 and the 100-day EMA near $2,351. Further up, the 50-day EMA at roughly $2,410 precedes a stronger supply zone at the SuperTrend line around $2,475, where sellers could reassert control if price manages a deeper corrective bounce. On the downside, the lack of nearby mapped supports in the provided dataset leaves ETH vulnerable to further declines, so traders may look for new horizontal floors to emerge from price action before expecting a more durable recovery.
#TheBillionaireTrades
29
Technical analysis: Bitcoin falters as sell-side pressure expands
Bitcoin trades at $76,566, flirting with the 200-day Exponential Moving Average (EMA) while remaining capped below the 100-day EMA at $77,776, keeping the near-term bias bearish. The 50-day EMA higher up at $80,099 reinforces the overhead supply, while the Moving Average Convergence Divergence (MACD) stays in negative territory with a weak profile and the Relative Strength Index (RSI) hovering around 34, hinting at lingering downside pressure rather than a decisive oversold bounce.
Initial resistance lies at the 100-day EMA around $77,776, ahead of a stronger barrier at the 50-day EMA near $80,099. On the downside, immediate support is provided by the 200-day EMA at $76,550. A daily close above the 100-day EMA would be needed to soften the bearish tone, whereas a sustained move back below the 200-day EMA would reopen the path for further retracement.
#TheBillionaireTrades
{spot}(BTCUSDT)
Technical analysis: Bitcoin falters as sell-side pressure expands
Bitcoin trades at $76,566, flirting with the 200-day Exponential Moving Average (EMA) while remaining capped below the 100-day EMA at $77,776, keeping the near-term bias bearish. The 50-day EMA higher up at $80,099 reinforces the overhead supply, while the Moving Average Convergence Divergence (MACD) stays in negative territory with a weak profile and the Relative Strength Index (RSI) hovering around 34, hinting at lingering downside pressure rather than a decisive oversold bounce.
Initial resistance lies at the 100-day EMA around $77,776, ahead of a stronger barrier at the 50-day EMA near $80,099. On the downside, immediate support is provided by the 200-day EMA at $76,550. A daily close above the 100-day EMA would be needed to soften the bearish tone, whereas a sustained move back below the 200-day EMA would reopen the path for further retracement.
#TheBillionaireTrades
Bitcoin trades at $76,566, flirting with the 200-day Exponential Moving Average (EMA) while remaining capped below the 100-day EMA at $77,776, keeping the near-term bias bearish. The 50-day EMA higher up at $80,099 reinforces the overhead supply, while the Moving Average Convergence Divergence (MACD) stays in negative territory with a weak profile and the Relative Strength Index (RSI) hovering around 34, hinting at lingering downside pressure rather than a decisive oversold bounce.
Initial resistance lies at the 100-day EMA around $77,776, ahead of a stronger barrier at the 50-day EMA near $80,099. On the downside, immediate support is provided by the 200-day EMA at $76,550. A daily close above the 100-day EMA would be needed to soften the bearish tone, whereas a sustained move back below the 200-day EMA would reopen the path for further retracement.
#TheBillionaireTrades
75
Log in to explore more content
Join global crypto users on Binance Square
⚡️ Get latest and useful information about crypto.
💬 Trusted by the world’s largest crypto exchange.
👍 Discover real insights from verified creators.
Email / Phone number
Trending Topics
1
#A Packed Week of Earnings and Data Tests Markets
1,979 views
39 Discussing
2
#HuangReportedlyConsidersReturnToNvidia
12,750 views
199 Discussing
3
#CryptoSelloffTriggersMultipleWhaleLiquidations
266,805 views
2,244 Discussing
4
#BitcoinSpotETFsPost$1.065BOutflowsForThirdStraightWeek
913 views
22 Discussing
5
#About64000BitcoinMiningMachinesReportedlyHijacked
12,031 views
170 Discussing
6
#USSpotXRPETFsSeeLargestWeeklyOutflowIn8Months
215,460 views
1,785 Discussing
7
#WillFOMCMinutesReinforceRateHikeExpectations?
81,639 views
917 Discussing
8
#BitcoinActiveSupplyInProfitDropsBelow45%
289,705 views
2,021 Discussing
9
#TONStrategyReports$23.97MQ3NetLoss
24,147 views
161 Discussing
10
#KavaSaysAbnormalActivityLimitedToKavaLend
191,009 views
1,164 Discussing