
Deirdre Contrerras Q4OM
8 Beiträge

Deirdre Contrerras Q4OM
Melden
Nutzer blockieren
Trade eröffnen
Gelegenheitstrader
3.3 Jahre
7 Following
3 Follower
1 Like gegeben
Beiträge
Portfolio
·
--
Bullisch
Übersetzung ansehen
🚀
{spot}(IOSTUSDT)
(IOST) Future Outlook: Could the Next Move Be Higher?
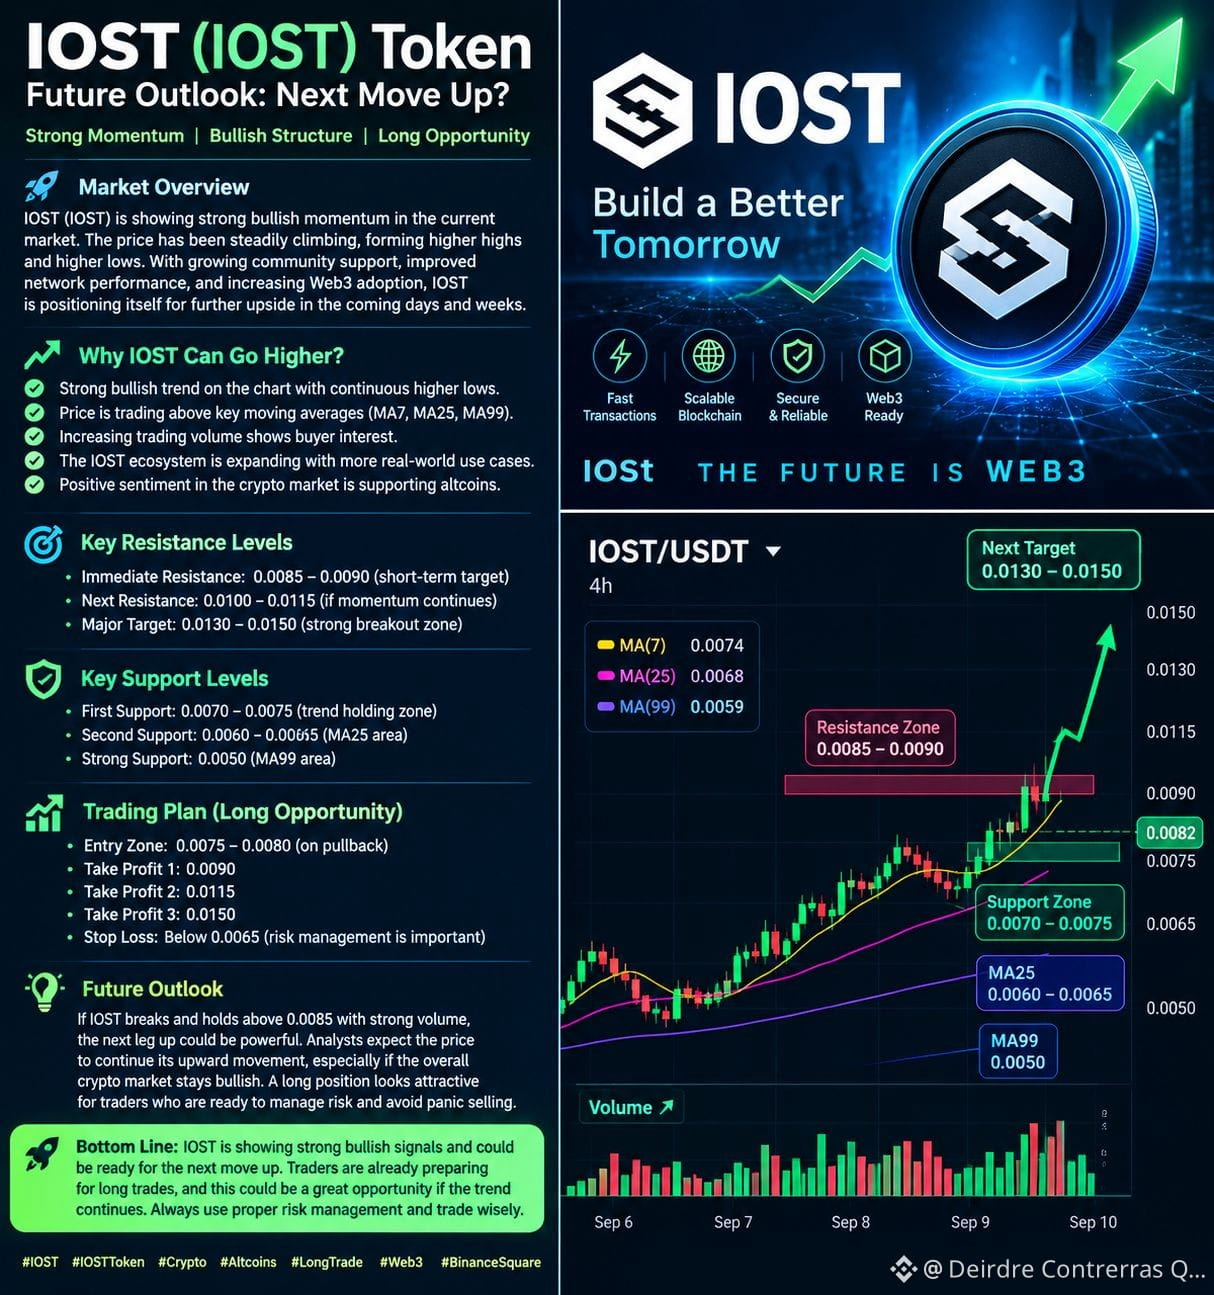
$IOST is showing an interesting bullish structure on the provided chart. Recent price action has been supported by higher highs and higher lows, while trading activity suggests increasing interest from buyers. If this momentum continues, $IOST could have room for another upward move.
📈 Why $IOST Could Move Higher
The chart shows the price trading above several key moving averages, including MA(7), MA(25), and MA(99). This structure generally indicates that short-term momentum is favoring buyers.
Another positive factor is the increase in trading volume during the upward move. Strong volume combined with a resistance breakout can provide better confirmation of a bullish continuation.
🎯 Key Levels to Watch
The first important resistance is around $0.0360. A clean breakout and sustained close above this level, especially with strong volume, could open the way toward the $0.0400–$0.0450 area.
On the downside, the $0.0310–$0.0280 zone can be watched as an important support area. Holding this zone would help maintain the current bullish structure.
🟢 Long Setup Idea
Traders looking for a long opportunity may prefer waiting for confirmation above resistance or a controlled pullback toward support rather than chasing a sudden pump.
If IOST breaks resistance with strong volume and maintains the breakout, bullish continuation becomes more likely. However, crypto markets can reverse quickly, so proper risk management and a defined stop-loss are important.
#IOST #IOSTUSDT #IOSTToken #Crypto #Altcoins #LongTrade #BinanceSquare #CryptoAnalysis
🚀
(IOST) Future Outlook: Could the Next Move Be Higher?
$IOST is showing an interesting bullish structure on the provided chart. Recent price action has been supported by higher highs and higher lows, while trading activity suggests increasing interest from buyers. If this momentum continues, $IOST could have room for another upward move.
📈 Why $IOST Could Move Higher
The chart shows the price trading above several key moving averages, including MA(7), MA(25), and MA(99). This structure generally indicates that short-term momentum is favoring buyers.
Another positive factor is the increase in trading volume during the upward move. Strong volume combined with a resistance breakout can provide better confirmation of a bullish continuation.
🎯 Key Levels to Watch
The first important resistance is around $0.0360. A clean breakout and sustained close above this level, especially with strong volume, could open the way toward the $0.0400–$0.0450 area.
On the downside, the $0.0310–$0.0280 zone can be watched as an important support area. Holding this zone would help maintain the current bullish structure.
🟢 Long Setup Idea
Traders looking for a long opportunity may prefer waiting for confirmation above resistance or a controlled pullback toward support rather than chasing a sudden pump.
If IOST breaks resistance with strong volume and maintains the breakout, bullish continuation becomes more likely. However, crypto markets can reverse quickly, so proper risk management and a defined stop-loss are important.
#IOST #IOSTUSDT #IOSTToken #Crypto #Altcoins #LongTrade #BinanceSquare #CryptoAnalysis
(IOST) Future Outlook: Could the Next Move Be Higher?
$IOST is showing an interesting bullish structure on the provided chart. Recent price action has been supported by higher highs and higher lows, while trading activity suggests increasing interest from buyers. If this momentum continues, $IOST could have room for another upward move.
📈 Why $IOST Could Move Higher
The chart shows the price trading above several key moving averages, including MA(7), MA(25), and MA(99). This structure generally indicates that short-term momentum is favoring buyers.
Another positive factor is the increase in trading volume during the upward move. Strong volume combined with a resistance breakout can provide better confirmation of a bullish continuation.
🎯 Key Levels to Watch
The first important resistance is around $0.0360. A clean breakout and sustained close above this level, especially with strong volume, could open the way toward the $0.0400–$0.0450 area.
On the downside, the $0.0310–$0.0280 zone can be watched as an important support area. Holding this zone would help maintain the current bullish structure.
🟢 Long Setup Idea
Traders looking for a long opportunity may prefer waiting for confirmation above resistance or a controlled pullback toward support rather than chasing a sudden pump.
If IOST breaks resistance with strong volume and maintains the breakout, bullish continuation becomes more likely. However, crypto markets can reverse quickly, so proper risk management and a defined stop-loss are important.
#IOST #IOSTUSDT #IOSTToken #Crypto #Altcoins #LongTrade #BinanceSquare #CryptoAnalysis
26
Artikel
Übersetzung ansehen
🚀 IOST (IOST) Future Outlook: Could the Next Move Be Higher?
IOST (IOST) is showing an interesting🚀 $IOST (IOST) Future Outlook: Could the Next Move Be Higher?
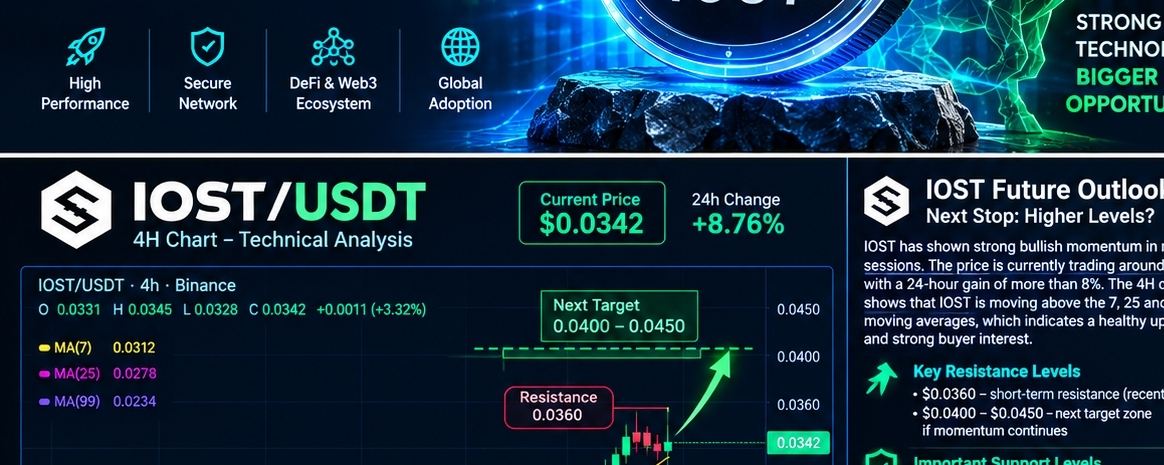
$IOST (IOST) is showing an interesting bullish structure on the provided chart. Recent price action has been supported by higher highs and higher lows, while trading activity suggests increasing interest from buyers. If this momentum continues, IOST could have room for another upward move.
📈 Why $IOST Could Move Higher
The chart shows the price trading above several key moving averages, including MA(7), MA(25), and MA(99). This structure generally indicates that short-term momentum is favoring buyers.
Another positive factor is the increase in trading volume during the upward move. Strong volume combined with a resistance breakout can provide better confirmation of a bullish continuation.
🎯 Key Levels to Watch
The first important resistance is around $0.0360. A clean breakout and sustained close above this level, especially with strong volume, could open the way toward the $0.0400–$0.0450 area.
On the downside, the $0.0310–$0.0280 zone can be watched as an important support area. Holding this zone would help maintain the current bullish structure.
🟢 Long Setup Idea
Traders looking for a long opportunity may prefer waiting for confirmation above resistance or a controlled pullback toward support rather than chasing a sudden pump.
If IOST breaks resistance with strong volume and maintains the breakout, bullish continuation becomes more likely. However, crypto markets can reverse quickly, so proper risk management and a defined stop-loss are important.
🔮 Future Outlook
Overall, IOST currently presents a bullish short-term setup, but the next major move depends on whether buyers can break and hold the key resistance. A successful breakout could attract additional momentum and push the token toward higher levels.
Bottom line: IOST is showing bullish momentum, and a confirmed breakout could create a potential opportunity for traders watching the long side. Always wait for confirmation and manage risk carefully. This is an educational market analysis, not financial advice.
#IOST #IOSTUSDT #IOSTToken #Crypto #Altcoins #LongTrade #BinanceSquare #CryptoAnalysis
🚀 IOST (IOST) Future Outlook: Could the Next Move Be Higher? IOST (IOST) is showing an interesting
🚀 $IOST (IOST) Future Outlook: Could the Next Move Be Higher?
$IOST (IOST) is showing an interesting bullish structure on the provided chart. Recent price action has been supported by higher highs and higher lows, while trading activity suggests increasing interest from buyers. If this momentum continues, IOST could have room for another upward move.
📈 Why $IOST Could Move Higher
The chart shows the price trading above several key moving averages, including MA(7), MA(25), and MA(99). This structure generally indicates that short-term momentum is favoring buyers.
Another positive factor is the increase in trading volume during the upward move. Strong volume combined with a resistance breakout can provide better confirmation of a bullish continuation.
🎯 Key Levels to Watch
The first important resistance is around $0.0360. A clean breakout and sustained close above this level, especially with strong volume, could open the way toward the $0.0400–$0.0450 area.
On the downside, the $0.0310–$0.0280 zone can be watched as an important support area. Holding this zone would help maintain the current bullish structure.
🟢 Long Setup Idea
Traders looking for a long opportunity may prefer waiting for confirmation above resistance or a controlled pullback toward support rather than chasing a sudden pump.
If IOST breaks resistance with strong volume and maintains the breakout, bullish continuation becomes more likely. However, crypto markets can reverse quickly, so proper risk management and a defined stop-loss are important.
🔮 Future Outlook
Overall, IOST currently presents a bullish short-term setup, but the next major move depends on whether buyers can break and hold the key resistance. A successful breakout could attract additional momentum and push the token toward higher levels.
Bottom line: IOST is showing bullish momentum, and a confirmed breakout could create a potential opportunity for traders watching the long side. Always wait for confirmation and manage risk carefully. This is an educational market analysis, not financial advice.
#IOST #IOSTUSDT #IOSTToken #Crypto #Altcoins #LongTrade #BinanceSquare #CryptoAnalysis
$IOST (IOST) is showing an interesting bullish structure on the provided chart. Recent price action has been supported by higher highs and higher lows, while trading activity suggests increasing interest from buyers. If this momentum continues, IOST could have room for another upward move.
📈 Why $IOST Could Move Higher
The chart shows the price trading above several key moving averages, including MA(7), MA(25), and MA(99). This structure generally indicates that short-term momentum is favoring buyers.
Another positive factor is the increase in trading volume during the upward move. Strong volume combined with a resistance breakout can provide better confirmation of a bullish continuation.
🎯 Key Levels to Watch
The first important resistance is around $0.0360. A clean breakout and sustained close above this level, especially with strong volume, could open the way toward the $0.0400–$0.0450 area.
On the downside, the $0.0310–$0.0280 zone can be watched as an important support area. Holding this zone would help maintain the current bullish structure.
🟢 Long Setup Idea
Traders looking for a long opportunity may prefer waiting for confirmation above resistance or a controlled pullback toward support rather than chasing a sudden pump.
If IOST breaks resistance with strong volume and maintains the breakout, bullish continuation becomes more likely. However, crypto markets can reverse quickly, so proper risk management and a defined stop-loss are important.
🔮 Future Outlook
Overall, IOST currently presents a bullish short-term setup, but the next major move depends on whether buyers can break and hold the key resistance. A successful breakout could attract additional momentum and push the token toward higher levels.
Bottom line: IOST is showing bullish momentum, and a confirmed breakout could create a potential opportunity for traders watching the long side. Always wait for confirmation and manage risk carefully. This is an educational market analysis, not financial advice.
#IOST #IOSTUSDT #IOSTToken #Crypto #Altcoins #LongTrade #BinanceSquare #CryptoAnalysis
1
57
🚀 SOPH Token Ausblick: Ist der bullische Trend bereit für den nächsten Schritt?
$SOPH /USDT hat in der jüngsten Sitzung eine starke bullische Dynamik gezeigt. Laut dem bereitgestellten 15-Minuten-Chart handelt $SOPH derzeit bei etwa 0,00649 $, während das jüngste Hoch ungefähr 0,00676 $ erreichte. Der Token hat außerdem einen Anstieg von 56 %+ innerhalb von 24 Stunden verzeichnet, was ein starkes Kaufinteresse signalisiert.
Ein wichtiger Punkt im Chart ist, dass der Kurs aktuell oberhalb der MA(7), MA(25) und MA(99) handelt. Das ist ein positives Zeichen für den kurzfristigen Trend. Die gleitenden Durchschnitte liegen bei rund 0,00631 $, 0,00574 $ und 0,00507 $ und deuten darauf hin, dass Käufer derzeit die Oberhand haben.
📈 Wichtiger Widerstand für $SOPH
Der Bereich von 0,00676 $ ist eine bedeutende Widerstandszone, weil der Kurs dort kürzlich zurückgewiesen wurde. Wenn SOPH mit starkem Handelsvolumen über dieses Niveau ausbricht und es hält, könnte die bullische Dynamik weiter anhalten.
Nach einem bestätigten Breakout könnten Trader neue Hochs und psychologische Kursmarken im Blick behalten. Zukünftige Kursziele sollten jedoch nicht als garantiert betrachtet werden.#SOPH #USIranTradeTankerStrikesEscalate #RussiaUkraineTradeStrikesKushnerWitkoffToKyiv
🚀 SOPH Token Ausblick: Ist der bullische Trend bereit für den nächsten Schritt?
$SOPH /USDT hat in der jüngsten Sitzung eine starke bullische Dynamik gezeigt. Laut dem bereitgestellten 15-Minuten-Chart handelt $SOPH derzeit bei etwa 0,00649 $, während das jüngste Hoch ungefähr 0,00676 $ erreichte. Der Token hat außerdem einen Anstieg von 56 %+ innerhalb von 24 Stunden verzeichnet, was ein starkes Kaufinteresse signalisiert.
Ein wichtiger Punkt im Chart ist, dass der Kurs aktuell oberhalb der MA(7), MA(25) und MA(99) handelt. Das ist ein positives Zeichen für den kurzfristigen Trend. Die gleitenden Durchschnitte liegen bei rund 0,00631 $, 0,00574 $ und 0,00507 $ und deuten darauf hin, dass Käufer derzeit die Oberhand haben.
📈 Wichtiger Widerstand für $SOPH
Der Bereich von 0,00676 $ ist eine bedeutende Widerstandszone, weil der Kurs dort kürzlich zurückgewiesen wurde. Wenn SOPH mit starkem Handelsvolumen über dieses Niveau ausbricht und es hält, könnte die bullische Dynamik weiter anhalten.
Nach einem bestätigten Breakout könnten Trader neue Hochs und psychologische Kursmarken im Blick behalten. Zukünftige Kursziele sollten jedoch nicht als garantiert betrachtet werden.#SOPH #USIranTradeTankerStrikesEscalate #RussiaUkraineTradeStrikesKushnerWitkoffToKyiv
$SOPH /USDT hat in der jüngsten Sitzung eine starke bullische Dynamik gezeigt. Laut dem bereitgestellten 15-Minuten-Chart handelt $SOPH derzeit bei etwa 0,00649 $, während das jüngste Hoch ungefähr 0,00676 $ erreichte. Der Token hat außerdem einen Anstieg von 56 %+ innerhalb von 24 Stunden verzeichnet, was ein starkes Kaufinteresse signalisiert.
Ein wichtiger Punkt im Chart ist, dass der Kurs aktuell oberhalb der MA(7), MA(25) und MA(99) handelt. Das ist ein positives Zeichen für den kurzfristigen Trend. Die gleitenden Durchschnitte liegen bei rund 0,00631 $, 0,00574 $ und 0,00507 $ und deuten darauf hin, dass Käufer derzeit die Oberhand haben.
📈 Wichtiger Widerstand für $SOPH
Der Bereich von 0,00676 $ ist eine bedeutende Widerstandszone, weil der Kurs dort kürzlich zurückgewiesen wurde. Wenn SOPH mit starkem Handelsvolumen über dieses Niveau ausbricht und es hält, könnte die bullische Dynamik weiter anhalten.
Nach einem bestätigten Breakout könnten Trader neue Hochs und psychologische Kursmarken im Blick behalten. Zukünftige Kursziele sollten jedoch nicht als garantiert betrachtet werden.#SOPH #USIranTradeTankerStrikesEscalate #RussiaUkraineTradeStrikesKushnerWitkoffToKyiv

50
Artikel
Übersetzung ansehen
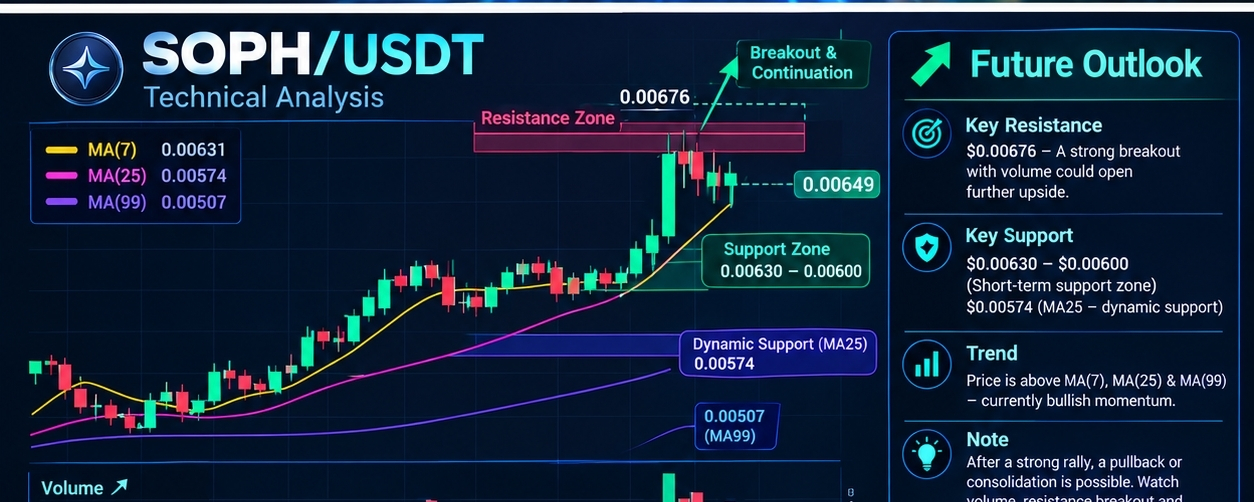
🚀 SOPH Token Future Outlook: Is the Bullish Trend Ready for Another Move?$SOPH /USDT has shown strong bullish momentum in the recent session. According to the provided 15-minute chart, $SOPH is trading around $0.00649, while the recent high reached approximately $0.00676. The token has also recorded a 56%+ 24-hour increase, showing strong buying interest.
One of the key points on the chart is that the price is currently trading above the MA(7), MA(25), and MA(99). This is a positive sign for the short-term trend. The moving averages are around $0.00631, $0.00574, and $0.00507, respectively, indicating that buyers currently have the upper hand.
📈 Key Resistance for $SOPH
The $0.00676 area is an important resistance level because the price recently faced rejection there. If SOPH breaks above this level with strong trading volume and holds it, the bullish momentum could continue.
After a confirmed breakout, traders may watch for new highs and psychological price levels. However, future price targets should not be considered guaranteed.
🛡️ Important Support Levels
In the short term, the $0.00630–$0.00600 area could act as an important support zone. If SOPH holds this area, the bullish structure may remain intact.
Below this zone, $0.00574, near the MA(25), is another important dynamic support. A move below this level could weaken the current bullish momentum and increase the possibility of a deeper correction.
🔮 Future Outlook
SOPH currently has a bullish short-term setup, but after such a strong rally, profit-taking and a temporary pullback are also possible. For better confirmation, traders should monitor trading volume, resistance breakouts, and candle closes.
If SOPH breaks $0.00676 with strong volume, the possibility of further bullish continuation could increase. On the other hand, repeated rejection from this level could lead to consolidation or a correction.
Bottom line: SOPH is currently showing strong momentum, but the next major move will likely depend on whether resistance breaks or support fails. Avoid FOMO and focus on confirmation and risk management. This article is for educational purposes only and is not financial advice.
#SOPH #Sophon #Crypto #BinanceSquare #Altcoins #CryptoAnalysis #SOPHUSDT #Web3
$
🚀 SOPH Token Future Outlook: Is the Bullish Trend Ready for Another Move?
$SOPH /USDT has shown strong bullish momentum in the recent session. According to the provided 15-minute chart, $SOPH is trading around $0.00649, while the recent high reached approximately $0.00676. The token has also recorded a 56%+ 24-hour increase, showing strong buying interest.
One of the key points on the chart is that the price is currently trading above the MA(7), MA(25), and MA(99). This is a positive sign for the short-term trend. The moving averages are around $0.00631, $0.00574, and $0.00507, respectively, indicating that buyers currently have the upper hand.
📈 Key Resistance for $SOPH
The $0.00676 area is an important resistance level because the price recently faced rejection there. If SOPH breaks above this level with strong trading volume and holds it, the bullish momentum could continue.
After a confirmed breakout, traders may watch for new highs and psychological price levels. However, future price targets should not be considered guaranteed.
🛡️ Important Support Levels
In the short term, the $0.00630–$0.00600 area could act as an important support zone. If SOPH holds this area, the bullish structure may remain intact.
Below this zone, $0.00574, near the MA(25), is another important dynamic support. A move below this level could weaken the current bullish momentum and increase the possibility of a deeper correction.
🔮 Future Outlook
SOPH currently has a bullish short-term setup, but after such a strong rally, profit-taking and a temporary pullback are also possible. For better confirmation, traders should monitor trading volume, resistance breakouts, and candle closes.
If SOPH breaks $0.00676 with strong volume, the possibility of further bullish continuation could increase. On the other hand, repeated rejection from this level could lead to consolidation or a correction.
Bottom line: SOPH is currently showing strong momentum, but the next major move will likely depend on whether resistance breaks or support fails. Avoid FOMO and focus on confirmation and risk management. This article is for educational purposes only and is not financial advice.
#SOPH #Sophon #Crypto #BinanceSquare #Altcoins #CryptoAnalysis #SOPHUSDT #Web3
$
One of the key points on the chart is that the price is currently trading above the MA(7), MA(25), and MA(99). This is a positive sign for the short-term trend. The moving averages are around $0.00631, $0.00574, and $0.00507, respectively, indicating that buyers currently have the upper hand.
📈 Key Resistance for $SOPH
The $0.00676 area is an important resistance level because the price recently faced rejection there. If SOPH breaks above this level with strong trading volume and holds it, the bullish momentum could continue.
After a confirmed breakout, traders may watch for new highs and psychological price levels. However, future price targets should not be considered guaranteed.
🛡️ Important Support Levels
In the short term, the $0.00630–$0.00600 area could act as an important support zone. If SOPH holds this area, the bullish structure may remain intact.
Below this zone, $0.00574, near the MA(25), is another important dynamic support. A move below this level could weaken the current bullish momentum and increase the possibility of a deeper correction.
🔮 Future Outlook
SOPH currently has a bullish short-term setup, but after such a strong rally, profit-taking and a temporary pullback are also possible. For better confirmation, traders should monitor trading volume, resistance breakouts, and candle closes.
If SOPH breaks $0.00676 with strong volume, the possibility of further bullish continuation could increase. On the other hand, repeated rejection from this level could lead to consolidation or a correction.
Bottom line: SOPH is currently showing strong momentum, but the next major move will likely depend on whether resistance breaks or support fails. Avoid FOMO and focus on confirmation and risk management. This article is for educational purposes only and is not financial advice.
#SOPH #Sophon #Crypto #BinanceSquare #Altcoins #CryptoAnalysis #SOPHUSDT #Web3
$
110
Übersetzung ansehen
SOLV/USDT Technical Analysis: Can the Current Momentum Continue?
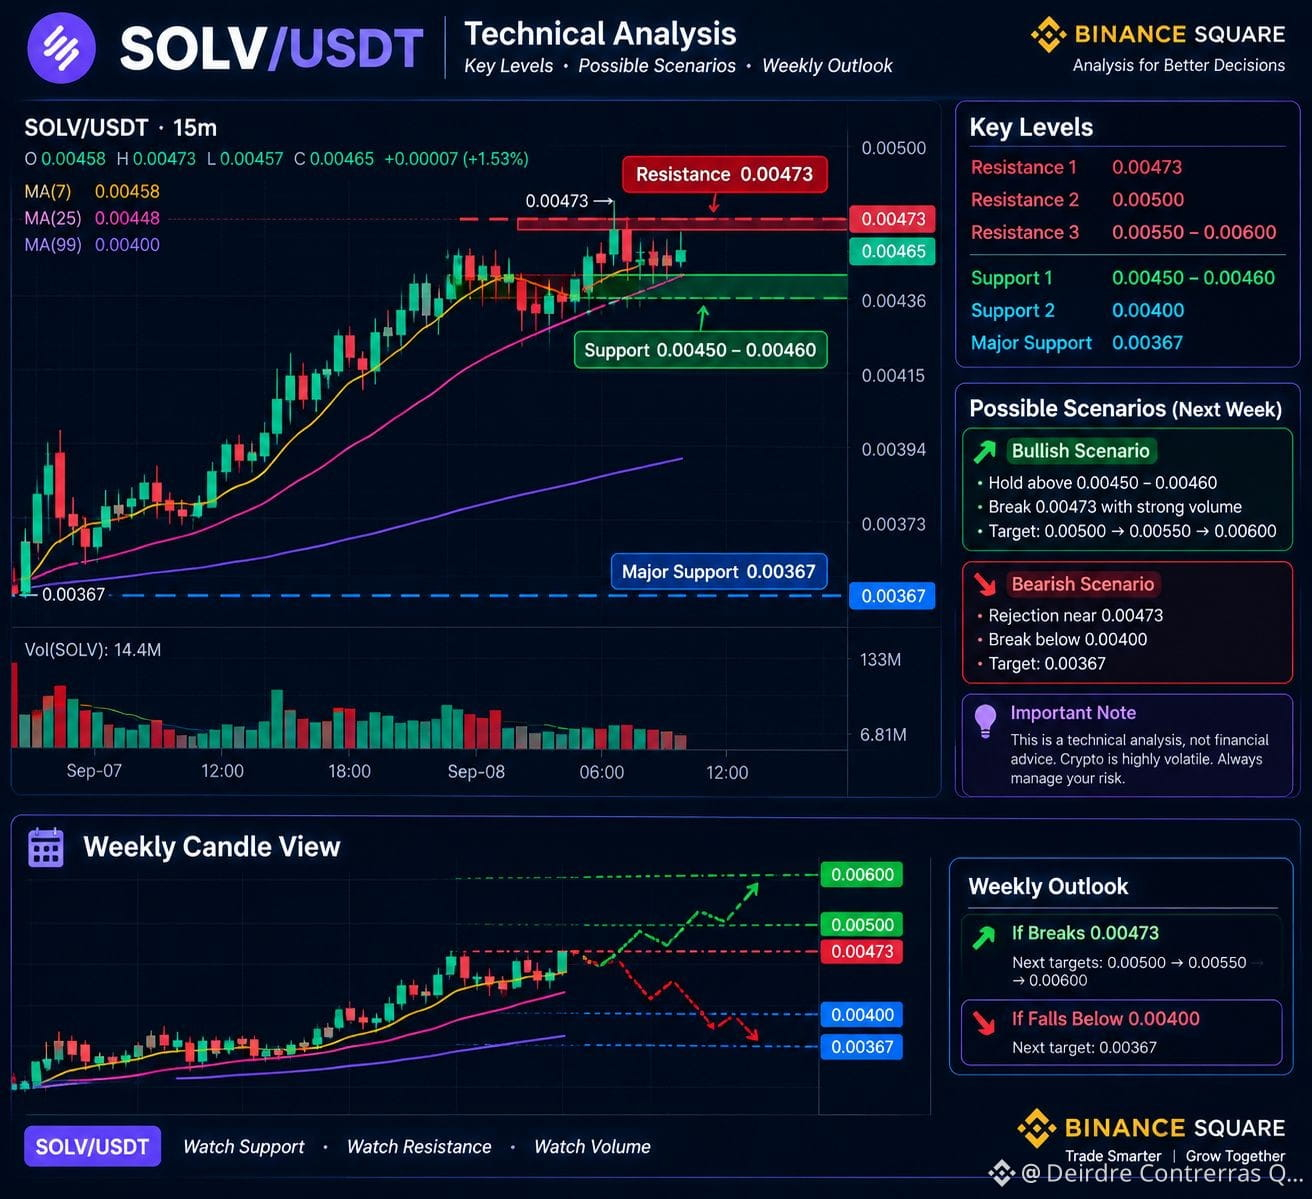
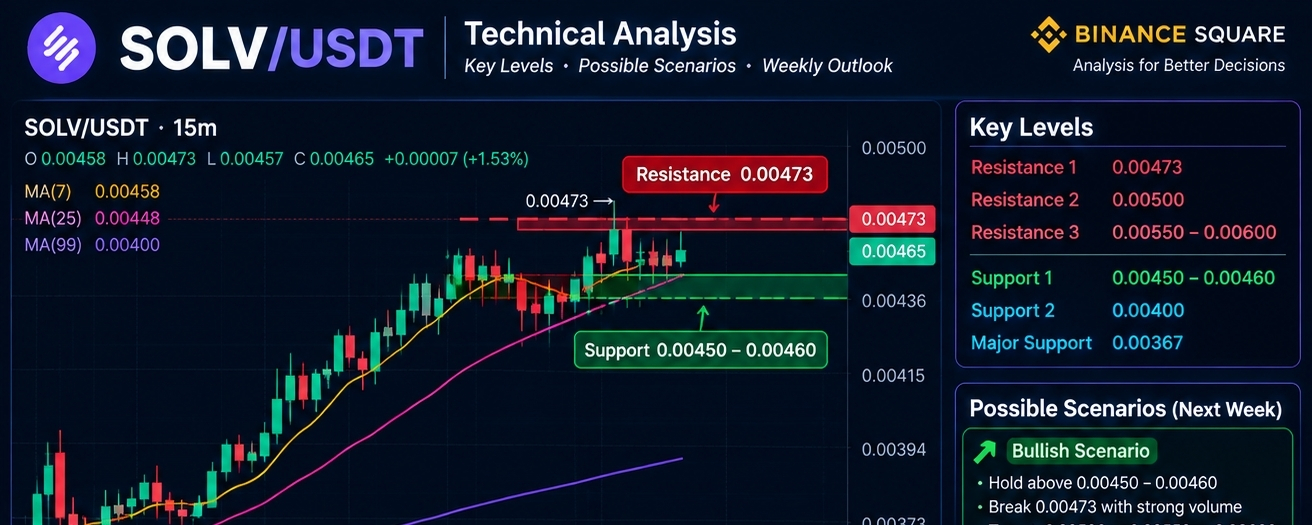
$SOLV /USDT has recently shown strong upward momentum on the 15-minute chart. At the time shown in the chart, $SOLV is trading around 0.00465 USDT, with a 24-hour high near 0.00473 and a low around 0.00367. The token has gained significantly during the recent move, making the current price action an interesting area to watch.
The most important point is the 0.00473 resistance zone. Price recently moved close to this level but faced some selling pressure, creating a small pullback. If $SOLV can break above 0.00473 with strong volume and maintain that level, it could indicate that buyers are still in control.#SOLV
#SolvProtocol
#SOLVUSDT
#Crypto
#DeFi
SOLV/USDT Technical Analysis: Can the Current Momentum Continue?
$SOLV /USDT has recently shown strong upward momentum on the 15-minute chart. At the time shown in the chart, $SOLV is trading around 0.00465 USDT, with a 24-hour high near 0.00473 and a low around 0.00367. The token has gained significantly during the recent move, making the current price action an interesting area to watch.
The most important point is the 0.00473 resistance zone. Price recently moved close to this level but faced some selling pressure, creating a small pullback. If $SOLV can break above 0.00473 with strong volume and maintain that level, it could indicate that buyers are still in control.#SOLV
#SolvProtocol
#SOLVUSDT
#Crypto
#DeFi
$SOLV /USDT has recently shown strong upward momentum on the 15-minute chart. At the time shown in the chart, $SOLV is trading around 0.00465 USDT, with a 24-hour high near 0.00473 and a low around 0.00367. The token has gained significantly during the recent move, making the current price action an interesting area to watch.
The most important point is the 0.00473 resistance zone. Price recently moved close to this level but faced some selling pressure, creating a small pullback. If $SOLV can break above 0.00473 with strong volume and maintain that level, it could indicate that buyers are still in control.#SOLV
#SolvProtocol
#SOLVUSDT
#Crypto
#DeFi
37
Artikel
Übersetzung ansehen
SOLV/USDT Technical Analysis: Can the Current Momentum Continue$SOLV /USDT has recently shown strong upward momentum on the 15-minute chart. At the time shown in the chart, $SOLV is trading around 0.00465 USDT, with a 24-hour high near 0.00473 and a low around 0.00367. The token has gained significantly during the recent move, making the current price action an interesting area to watch.
The most important point is the 0.00473 resistance zone. Price recently moved close to this level but faced some selling pressure, creating a small pullback. If $SOLV can break above 0.00473 with strong volume and maintain that level, it could indicate that buyers are still in control.
Another positive sign is the position of the moving averages. The chart shows MA(7) around 0.00458, MA(25) around 0.00448, and MA(99) around 0.00400. The shorter moving averages are positioned above the longer-term average, which generally reflects positive short-term momentum. However, moving averages are lagging indicators and should not be considered a guarantee of future movement.
For the coming days, 0.00450–0.00460 can be an important short-term area to observe. If price remains above this zone, the bullish structure could remain intact. A successful breakout above 0.00473 could bring psychological levels such as 0.00500 into focus. If momentum and trading volume remain strong, higher levels such as 0.00550–0.00600 could become possible future areas of interest. These are scenarios, not confirmed targets.
On the other hand, SOLV could also experience a correction after its strong rise. If the price falls below the short-term moving averages and loses the 0.00400 area, the bullish momentum would weaken. The next major support visible from the chart is around 0.00367. A move toward this area would represent a much deeper correction compared with the current price.
Volume will therefore be an important factor. A breakout accompanied by increasing volume would generally provide stronger confirmation than a breakout occurring on weak volume. Similarly, a sharp decline with high selling volume could signal increased bearish pressure.
My Weekly View
For the next week, SOLV/USDT appears to have two possible scenarios. In a bullish scenario, holding above the current support area and breaking 0.00473 could open the way toward 0.00500 and potentially higher levels. In a bearish scenario, rejection near 0.00473 followed by a break below 0.00400 could push the price toward 0.00367.
Overall, SOLV is currently showing strong momentum, but after a rapid rise, volatility can remain high. Traders and investors should watch support, resistance, volume, and market conditions rather than relying on a single indicator.
#SOLV
#SolvProtocol
#SOLVUSDT
#Crypto
#DeFi
SOLV/USDT Technical Analysis: Can the Current Momentum Continue
$SOLV /USDT has recently shown strong upward momentum on the 15-minute chart. At the time shown in the chart, $SOLV is trading around 0.00465 USDT, with a 24-hour high near 0.00473 and a low around 0.00367. The token has gained significantly during the recent move, making the current price action an interesting area to watch.
The most important point is the 0.00473 resistance zone. Price recently moved close to this level but faced some selling pressure, creating a small pullback. If $SOLV can break above 0.00473 with strong volume and maintain that level, it could indicate that buyers are still in control.
Another positive sign is the position of the moving averages. The chart shows MA(7) around 0.00458, MA(25) around 0.00448, and MA(99) around 0.00400. The shorter moving averages are positioned above the longer-term average, which generally reflects positive short-term momentum. However, moving averages are lagging indicators and should not be considered a guarantee of future movement.
For the coming days, 0.00450–0.00460 can be an important short-term area to observe. If price remains above this zone, the bullish structure could remain intact. A successful breakout above 0.00473 could bring psychological levels such as 0.00500 into focus. If momentum and trading volume remain strong, higher levels such as 0.00550–0.00600 could become possible future areas of interest. These are scenarios, not confirmed targets.
On the other hand, SOLV could also experience a correction after its strong rise. If the price falls below the short-term moving averages and loses the 0.00400 area, the bullish momentum would weaken. The next major support visible from the chart is around 0.00367. A move toward this area would represent a much deeper correction compared with the current price.
Volume will therefore be an important factor. A breakout accompanied by increasing volume would generally provide stronger confirmation than a breakout occurring on weak volume. Similarly, a sharp decline with high selling volume could signal increased bearish pressure.
My Weekly View
For the next week, SOLV/USDT appears to have two possible scenarios. In a bullish scenario, holding above the current support area and breaking 0.00473 could open the way toward 0.00500 and potentially higher levels. In a bearish scenario, rejection near 0.00473 followed by a break below 0.00400 could push the price toward 0.00367.
Overall, SOLV is currently showing strong momentum, but after a rapid rise, volatility can remain high. Traders and investors should watch support, resistance, volume, and market conditions rather than relying on a single indicator.
#SOLV
#SolvProtocol
#SOLVUSDT
#Crypto
#DeFi
The most important point is the 0.00473 resistance zone. Price recently moved close to this level but faced some selling pressure, creating a small pullback. If $SOLV can break above 0.00473 with strong volume and maintain that level, it could indicate that buyers are still in control.
Another positive sign is the position of the moving averages. The chart shows MA(7) around 0.00458, MA(25) around 0.00448, and MA(99) around 0.00400. The shorter moving averages are positioned above the longer-term average, which generally reflects positive short-term momentum. However, moving averages are lagging indicators and should not be considered a guarantee of future movement.
For the coming days, 0.00450–0.00460 can be an important short-term area to observe. If price remains above this zone, the bullish structure could remain intact. A successful breakout above 0.00473 could bring psychological levels such as 0.00500 into focus. If momentum and trading volume remain strong, higher levels such as 0.00550–0.00600 could become possible future areas of interest. These are scenarios, not confirmed targets.
On the other hand, SOLV could also experience a correction after its strong rise. If the price falls below the short-term moving averages and loses the 0.00400 area, the bullish momentum would weaken. The next major support visible from the chart is around 0.00367. A move toward this area would represent a much deeper correction compared with the current price.
Volume will therefore be an important factor. A breakout accompanied by increasing volume would generally provide stronger confirmation than a breakout occurring on weak volume. Similarly, a sharp decline with high selling volume could signal increased bearish pressure.
My Weekly View
For the next week, SOLV/USDT appears to have two possible scenarios. In a bullish scenario, holding above the current support area and breaking 0.00473 could open the way toward 0.00500 and potentially higher levels. In a bearish scenario, rejection near 0.00473 followed by a break below 0.00400 could push the price toward 0.00367.
Overall, SOLV is currently showing strong momentum, but after a rapid rise, volatility can remain high. Traders and investors should watch support, resistance, volume, and market conditions rather than relying on a single indicator.
#SOLV
#SolvProtocol
#SOLVUSDT
#Crypto
#DeFi
77
CNPY Token-Preisanalysen: Kann CNPY sein zukünftiges Wachstum fortsetzen?$CNPY zeigt derzeit eine starke Aktivität am Markt und zieht die Aufmerksamkeit von Tradern sowie Krypto-Investoren auf sich. Im bereitgestellten Marktscreenshot wird $CNPY bei etwa $0.2478 gehandelt, während die angezeigte Kursbewegung einen deutlichen Anstieg von ungefähr 124% zeigt. Eine so starke Bewegung kann auf starkes Kaufinteresse hindeuten, kann aber auch zu höherer Volatilität führen und die Möglichkeit einer Kurskorrektur mit sich bringen.
Das im Diagramm dargestellte Orderbuch bietet einen interessanten Einblick in das aktuelle Kauf- und Verkaufsinteresse. Auf der Kaufseite gibt es mehrere Orders, die im Bereich von $0.248–$0.250 platziert sind. Eine besonders auffällige Kauforder erscheint bei etwa $0.24857, was darauf hindeutet, dass dieser Bereich zu einer wichtigen kurzfristigen Unterstützungszone werden könnte, falls Käufer ihn weiterhin verteidigen.
CNPY Token-Preisanalysen: Kann CNPY sein zukünftiges Wachstum fortsetzen?
$CNPY zeigt derzeit eine starke Aktivität am Markt und zieht die Aufmerksamkeit von Tradern sowie Krypto-Investoren auf sich. Im bereitgestellten Marktscreenshot wird $CNPY bei etwa $0.2478 gehandelt, während die angezeigte Kursbewegung einen deutlichen Anstieg von ungefähr 124% zeigt. Eine so starke Bewegung kann auf starkes Kaufinteresse hindeuten, kann aber auch zu höherer Volatilität führen und die Möglichkeit einer Kurskorrektur mit sich bringen.
Das im Diagramm dargestellte Orderbuch bietet einen interessanten Einblick in das aktuelle Kauf- und Verkaufsinteresse. Auf der Kaufseite gibt es mehrere Orders, die im Bereich von $0.248–$0.250 platziert sind. Eine besonders auffällige Kauforder erscheint bei etwa $0.24857, was darauf hindeutet, dass dieser Bereich zu einer wichtigen kurzfristigen Unterstützungszone werden könnte, falls Käufer ihn weiterhin verteidigen.
Das im Diagramm dargestellte Orderbuch bietet einen interessanten Einblick in das aktuelle Kauf- und Verkaufsinteresse. Auf der Kaufseite gibt es mehrere Orders, die im Bereich von $0.248–$0.250 platziert sind. Eine besonders auffällige Kauforder erscheint bei etwa $0.24857, was darauf hindeutet, dass dieser Bereich zu einer wichtigen kurzfristigen Unterstützungszone werden könnte, falls Käufer ihn weiterhin verteidigen.
540
Übersetzung ansehen
#MyFirstSquarePost New to Binance Square, thrilled to share and connect with everyone here!
#MyFirstSquarePost New to Binance Square, thrilled to share and connect with everyone here!
156
Anmelden und weiter Inhalte entdecken
Krypto-Nutzer weltweit auf Binance Square kennenlernen
⚡️ Bleib in Sachen Krypto stets am Puls.
💬 Die weltgrößte Kryptobörse vertraut darauf.
👍 Erhalte verlässliche Einblicke von verifizierten Creators.
E-Mail-Adresse/Telefonnummer
Trendthemen
FedRateWatch
864,242 Aufrufe
4,102 Kommentare
Teile & gewinne Traffic-Belohnungen in unserer Kampagne mit angesagtem Hashtag
✨Thema: FOMC September, Was ist der nächste Schritt der Fed?
👉So nimmst du teil:
Veröffentliche einen kurzen Beitrag oder Artikel mit dem Hashtag #FedRateWatch
Erstelle Inhalte basierend auf den folgenden Blickwinkeln:
- Der August-Core-CPI stieg um 0,3% im Monatsvergleich, und die Wahrscheinlichkeit für eine 25bp-Erhöhung diese Woche liegt nun bei fast 90%. Erwartest du diese Woche eine Zinserhöhung? Handelt es sich um einen einmaligen Schritt oder den Beginn eines längeren Zinserhöhungszyklus?
- Wenn die Erhöhung erfolgt: Wie entwickelt sich das für BTC, Tech-Aktien und Gold? Aufwärts- oder abwärtsgerichtet?
- Wie planst du als Nächstes zu handeln? Teile deinen BTC-, Aktien- oder Gold-Trade/Bestände mit unserem Trade-Sharing-Widget.
⏰Kampagnenzeitraum:
- 2026-09-15 11:00 - 2026-09-17 3:00 UTC
🎁Belohnung:
- Qualifizierte Beiträge, die die oben genannten Richtlinien erfüllen und mehr als 100 Wörter enthalten, werden überprüft und erhalten möglicherweise einen zufälligen Traffic-Boost von 500 bis 3.000 Aufrufen. Du erhältst eine Benachrichtigung von deiner Feed-Secretary, wenn dein Beitrag ausgewählt wird.
- Erhalte die Chance, dass dein Artikel auf Binance Square Official vorgestellt wird
Du brauchst Ideen für deinen Beitrag? Besuche die Themenseite #FedRateWatch oder die Square Guide on How to Post for Better Reach.
Binance Square Official
·503 Likes
·1.1M Aufrufe
BitcoinFalls4%
4,569 Aufrufe
220 Kommentare
SKHynixInTalksToMakeMemoryChipsInUS
1,753 Aufrufe
53 Kommentare