
ShaziaAsghar0786
26 Beiträge

ShaziaAsghar0786
Melden
Nutzer blockieren
50 Following
15 Follower
0 Like gegeben
Beiträge
Übersetzung ansehen
##$$##1 hour Bullish
4 hours Sideways
Daily Sideways
Weekly Mixed
Important levels
Breakout watch: $0.2699
Support watch: $0.2600
Lower support: $0.2422
Based on November 19 market and technical snapshots, not a guaranteed forecast.
9. Binance live chart
Open JUP/USDT on Binance
My conclusion: JUP has an active DeFi ecosystem and improving short-term momentum. However, a strong daily breakout is not yet confirmed. Watch $0.2699 and trading volume before making a trading decision.
This is educational analysis, not financial advice.
#BTCRemainsUnderPressureAfterHawkishFOMCMinutes ##
{spot}(JUPUSDT)
##$$##1 hour Bullish
4 hours Sideways
Daily Sideways
Weekly Mixed
Important levels
Breakout watch: $0.2699
Support watch: $0.2600
Lower support: $0.2422
Based on November 19 market and technical snapshots, not a guaranteed forecast.
9. Binance live chart
Open JUP/USDT on Binance
My conclusion: JUP has an active DeFi ecosystem and improving short-term momentum. However, a strong daily breakout is not yet confirmed. Watch $0.2699 and trading volume before making a trading decision.
This is educational analysis, not financial advice.
#BTCRemainsUnderPressureAfterHawkishFOMCMinutes ##
4 hours Sideways
Daily Sideways
Weekly Mixed
Important levels
Breakout watch: $0.2699
Support watch: $0.2600
Lower support: $0.2422
Based on November 19 market and technical snapshots, not a guaranteed forecast.
9. Binance live chart
Open JUP/USDT on Binance
My conclusion: JUP has an active DeFi ecosystem and improving short-term momentum. However, a strong daily breakout is not yet confirmed. Watch $0.2699 and trading volume before making a trading decision.
This is educational analysis, not financial advice.
#BTCRemainsUnderPressureAfterHawkishFOMCMinutes ##

4
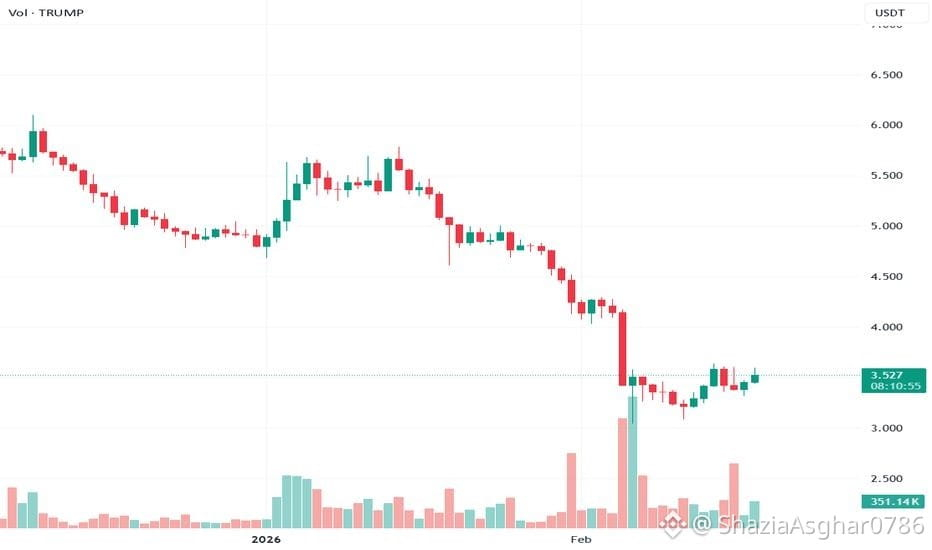
###$$$###Für tatsächliche Live-Kerzen verwenden Sie den Binance-Chart anstelle der illustrativen Grafik.
7. Aktuelle Marktnachrichten und Risiken
Token-Freigaben können den Verkaufsdruck erhöhen.
Meme-Coin-Preise können stark auf politische Nachrichten und soziale Medien reagieren.
Eine konzentrierte Token-Verteilung birgt ein zusätzliches Angebotsrisiko.
Ein hohes Handelsvolumen garantiert kein nachhaltiges Preiswachstum.
8. Binance-Live-Chart
TRUMP/USDT-Binance-Chart öffnen
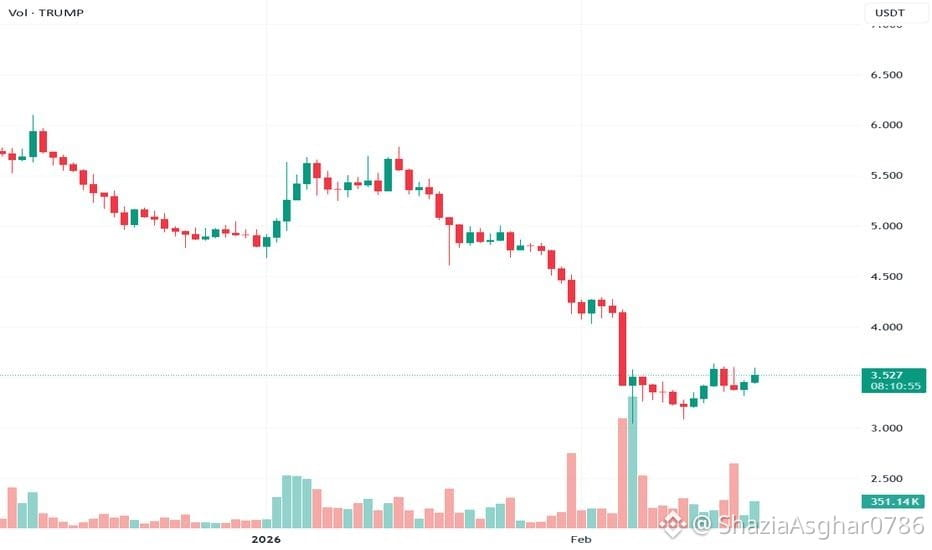
Abschließende Analyse: TRUMP zeigt eine leichte Erholung innerhalb von 24 Stunden, eine anhaltende bullische Trendwende ist jedoch nicht bestätigt. Achten Sie bei einem Ausbruch oder Einbruch auf 0,9769 $ und 0,9209 $.
Nur zu Bildungszwecken. Keine Anlageberatung.
#MASToUpgradeSGDTestnetToSGDigitalLedger ##
{future}(TRUMPUSDT)
###$$$###Für tatsächliche Live-Kerzen verwenden Sie den Binance-Chart anstelle der illustrativen Grafik.
7. Aktuelle Marktnachrichten und Risiken
Token-Freigaben können den Verkaufsdruck erhöhen.
Meme-Coin-Preise können stark auf politische Nachrichten und soziale Medien reagieren.
Eine konzentrierte Token-Verteilung birgt ein zusätzliches Angebotsrisiko.
Ein hohes Handelsvolumen garantiert kein nachhaltiges Preiswachstum.
8. Binance-Live-Chart
TRUMP/USDT-Binance-Chart öffnen
Abschließende Analyse: TRUMP zeigt eine leichte Erholung innerhalb von 24 Stunden, eine anhaltende bullische Trendwende ist jedoch nicht bestätigt. Achten Sie bei einem Ausbruch oder Einbruch auf 0,9769 $ und 0,9209 $.
Nur zu Bildungszwecken. Keine Anlageberatung.
#MASToUpgradeSGDTestnetToSGDigitalLedger ##
7. Aktuelle Marktnachrichten und Risiken
Token-Freigaben können den Verkaufsdruck erhöhen.
Meme-Coin-Preise können stark auf politische Nachrichten und soziale Medien reagieren.
Eine konzentrierte Token-Verteilung birgt ein zusätzliches Angebotsrisiko.
Ein hohes Handelsvolumen garantiert kein nachhaltiges Preiswachstum.
8. Binance-Live-Chart
TRUMP/USDT-Binance-Chart öffnen
Abschließende Analyse: TRUMP zeigt eine leichte Erholung innerhalb von 24 Stunden, eine anhaltende bullische Trendwende ist jedoch nicht bestätigt. Achten Sie bei einem Ausbruch oder Einbruch auf 0,9769 $ und 0,9209 $.
Nur zu Bildungszwecken. Keine Anlageberatung.
#MASToUpgradeSGDTestnetToSGDigitalLedger ##
77
Bärisch: Ein Durchbruch unter $48.50 könnte ##$$$##$43.95 in den Fokus rücken.
Bestätigung: RSI, Volumen und die Entwicklung des Halbleitersektors gemeinsam beobachten.
7. Hauptrisiken
Täglicher 3x-Hebel und Zinseszinseffekt.
Plötzliche Kursrückgänge bei Halbleiteraktien.
Hohe Preisvolatilität.
Liquiditätsrisiken und Risiken tokenisierter Wertpapiere.
Regulierungs- und emittentenbezogene Risiken.
8. Binance-Chart
$SOXLB/USDT auf Binance öffnen
Abschließende Kurzmeinung:$ SOXLB bietet ein Engagement im Halbleitersektor und Aufwärtspotenzial, wenn Chipaktien steigen. Der tägliche 3x-Hebel macht die Anlage jedoch extrem riskant. Meine kurzfristige Einschätzung ist vorsichtig. Betrachte sie nicht wie eine gewöhnliche langfristige Kryptoanlage.
Nur zu Bildungszwecken, keine Finanzberatung.
#MASToUpgradeSGDTestnetToSGDigitalLedger ###
{spot}(SOXLBUSDT)
Bärisch: Ein Durchbruch unter $48.50 könnte ##$$$##$43.95 in den Fokus rücken.
Bestätigung: RSI, Volumen und die Entwicklung des Halbleitersektors gemeinsam beobachten.
7. Hauptrisiken
Täglicher 3x-Hebel und Zinseszinseffekt.
Plötzliche Kursrückgänge bei Halbleiteraktien.
Hohe Preisvolatilität.
Liquiditätsrisiken und Risiken tokenisierter Wertpapiere.
Regulierungs- und emittentenbezogene Risiken.
8. Binance-Chart
$SOXLB/USDT auf Binance öffnen
Abschließende Kurzmeinung:$ SOXLB bietet ein Engagement im Halbleitersektor und Aufwärtspotenzial, wenn Chipaktien steigen. Der tägliche 3x-Hebel macht die Anlage jedoch extrem riskant. Meine kurzfristige Einschätzung ist vorsichtig. Betrachte sie nicht wie eine gewöhnliche langfristige Kryptoanlage.
Nur zu Bildungszwecken, keine Finanzberatung.
#MASToUpgradeSGDTestnetToSGDigitalLedger ###
Bestätigung: RSI, Volumen und die Entwicklung des Halbleitersektors gemeinsam beobachten.
7. Hauptrisiken
Täglicher 3x-Hebel und Zinseszinseffekt.
Plötzliche Kursrückgänge bei Halbleiteraktien.
Hohe Preisvolatilität.
Liquiditätsrisiken und Risiken tokenisierter Wertpapiere.
Regulierungs- und emittentenbezogene Risiken.
8. Binance-Chart
$SOXLB/USDT auf Binance öffnen
Abschließende Kurzmeinung:$ SOXLB bietet ein Engagement im Halbleitersektor und Aufwärtspotenzial, wenn Chipaktien steigen. Der tägliche 3x-Hebel macht die Anlage jedoch extrem riskant. Meine kurzfristige Einschätzung ist vorsichtig. Betrachte sie nicht wie eine gewöhnliche langfristige Kryptoanlage.
Nur zu Bildungszwecken, keine Finanzberatung.
#MASToUpgradeSGDTestnetToSGDigitalLedger ###

67
Übersetzung ansehen
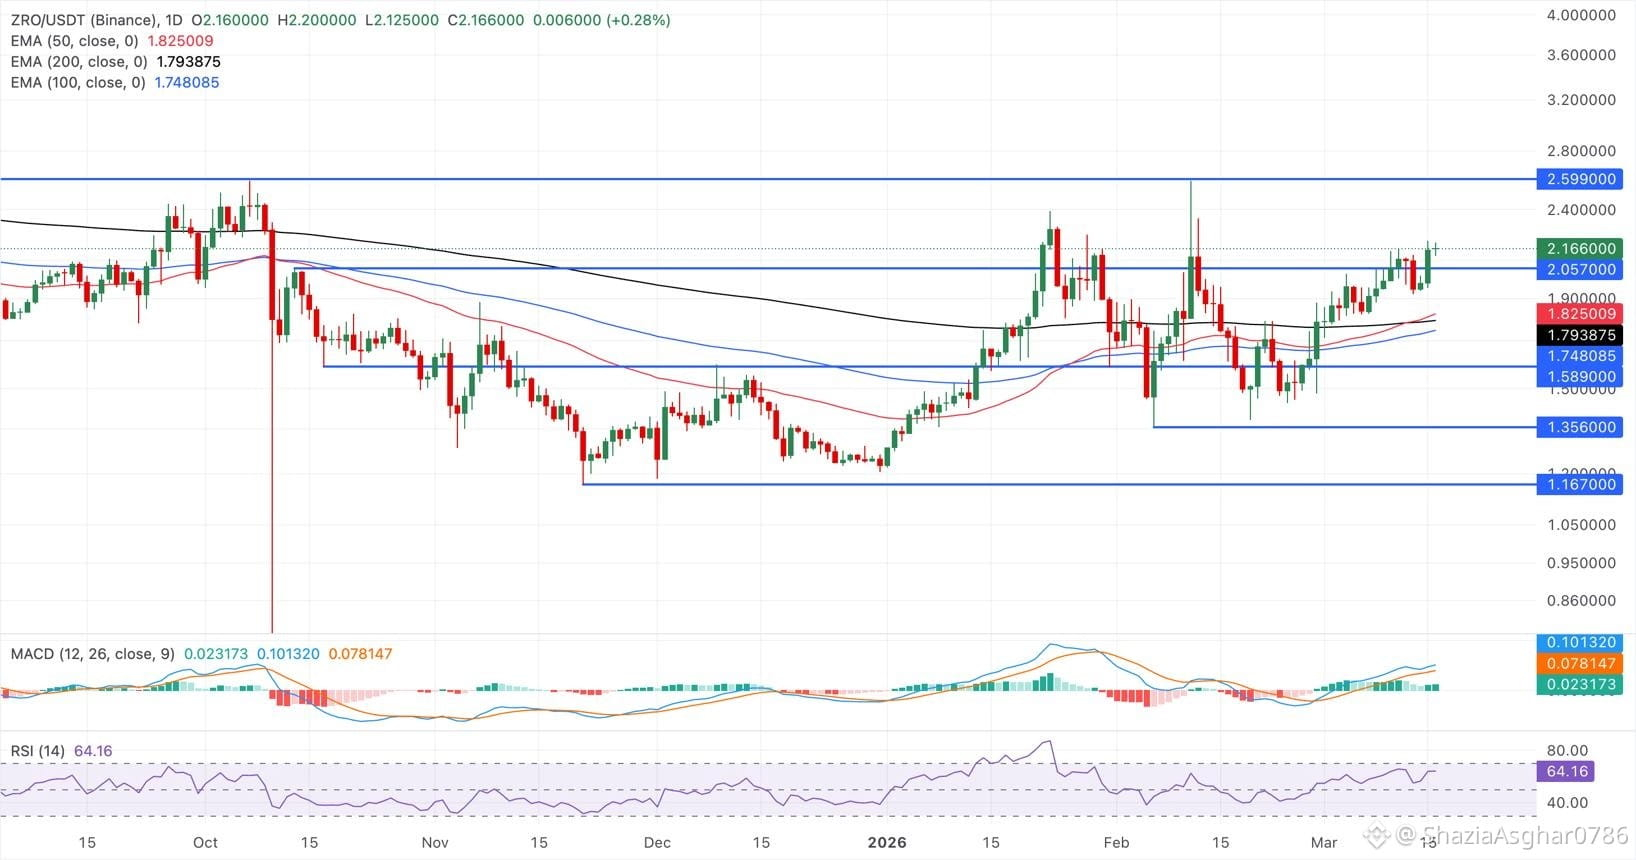
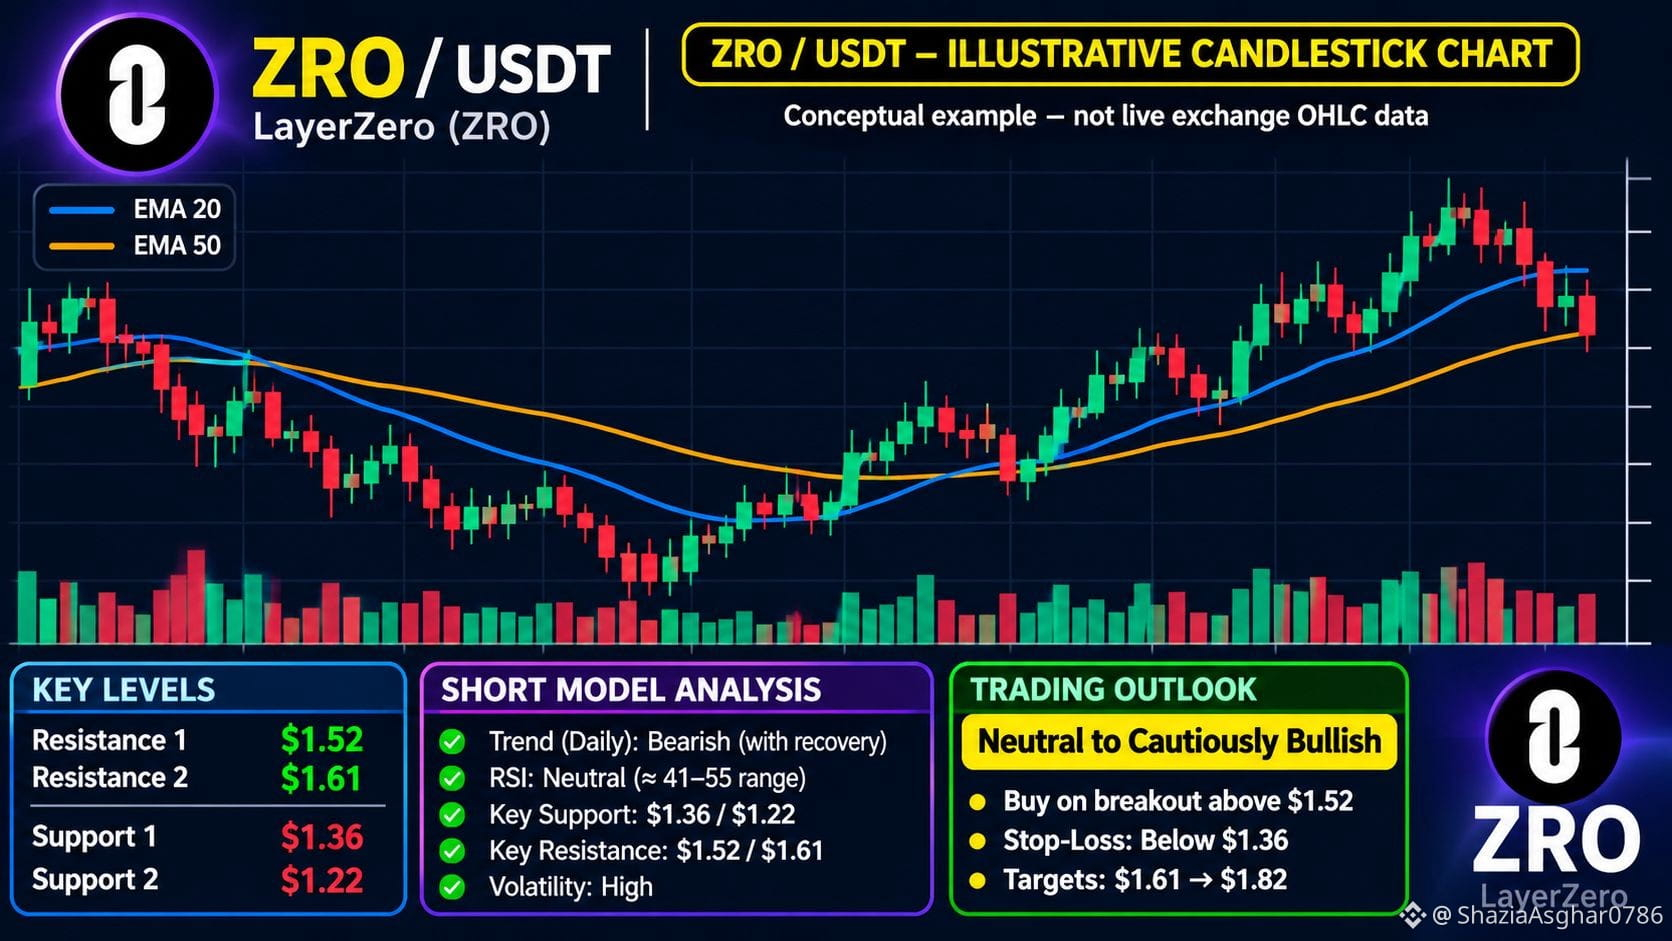
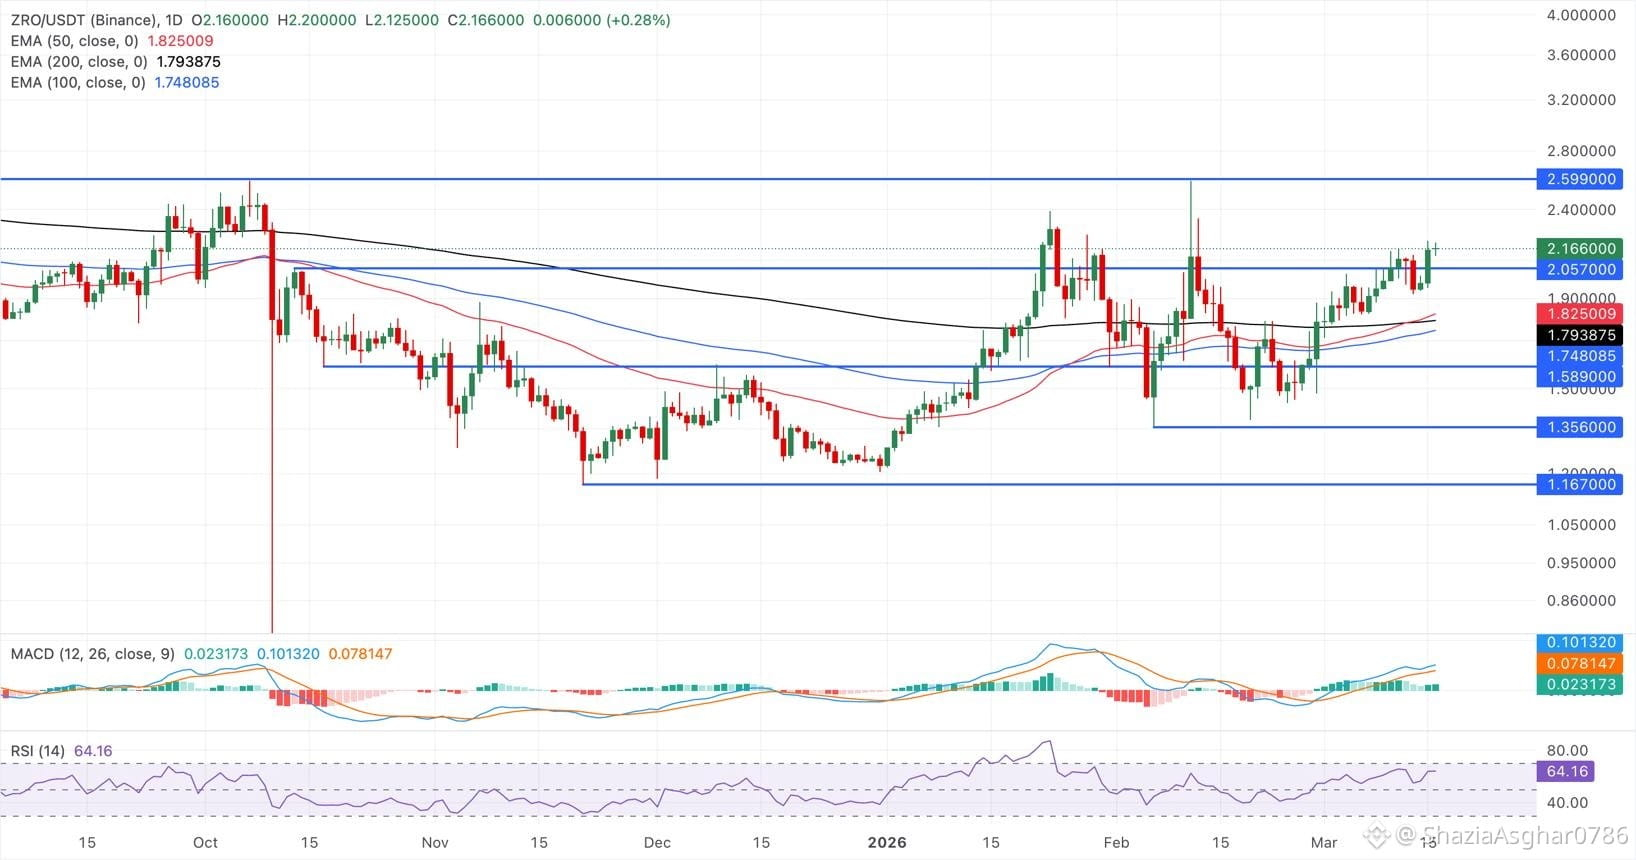
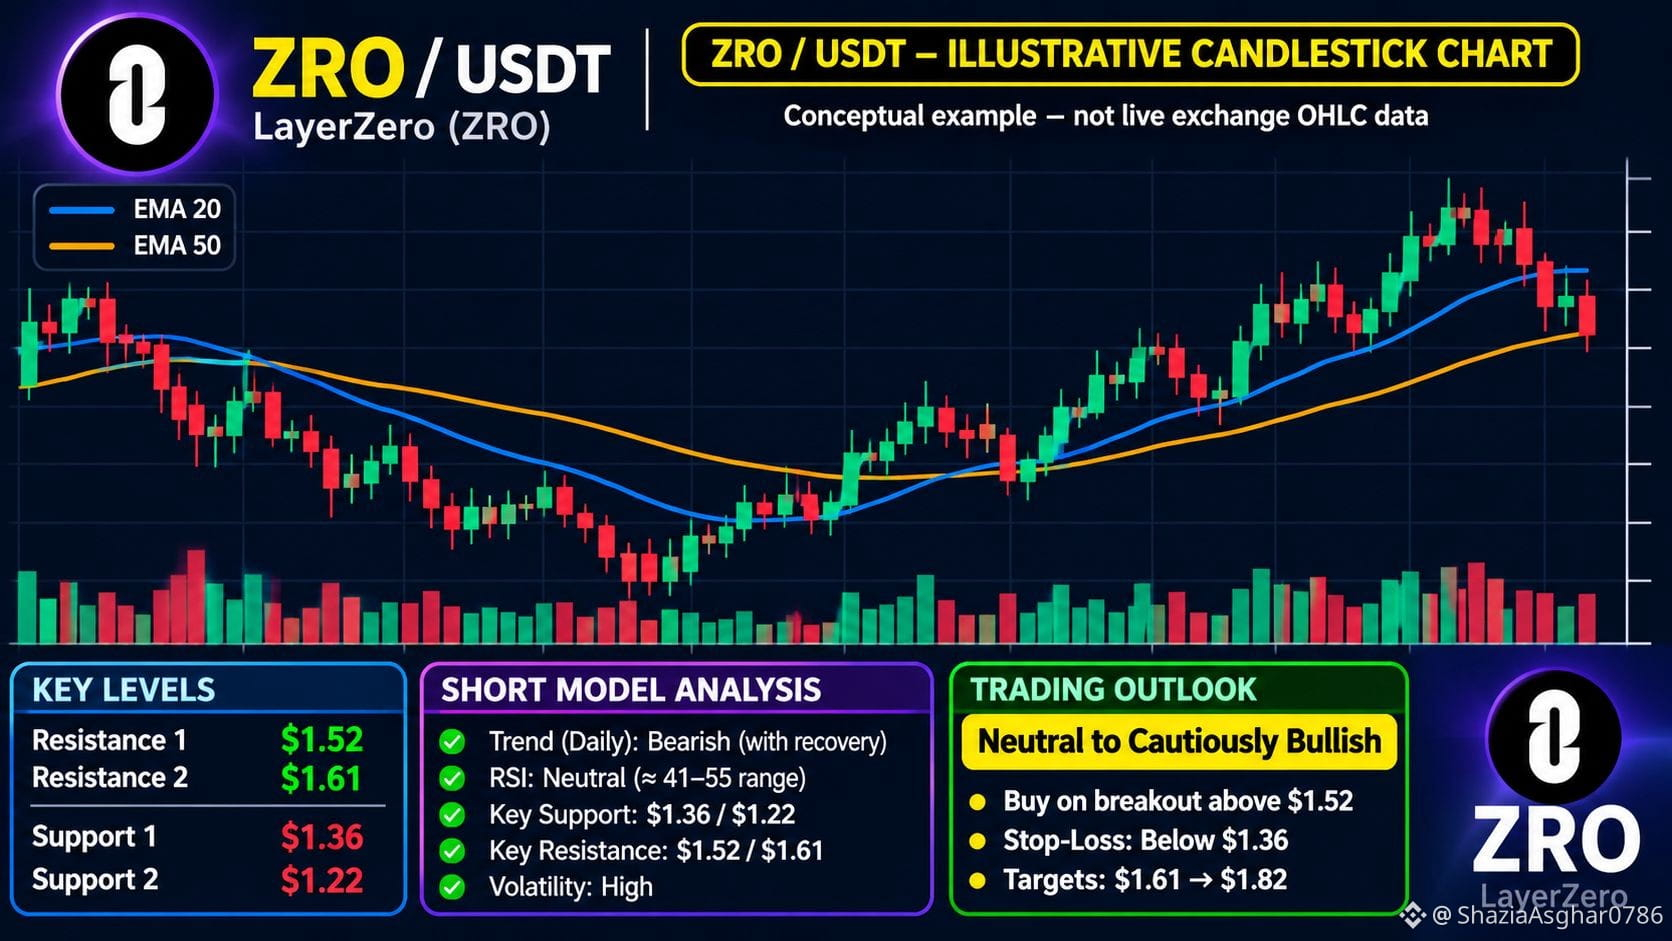
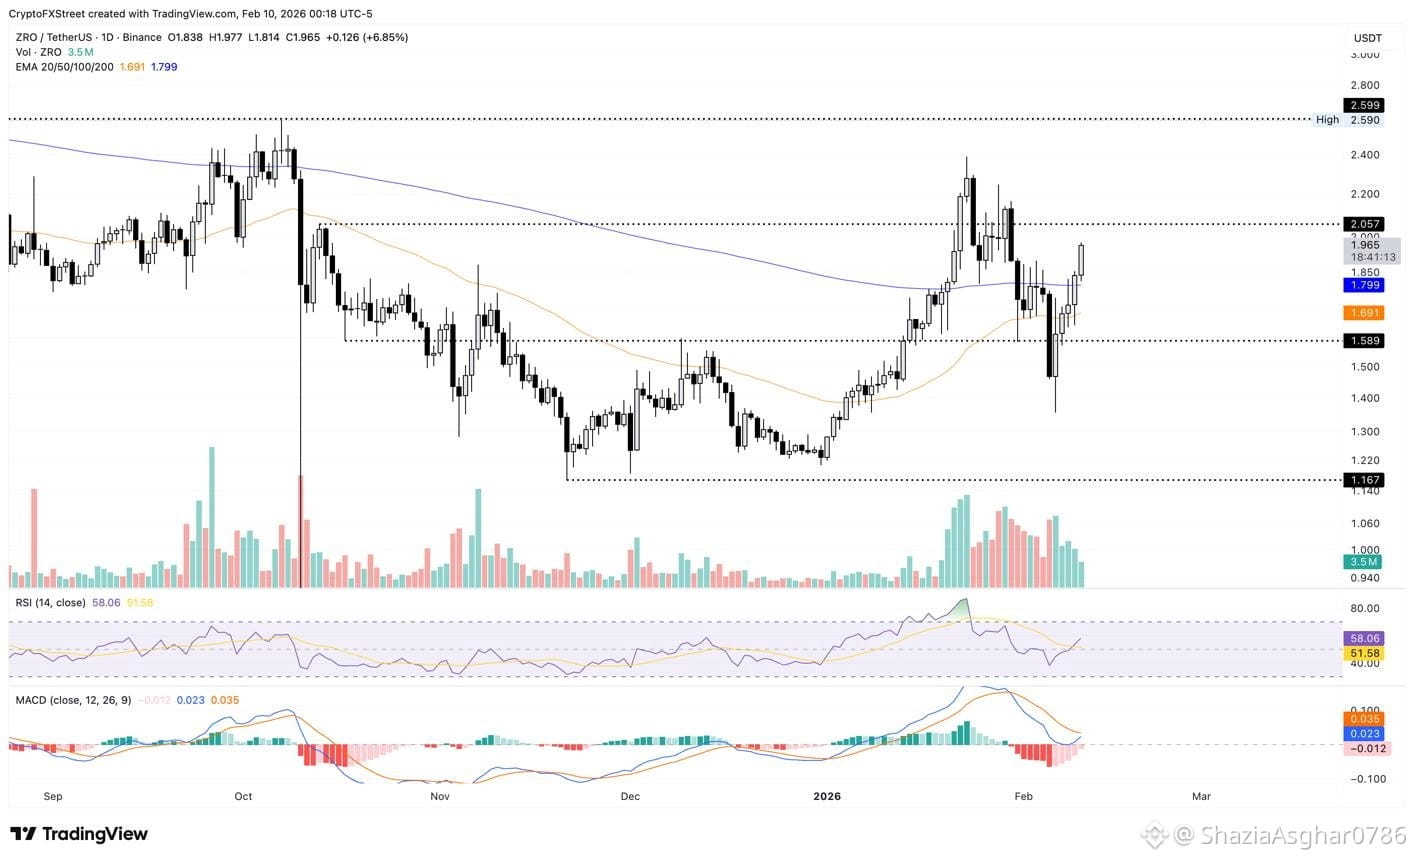
###$$$##First upside target: $1.61.
Next possible target: $1.82.
Bearish signal: Price falls below $1.36.
Downside reference: $1.22.
These are scenarios, not guaranteed predictions.
7. Token unlock warning
Around 23.63 million ZRO tokens, worth approximately $33.86 million at the reported price, are listed in the November 19 unlock schedule. This could increase selling pressure.
8. Official Binance chart
Open ZRO/USDT Binance Chart
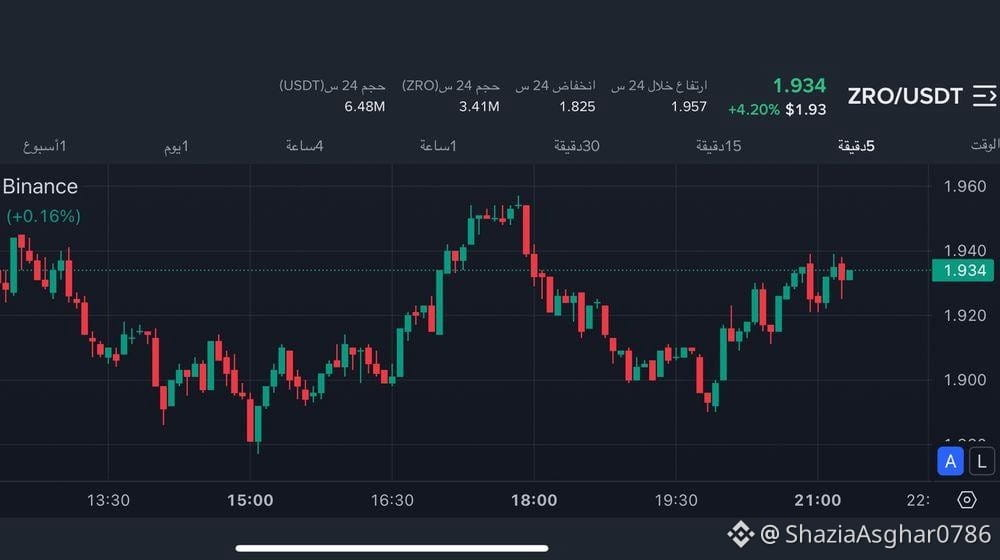
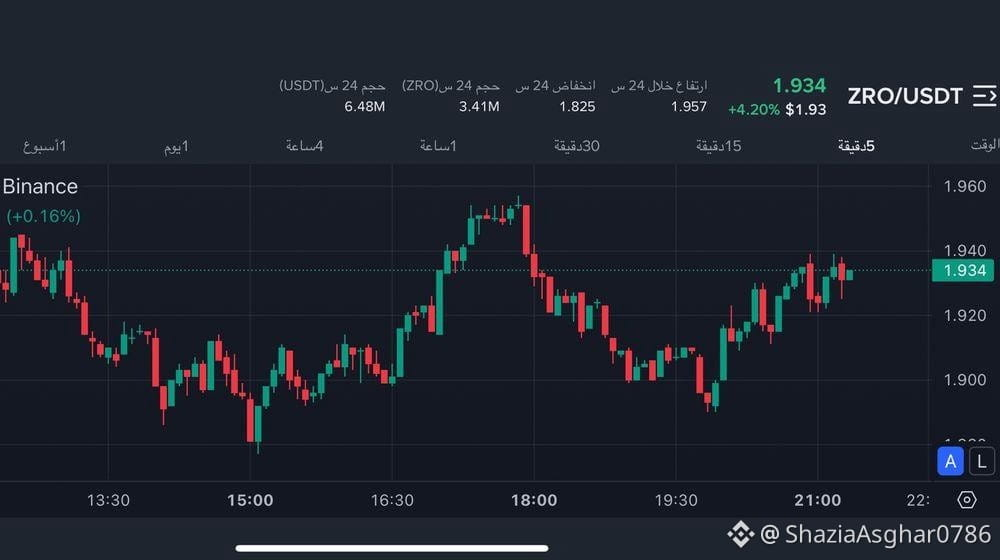
Final opinion: ZRO has a promising cross-chain project, but its daily trend is still weak. Wait for breakout confirmation instead of buying only because the price has risen 24 hours.
All analysis is educational, not financial advice.
##BTCRemainsUnderPressureAfterHawkishFOMCMinutes
{spot}(ZROUSDT)
###$$$##First upside target: $1.61.
Next possible target: $1.82.
Bearish signal: Price falls below $1.36.
Downside reference: $1.22.
These are scenarios, not guaranteed predictions.
7. Token unlock warning
Around 23.63 million ZRO tokens, worth approximately $33.86 million at the reported price, are listed in the November 19 unlock schedule. This could increase selling pressure.
8. Official Binance chart
Open ZRO/USDT Binance Chart
Final opinion: ZRO has a promising cross-chain project, but its daily trend is still weak. Wait for breakout confirmation instead of buying only because the price has risen 24 hours.
All analysis is educational, not financial advice.
##BTCRemainsUnderPressureAfterHawkishFOMCMinutes
Next possible target: $1.82.
Bearish signal: Price falls below $1.36.
Downside reference: $1.22.
These are scenarios, not guaranteed predictions.
7. Token unlock warning
Around 23.63 million ZRO tokens, worth approximately $33.86 million at the reported price, are listed in the November 19 unlock schedule. This could increase selling pressure.
8. Official Binance chart
Open ZRO/USDT Binance Chart
Final opinion: ZRO has a promising cross-chain project, but its daily trend is still weak. Wait for breakout confirmation instead of buying only because the price has risen 24 hours.
All analysis is educational, not financial advice.
##BTCRemainsUnderPressureAfterHawkishFOMCMinutes
18
Übersetzung ansehen
###$$$###My short-term opinion: BOTB has shown positive recovery momentum, but buying after a sharp upward move can be risky. Waiting for a confirmed breakout or a support retest is a more disciplined approach.
This is an educational trading setup, not a guaranteed prediction or personalized financial advice.
7. Binance Square post – Ready to publish8. Important risks
BOTB is a tokenized security, not a normal cryptocurrency.
Check your jurisdiction's eligibility before trading.
Liquidity and spreads can change quickly.
Tokenized securities have issuer, custody, redemption and regulatory risks.
Official BOTB contract address
My recommendation: Use the Binance 1-hour and 4-hour charts to confirm the trend before making a trade.
#BTCRemainsUnderPressureAfterHawkishFOMCMinutes ##
{spot}(BOTBUSDT)
###$$$###My short-term opinion: BOTB has shown positive recovery momentum, but buying after a sharp upward move can be risky. Waiting for a confirmed breakout or a support retest is a more disciplined approach.
This is an educational trading setup, not a guaranteed prediction or personalized financial advice.
7. Binance Square post – Ready to publish8. Important risks
BOTB is a tokenized security, not a normal cryptocurrency.
Check your jurisdiction's eligibility before trading.
Liquidity and spreads can change quickly.
Tokenized securities have issuer, custody, redemption and regulatory risks.
Official BOTB contract address
My recommendation: Use the Binance 1-hour and 4-hour charts to confirm the trend before making a trade.
#BTCRemainsUnderPressureAfterHawkishFOMCMinutes ##
This is an educational trading setup, not a guaranteed prediction or personalized financial advice.
7. Binance Square post – Ready to publish8. Important risks
BOTB is a tokenized security, not a normal cryptocurrency.
Check your jurisdiction's eligibility before trading.
Liquidity and spreads can change quickly.
Tokenized securities have issuer, custody, redemption and regulatory risks.
Official BOTB contract address
My recommendation: Use the Binance 1-hour and 4-hour charts to confirm the trend before making a trade.
#BTCRemainsUnderPressureAfterHawkishFOMCMinutes ##
57
Übersetzung ansehen
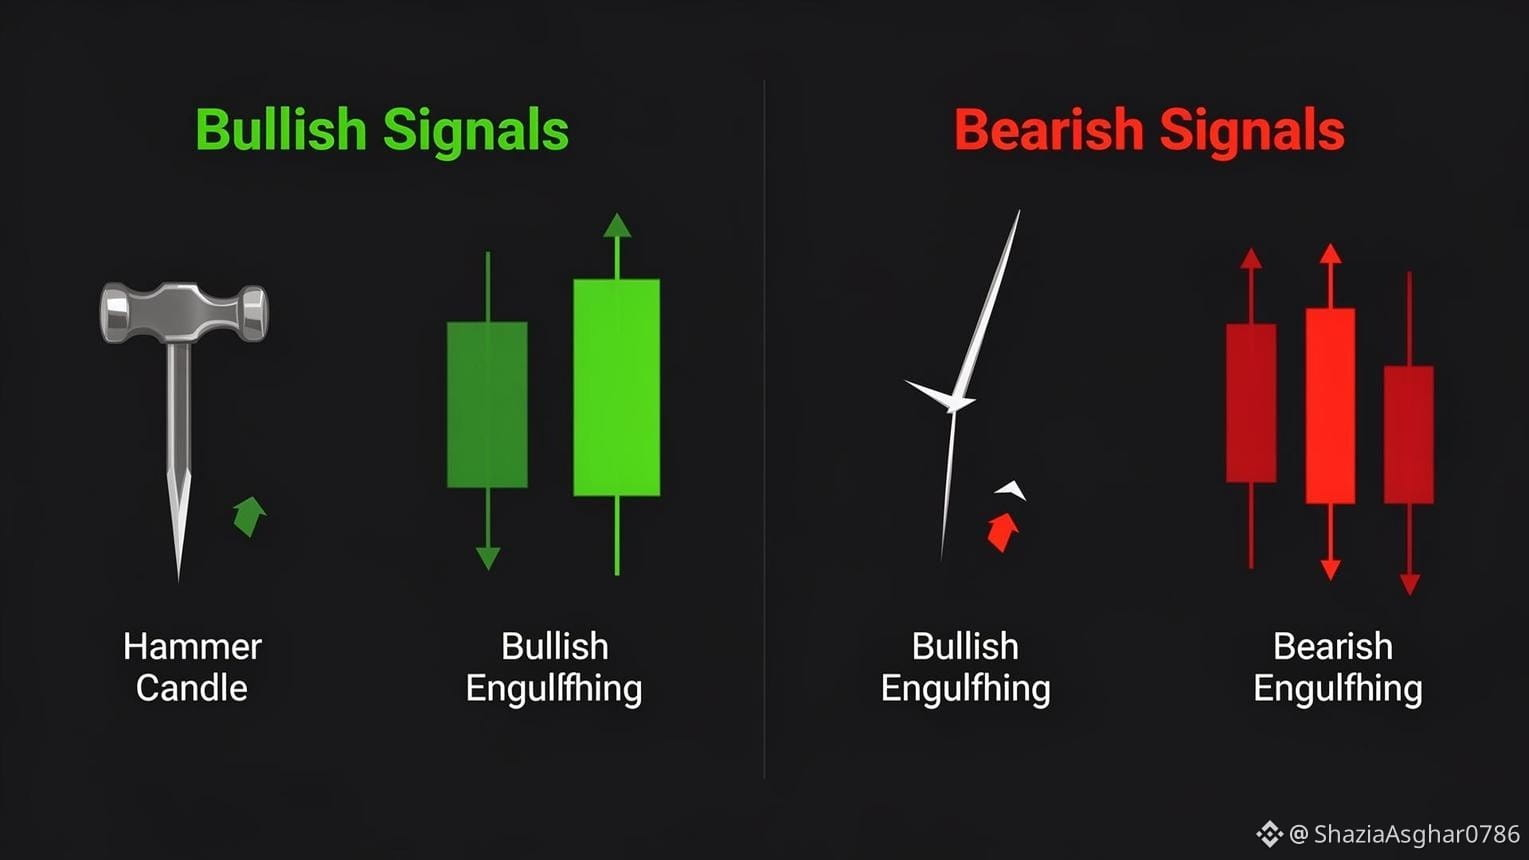
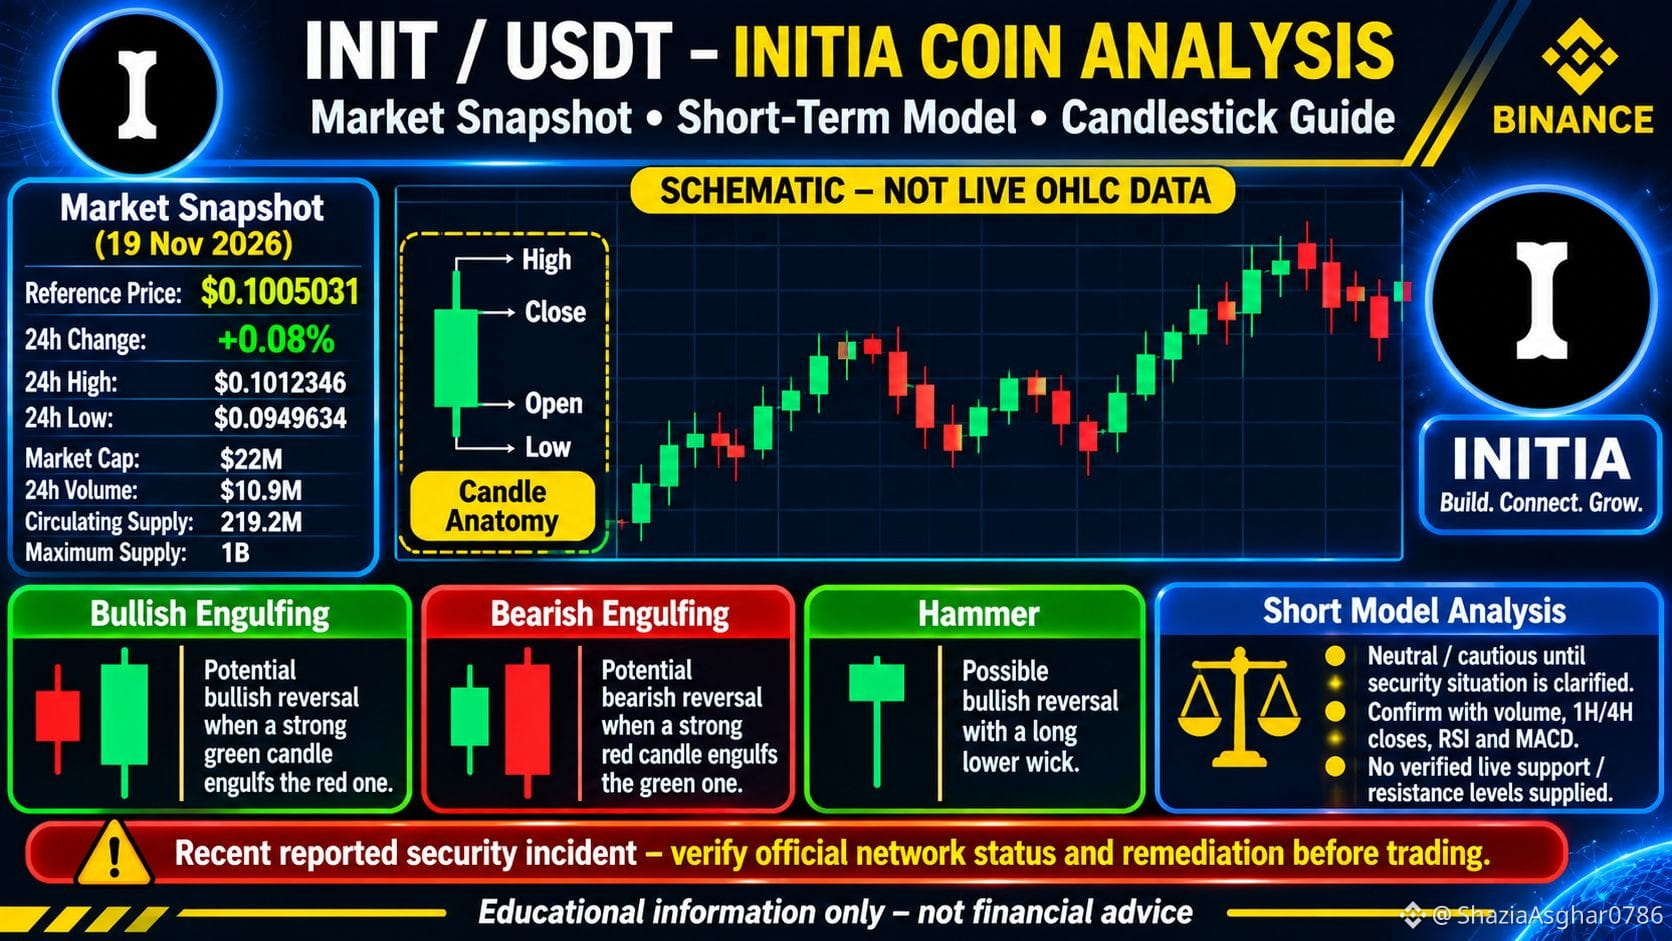
##$$$##The generated INIT chart infographic above is an educational illustration, not live historical OHLC data.
Important patterns:
Bullish Engulfing – potential upward reversal.
Bearish Engulfing – potential downward reversal.
Hammer – possible bullish reversal.
Doji – market indecision.
9. Ready-to-Publish Binance Square Article10. Official Research Links
Initia Official Website
Initia Documentation
Binance INIT Price
CoinGecko INIT Market Data
Initia Blockchain Explorer
My final recommendation: Your Binance Square post should include the generated chart infographic and the security warning. Do not describe INIT as a confirmed bullish investment until the network's security situation is independently verifie
##CanGTA6'sLaunchLiftTTWOShares? ##
{spot}(INITUSDT)
##$$$##The generated INIT chart infographic above is an educational illustration, not live historical OHLC data.
Important patterns:
Bullish Engulfing – potential upward reversal.
Bearish Engulfing – potential downward reversal.
Hammer – possible bullish reversal.
Doji – market indecision.
9. Ready-to-Publish Binance Square Article10. Official Research Links
Initia Official Website
Initia Documentation
Binance INIT Price
CoinGecko INIT Market Data
Initia Blockchain Explorer
My final recommendation: Your Binance Square post should include the generated chart infographic and the security warning. Do not describe INIT as a confirmed bullish investment until the network's security situation is independently verifie
##CanGTA6'sLaunchLiftTTWOShares? ##
Important patterns:
Bullish Engulfing – potential upward reversal.
Bearish Engulfing – potential downward reversal.
Hammer – possible bullish reversal.
Doji – market indecision.
9. Ready-to-Publish Binance Square Article10. Official Research Links
Initia Official Website
Initia Documentation
Binance INIT Price
CoinGecko INIT Market Data
Initia Blockchain Explorer
My final recommendation: Your Binance Square post should include the generated chart infographic and the security warning. Do not describe INIT as a confirmed bullish investment until the network's security situation is independently verifie
##CanGTA6'sLaunchLiftTTWOShares? ##
267
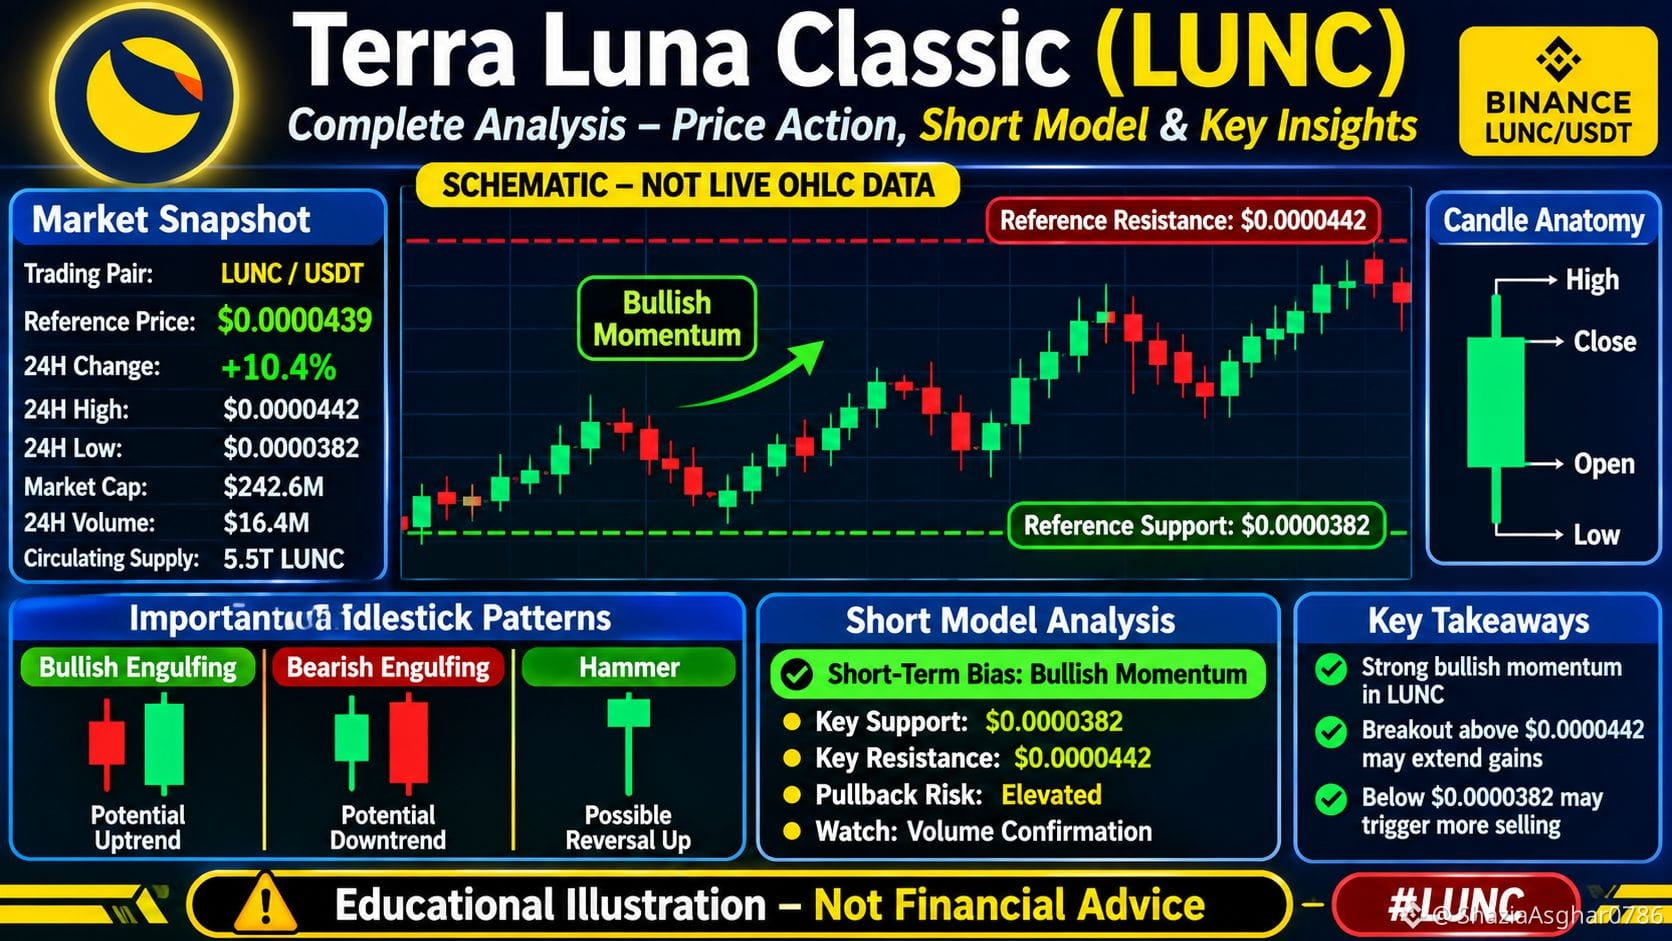
###$$$##Meine Analyse: LUNC hat eine etablierte Community und eine aktive Blockchain, aber aufgrund seines großen Token-Angebots und seiner Geschichte ist die Kryptowährung mit hohen Risiken verbunden. Eine nachhaltige Nutzung des Ökosystems und ein umsichtiges Angebotsmanagement werden für die Zukunft wichtig sein.
9. Wichtige Handelsrisiken
Plötzliche Kursschwankungen.
Großes umlaufendes Token-Angebot.
Ungewisse Token-Burn-Raten.
Marktmanipulation und spekulativer Handel.
Änderungen in der Community-Governance.
Mögliche Verluste durch den Hebel beim Futures-Handel.
Investiere niemals Geld, dessen Verlust du dir nicht leisten kannst.
10. Veröffentlichungsfertiger Artikel für Binance Square
Du kannst diesen englischen Artikel direkt in Binance Square kopieren.
###NvidiaBoardReportedlySplitOverHuang’sReturn ##
{spot}(LUNCUSDT)
###$$$##Meine Analyse: LUNC hat eine etablierte Community und eine aktive Blockchain, aber aufgrund seines großen Token-Angebots und seiner Geschichte ist die Kryptowährung mit hohen Risiken verbunden. Eine nachhaltige Nutzung des Ökosystems und ein umsichtiges Angebotsmanagement werden für die Zukunft wichtig sein.
9. Wichtige Handelsrisiken
Plötzliche Kursschwankungen.
Großes umlaufendes Token-Angebot.
Ungewisse Token-Burn-Raten.
Marktmanipulation und spekulativer Handel.
Änderungen in der Community-Governance.
Mögliche Verluste durch den Hebel beim Futures-Handel.
Investiere niemals Geld, dessen Verlust du dir nicht leisten kannst.
10. Veröffentlichungsfertiger Artikel für Binance Square
Du kannst diesen englischen Artikel direkt in Binance Square kopieren.
###NvidiaBoardReportedlySplitOverHuang’sReturn ##
9. Wichtige Handelsrisiken
Plötzliche Kursschwankungen.
Großes umlaufendes Token-Angebot.
Ungewisse Token-Burn-Raten.
Marktmanipulation und spekulativer Handel.
Änderungen in der Community-Governance.
Mögliche Verluste durch den Hebel beim Futures-Handel.
Investiere niemals Geld, dessen Verlust du dir nicht leisten kannst.
10. Veröffentlichungsfertiger Artikel für Binance Square
Du kannst diesen englischen Artikel direkt in Binance Square kopieren.
###NvidiaBoardReportedlySplitOverHuang’sReturn ##
168
·
--
Bullisch
Übersetzung ansehen
###$$$###Supply Risk Significant
Trading Risk High
Long-Term Certainty Not guaranteed
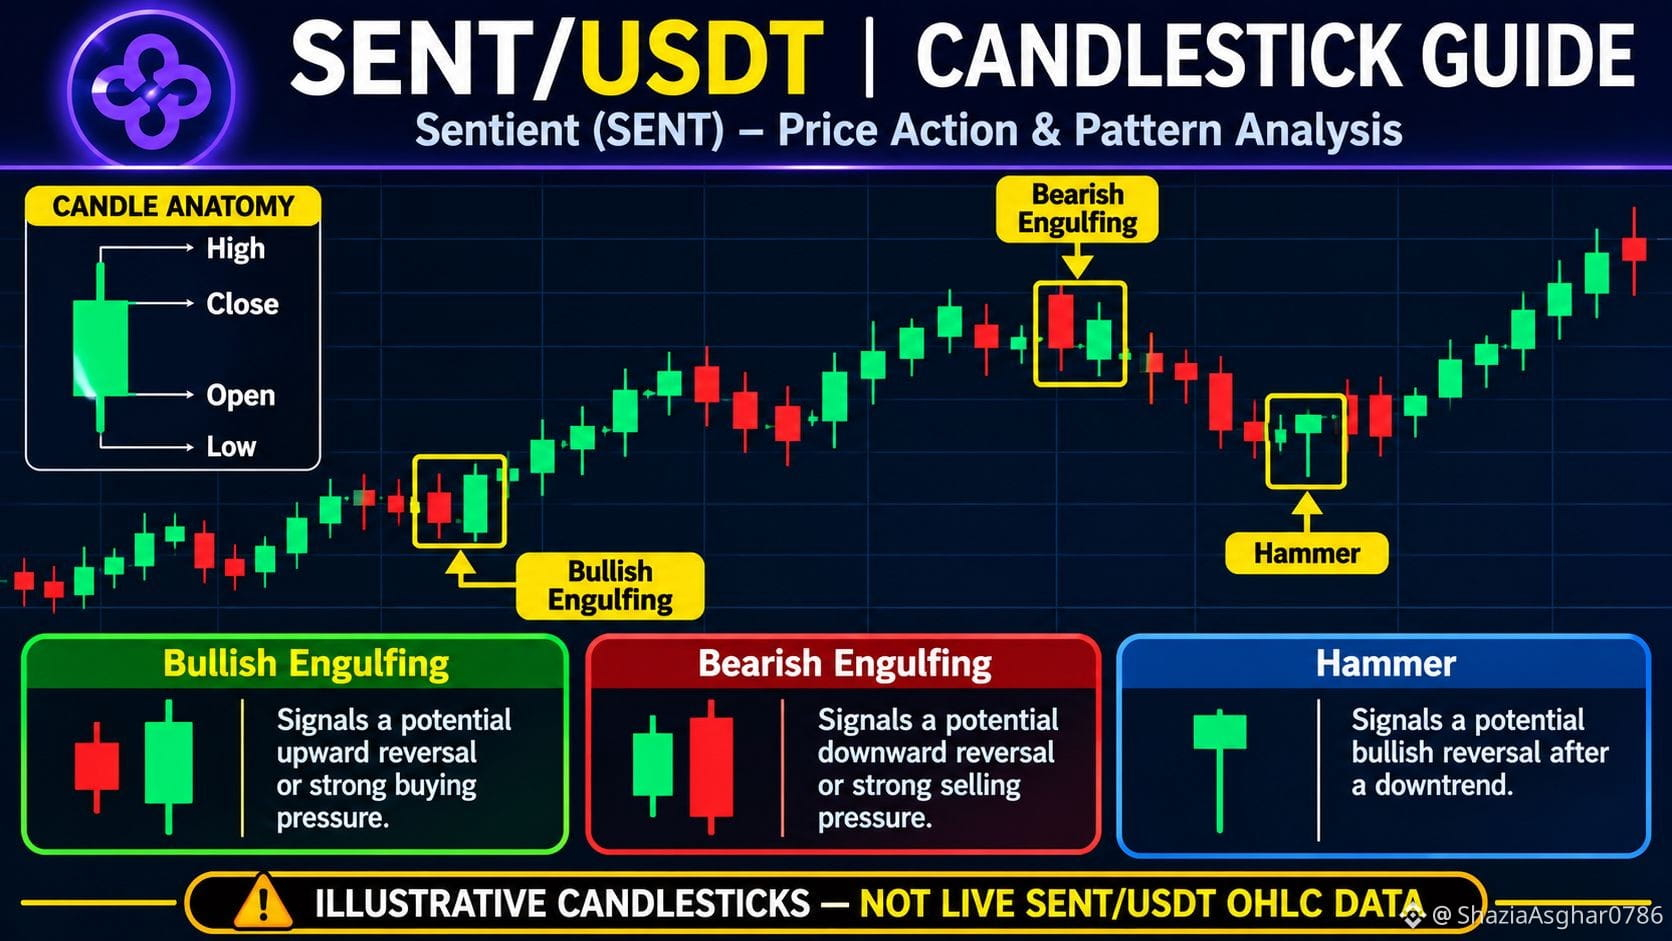
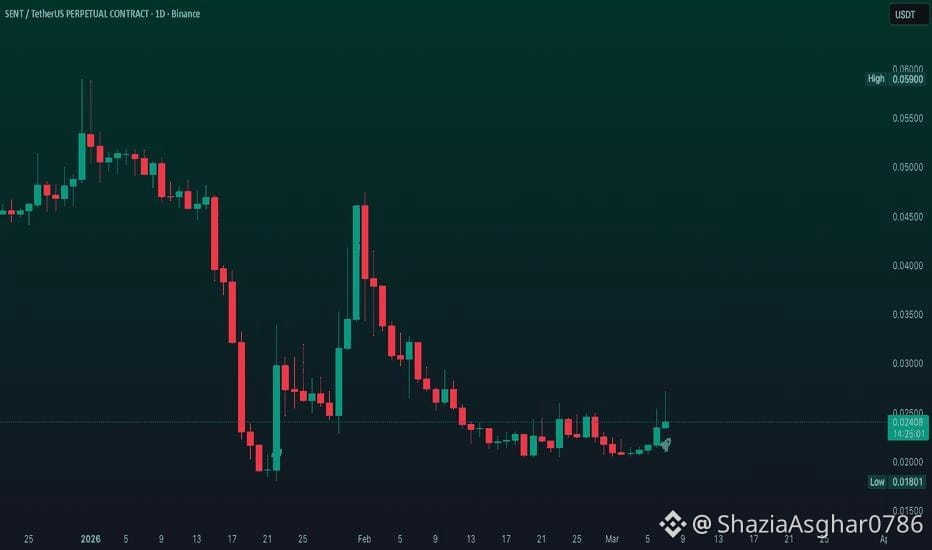
My conclusion: $SENT has an interesting AI infrastructure narrative and strong positive 24-hour momentum in the available snapshot. However, a single day's performance is not enough to establish a long-term bullish trend.
12. Official Research Links
Binance $SENT Price and Chart
Official Sentient Website
Official Tokenomics
CoinGecko Market Data
One important question: Are you preparing this report for Binance Square (a public crypto post), or do you want it for your own trading analysis?
I can format the complete SENT analysis into a professional Binance Square English post with a headline, chart explanation, hashtags, and risk disclaimer.
##BTCRemainsUnderPressureAfterHawkishFOMCMinutes ##
{spot}(SENTUSDT)
###$$$###Supply Risk Significant
Trading Risk High
Long-Term Certainty Not guaranteed
My conclusion: $SENT has an interesting AI infrastructure narrative and strong positive 24-hour momentum in the available snapshot. However, a single day's performance is not enough to establish a long-term bullish trend.
12. Official Research Links
Binance $SENT Price and Chart
Official Sentient Website
Official Tokenomics
CoinGecko Market Data
One important question: Are you preparing this report for Binance Square (a public crypto post), or do you want it for your own trading analysis?
I can format the complete SENT analysis into a professional Binance Square English post with a headline, chart explanation, hashtags, and risk disclaimer.
##BTCRemainsUnderPressureAfterHawkishFOMCMinutes ##
Trading Risk High
Long-Term Certainty Not guaranteed
My conclusion: $SENT has an interesting AI infrastructure narrative and strong positive 24-hour momentum in the available snapshot. However, a single day's performance is not enough to establish a long-term bullish trend.
12. Official Research Links
Binance $SENT Price and Chart
Official Sentient Website
Official Tokenomics
CoinGecko Market Data
One important question: Are you preparing this report for Binance Square (a public crypto post), or do you want it for your own trading analysis?
I can format the complete SENT analysis into a professional Binance Square English post with a headline, chart explanation, hashtags, and risk disclaimer.
##BTCRemainsUnderPressureAfterHawkishFOMCMinutes ##
118
Übersetzung ansehen
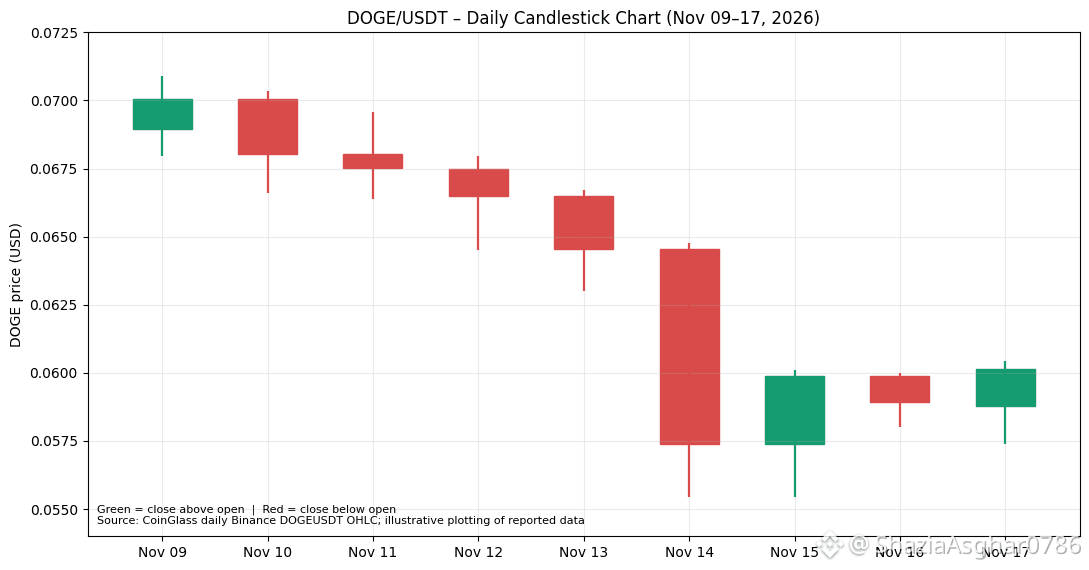
###$$$###Short-term: Recovery is possible.
Medium-term: Trend remains weak.
Long-term: Depends on adoption, market liquidity and overall crypto conditions.
Risk: $DOGE can experience sudden price movements.
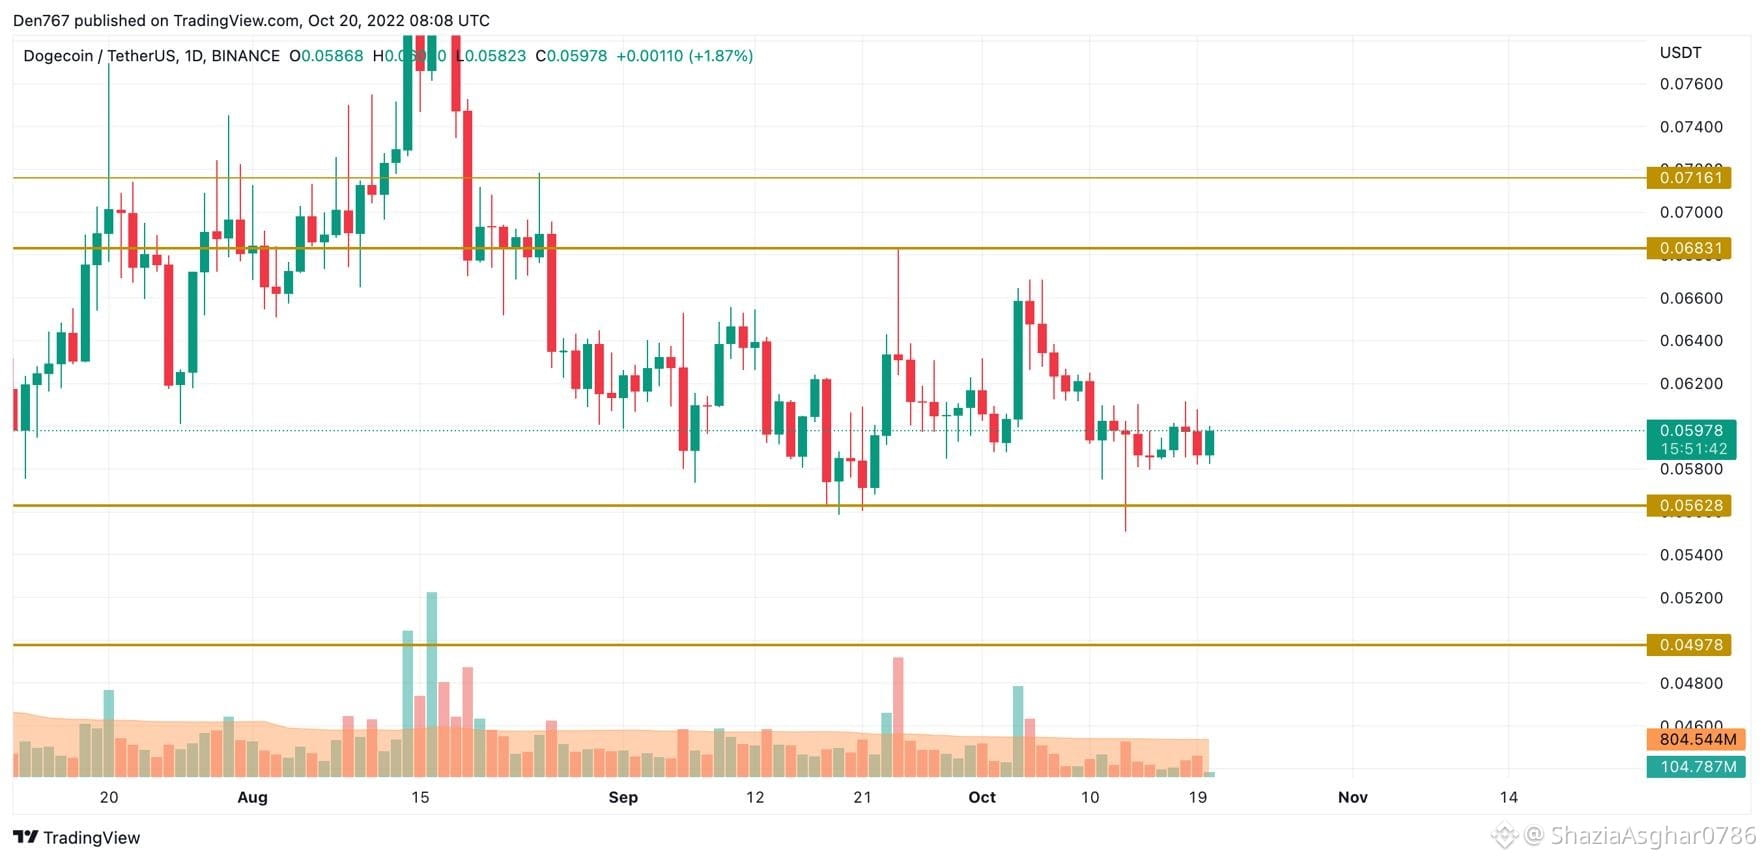
My advice: Avoid buying only because of a green candle. Wait for confirmation through volume and a candle closing above resistance.
8. Useful $DOGE chart websites
TradingView – DOGE Candlestick Chart
CoinMarketCap – DOGE Information
CoinGlass – DOGE Futures & Market Data
##CanNvidia’sDataCenterGrowthContinue? ##
{spot}(DOGEUSDT)
###$$$###Short-term: Recovery is possible.
Medium-term: Trend remains weak.
Long-term: Depends on adoption, market liquidity and overall crypto conditions.
Risk: $DOGE can experience sudden price movements.
My advice: Avoid buying only because of a green candle. Wait for confirmation through volume and a candle closing above resistance.
8. Useful $DOGE chart websites
TradingView – DOGE Candlestick Chart
CoinMarketCap – DOGE Information
CoinGlass – DOGE Futures & Market Data
##CanNvidia’sDataCenterGrowthContinue? ##
Medium-term: Trend remains weak.
Long-term: Depends on adoption, market liquidity and overall crypto conditions.
Risk: $DOGE can experience sudden price movements.
My advice: Avoid buying only because of a green candle. Wait for confirmation through volume and a candle closing above resistance.
8. Useful $DOGE chart websites
TradingView – DOGE Candlestick Chart
CoinMarketCap – DOGE Information
CoinGlass – DOGE Futures & Market Data
##CanNvidia’sDataCenterGrowthContinue? ##
24
Übersetzung ansehen
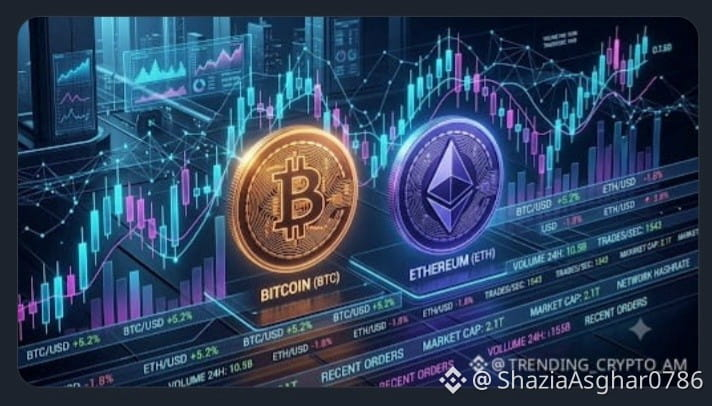
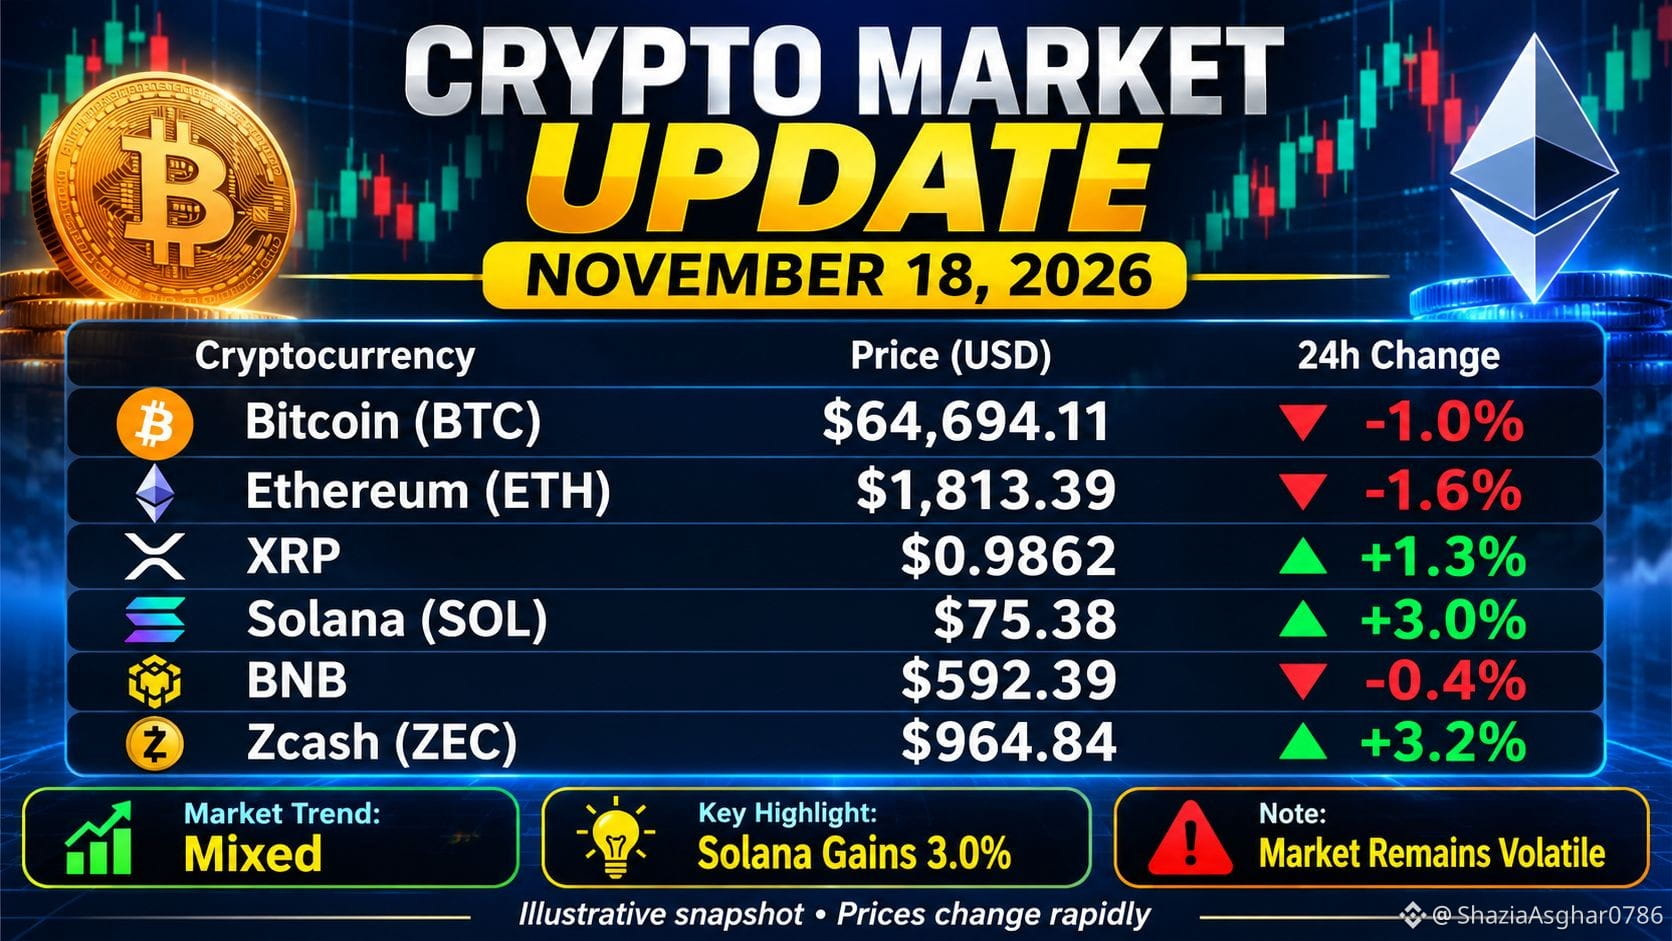
Crypto market is currently going through an extreme fear and heavy correction phase.😁
* Bitcoin ( $BTC ): Dropped below $64,000. 😭
* Altcoins : $ETH and other major coins took a massive 10-12% hit.😞
* Reasons: Macro pressure, inflation fears, and institutional money pulling out of ETFs.
Advice for Investors:
If you panic and sell everything right now, you'll lock in losses. If you have a long-term view and hold spot assets, avoid panic selling—market cycles always move up and down.
$MSFTB
##CanNvidia’sDataCenterGrowthContinue? ##
{spot}(BTCUSDT)
{spot}(ETHUSDT)
{spot}(MSFTBUSDT)
Crypto market is currently going through an extreme fear and heavy correction phase.😁
* Bitcoin ( $BTC ): Dropped below $64,000. 😭
* Altcoins : $ETH and other major coins took a massive 10-12% hit.😞
* Reasons: Macro pressure, inflation fears, and institutional money pulling out of ETFs.
Advice for Investors:
If you panic and sell everything right now, you'll lock in losses. If you have a long-term view and hold spot assets, avoid panic selling—market cycles always move up and down.
$MSFTB
##CanNvidia’sDataCenterGrowthContinue? ##
* Bitcoin ( $BTC ): Dropped below $64,000. 😭
* Altcoins : $ETH and other major coins took a massive 10-12% hit.😞
* Reasons: Macro pressure, inflation fears, and institutional money pulling out of ETFs.
Advice for Investors:
If you panic and sell everything right now, you'll lock in losses. If you have a long-term view and hold spot assets, avoid panic selling—market cycles always move up and down.
$MSFTB
##CanNvidia’sDataCenterGrowthContinue? ##
8
Übersetzung ansehen
###$$$## 5. Which coin should I analyse next?
Select your cryptocurrency
What do you want?
##CanNvidia’sDataCenterGrowthContinue? ##
###$$$## 5. Which coin should I analyse next?
Select your cryptocurrency
What do you want?
##CanNvidia’sDataCenterGrowthContinue? ##
Select your cryptocurrency
What do you want?
##CanNvidia’sDataCenterGrowthContinue? ##
1
Übersetzung ansehen
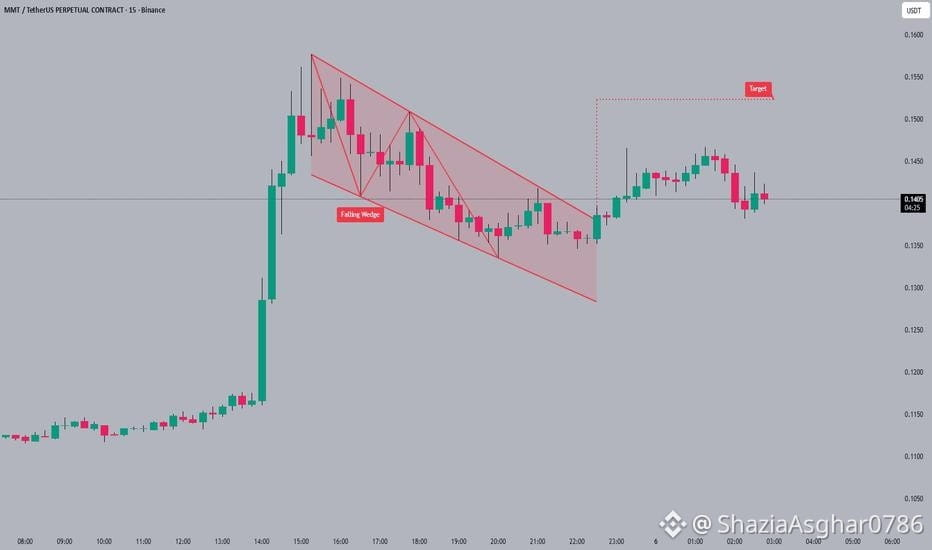
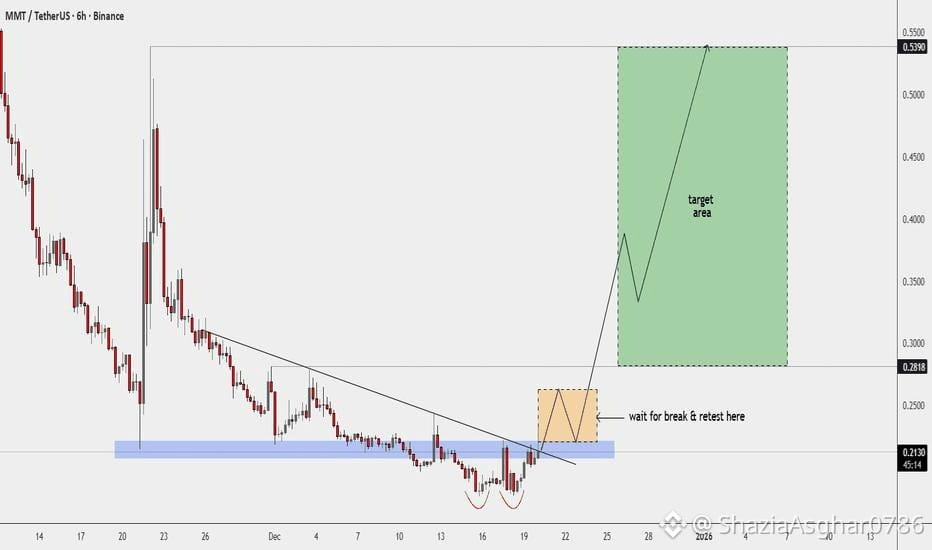
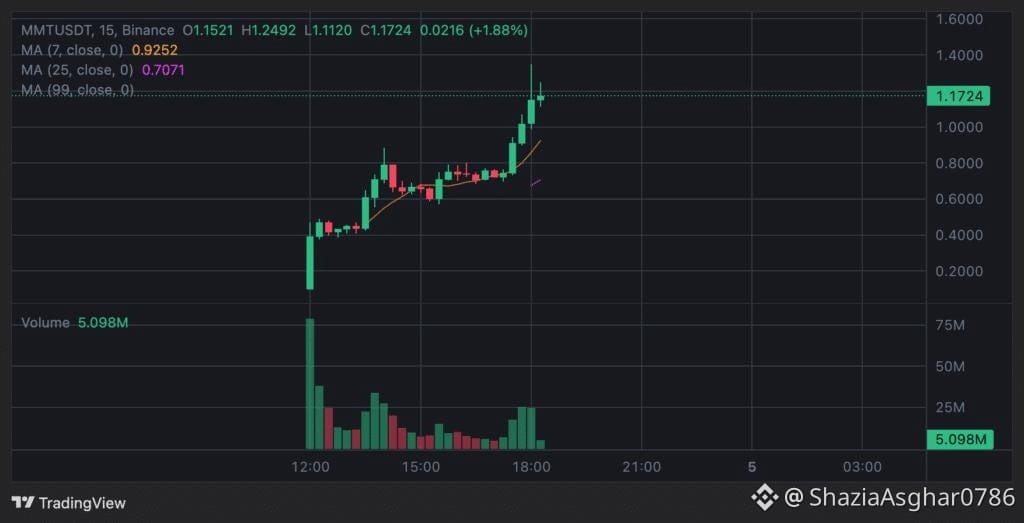
###$$$##Choose your MMT chart analysis
Timeframe
Trading type
Exchange
I can then explain the bullish and bearish candle patterns, entry price, stop-loss and profit targets in English.
###KOSPIFalls2.59%ToLowestCloseSinceFebruary ##
{spot}(MMTUSDT)
###$$$##Choose your MMT chart analysis
Timeframe
Trading type
Exchange
I can then explain the bullish and bearish candle patterns, entry price, stop-loss and profit targets in English.
###KOSPIFalls2.59%ToLowestCloseSinceFebruary ##
Timeframe
Trading type
Exchange
I can then explain the bullish and bearish candle patterns, entry price, stop-loss and profit targets in English.
###KOSPIFalls2.59%ToLowestCloseSinceFebruary ##
129
Übersetzung ansehen
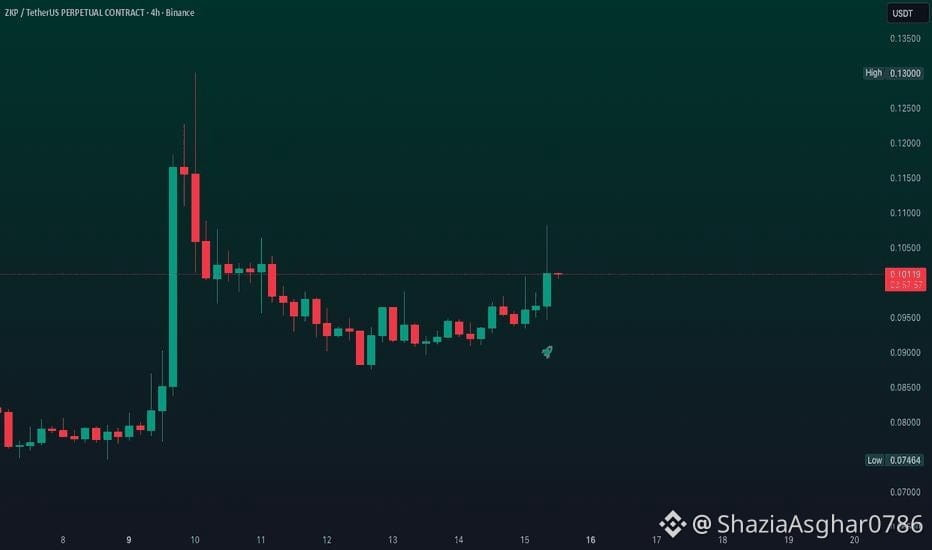
###$$$###My recommendation: Research the project's real adoption, token unlock schedule, trading liquidity and contract before investing. Avoid high leverage and use a stop-loss.
13. Official Links and Live Chart
ZKP/USDT Market Chart
Official zkPass Website
Official Documentation
ZKP Market Data
ZKP Price and Chart
Official Whitepaper
Final Takeaway: zkPass (ZKP) is a privacy-focused Web3 infrastructure project, not just another meme coin. Its long-term potential depends on real-world adoption, developer usage, token utility and market demand. It is still a speculative, high-risk cryptocurrency.
###NvidiaBoardNotConsideringHuang’sReturnasCEO ###
{spot}(ZKPUSDT)
###$$$###My recommendation: Research the project's real adoption, token unlock schedule, trading liquidity and contract before investing. Avoid high leverage and use a stop-loss.
13. Official Links and Live Chart
ZKP/USDT Market Chart
Official zkPass Website
Official Documentation
ZKP Market Data
ZKP Price and Chart
Official Whitepaper
Final Takeaway: zkPass (ZKP) is a privacy-focused Web3 infrastructure project, not just another meme coin. Its long-term potential depends on real-world adoption, developer usage, token utility and market demand. It is still a speculative, high-risk cryptocurrency.
###NvidiaBoardNotConsideringHuang’sReturnasCEO ###
13. Official Links and Live Chart
ZKP/USDT Market Chart
Official zkPass Website
Official Documentation
ZKP Market Data
ZKP Price and Chart
Official Whitepaper
Final Takeaway: zkPass (ZKP) is a privacy-focused Web3 infrastructure project, not just another meme coin. Its long-term potential depends on real-world adoption, developer usage, token utility and market demand. It is still a speculative, high-risk cryptocurrency.
###NvidiaBoardNotConsideringHuang’sReturnasCEO ###
141
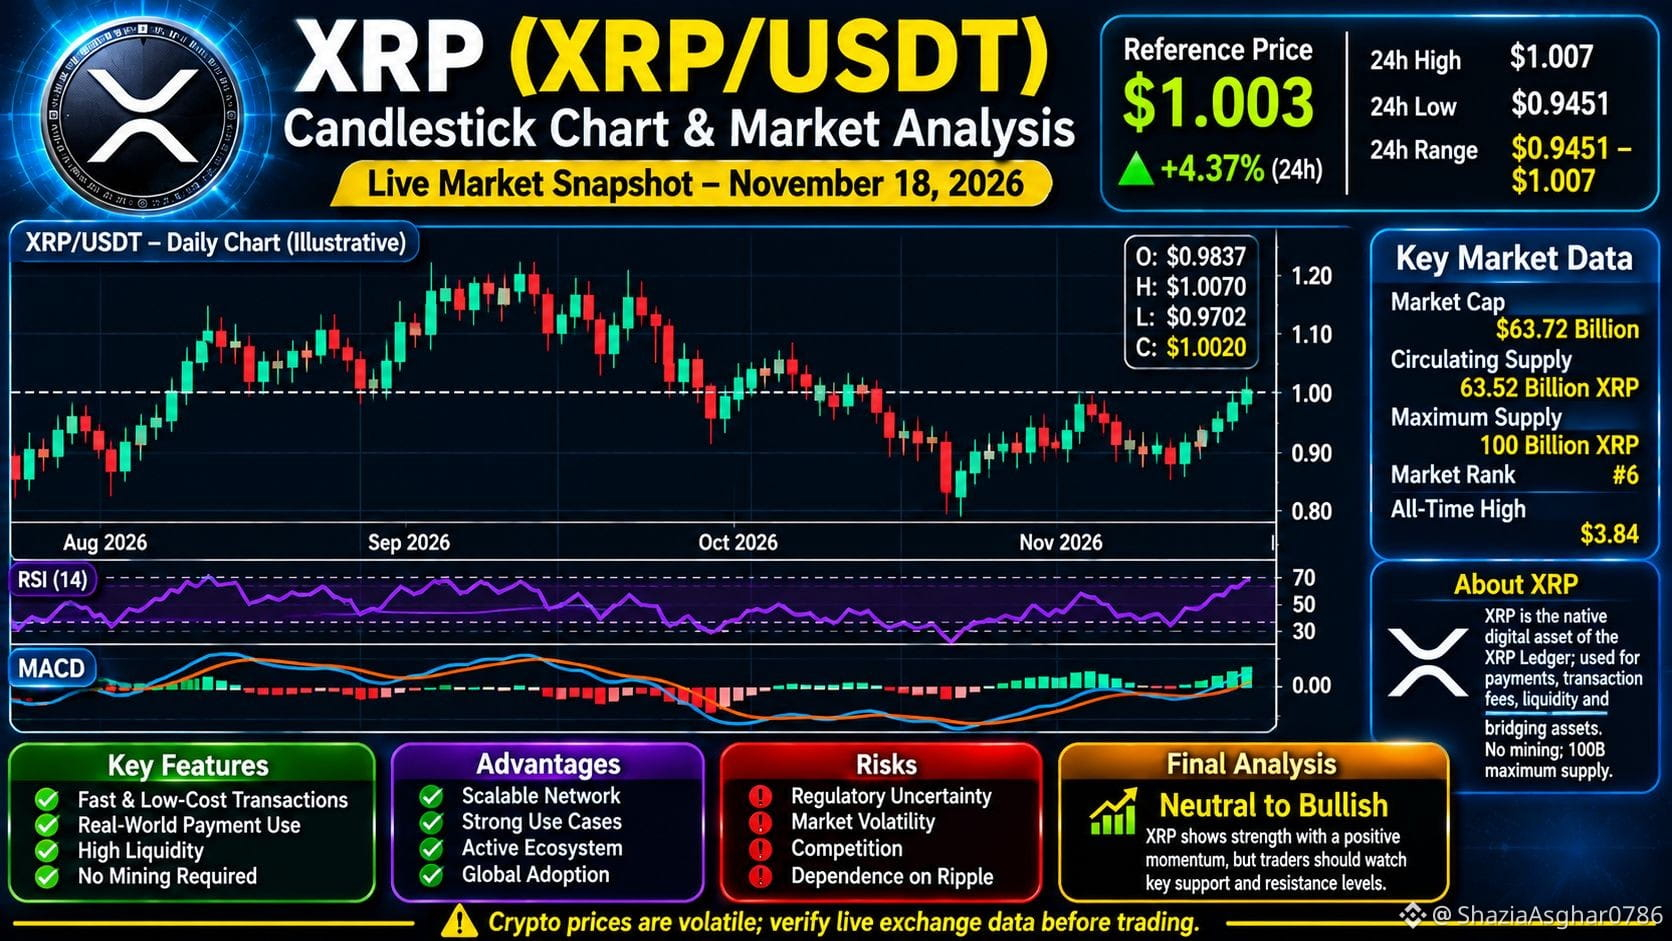
###$$$##10. XRP-Markteinschätzung
Meine technische Einschätzung:
XRP zeigt derzeit einen bärischen Tagestrend.
Der RSI befindet sich nahe dem überverkauften Bereich.
Der Kurs liegt weiterhin unter dem 50-EMA.
$0.9742 ist ein wichtiges Unterstützungsniveau.
$1.0884 ist der erste wichtige Widerstand.
Eine bullische Umkehr erfordert ein starkes Kaufvolumen und eine Bestätigung durch die Kerze.
Handelsstrategie: Warte vor dem Einstieg auf den bestätigten Schluss einer 4-Stunden- oder Tageskerze. Verwende immer einen Stop-Loss.
11. Live-XRP-Handelschart
{spot}(XRPUSDT)
{spot}(USDCUSDT)
###LedgerHardwareImplantReportsExtendToDubai ###
###$$$##10. XRP-Markteinschätzung
Meine technische Einschätzung:
XRP zeigt derzeit einen bärischen Tagestrend.
Der RSI befindet sich nahe dem überverkauften Bereich.
Der Kurs liegt weiterhin unter dem 50-EMA.
$0.9742 ist ein wichtiges Unterstützungsniveau.
$1.0884 ist der erste wichtige Widerstand.
Eine bullische Umkehr erfordert ein starkes Kaufvolumen und eine Bestätigung durch die Kerze.
Handelsstrategie: Warte vor dem Einstieg auf den bestätigten Schluss einer 4-Stunden- oder Tageskerze. Verwende immer einen Stop-Loss.
11. Live-XRP-Handelschart
###LedgerHardwareImplantReportsExtendToDubai ###
Meine technische Einschätzung:
XRP zeigt derzeit einen bärischen Tagestrend.
Der RSI befindet sich nahe dem überverkauften Bereich.
Der Kurs liegt weiterhin unter dem 50-EMA.
$0.9742 ist ein wichtiges Unterstützungsniveau.
$1.0884 ist der erste wichtige Widerstand.
Eine bullische Umkehr erfordert ein starkes Kaufvolumen und eine Bestätigung durch die Kerze.
Handelsstrategie: Warte vor dem Einstieg auf den bestätigten Schluss einer 4-Stunden- oder Tageskerze. Verwende immer einen Stop-Loss.
11. Live-XRP-Handelschart
###LedgerHardwareImplantReportsExtendToDubai ###
78
Übersetzung ansehen
###$$$###Transaction fee utility Competition from other chains
8. Final BNB Market Opinion
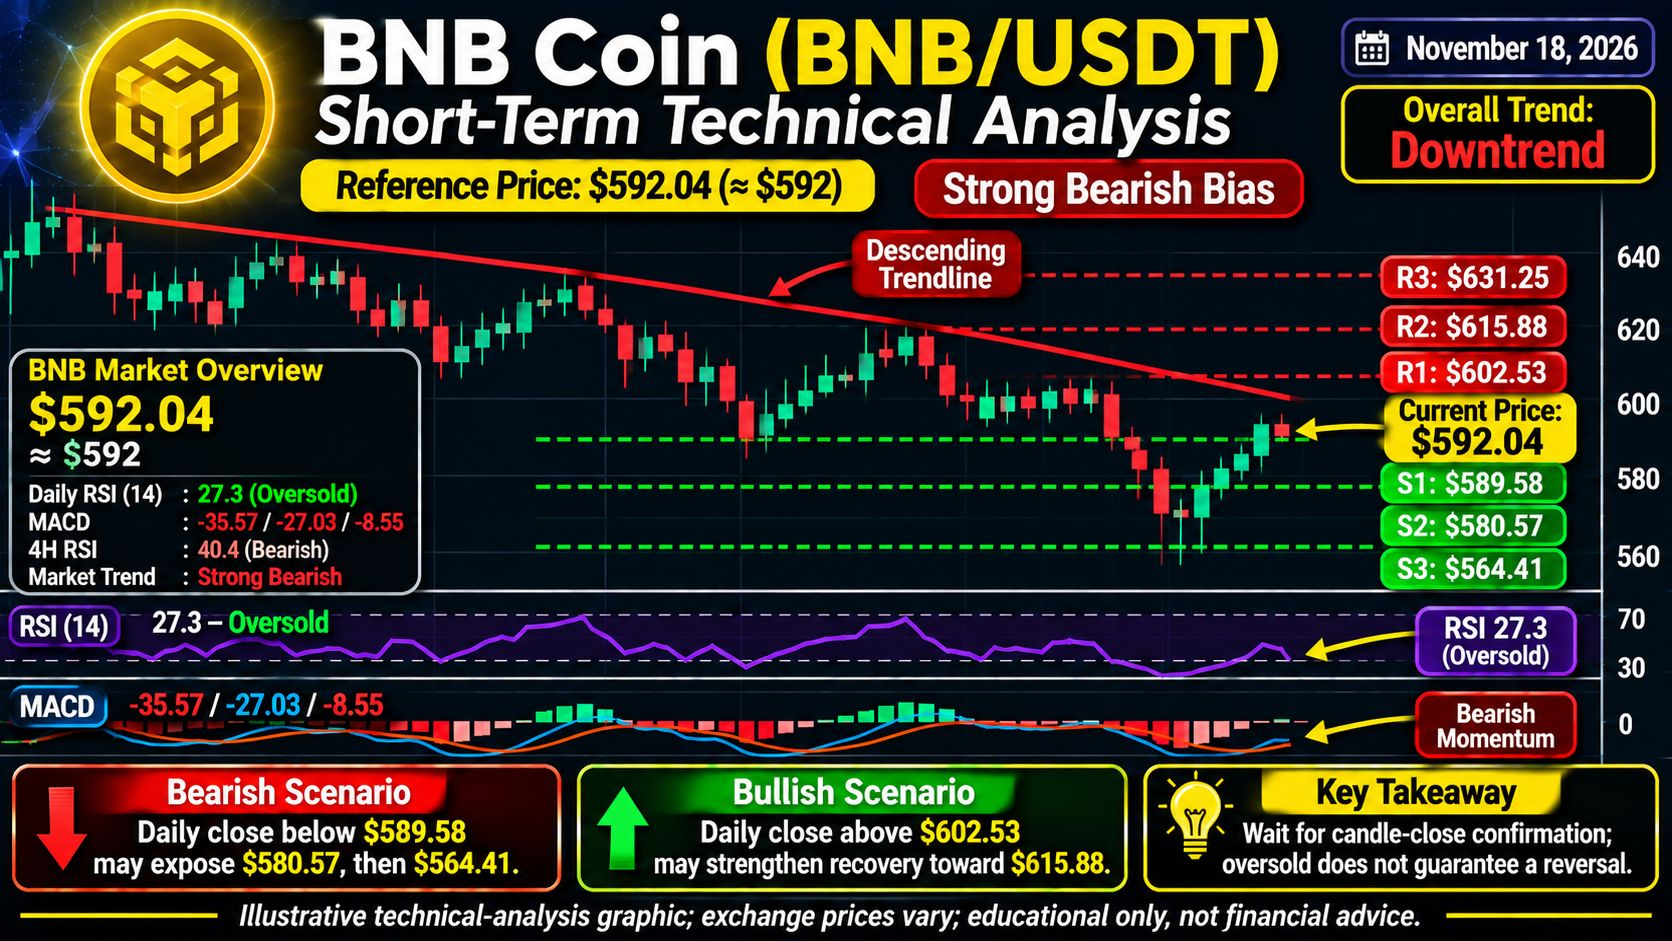
My technical conclusion:
Sellers currently have the advantage.
RSI indicates oversold conditions.
MACD remains bearish.
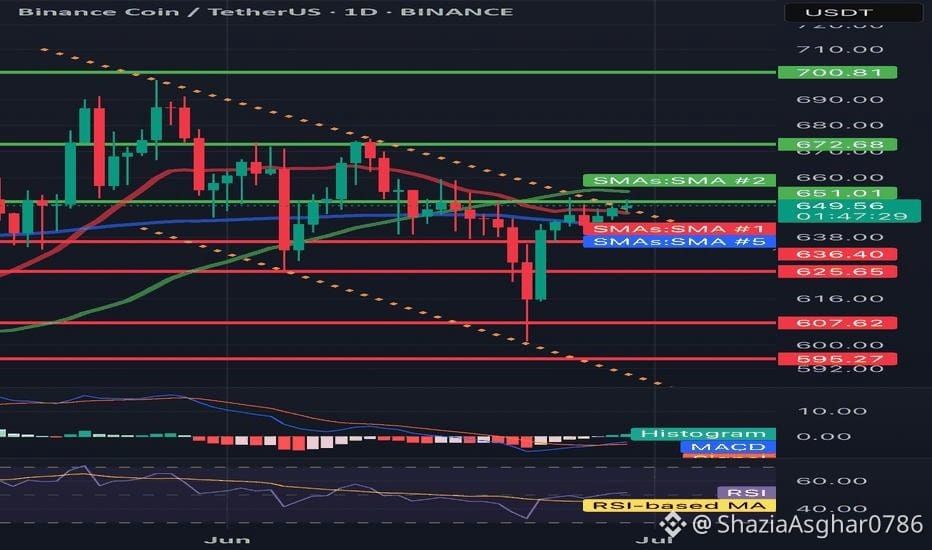
$589.58 is an important support level.
$602.53 is the first important resistance.
Wait for a confirmed candle close before entering a trade.
Risk Management: Always use stop-loss protection, control leverage and never risk money you cannot afford to lose.
9. Live BNB Candlestick Chart
{spot}(BNBUSDT)
{future}(USDCUSDT)
##LedgerHardwareImplantReportsExtendToDubai ###
###$$$###Transaction fee utility Competition from other chains
8. Final BNB Market Opinion
My technical conclusion:
Sellers currently have the advantage.
RSI indicates oversold conditions.
MACD remains bearish.
$589.58 is an important support level.
$602.53 is the first important resistance.
Wait for a confirmed candle close before entering a trade.
Risk Management: Always use stop-loss protection, control leverage and never risk money you cannot afford to lose.
9. Live BNB Candlestick Chart
##LedgerHardwareImplantReportsExtendToDubai ###
8. Final BNB Market Opinion
My technical conclusion:
Sellers currently have the advantage.
RSI indicates oversold conditions.
MACD remains bearish.
$589.58 is an important support level.
$602.53 is the first important resistance.
Wait for a confirmed candle close before entering a trade.
Risk Management: Always use stop-loss protection, control leverage and never risk money you cannot afford to lose.
9. Live BNB Candlestick Chart
##LedgerHardwareImplantReportsExtendToDubai ###
50
Übersetzung ansehen
Resistance Around $1.00
###$$$###RSI Usually less useful
MACD Usually less useful
Volatility Normally low
Main risk Loss of dollar peg
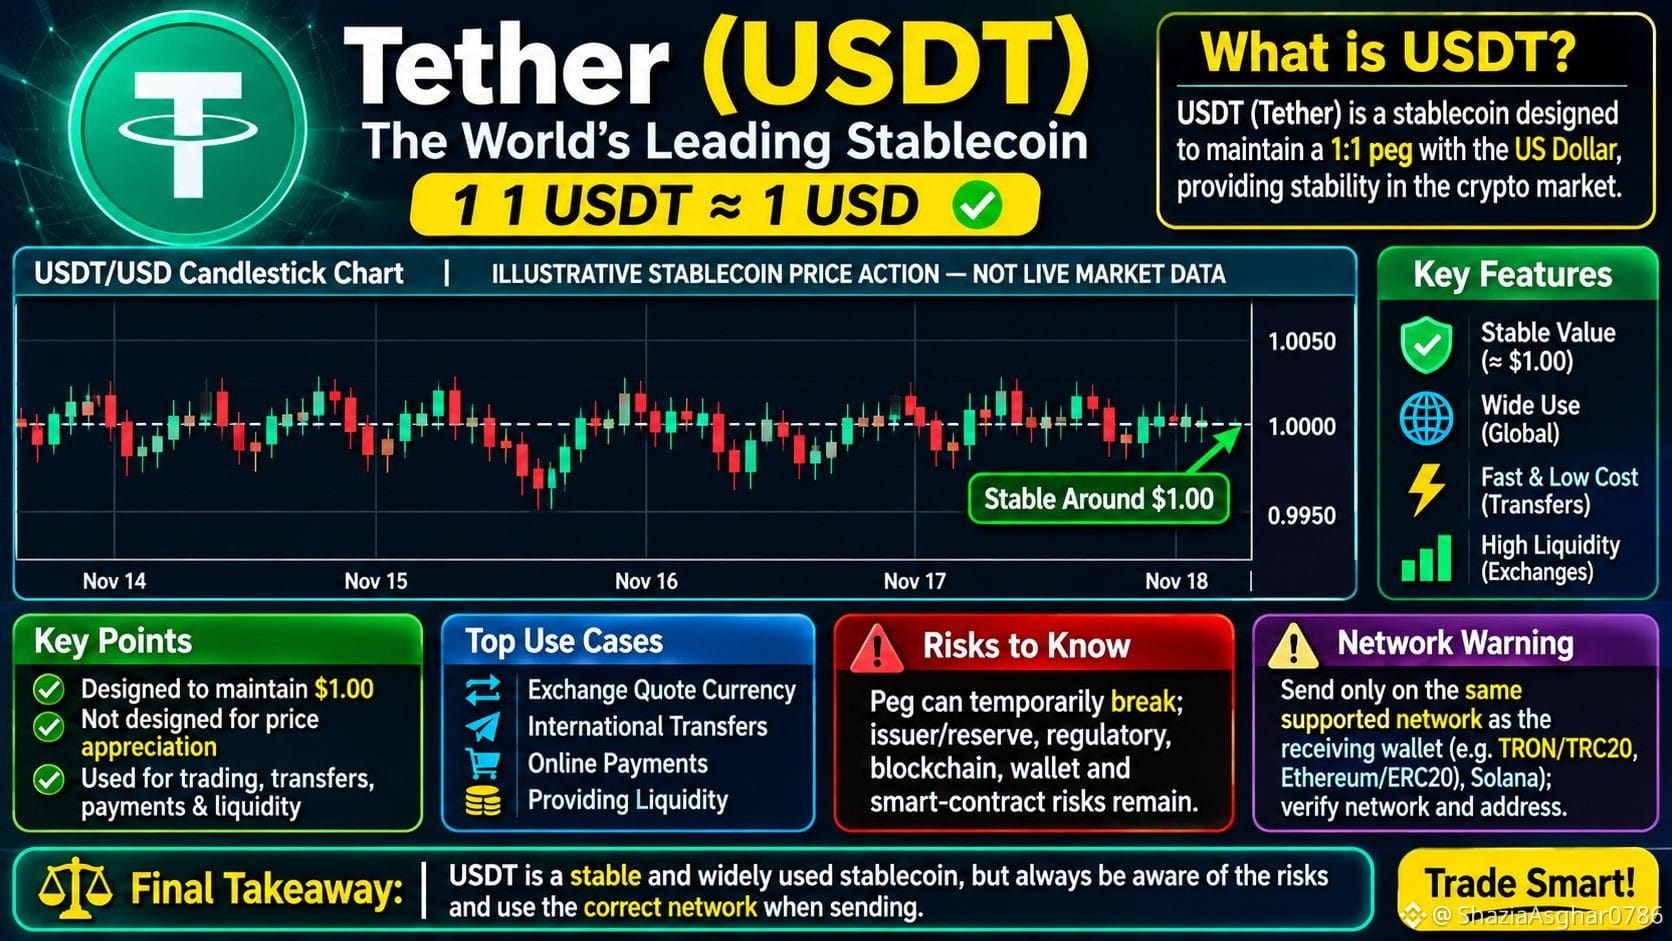
My opinion: USDT is primarily a stablecoin for storing and transferring dollar-denominated value in crypto markets, not a coin to buy for speculative price growth.
10. Official Resources and Live Charts
Tether Official Reserve Transparency
Official Tether FAQs
USDT/USD Trading Chart
USDT Market Information
Final Takeaway: USDT is a US dollar-pegged stablecoin. Its main purpose is stability, liquidity, payments and crypto trading—not investment growth. Always consider reserve, issuer, regulatory and blockchain risks.
{future}(USDCUSDT)
##KOSPIFalls2.59%ToLowestCloseSinceFebruary ##
Resistance Around $1.00
###$$$###RSI Usually less useful
MACD Usually less useful
Volatility Normally low
Main risk Loss of dollar peg
My opinion: USDT is primarily a stablecoin for storing and transferring dollar-denominated value in crypto markets, not a coin to buy for speculative price growth.
10. Official Resources and Live Charts
Tether Official Reserve Transparency
Official Tether FAQs
USDT/USD Trading Chart
USDT Market Information
Final Takeaway: USDT is a US dollar-pegged stablecoin. Its main purpose is stability, liquidity, payments and crypto trading—not investment growth. Always consider reserve, issuer, regulatory and blockchain risks.
##KOSPIFalls2.59%ToLowestCloseSinceFebruary ##
###$$$###RSI Usually less useful
MACD Usually less useful
Volatility Normally low
Main risk Loss of dollar peg
My opinion: USDT is primarily a stablecoin for storing and transferring dollar-denominated value in crypto markets, not a coin to buy for speculative price growth.
10. Official Resources and Live Charts
Tether Official Reserve Transparency
Official Tether FAQs
USDT/USD Trading Chart
USDT Market Information
Final Takeaway: USDT is a US dollar-pegged stablecoin. Its main purpose is stability, liquidity, payments and crypto trading—not investment growth. Always consider reserve, issuer, regulatory and blockchain risks.
##KOSPIFalls2.59%ToLowestCloseSinceFebruary ##
41
Übersetzung ansehen
###$$$$###6. Final Market Prediction
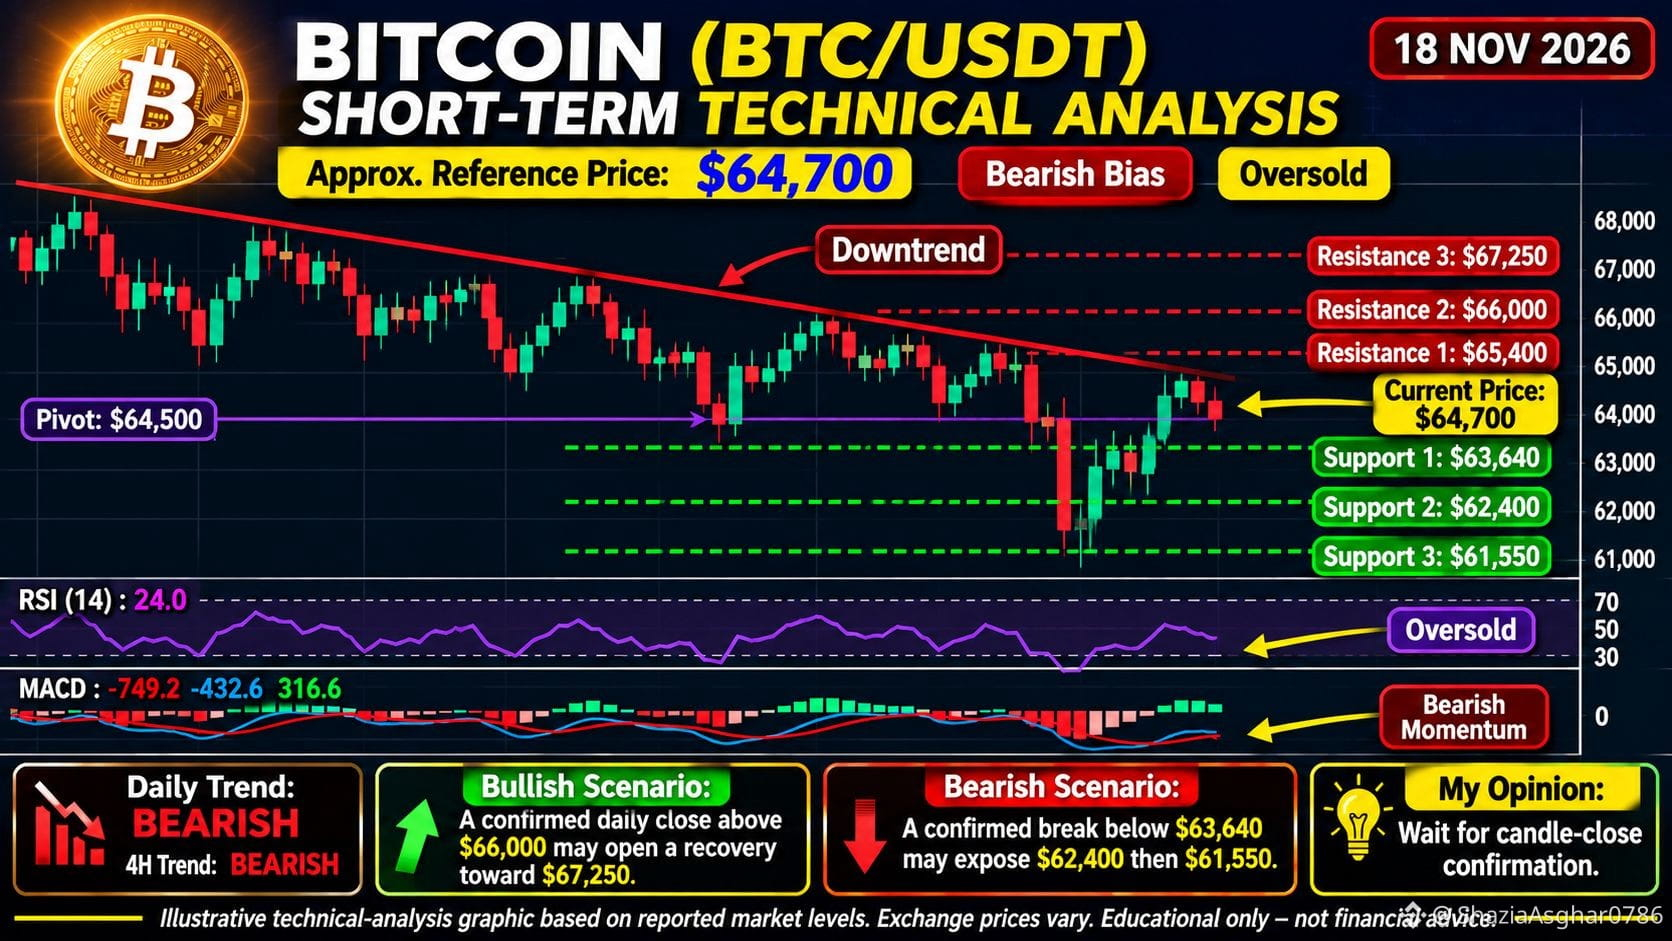
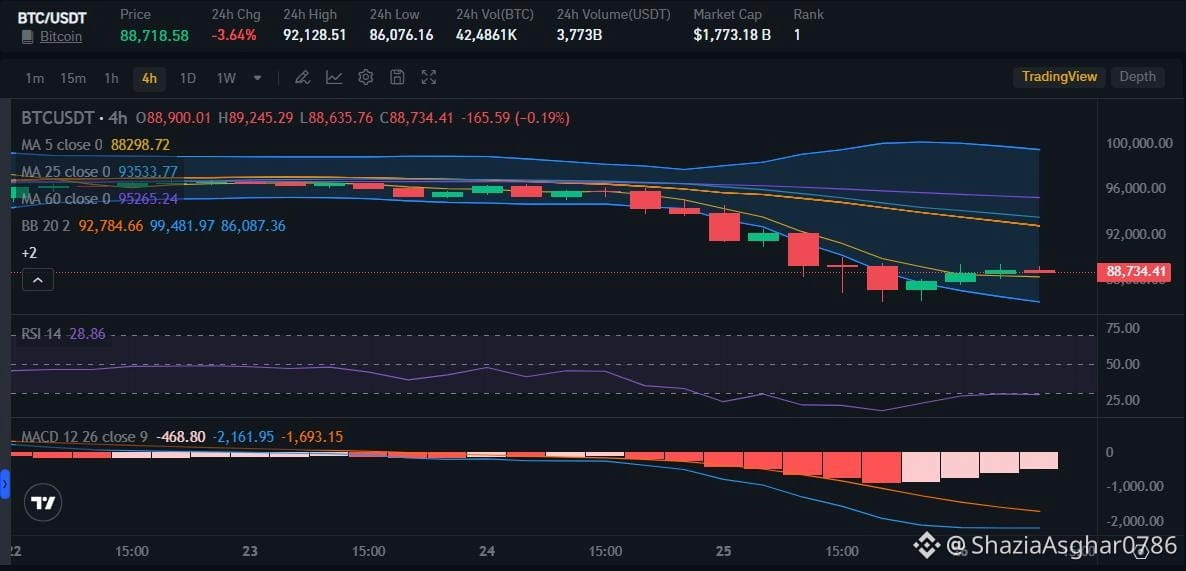
Bitcoin currently shows bearish technical conditions.
Sellers have the advantage.
RSI indicates oversold conditions.
A temporary recovery is possible.
A breakout above $66,000 could improve the bullish outlook.
A breakdown below $63,640 could increase downside pressure.
My Trading Opinion: Wait for 4-hour candle confirmation before entering a trade. Always use stop-loss protection and manage risk carefully.
7. Live Bitcoin Trading Chart
Open BTC/USDT Live Candlestick Chart on TradingView
Check Bitcoin Live Market Price
{spot}(BTCUSDT)
###CanNvidia’sDataCenterGrowthContinue? ###
###$$$$###6. Final Market Prediction
Bitcoin currently shows bearish technical conditions.
Sellers have the advantage.
RSI indicates oversold conditions.
A temporary recovery is possible.
A breakout above $66,000 could improve the bullish outlook.
A breakdown below $63,640 could increase downside pressure.
My Trading Opinion: Wait for 4-hour candle confirmation before entering a trade. Always use stop-loss protection and manage risk carefully.
7. Live Bitcoin Trading Chart
Open BTC/USDT Live Candlestick Chart on TradingView
Check Bitcoin Live Market Price
###CanNvidia’sDataCenterGrowthContinue? ###
Bitcoin currently shows bearish technical conditions.
Sellers have the advantage.
RSI indicates oversold conditions.
A temporary recovery is possible.
A breakout above $66,000 could improve the bullish outlook.
A breakdown below $63,640 could increase downside pressure.
My Trading Opinion: Wait for 4-hour candle confirmation before entering a trade. Always use stop-loss protection and manage risk carefully.
7. Live Bitcoin Trading Chart
Open BTC/USDT Live Candlestick Chart on TradingView
Check Bitcoin Live Market Price
###CanNvidia’sDataCenterGrowthContinue? ###
59
Übersetzung ansehen
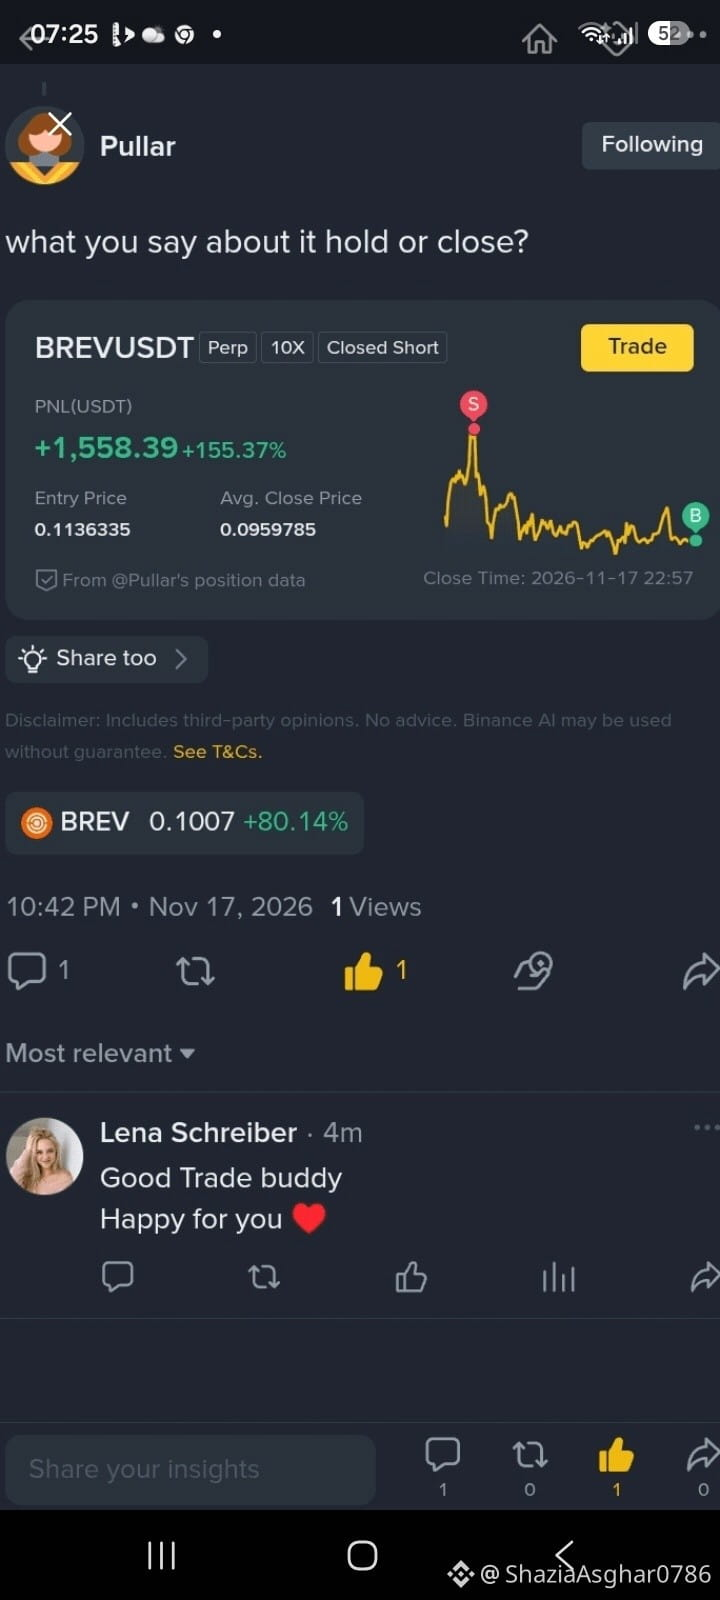
##$$I Recently posted Short trade on $BREV
Here is A Good Trade open and profitable close by @Pullar shared
$BREV
####KOSPIFalls2.59%ToLowestCloseSinceFebruary ##
{future}(BREVUSDT)
##$$I Recently posted Short trade on $BREV
Here is A Good Trade open and profitable close by @Pullar shared
$BREV
####KOSPIFalls2.59%ToLowestCloseSinceFebruary ##
Here is A Good Trade open and profitable close by @Pullar shared
$BREV
####KOSPIFalls2.59%ToLowestCloseSinceFebruary ##
66
Übersetzung ansehen
$$$$ BUY SIGNAL — $NIGHT | Score: 35/100 | LOW
NIGHT rockets higher as momentum spikes, primed for a swift scalp entry.
Entry: $0.04737 — $0.04771
TP1 (30min-4h): $0.04928
TP2 (1-3d): $0.05166
TP3 Swing: $0.05475
SL: $0.04552
The token is showing a clear momentum breakout with robust buying pressure and elevated volume, pushing it above recent resistance. A tight consolidation zone below the breakout point offers a clean entry for scalpers, while the upward bias remains strong. Watch for rapid retracements to the breakout level as profit targets, and keep stops just below the consolidation area to manage risk.
⚠️ NFA | DYOR
#IM_M7
$$$$ BUY SIGNAL — $NIGHT | Score: 35/100 | LOW
NIGHT rockets higher as momentum spikes, primed for a swift scalp entry.
Entry: $0.04737 — $0.04771
TP1 (30min-4h): $0.04928
TP2 (1-3d): $0.05166
TP3 Swing: $0.05475
SL: $0.04552
The token is showing a clear momentum breakout with robust buying pressure and elevated volume, pushing it above recent resistance. A tight consolidation zone below the breakout point offers a clean entry for scalpers, while the upward bias remains strong. Watch for rapid retracements to the breakout level as profit targets, and keep stops just below the consolidation area to manage risk.
⚠️ NFA | DYOR
#IM_M7
NIGHT rockets higher as momentum spikes, primed for a swift scalp entry.
Entry: $0.04737 — $0.04771
TP1 (30min-4h): $0.04928
TP2 (1-3d): $0.05166
TP3 Swing: $0.05475
SL: $0.04552
The token is showing a clear momentum breakout with robust buying pressure and elevated volume, pushing it above recent resistance. A tight consolidation zone below the breakout point offers a clean entry for scalpers, while the upward bias remains strong. Watch for rapid retracements to the breakout level as profit targets, and keep stops just below the consolidation area to manage risk.
⚠️ NFA | DYOR
#IM_M7
4
Übersetzung ansehen
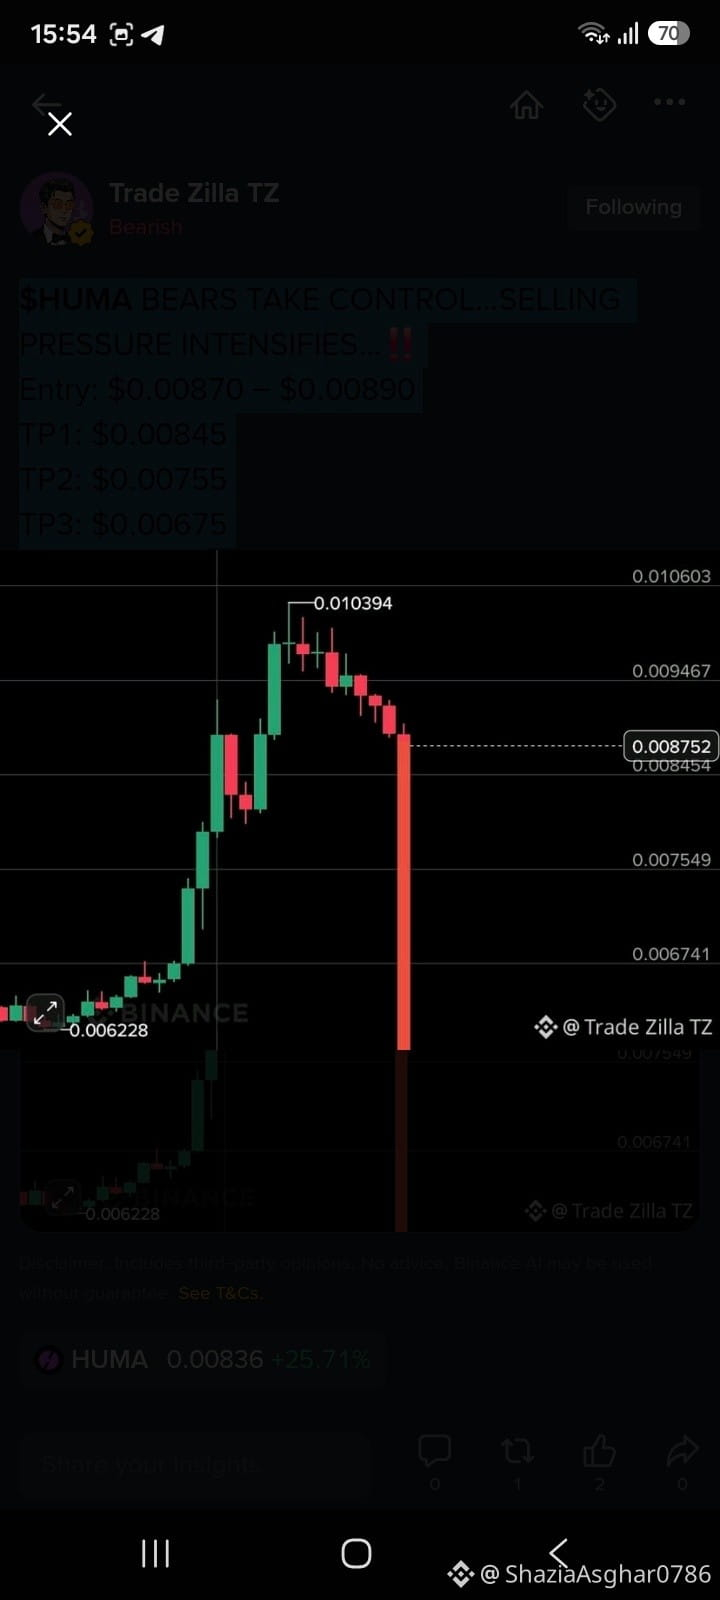
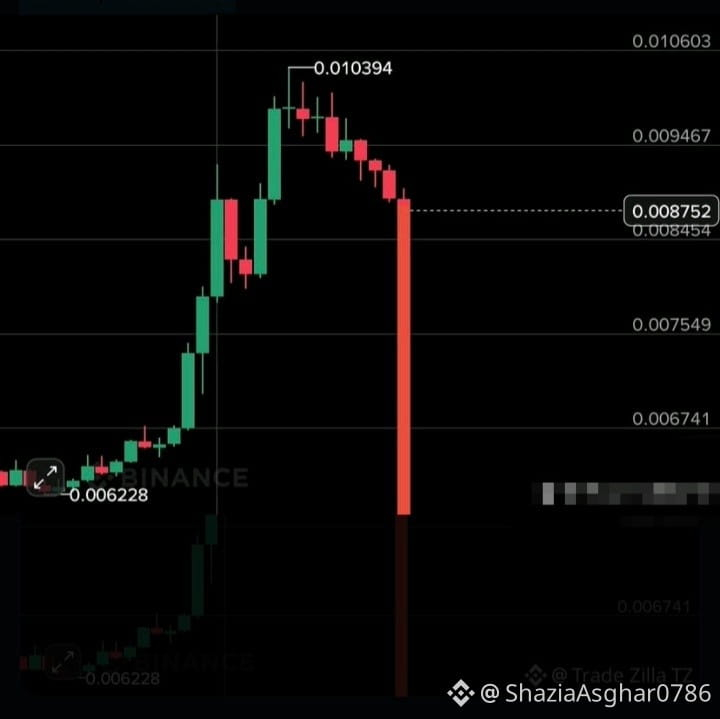
####$HUMA BEARS TAKE CONTROL…SELLING PRESSURE INTENSIFIES…‼️
Entry: $0.00870 – $0.00890
TP1: $0.00845
TP2: $0.00755
TP3: $0.00675
SL: $0.00950
{future}(HUMAUSDT)
##InvescoStablecoinReservesFundLaunchesOnEthereum ##
####$HUMA BEARS TAKE CONTROL…SELLING PRESSURE INTENSIFIES…‼️
Entry: $0.00870 – $0.00890
TP1: $0.00845
TP2: $0.00755
TP3: $0.00675
SL: $0.00950
##InvescoStablecoinReservesFundLaunchesOnEthereum ##
Entry: $0.00870 – $0.00890
TP1: $0.00845
TP2: $0.00755
TP3: $0.00675
SL: $0.00950
##InvescoStablecoinReservesFundLaunchesOnEthereum ##
7
Anmelden und weiter Inhalte entdecken
Krypto-Nutzer weltweit auf Binance Square kennenlernen
⚡️ Bleib in Sachen Krypto stets am Puls.
💬 Die weltgrößte Kryptobörse vertraut darauf.
👍 Erhalte verlässliche Einblicke von verifizierten Creators.
E-Mail-Adresse/Telefonnummer
Trendthemen
AnthropicToDebutAfter$83IPOPricing
47,716 Aufrufe
218 Kommentare
Aktienfutures halten sich nahe der Nulllinie, da Anthropic den IPO vor dem Debüt mit 83 US-Dollar bewertet
Binance News
·8 Likes
·8.1k Aufrufe
BTCRemainsUnderPressureAfterHawkishFOMCMinutes
144,356 Aufrufe
1,618 Kommentare
NvidiaBoardReportedlySplitOverHuang’sReturn
67,162 Aufrufe
824 Kommentare