
Bit Trader Mark
8 Beiträge

Bit Trader Mark
2 Following
22 Follower
21 Like gegeben
Beiträge
$BTC $ETH $RAVE
Die aktuelle Situation zwischen den Vereinigten Staaten und dem Iran befindet sich an einem kritischen, fragilen Punkt nach einem großen militärischen Konflikt Anfang dieses Jahres. Stand April 21, 2026, befinden sich die beiden Nationen in einem Zustand von "kalten" Feindseligkeiten, gekennzeichnet durch einen wackeligen Waffenstillstand, See-Blockaden und stockenden diplomatischen Bemühungen.
Die Trump-Administration fordert die sofortige Wiedereröffnung der Straße von Hormuz und ein dauerhaftes Ende der Urananreicherung Irans als "Schwellenbedingungen."
Kryptowährung $WLFI
Ende 2024 gründete die Familie Trump World Liberty Financial, eine dezentrale Finanzplattform (DeFi).
Der Coin: Der native Token ist $WLFI.
Die IAEA erklärte kürzlich, dass der Iran gegen seine Verpflichtungen zur Nichtverbreitung verstößt. Während Angriffe mehrere Brennstoffkreislaufstandorte beschädigten, deuten Geheimdienstberichte darauf hin, dass der Iran weiterhin erhebliche Vorräte an hochangereichertem Uran besitzt und dass etwa die Hälfte seiner Raketenwerfer betriebsbereit bleibt.
Preisschwankungen: Die Ölpreise haben "tägliche Schwankungen" von 10 $ oder mehr gesehen. Zum Beispiel stiegen die Preise am 20. April um 5% (auf etwa 95 $/Barrel), einfach weil die U.S.
#KelpDAOExploitFreeze
#JointEscapeHatchforAaveETHLenders
#MarketRebound
Die aktuelle Situation zwischen den Vereinigten Staaten und dem Iran befindet sich an einem kritischen, fragilen Punkt nach einem großen militärischen Konflikt Anfang dieses Jahres. Stand April 21, 2026, befinden sich die beiden Nationen in einem Zustand von "kalten" Feindseligkeiten, gekennzeichnet durch einen wackeligen Waffenstillstand, See-Blockaden und stockenden diplomatischen Bemühungen.
Die Trump-Administration fordert die sofortige Wiedereröffnung der Straße von Hormuz und ein dauerhaftes Ende der Urananreicherung Irans als "Schwellenbedingungen."
Kryptowährung $WLFI
Ende 2024 gründete die Familie Trump World Liberty Financial, eine dezentrale Finanzplattform (DeFi).
Der Coin: Der native Token ist $WLFI.
Die IAEA erklärte kürzlich, dass der Iran gegen seine Verpflichtungen zur Nichtverbreitung verstößt. Während Angriffe mehrere Brennstoffkreislaufstandorte beschädigten, deuten Geheimdienstberichte darauf hin, dass der Iran weiterhin erhebliche Vorräte an hochangereichertem Uran besitzt und dass etwa die Hälfte seiner Raketenwerfer betriebsbereit bleibt.
Preisschwankungen: Die Ölpreise haben "tägliche Schwankungen" von 10 $ oder mehr gesehen. Zum Beispiel stiegen die Preise am 20. April um 5% (auf etwa 95 $/Barrel), einfach weil die U.S.
#KelpDAOExploitFreeze
#JointEscapeHatchforAaveETHLenders
#MarketRebound
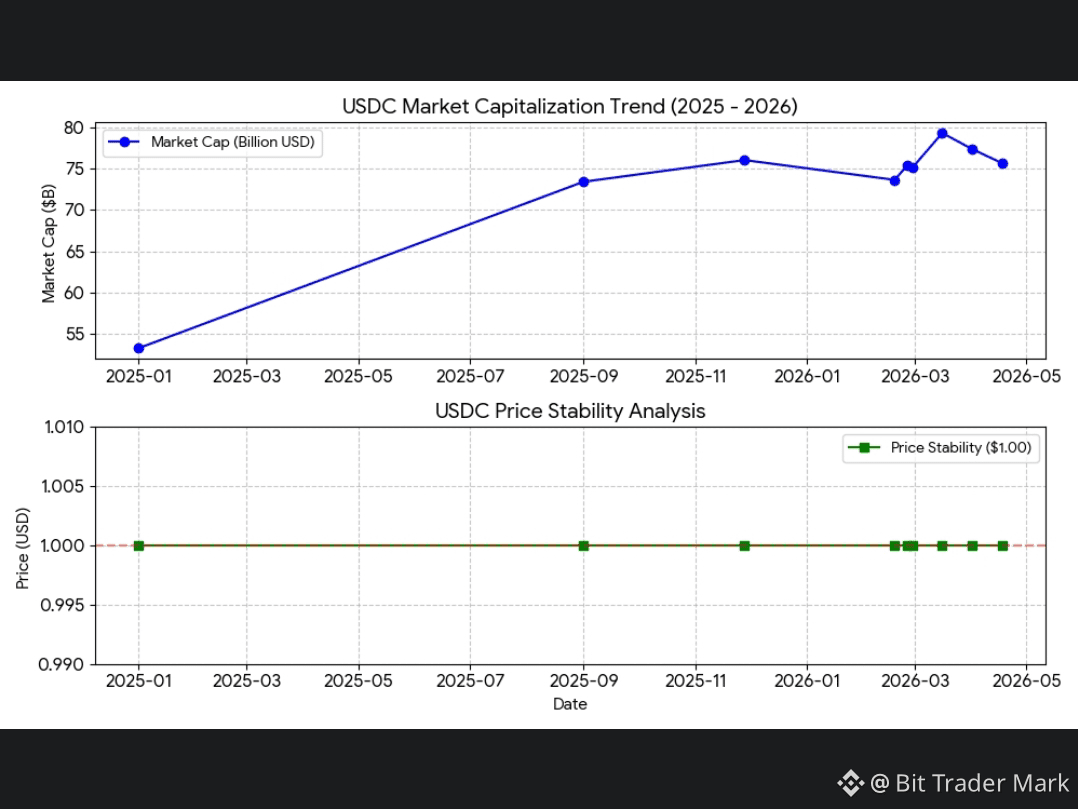
$USDC hat einen erheblichen Anstieg des im Umlauf befindlichen Angebots erlebt, das von etwa \$53,3 Milliarden im Januar 2025 auf einen Höchststand von fast \$79,29 Milliarden im März 2026 gewachsen ist. Dieses Wachstum von 48\% spiegelt eine starke Rückkehr von Liquidität in das dezentrale Finanzwesen (DeFi) wider und erhöht das institutionelle Vertrauen in $USDC für grenzüberschreitende Abwicklungen.
Preisstabilität (Der "Peg"): Treu seinem Design hat USDC einen stabilen Peg zum US-Dollar aufrechterhalten. Im Jahr 2025 und 2026 blieben die Preisbewegungen innerhalb einer engen Spanne von \$0,9936 bis \$1,0028, was das hohe Vertrauen des Marktes in die Transparenz und Liquidität der Reserven von Circle zeigt.
Wichtige Erkenntnisse & Aktuelle Trends
Regulatorischer Vorteil: Mit der vollständigen Durchsetzung der MiCA (Markets in Crypto-Assets)-Regulierung in der EU und der strengeren Aufsicht in den USA hat sich USDC als "sicherer Hafen" für regulierte Unternehmen etabliert. Es ist jetzt die bevorzugte Wahl für Börsen und institutionelle Plattformen, die Compliance priorisieren.
Erweiterte Nutzung (cirBTC): Im April 2026 kündigte Circle Pläne an, cirBTC, eine Wrapped-Version von Bitcoin, zu starten. Dieser Schritt wird erwartet, um USDC weiter in das Bitcoin-Ökosystem zu integrieren und eine nahtlosere besicherte Kreditvergabe und institutionellen Handel zu ermöglichen.
Grenzüberschreitende Dominanz: Etwa 12\% des gesamten Stablecoin-Volumens im Jahr 2025 stammte aus grenzüberschreitenden Swaps mit USDC. Seine Nutzung in Nordamerika und Asien bleibt besonders dominant, mit über 5,2 Millionen aktiven Wallets, die das Asset nutzen.
Institutionelle Akzeptanz: Umfragen Anfang 2026 zeigen, dass über 59\% der institutionellen Investoren planen, mehr als 5\% ihrer Portfolios in Stablecoin-gebundene Produkte zu investieren, wobei USDC der Hauptkandidat aufgrund seiner geprüften Reserve-Transparenz ist.
USD1: Der "Trump-gebundene" Stablecoin, der im ersten Jahr ein explosives Wachstum auf eine Marktkapitalisierung von \$4,69 Milliarden gesehen hat.
#ARKInvestReducedPositionsinCircleandBullish #Kalshi’sDisputewithNevada
#AltcoinRecoverySignals?
Preisstabilität (Der "Peg"): Treu seinem Design hat USDC einen stabilen Peg zum US-Dollar aufrechterhalten. Im Jahr 2025 und 2026 blieben die Preisbewegungen innerhalb einer engen Spanne von \$0,9936 bis \$1,0028, was das hohe Vertrauen des Marktes in die Transparenz und Liquidität der Reserven von Circle zeigt.
Wichtige Erkenntnisse & Aktuelle Trends
Regulatorischer Vorteil: Mit der vollständigen Durchsetzung der MiCA (Markets in Crypto-Assets)-Regulierung in der EU und der strengeren Aufsicht in den USA hat sich USDC als "sicherer Hafen" für regulierte Unternehmen etabliert. Es ist jetzt die bevorzugte Wahl für Börsen und institutionelle Plattformen, die Compliance priorisieren.
Erweiterte Nutzung (cirBTC): Im April 2026 kündigte Circle Pläne an, cirBTC, eine Wrapped-Version von Bitcoin, zu starten. Dieser Schritt wird erwartet, um USDC weiter in das Bitcoin-Ökosystem zu integrieren und eine nahtlosere besicherte Kreditvergabe und institutionellen Handel zu ermöglichen.
Grenzüberschreitende Dominanz: Etwa 12\% des gesamten Stablecoin-Volumens im Jahr 2025 stammte aus grenzüberschreitenden Swaps mit USDC. Seine Nutzung in Nordamerika und Asien bleibt besonders dominant, mit über 5,2 Millionen aktiven Wallets, die das Asset nutzen.
Institutionelle Akzeptanz: Umfragen Anfang 2026 zeigen, dass über 59\% der institutionellen Investoren planen, mehr als 5\% ihrer Portfolios in Stablecoin-gebundene Produkte zu investieren, wobei USDC der Hauptkandidat aufgrund seiner geprüften Reserve-Transparenz ist.
USD1: Der "Trump-gebundene" Stablecoin, der im ersten Jahr ein explosives Wachstum auf eine Marktkapitalisierung von \$4,69 Milliarden gesehen hat.
#ARKInvestReducedPositionsinCircleandBullish #Kalshi’sDisputewithNevada
#AltcoinRecoverySignals?
Übersetzung ansehen
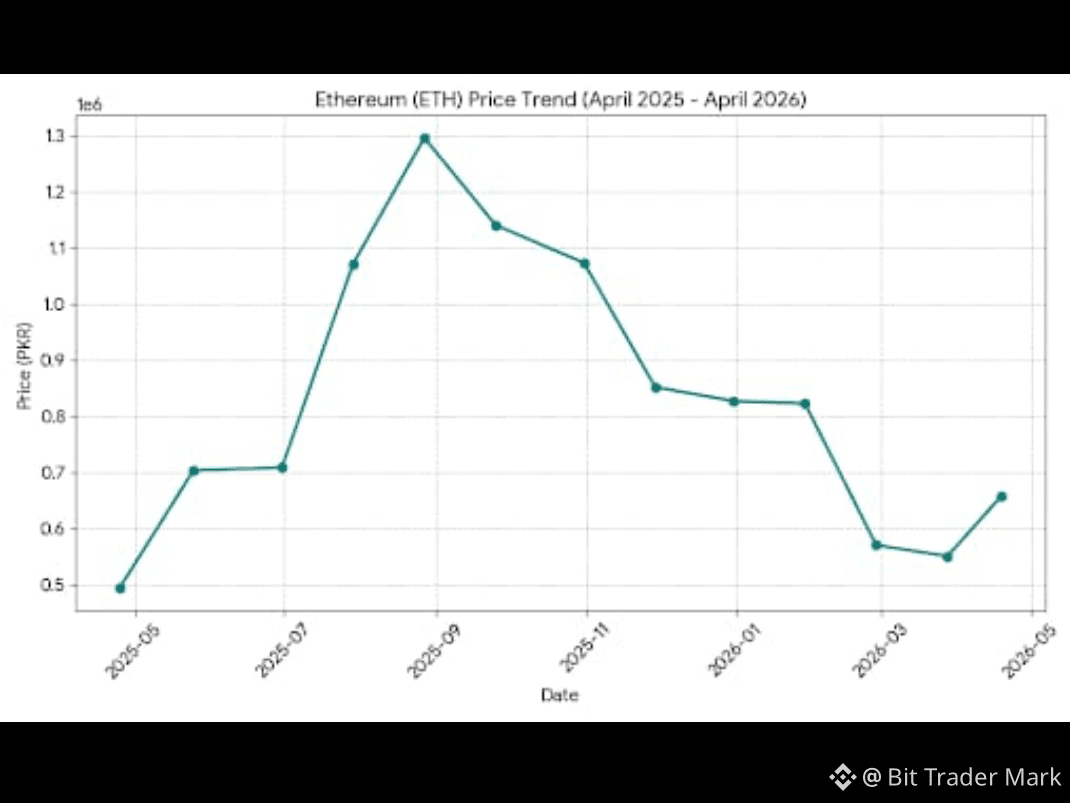
$ETH continues to be the foundation of the decentralized economy, though its market performance over the past year has been characterized by significant volatility. Below is an analysis of the current trends and network metrics.
Price Analysis (April 2025 – April 2026)
The Ethereum market experienced a "parabolic" phase followed by a sharp correction and recent recovery:
The 2025 Bull Run: From April to August 2025, Ethereum saw an aggressive rally, climbing from approximately 493,953 PKR to a peak of nearly 1,300,000 PKR (approx. \$4,600–\$4,900 USD). This was driven by institutional ETF inflows and high ecosystem activity.
Current Standing: As of April 19, 2026, Ethereum is showing signs of a rebound, currently trading at 657,622 PKR.
Key Network Metrics & Trends
Layer 2 Dominance: The "Dencun" upgrade has successfully shifted the bulk of $ETH activity to Layer 2 (L2) solutions like Arbitrum and Optimism. L2s now account for roughly 95\% of all transaction throughput, making the ecosystem more scalable than ever.
Drastic Fee Reduction: Average gas prices have plummeted. While users once paid over \$50 for a simple swap during peak times in previous years, mainnet fees have dropped by over 95\%, with L2 transactions often costing less than \$0.01.
Network Utility: Despite price fluctuations, the network remains highly active with approximately 600,000 daily active addresses. The total value locked (TVL) in DeFi protocols like Aave and Compound remains robust, stabilizing the network's fundamental value.Market Sentiment
While Ethereum has faced a challenging first quarter in 2026, its structural transition into a "settlement layer" for L2s is now complete. The current analysis suggests a period of accumulation as the market adjusts to the new low-fee environment and growing institutional participation through regulated ETFs.
#KelpDAOFacesAttack
#IranRejectsSecondRoundTalks
#AltcoinRecoverySignals?
#Kalshi’sDisputewithNevada
#CharlesSchwabtoRollOutSpotCryptoTrading
Price Analysis (April 2025 – April 2026)
The Ethereum market experienced a "parabolic" phase followed by a sharp correction and recent recovery:
The 2025 Bull Run: From April to August 2025, Ethereum saw an aggressive rally, climbing from approximately 493,953 PKR to a peak of nearly 1,300,000 PKR (approx. \$4,600–\$4,900 USD). This was driven by institutional ETF inflows and high ecosystem activity.
Current Standing: As of April 19, 2026, Ethereum is showing signs of a rebound, currently trading at 657,622 PKR.
Key Network Metrics & Trends
Layer 2 Dominance: The "Dencun" upgrade has successfully shifted the bulk of $ETH activity to Layer 2 (L2) solutions like Arbitrum and Optimism. L2s now account for roughly 95\% of all transaction throughput, making the ecosystem more scalable than ever.
Drastic Fee Reduction: Average gas prices have plummeted. While users once paid over \$50 for a simple swap during peak times in previous years, mainnet fees have dropped by over 95\%, with L2 transactions often costing less than \$0.01.
Network Utility: Despite price fluctuations, the network remains highly active with approximately 600,000 daily active addresses. The total value locked (TVL) in DeFi protocols like Aave and Compound remains robust, stabilizing the network's fundamental value.Market Sentiment
While Ethereum has faced a challenging first quarter in 2026, its structural transition into a "settlement layer" for L2s is now complete. The current analysis suggests a period of accumulation as the market adjusts to the new low-fee environment and growing institutional participation through regulated ETFs.
#KelpDAOFacesAttack
#IranRejectsSecondRoundTalks
#AltcoinRecoverySignals?
#Kalshi’sDisputewithNevada
#CharlesSchwabtoRollOutSpotCryptoTrading
$BTC Analyse: 18. April 2026
Bitcoin hat diese Woche ein großes Comeback gefeiert und endlich einen zehnwöchigen Konsolidierungsbereich durchbrochen. Nach einem brutalen Start ins Jahr 2026, als die Preise auf 60.000 $ fielen, haben die Bullen die Erzählung zurückerobert.
1. Visuelle Preissnapshot
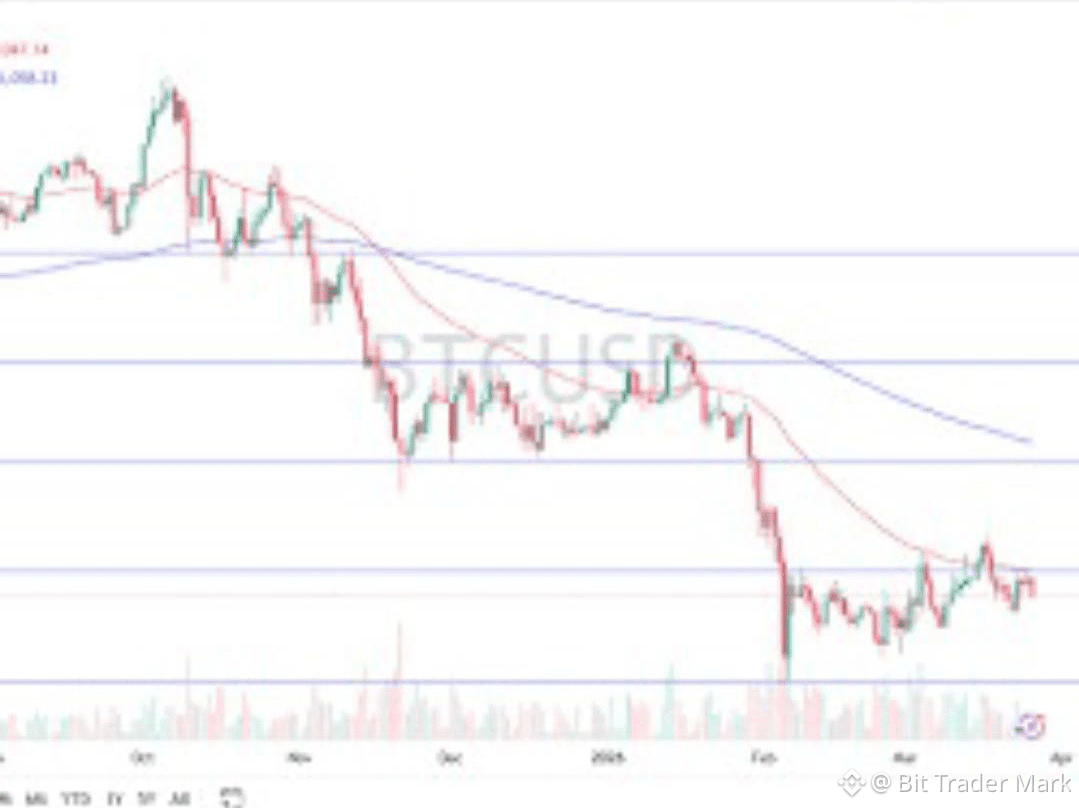
Das folgende Diagramm veranschaulicht den "Erholungsbogen" von den Februar-Tiefs bis zum heutigen Ausbruch.
Hinweis: Dieses Bild stellt die aktuelle Marktsentiment und technische Struktur von Bitcoins 2026er Erholung dar.
2. Technische Analyse: Der Ausbruch
Der Widerstandswechsel: Fast zwei Monate lang hatte Bitcoin Schwierigkeiten, über 75.000 $ zu bleiben. Am Donnerstag hat es diesen "Deckel" entscheidend durchbrochen und erreichte einen Höchststand von 78.337 $.
Gleitende Durchschnitte: BTC ist wieder über seinen 100-Tage-Durchschnitt gesprungen. In technischen Begriffen ist dies ein "Regimewechsel" – von einer bärischen Korrekturphase zurück in einen bullischen Trend.
Die Liquidationen: Die Bewegung wurde durch einen Short-Squeeze beschleunigt. Etwa 537 Millionen $ an bärischen Wetten wurden innerhalb von 24 Stunden liquidiert, was als Treibstoff für den Preissprung diente.
Die Quintessenz
$BTC sieht stärker aus als je zuvor in diesem Jahr. Allerdings, mit "realisierten Gewinn"-Metriken, die ihre höchsten Werte seit Februar erreichen, seien Sie nicht überrascht, wenn wir einen kurzen Rückgang auf 74.000 $ sehen, um den alten Widerstand "erneut zu testen", bevor wir versuchen, die psychologische Barriere von 80.000 $ zu durchbrechen.
#IranRejectsSecondRoundTalks
#AltcoinRecoverySignals?
#ARKInvestReducedPositionsinCircleandBullish
Bitcoin hat diese Woche ein großes Comeback gefeiert und endlich einen zehnwöchigen Konsolidierungsbereich durchbrochen. Nach einem brutalen Start ins Jahr 2026, als die Preise auf 60.000 $ fielen, haben die Bullen die Erzählung zurückerobert.
1. Visuelle Preissnapshot
Das folgende Diagramm veranschaulicht den "Erholungsbogen" von den Februar-Tiefs bis zum heutigen Ausbruch.
Hinweis: Dieses Bild stellt die aktuelle Marktsentiment und technische Struktur von Bitcoins 2026er Erholung dar.
2. Technische Analyse: Der Ausbruch
Der Widerstandswechsel: Fast zwei Monate lang hatte Bitcoin Schwierigkeiten, über 75.000 $ zu bleiben. Am Donnerstag hat es diesen "Deckel" entscheidend durchbrochen und erreichte einen Höchststand von 78.337 $.
Gleitende Durchschnitte: BTC ist wieder über seinen 100-Tage-Durchschnitt gesprungen. In technischen Begriffen ist dies ein "Regimewechsel" – von einer bärischen Korrekturphase zurück in einen bullischen Trend.
Die Liquidationen: Die Bewegung wurde durch einen Short-Squeeze beschleunigt. Etwa 537 Millionen $ an bärischen Wetten wurden innerhalb von 24 Stunden liquidiert, was als Treibstoff für den Preissprung diente.
Die Quintessenz
$BTC sieht stärker aus als je zuvor in diesem Jahr. Allerdings, mit "realisierten Gewinn"-Metriken, die ihre höchsten Werte seit Februar erreichen, seien Sie nicht überrascht, wenn wir einen kurzen Rückgang auf 74.000 $ sehen, um den alten Widerstand "erneut zu testen", bevor wir versuchen, die psychologische Barriere von 80.000 $ zu durchbrechen.
#IranRejectsSecondRoundTalks
#AltcoinRecoverySignals?
#ARKInvestReducedPositionsinCircleandBullish
Übersetzung ansehen
$BTC
Market Analysis
Bitcoin continues to exhibit significant volatility as it tests critical resistance levels. After a period of consolidation, market sentiment remains cautiously optimistic, driven by several key factors:
Technical Outlook: BTC is currently hovering around a major psychological level. Analysts are watching the 200-day Moving Average and the Relative Strength Index (RSI) for signs of overbought conditions or a potential breakout. A sustained close above recent resistance could pave the way for a move toward yearly highs.
Institutional Interest: The ongoing accumulation by spot ETF issuers continues to provide a "floor" for the price, reducing the impact of liquidations during flash crashes.
Macro Environment: Investors are closely monitoring upcoming CPI data and Federal Reserve commentary. A shift toward a more dovish monetary policy is generally seen as a bullish catalyst for "risk-on" assets like Bitcoin.
Key Levels to Watch:
Support: If the price dips, strong buy-side liquidity is expected at the $60,000 - $62,000 zone.
Resistance: A clean break above $68,000 could trigger a short squeeze, propelling the price back toward the $70k+ range.
#AltcoinRecoverySignals? #BitcoinPriceTrends
Market Analysis
Bitcoin continues to exhibit significant volatility as it tests critical resistance levels. After a period of consolidation, market sentiment remains cautiously optimistic, driven by several key factors:
Technical Outlook: BTC is currently hovering around a major psychological level. Analysts are watching the 200-day Moving Average and the Relative Strength Index (RSI) for signs of overbought conditions or a potential breakout. A sustained close above recent resistance could pave the way for a move toward yearly highs.
Institutional Interest: The ongoing accumulation by spot ETF issuers continues to provide a "floor" for the price, reducing the impact of liquidations during flash crashes.
Macro Environment: Investors are closely monitoring upcoming CPI data and Federal Reserve commentary. A shift toward a more dovish monetary policy is generally seen as a bullish catalyst for "risk-on" assets like Bitcoin.
Key Levels to Watch:
Support: If the price dips, strong buy-side liquidity is expected at the $60,000 - $62,000 zone.
Resistance: A clean break above $68,000 could trigger a short squeeze, propelling the price back toward the $70k+ range.
#AltcoinRecoverySignals? #BitcoinPriceTrends
Anmelden und weiter Inhalte entdecken