

悄悄滴闷声发大财
3.2k Beiträge

悄悄滴闷声发大财
Melden
Nutzer blockieren
10 Following
202 Follower
242 Like gegeben
Beiträge
Alle
Zitierungen
·
--
$POLYX
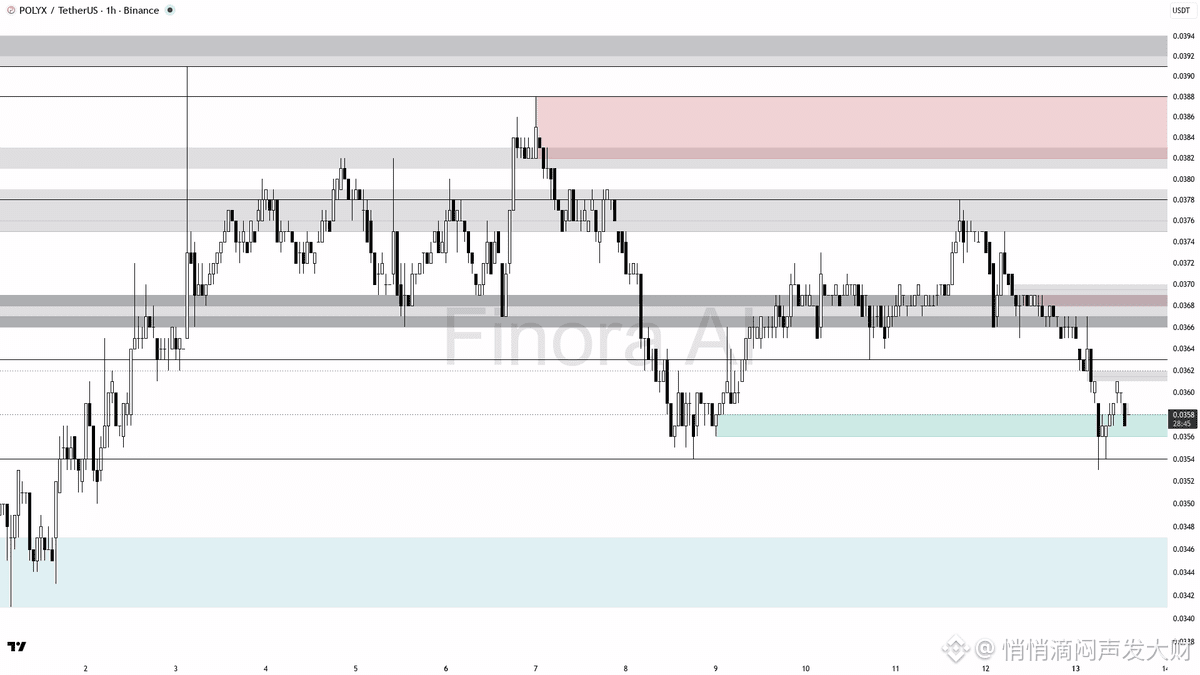
$POLYX 1h Price Chart Analysis: - Bärisches Sentiment bleibt dominant, aber kurzfristiges Erholungspotenzial baut sich auf - Die wichtige Nachfragezone nahe 0.0354 könnte einen Rebound auslösen mit +3-4% Aufwärtspotenzial, das eingezeichnet ist - Starker Widerstandscluster zwischen 0.0367 und 0.0378 stellt eine große Hürde 🚧 - Jüngster Liquiditäts-Grab unter 0.0353 deutet auf Manipulation oder eine Falle hin - Beobachte genau, denn eine entscheidende Bewegung könnte den kurzfristigen Momentum-Impuls kippen…
👇 Vollständige Analyse mit exakten Entry-, TP- & SL-Leveln:
→ tinyurl.com/FinoraBot
#POLYX
{future}(POLYXUSDT)
$POLYX
$POLYX 1h Price Chart Analysis: - Bärisches Sentiment bleibt dominant, aber kurzfristiges Erholungspotenzial baut sich auf - Die wichtige Nachfragezone nahe 0.0354 könnte einen Rebound auslösen mit +3-4% Aufwärtspotenzial, das eingezeichnet ist - Starker Widerstandscluster zwischen 0.0367 und 0.0378 stellt eine große Hürde 🚧 - Jüngster Liquiditäts-Grab unter 0.0353 deutet auf Manipulation oder eine Falle hin - Beobachte genau, denn eine entscheidende Bewegung könnte den kurzfristigen Momentum-Impuls kippen…
👇 Vollständige Analyse mit exakten Entry-, TP- & SL-Leveln:
→ tinyurl.com/FinoraBot
#POLYX
$POLYX 1h Price Chart Analysis: - Bärisches Sentiment bleibt dominant, aber kurzfristiges Erholungspotenzial baut sich auf - Die wichtige Nachfragezone nahe 0.0354 könnte einen Rebound auslösen mit +3-4% Aufwärtspotenzial, das eingezeichnet ist - Starker Widerstandscluster zwischen 0.0367 und 0.0378 stellt eine große Hürde 🚧 - Jüngster Liquiditäts-Grab unter 0.0353 deutet auf Manipulation oder eine Falle hin - Beobachte genau, denn eine entscheidende Bewegung könnte den kurzfristigen Momentum-Impuls kippen…
👇 Vollständige Analyse mit exakten Entry-, TP- & SL-Leveln:
→ tinyurl.com/FinoraBot
#POLYX
1
65
·
--
$XPIN
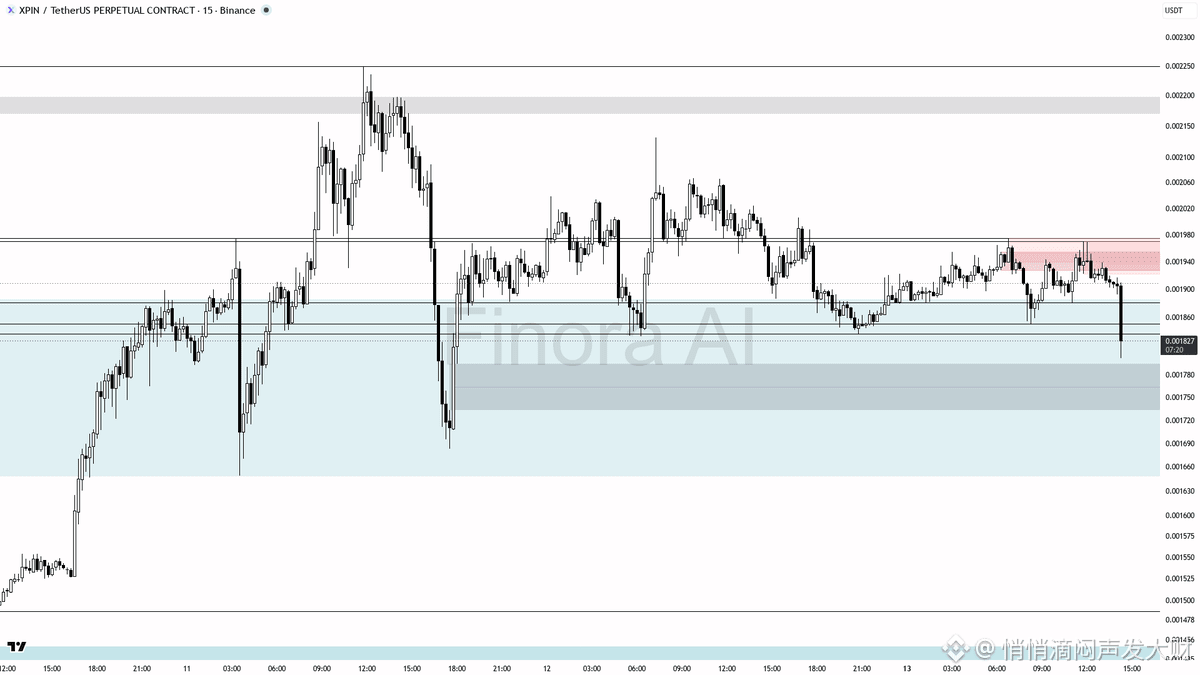
❄️ Doppelte Warnung: 4,4% Rückgang & 9,3x Umsatz auf $XPIN
- Aufgrund des extremen Verkaufsdrucks und aller Indikatoren, die nach unten zeigen, ist weiterer Abwärtsdruck wahrscheinlich, es sei denn, es kommt zu einer schnellen Erholung über 0,001836.
- Wenn der Kurs sich unter 0,001836 konsolidiert und einen schwachen Bounce bildet, prüfe einen Einstieg in eine Short-Position bei 0,001836–0,001850 mit einem Ziel bei 0,001705. Lege den Stop-Loss oberhalb des zuletzt gesehenen Swing-Highs nach dem Breakdown fest (ca. 0,001871).
- Beispiel-Szenario: Wenn der Kurs 0,001836–0,001850 erneut testet, eine bärische Engulfing- oder Ablehnungskerze bildet und es nicht gelingt, die Rückeroberung zu schaffen, gehe short. Nimm den Gewinn bei der 0,001705-Region. Der Stop-Loss sollte oberhalb des letzten Swing-Highs platziert werden.
- Wenn der Kurs hingegen 0,001850 zurückerobert, mit starken bullischen Reversal-Candles und steigender Kauf-Volumenbildung, könnte das auf einen Liquidity-Grab und Trap hinweisen, und die Ausrichtung würde von neutral zu bullish wechseln für einen Scalps zurück auf 0,001871–0,001927.
- In der aktuellen Konstellation erwarte ich weiteren Abwärtsdruck, sofern keine klaren Reversal-Signale entstehen. Dieses Ereignis wurde vermutlich durch Stop-Loss-Kaskaden, Panikverkäufe oder einen großen Marktteilnehmer verursacht, der in die Schwäche hinein verteilt.
- Betrachte Long-Setups nur, wenn du nach dem Liquidity-Sweep unter 0,001823 eine starke, bestätigte Umkehr siehst.
📝 Das ist keine Anlageberatung, sondern nur ein Schulungsbericht. Trade sicher und warte immer auf eine korrekte Bestätigung, bevor du einsteigst.
📊 Hol dir eine detaillierte kostenlose Analyse zu jeder Coin auf jedem Timeframe, den du möchtest. Teste Finora AI – Dein Trade-Buddy – kostenlos → tinyurl.com/FinoraBot
#XPIN
{future}(XPINUSDT)
$XPIN
❄️ Doppelte Warnung: 4,4% Rückgang & 9,3x Umsatz auf $XPIN
- Aufgrund des extremen Verkaufsdrucks und aller Indikatoren, die nach unten zeigen, ist weiterer Abwärtsdruck wahrscheinlich, es sei denn, es kommt zu einer schnellen Erholung über 0,001836.
- Wenn der Kurs sich unter 0,001836 konsolidiert und einen schwachen Bounce bildet, prüfe einen Einstieg in eine Short-Position bei 0,001836–0,001850 mit einem Ziel bei 0,001705. Lege den Stop-Loss oberhalb des zuletzt gesehenen Swing-Highs nach dem Breakdown fest (ca. 0,001871).
- Beispiel-Szenario: Wenn der Kurs 0,001836–0,001850 erneut testet, eine bärische Engulfing- oder Ablehnungskerze bildet und es nicht gelingt, die Rückeroberung zu schaffen, gehe short. Nimm den Gewinn bei der 0,001705-Region. Der Stop-Loss sollte oberhalb des letzten Swing-Highs platziert werden.
- Wenn der Kurs hingegen 0,001850 zurückerobert, mit starken bullischen Reversal-Candles und steigender Kauf-Volumenbildung, könnte das auf einen Liquidity-Grab und Trap hinweisen, und die Ausrichtung würde von neutral zu bullish wechseln für einen Scalps zurück auf 0,001871–0,001927.
- In der aktuellen Konstellation erwarte ich weiteren Abwärtsdruck, sofern keine klaren Reversal-Signale entstehen. Dieses Ereignis wurde vermutlich durch Stop-Loss-Kaskaden, Panikverkäufe oder einen großen Marktteilnehmer verursacht, der in die Schwäche hinein verteilt.
- Betrachte Long-Setups nur, wenn du nach dem Liquidity-Sweep unter 0,001823 eine starke, bestätigte Umkehr siehst.
📝 Das ist keine Anlageberatung, sondern nur ein Schulungsbericht. Trade sicher und warte immer auf eine korrekte Bestätigung, bevor du einsteigst.
📊 Hol dir eine detaillierte kostenlose Analyse zu jeder Coin auf jedem Timeframe, den du möchtest. Teste Finora AI – Dein Trade-Buddy – kostenlos → tinyurl.com/FinoraBot
#XPIN
❄️ Doppelte Warnung: 4,4% Rückgang & 9,3x Umsatz auf $XPIN
- Aufgrund des extremen Verkaufsdrucks und aller Indikatoren, die nach unten zeigen, ist weiterer Abwärtsdruck wahrscheinlich, es sei denn, es kommt zu einer schnellen Erholung über 0,001836.
- Wenn der Kurs sich unter 0,001836 konsolidiert und einen schwachen Bounce bildet, prüfe einen Einstieg in eine Short-Position bei 0,001836–0,001850 mit einem Ziel bei 0,001705. Lege den Stop-Loss oberhalb des zuletzt gesehenen Swing-Highs nach dem Breakdown fest (ca. 0,001871).
- Beispiel-Szenario: Wenn der Kurs 0,001836–0,001850 erneut testet, eine bärische Engulfing- oder Ablehnungskerze bildet und es nicht gelingt, die Rückeroberung zu schaffen, gehe short. Nimm den Gewinn bei der 0,001705-Region. Der Stop-Loss sollte oberhalb des letzten Swing-Highs platziert werden.
- Wenn der Kurs hingegen 0,001850 zurückerobert, mit starken bullischen Reversal-Candles und steigender Kauf-Volumenbildung, könnte das auf einen Liquidity-Grab und Trap hinweisen, und die Ausrichtung würde von neutral zu bullish wechseln für einen Scalps zurück auf 0,001871–0,001927.
- In der aktuellen Konstellation erwarte ich weiteren Abwärtsdruck, sofern keine klaren Reversal-Signale entstehen. Dieses Ereignis wurde vermutlich durch Stop-Loss-Kaskaden, Panikverkäufe oder einen großen Marktteilnehmer verursacht, der in die Schwäche hinein verteilt.
- Betrachte Long-Setups nur, wenn du nach dem Liquidity-Sweep unter 0,001823 eine starke, bestätigte Umkehr siehst.
📝 Das ist keine Anlageberatung, sondern nur ein Schulungsbericht. Trade sicher und warte immer auf eine korrekte Bestätigung, bevor du einsteigst.
📊 Hol dir eine detaillierte kostenlose Analyse zu jeder Coin auf jedem Timeframe, den du möchtest. Teste Finora AI – Dein Trade-Buddy – kostenlos → tinyurl.com/FinoraBot
#XPIN
180
·
--
$AIOT
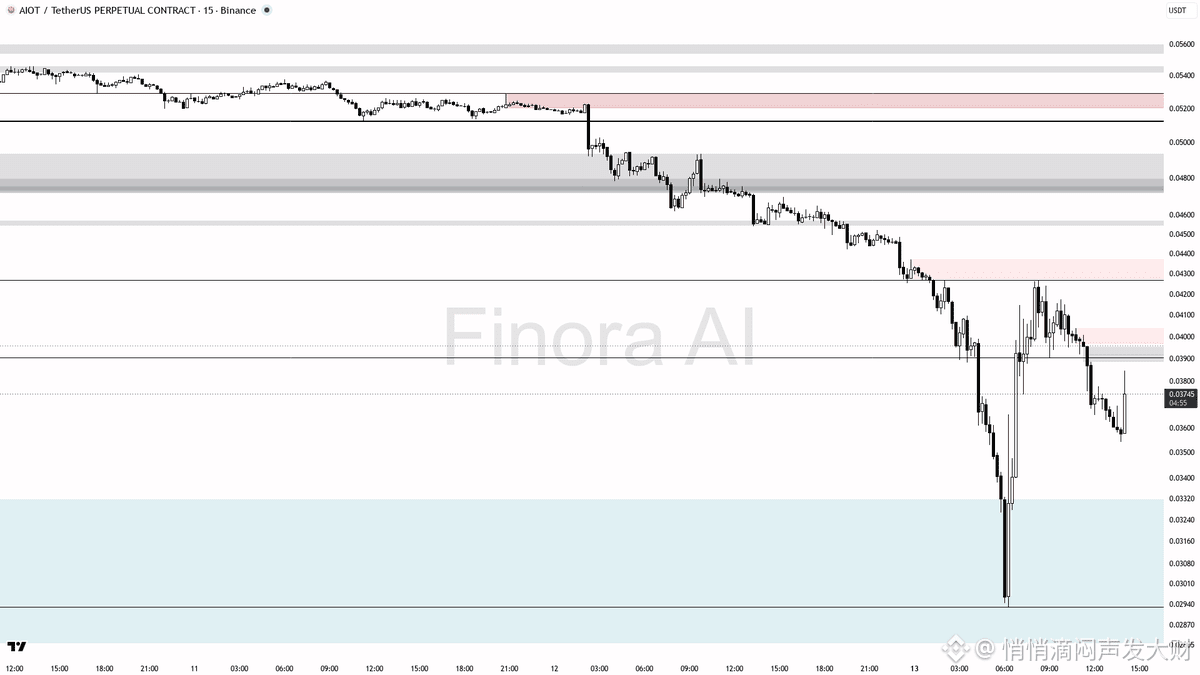
🔺 2.9x Kauf-Volumen-Spike bei $AIOT : Ausbruch oder Erschöpfung? Finora AI 15m-Übersicht
- Bei so einem Volumen-Spike und der schnellen Erholung nach einem Liquidity-Sweep unter dem zuletzt markierten Swing-Low erwarte ich, dass der Kurs steigt, solange 0.03392 als Unterstützung hält.
- Das ideale Szenario ist ein Rücksetzer in Richtung 0.03392, gefolgt von einer bullischen Bestätigung (z. B. eine Pin-Bar mit langem unteren Docht oder ein starkes Reversal-Signal auf 5m).
- Wenn der Kurs über 0.03769 schließt, mit starkem Volumen und bullischen Kerzen, kann ein Long-Entry beim Ausbruch in Betracht gezogen werden.
- Entry: Warte auf Bestätigung bei 0.03769 (Break und Retest) oder nahe 0.03392 (Ablehnung und Reversal). Beispiel: Wenn du bei 0.03700–0.03769 ein bullisches Engulfing siehst, oder nach einem Test von 0.03392 auf 5m ein klares höheres Tief entsteht, gehe long.
- Take Profits bei 0.04269 und 0.04452. Wenn der Impuls stark bleibt, ziehe auch Teilgewinne bei 0.0454 und sogar 0.04934 in Betracht.
- Setze deinen Stop unter dem Swing-Low, das durch das Bestätigungs-Setup entstanden ist (z. B. dem Docht-Tief nach einer Pin-Bar oder dem Struktur-Tief nach einem bullischen Reversal-Muster).
- Wenn der Kurs 0.03392 verliert bei starkem Verkauf, oder wenn er ein neues Tief unter 0.02931 macht, verschiebt sich meine Einschätzung ins Bärische und ich würde Short-Chancen bei einem Retest der gebrochenen Unterstützung beobachten.
📝 Das ist keine Anlageberatung, sondern ein Bildungsbericht, der dir helfen soll, die aktuelle Struktur und die Volumen-Anomalie einzuordnen—trade safe und nutze immer korrektes Risk Management!
📊 Erhalte eine detaillierte kostenlose Analyse von jeder Coin, auf jedem Timeframe, den du möchtest. Teste Finora AI – dein Trade-Buddy kostenlos → tinyurl.com/FinoraBot
#AIOT
{future}(AIOTUSDT)
$AIOT
🔺 2.9x Kauf-Volumen-Spike bei $AIOT : Ausbruch oder Erschöpfung? Finora AI 15m-Übersicht
- Bei so einem Volumen-Spike und der schnellen Erholung nach einem Liquidity-Sweep unter dem zuletzt markierten Swing-Low erwarte ich, dass der Kurs steigt, solange 0.03392 als Unterstützung hält.
- Das ideale Szenario ist ein Rücksetzer in Richtung 0.03392, gefolgt von einer bullischen Bestätigung (z. B. eine Pin-Bar mit langem unteren Docht oder ein starkes Reversal-Signal auf 5m).
- Wenn der Kurs über 0.03769 schließt, mit starkem Volumen und bullischen Kerzen, kann ein Long-Entry beim Ausbruch in Betracht gezogen werden.
- Entry: Warte auf Bestätigung bei 0.03769 (Break und Retest) oder nahe 0.03392 (Ablehnung und Reversal). Beispiel: Wenn du bei 0.03700–0.03769 ein bullisches Engulfing siehst, oder nach einem Test von 0.03392 auf 5m ein klares höheres Tief entsteht, gehe long.
- Take Profits bei 0.04269 und 0.04452. Wenn der Impuls stark bleibt, ziehe auch Teilgewinne bei 0.0454 und sogar 0.04934 in Betracht.
- Setze deinen Stop unter dem Swing-Low, das durch das Bestätigungs-Setup entstanden ist (z. B. dem Docht-Tief nach einer Pin-Bar oder dem Struktur-Tief nach einem bullischen Reversal-Muster).
- Wenn der Kurs 0.03392 verliert bei starkem Verkauf, oder wenn er ein neues Tief unter 0.02931 macht, verschiebt sich meine Einschätzung ins Bärische und ich würde Short-Chancen bei einem Retest der gebrochenen Unterstützung beobachten.
📝 Das ist keine Anlageberatung, sondern ein Bildungsbericht, der dir helfen soll, die aktuelle Struktur und die Volumen-Anomalie einzuordnen—trade safe und nutze immer korrektes Risk Management!
📊 Erhalte eine detaillierte kostenlose Analyse von jeder Coin, auf jedem Timeframe, den du möchtest. Teste Finora AI – dein Trade-Buddy kostenlos → tinyurl.com/FinoraBot
#AIOT
🔺 2.9x Kauf-Volumen-Spike bei $AIOT : Ausbruch oder Erschöpfung? Finora AI 15m-Übersicht
- Bei so einem Volumen-Spike und der schnellen Erholung nach einem Liquidity-Sweep unter dem zuletzt markierten Swing-Low erwarte ich, dass der Kurs steigt, solange 0.03392 als Unterstützung hält.
- Das ideale Szenario ist ein Rücksetzer in Richtung 0.03392, gefolgt von einer bullischen Bestätigung (z. B. eine Pin-Bar mit langem unteren Docht oder ein starkes Reversal-Signal auf 5m).
- Wenn der Kurs über 0.03769 schließt, mit starkem Volumen und bullischen Kerzen, kann ein Long-Entry beim Ausbruch in Betracht gezogen werden.
- Entry: Warte auf Bestätigung bei 0.03769 (Break und Retest) oder nahe 0.03392 (Ablehnung und Reversal). Beispiel: Wenn du bei 0.03700–0.03769 ein bullisches Engulfing siehst, oder nach einem Test von 0.03392 auf 5m ein klares höheres Tief entsteht, gehe long.
- Take Profits bei 0.04269 und 0.04452. Wenn der Impuls stark bleibt, ziehe auch Teilgewinne bei 0.0454 und sogar 0.04934 in Betracht.
- Setze deinen Stop unter dem Swing-Low, das durch das Bestätigungs-Setup entstanden ist (z. B. dem Docht-Tief nach einer Pin-Bar oder dem Struktur-Tief nach einem bullischen Reversal-Muster).
- Wenn der Kurs 0.03392 verliert bei starkem Verkauf, oder wenn er ein neues Tief unter 0.02931 macht, verschiebt sich meine Einschätzung ins Bärische und ich würde Short-Chancen bei einem Retest der gebrochenen Unterstützung beobachten.
📝 Das ist keine Anlageberatung, sondern ein Bildungsbericht, der dir helfen soll, die aktuelle Struktur und die Volumen-Anomalie einzuordnen—trade safe und nutze immer korrektes Risk Management!
📊 Erhalte eine detaillierte kostenlose Analyse von jeder Coin, auf jedem Timeframe, den du möchtest. Teste Finora AI – dein Trade-Buddy kostenlos → tinyurl.com/FinoraBot
#AIOT
68
·
--
$BTC
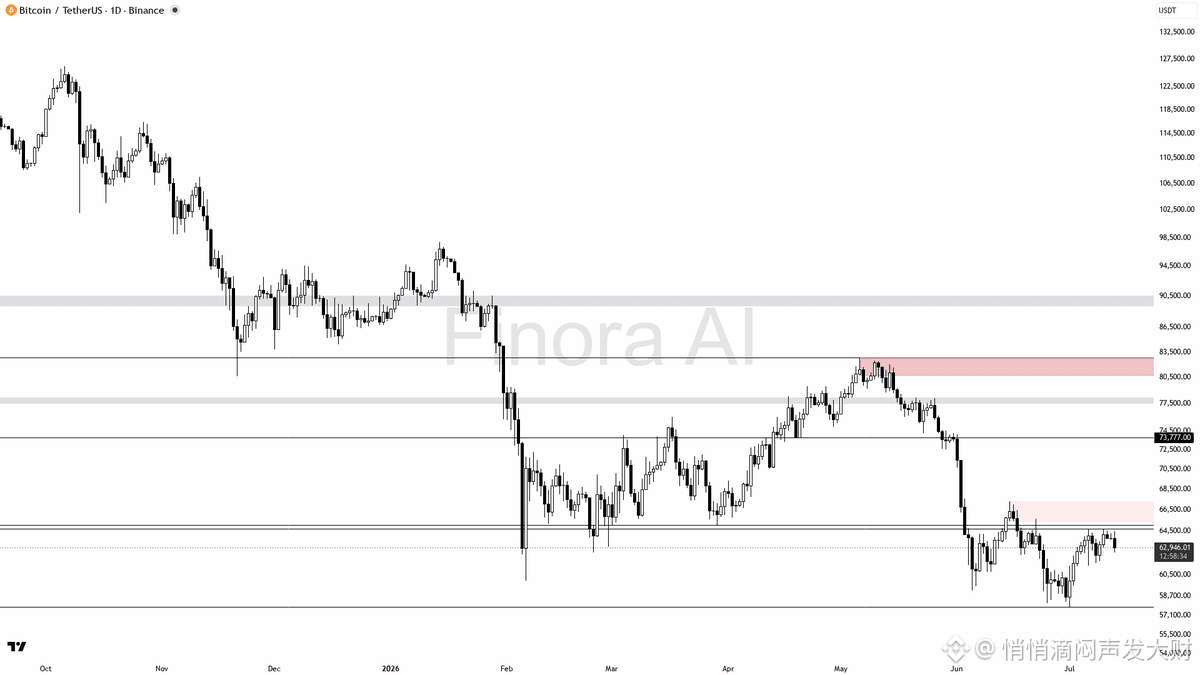
$BTC 1D Lesen: - Derzeit ist der Trend weiterhin bärisch, daher erwarte ich, dass der Kurs im Bereich 64.700–67.800 auf starken Widerstand trifft. Ohne einen starken Ausbruch und einen Tagesabschluss über 69.000 sehe ich nur begrenztes Aufwärtspotenzial.
- Meine wichtigste Erwartung ist eine Abweisung vom Widerstandsbereich 64.700–67.800, was zu einem Rückgang in Richtung 61.500 und möglicherweise 59.130 führt.
- Wenn der Kurs 69.000 bricht und darüber schließt und dies bestätigt wird, würde sich meine bärische Einschätzung umkehren, und ich würde einen Anstieg in Richtung 78.800 und darüber erwarten.
- Für Short-Trades: Einstieg bei 64.700–67.800 mit Bestätigung. Take-Profit-Ziele bei 61.500 und 59.130. Der Stop-Loss sollte oberhalb des Swing-High liegen, das die Umkehr ausgelöst hat (wahrscheinlich 69.000 oder höher).
- Für Long-Trades: Nur wenn der Kurs Liquidität unter 59.130 abgreift und eine starke bullische Umkehr zeigt. Dann Ziel 64.700–65.500, mit Stop-Loss unter dem Swing-Low, das die Umkehr ausgelöst hat.
- Auf Bestätigung achten! Achte vor jeder Trade-Eingabe auf Umkehrkerzen, fehlgeschlagene Ausbrüche oder klare Strukturbrüche auf niedrigeren Timeframes.
🚨 Lass KI den Markt scannen und Handelssignale liefern.
Finora kostenlos testen → tinyurl.com/FinoraBot
#BTC
{future}(BTCUSDT)
$BTC
$BTC 1D Lesen: - Derzeit ist der Trend weiterhin bärisch, daher erwarte ich, dass der Kurs im Bereich 64.700–67.800 auf starken Widerstand trifft. Ohne einen starken Ausbruch und einen Tagesabschluss über 69.000 sehe ich nur begrenztes Aufwärtspotenzial.
- Meine wichtigste Erwartung ist eine Abweisung vom Widerstandsbereich 64.700–67.800, was zu einem Rückgang in Richtung 61.500 und möglicherweise 59.130 führt.
- Wenn der Kurs 69.000 bricht und darüber schließt und dies bestätigt wird, würde sich meine bärische Einschätzung umkehren, und ich würde einen Anstieg in Richtung 78.800 und darüber erwarten.
- Für Short-Trades: Einstieg bei 64.700–67.800 mit Bestätigung. Take-Profit-Ziele bei 61.500 und 59.130. Der Stop-Loss sollte oberhalb des Swing-High liegen, das die Umkehr ausgelöst hat (wahrscheinlich 69.000 oder höher).
- Für Long-Trades: Nur wenn der Kurs Liquidität unter 59.130 abgreift und eine starke bullische Umkehr zeigt. Dann Ziel 64.700–65.500, mit Stop-Loss unter dem Swing-Low, das die Umkehr ausgelöst hat.
- Auf Bestätigung achten! Achte vor jeder Trade-Eingabe auf Umkehrkerzen, fehlgeschlagene Ausbrüche oder klare Strukturbrüche auf niedrigeren Timeframes.
🚨 Lass KI den Markt scannen und Handelssignale liefern.
Finora kostenlos testen → tinyurl.com/FinoraBot
#BTC
$BTC 1D Lesen: - Derzeit ist der Trend weiterhin bärisch, daher erwarte ich, dass der Kurs im Bereich 64.700–67.800 auf starken Widerstand trifft. Ohne einen starken Ausbruch und einen Tagesabschluss über 69.000 sehe ich nur begrenztes Aufwärtspotenzial.
- Meine wichtigste Erwartung ist eine Abweisung vom Widerstandsbereich 64.700–67.800, was zu einem Rückgang in Richtung 61.500 und möglicherweise 59.130 führt.
- Wenn der Kurs 69.000 bricht und darüber schließt und dies bestätigt wird, würde sich meine bärische Einschätzung umkehren, und ich würde einen Anstieg in Richtung 78.800 und darüber erwarten.
- Für Short-Trades: Einstieg bei 64.700–67.800 mit Bestätigung. Take-Profit-Ziele bei 61.500 und 59.130. Der Stop-Loss sollte oberhalb des Swing-High liegen, das die Umkehr ausgelöst hat (wahrscheinlich 69.000 oder höher).
- Für Long-Trades: Nur wenn der Kurs Liquidität unter 59.130 abgreift und eine starke bullische Umkehr zeigt. Dann Ziel 64.700–65.500, mit Stop-Loss unter dem Swing-Low, das die Umkehr ausgelöst hat.
- Auf Bestätigung achten! Achte vor jeder Trade-Eingabe auf Umkehrkerzen, fehlgeschlagene Ausbrüche oder klare Strukturbrüche auf niedrigeren Timeframes.
🚨 Lass KI den Markt scannen und Handelssignale liefern.
Finora kostenlos testen → tinyurl.com/FinoraBot
#BTC
26
·
--
$LUMIA
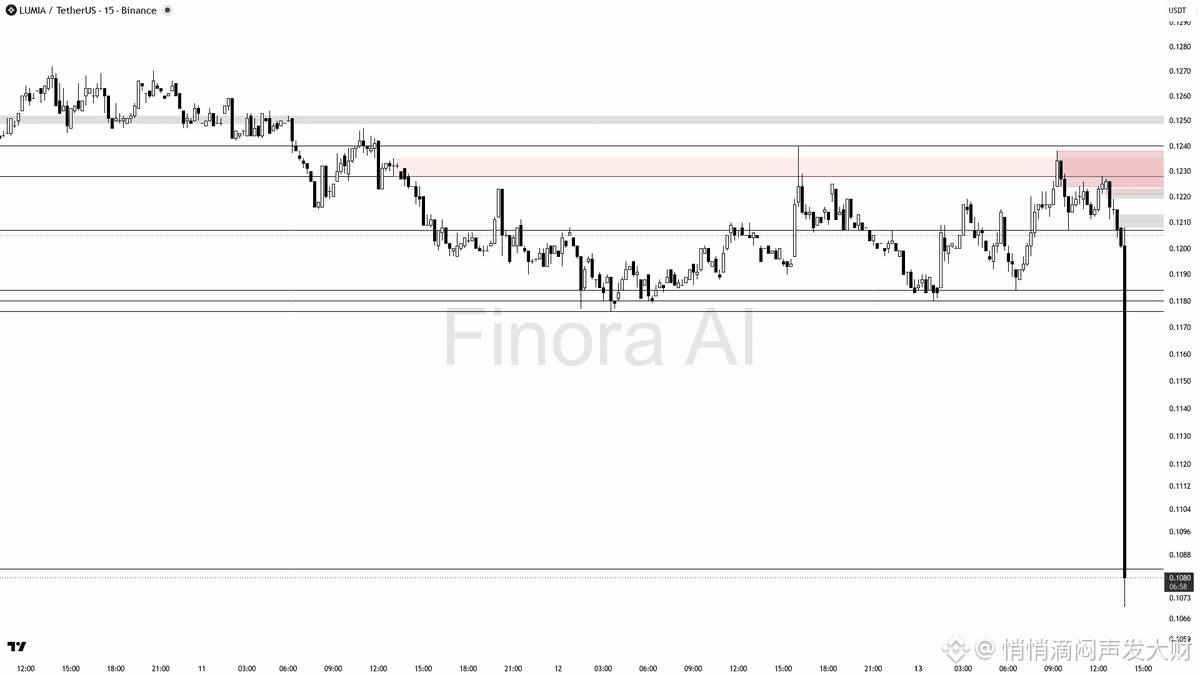
📉 4.5% Absturz & 23.8x Volumen-Spike bei $LUMIA – Panik oder Chance?
- Ich erwarte, dass es voraussichtlich noch weiter nach unten geht, sofern der Kurs nicht schnell zurückerobert und über 0.1123 schließt oder – wichtiger – über 0.1142 bei einem starken Rebound. Diese Art von Volumen-Spike ohne Reversal-Struktur ist meist kein Tiefpunkt, sondern vielmehr ein Zeichen für erzwungenes Verkaufen/Liquiditäts-„Sweep“.
- Wenn du ein Short-Setup willst: Achte auf einen Rebound in den Bereich 0.1123–0.1142 und gehe erst bei Bestätigung der Ablehnung hinein (z. B. bärische Engulfing-Kerze oder Wiederaufnahme des Trends auf niedrigerem Timeframe). Nimm Gewinne bei 0.1083 und danach bei 0.1021, falls der Momentum beschleunigt. Setze den Stop-Loss oberhalb des Swing-Highs, das nach dem Rebound entsteht, oder oberhalb von 0.1184, wenn du dem Trade mehr Spielraum geben willst.
- Wenn der Kurs stattdessen 0.1142 zurückerobert und darüber hält – insbesondere bei starkem Kaufvolumen – dann solltest du keine Shorts mehr suchen, da der Squeeze läuft. In diesem Szenario könntest du eine Rally in Richtung des Widerstandsclusters 0.1184–0.1219 sehen.
- Für jetzt ist die höhere Wahrscheinlichkeit eher nach unten, aber gehe niemals direkt in einen Dump hinein short – warte immer auf Bestätigung von Angebot bei einem fehlgeschlagenen Rebound oder einer schwachen Rally.
📝 Das ist keine Anlageberatung, sondern nur ein Bildungsbericht, der dir helfen soll, die aktuelle Kursbewegung und mögliche Trade-Setups zu verstehen. Sei vorsichtig bei Hochvolumen-Anomalien und warte immer auf Bestätigung, bevor du Trades platzierst!
📊 Hol dir eine detaillierte kostenlose Analyse jeder Coin auf jedem Timeframe, den du möchtest. Teste Finora AI – dein Trade Buddy – kostenlos → tinyurl.com/FinoraBot
#LUMIA
{future}(LUMIAUSDT)
$LUMIA
📉 4.5% Absturz & 23.8x Volumen-Spike bei $LUMIA – Panik oder Chance?
- Ich erwarte, dass es voraussichtlich noch weiter nach unten geht, sofern der Kurs nicht schnell zurückerobert und über 0.1123 schließt oder – wichtiger – über 0.1142 bei einem starken Rebound. Diese Art von Volumen-Spike ohne Reversal-Struktur ist meist kein Tiefpunkt, sondern vielmehr ein Zeichen für erzwungenes Verkaufen/Liquiditäts-„Sweep“.
- Wenn du ein Short-Setup willst: Achte auf einen Rebound in den Bereich 0.1123–0.1142 und gehe erst bei Bestätigung der Ablehnung hinein (z. B. bärische Engulfing-Kerze oder Wiederaufnahme des Trends auf niedrigerem Timeframe). Nimm Gewinne bei 0.1083 und danach bei 0.1021, falls der Momentum beschleunigt. Setze den Stop-Loss oberhalb des Swing-Highs, das nach dem Rebound entsteht, oder oberhalb von 0.1184, wenn du dem Trade mehr Spielraum geben willst.
- Wenn der Kurs stattdessen 0.1142 zurückerobert und darüber hält – insbesondere bei starkem Kaufvolumen – dann solltest du keine Shorts mehr suchen, da der Squeeze läuft. In diesem Szenario könntest du eine Rally in Richtung des Widerstandsclusters 0.1184–0.1219 sehen.
- Für jetzt ist die höhere Wahrscheinlichkeit eher nach unten, aber gehe niemals direkt in einen Dump hinein short – warte immer auf Bestätigung von Angebot bei einem fehlgeschlagenen Rebound oder einer schwachen Rally.
📝 Das ist keine Anlageberatung, sondern nur ein Bildungsbericht, der dir helfen soll, die aktuelle Kursbewegung und mögliche Trade-Setups zu verstehen. Sei vorsichtig bei Hochvolumen-Anomalien und warte immer auf Bestätigung, bevor du Trades platzierst!
📊 Hol dir eine detaillierte kostenlose Analyse jeder Coin auf jedem Timeframe, den du möchtest. Teste Finora AI – dein Trade Buddy – kostenlos → tinyurl.com/FinoraBot
#LUMIA
📉 4.5% Absturz & 23.8x Volumen-Spike bei $LUMIA – Panik oder Chance?
- Ich erwarte, dass es voraussichtlich noch weiter nach unten geht, sofern der Kurs nicht schnell zurückerobert und über 0.1123 schließt oder – wichtiger – über 0.1142 bei einem starken Rebound. Diese Art von Volumen-Spike ohne Reversal-Struktur ist meist kein Tiefpunkt, sondern vielmehr ein Zeichen für erzwungenes Verkaufen/Liquiditäts-„Sweep“.
- Wenn du ein Short-Setup willst: Achte auf einen Rebound in den Bereich 0.1123–0.1142 und gehe erst bei Bestätigung der Ablehnung hinein (z. B. bärische Engulfing-Kerze oder Wiederaufnahme des Trends auf niedrigerem Timeframe). Nimm Gewinne bei 0.1083 und danach bei 0.1021, falls der Momentum beschleunigt. Setze den Stop-Loss oberhalb des Swing-Highs, das nach dem Rebound entsteht, oder oberhalb von 0.1184, wenn du dem Trade mehr Spielraum geben willst.
- Wenn der Kurs stattdessen 0.1142 zurückerobert und darüber hält – insbesondere bei starkem Kaufvolumen – dann solltest du keine Shorts mehr suchen, da der Squeeze läuft. In diesem Szenario könntest du eine Rally in Richtung des Widerstandsclusters 0.1184–0.1219 sehen.
- Für jetzt ist die höhere Wahrscheinlichkeit eher nach unten, aber gehe niemals direkt in einen Dump hinein short – warte immer auf Bestätigung von Angebot bei einem fehlgeschlagenen Rebound oder einer schwachen Rally.
📝 Das ist keine Anlageberatung, sondern nur ein Bildungsbericht, der dir helfen soll, die aktuelle Kursbewegung und mögliche Trade-Setups zu verstehen. Sei vorsichtig bei Hochvolumen-Anomalien und warte immer auf Bestätigung, bevor du Trades platzierst!
📊 Hol dir eine detaillierte kostenlose Analyse jeder Coin auf jedem Timeframe, den du möchtest. Teste Finora AI – dein Trade Buddy – kostenlos → tinyurl.com/FinoraBot
#LUMIA
418
·
--
$DODOX
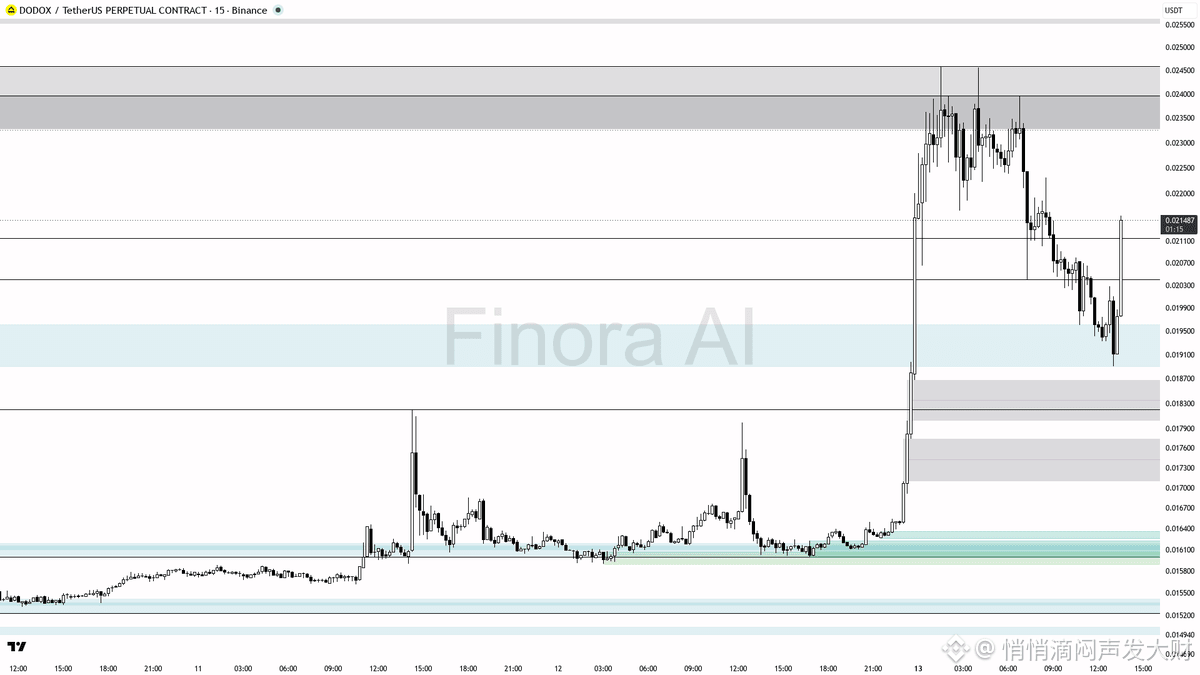
🐂 +7.9% Explosive Bewegung auf $DODOX
- Dieser Pump ist beeindruckend, birgt aber auch das Risiko, sich in einen Bull-Trap zu verwandeln, wenn späte Käufer in Eile aufspringen—Volumenspitzen wie diese können sowohl Breakout-Treibstoff als auch Liquiditäts-Fallen sein.
- Ich würde NICHT blind auf dieser Höhe long gehen. Warte auf einen Retracement oder eine klare Umkehr auf einem niedrigeren Zeiteinframe. Wenn der Preis in den Bereich 0.0201–0.0205 fällt und eine saubere Umkehr zeigt (Hammer, Engulfing oder ein starker Bounce auf 5m/1m), ist ein Long in Richtung 0.02115, 0.02265 und möglicherweise 0.02396 vertretbar.
- Wenn der Preis es nicht schafft, 0.0201 zu halten, ist es wahrscheinlich, dass zuerst das letzte Tief bei 0.0182 für Liquidität abgegriffen wird, bevor es zu einer echten Aufwärtsbewegung kommt. Wenn auch diese Zone scheitert, könnte der bärische Impuls 0.0160 oder sogar 0.0152 ansteuern.
- Dieses Ereignis sieht derzeit eher nach einer potenziellen Falle für späte Käufer aus—die Nachhaltigkeit hängt davon ab, ob die Bullen die Zone 0.0201–0.0205 bei einem Pullback halten können. Sei geduldig und warte auf eine echte Bestätigung, bevor du einsteigst.
- Meine Einschätzung: Neutral bis vorsichtig bullisch, nur bei einem Pullback mit Bestätigung. Wenn der Preis bei starkem Momentum über 0.02265 ausbricht und diese Zone bei einem Retest als Unterstützung zurückerobert, kann sich die Bewegung bis zur oberen Angebotszone bei 0.02396–0.02459 fortsetzen.
📝 Das ist keine Anlageberatung, sondern nur ein pädagogischer Analysebericht. Warte immer auf Bestätigung und manage das Risiko sorgfältig—besonders nach plötzlichen Pumps wie diesem. 🚦
📊 Hol dir eine detaillierte kostenlose Analyse zu jeder Coin auf jedem Zeiteinframe, den du möchtest. Teste Finora AI - Dein Trade Buddy kostenlos → tinyurl.com/FinoraBot
#DODOX
{future}(DODOXUSDT)
$DODOX
🐂 +7.9% Explosive Bewegung auf $DODOX
- Dieser Pump ist beeindruckend, birgt aber auch das Risiko, sich in einen Bull-Trap zu verwandeln, wenn späte Käufer in Eile aufspringen—Volumenspitzen wie diese können sowohl Breakout-Treibstoff als auch Liquiditäts-Fallen sein.
- Ich würde NICHT blind auf dieser Höhe long gehen. Warte auf einen Retracement oder eine klare Umkehr auf einem niedrigeren Zeiteinframe. Wenn der Preis in den Bereich 0.0201–0.0205 fällt und eine saubere Umkehr zeigt (Hammer, Engulfing oder ein starker Bounce auf 5m/1m), ist ein Long in Richtung 0.02115, 0.02265 und möglicherweise 0.02396 vertretbar.
- Wenn der Preis es nicht schafft, 0.0201 zu halten, ist es wahrscheinlich, dass zuerst das letzte Tief bei 0.0182 für Liquidität abgegriffen wird, bevor es zu einer echten Aufwärtsbewegung kommt. Wenn auch diese Zone scheitert, könnte der bärische Impuls 0.0160 oder sogar 0.0152 ansteuern.
- Dieses Ereignis sieht derzeit eher nach einer potenziellen Falle für späte Käufer aus—die Nachhaltigkeit hängt davon ab, ob die Bullen die Zone 0.0201–0.0205 bei einem Pullback halten können. Sei geduldig und warte auf eine echte Bestätigung, bevor du einsteigst.
- Meine Einschätzung: Neutral bis vorsichtig bullisch, nur bei einem Pullback mit Bestätigung. Wenn der Preis bei starkem Momentum über 0.02265 ausbricht und diese Zone bei einem Retest als Unterstützung zurückerobert, kann sich die Bewegung bis zur oberen Angebotszone bei 0.02396–0.02459 fortsetzen.
📝 Das ist keine Anlageberatung, sondern nur ein pädagogischer Analysebericht. Warte immer auf Bestätigung und manage das Risiko sorgfältig—besonders nach plötzlichen Pumps wie diesem. 🚦
📊 Hol dir eine detaillierte kostenlose Analyse zu jeder Coin auf jedem Zeiteinframe, den du möchtest. Teste Finora AI - Dein Trade Buddy kostenlos → tinyurl.com/FinoraBot
#DODOX
🐂 +7.9% Explosive Bewegung auf $DODOX
- Dieser Pump ist beeindruckend, birgt aber auch das Risiko, sich in einen Bull-Trap zu verwandeln, wenn späte Käufer in Eile aufspringen—Volumenspitzen wie diese können sowohl Breakout-Treibstoff als auch Liquiditäts-Fallen sein.
- Ich würde NICHT blind auf dieser Höhe long gehen. Warte auf einen Retracement oder eine klare Umkehr auf einem niedrigeren Zeiteinframe. Wenn der Preis in den Bereich 0.0201–0.0205 fällt und eine saubere Umkehr zeigt (Hammer, Engulfing oder ein starker Bounce auf 5m/1m), ist ein Long in Richtung 0.02115, 0.02265 und möglicherweise 0.02396 vertretbar.
- Wenn der Preis es nicht schafft, 0.0201 zu halten, ist es wahrscheinlich, dass zuerst das letzte Tief bei 0.0182 für Liquidität abgegriffen wird, bevor es zu einer echten Aufwärtsbewegung kommt. Wenn auch diese Zone scheitert, könnte der bärische Impuls 0.0160 oder sogar 0.0152 ansteuern.
- Dieses Ereignis sieht derzeit eher nach einer potenziellen Falle für späte Käufer aus—die Nachhaltigkeit hängt davon ab, ob die Bullen die Zone 0.0201–0.0205 bei einem Pullback halten können. Sei geduldig und warte auf eine echte Bestätigung, bevor du einsteigst.
- Meine Einschätzung: Neutral bis vorsichtig bullisch, nur bei einem Pullback mit Bestätigung. Wenn der Preis bei starkem Momentum über 0.02265 ausbricht und diese Zone bei einem Retest als Unterstützung zurückerobert, kann sich die Bewegung bis zur oberen Angebotszone bei 0.02396–0.02459 fortsetzen.
📝 Das ist keine Anlageberatung, sondern nur ein pädagogischer Analysebericht. Warte immer auf Bestätigung und manage das Risiko sorgfältig—besonders nach plötzlichen Pumps wie diesem. 🚦
📊 Hol dir eine detaillierte kostenlose Analyse zu jeder Coin auf jedem Zeiteinframe, den du möchtest. Teste Finora AI - Dein Trade Buddy kostenlos → tinyurl.com/FinoraBot
#DODOX
104
·
--
$GLM
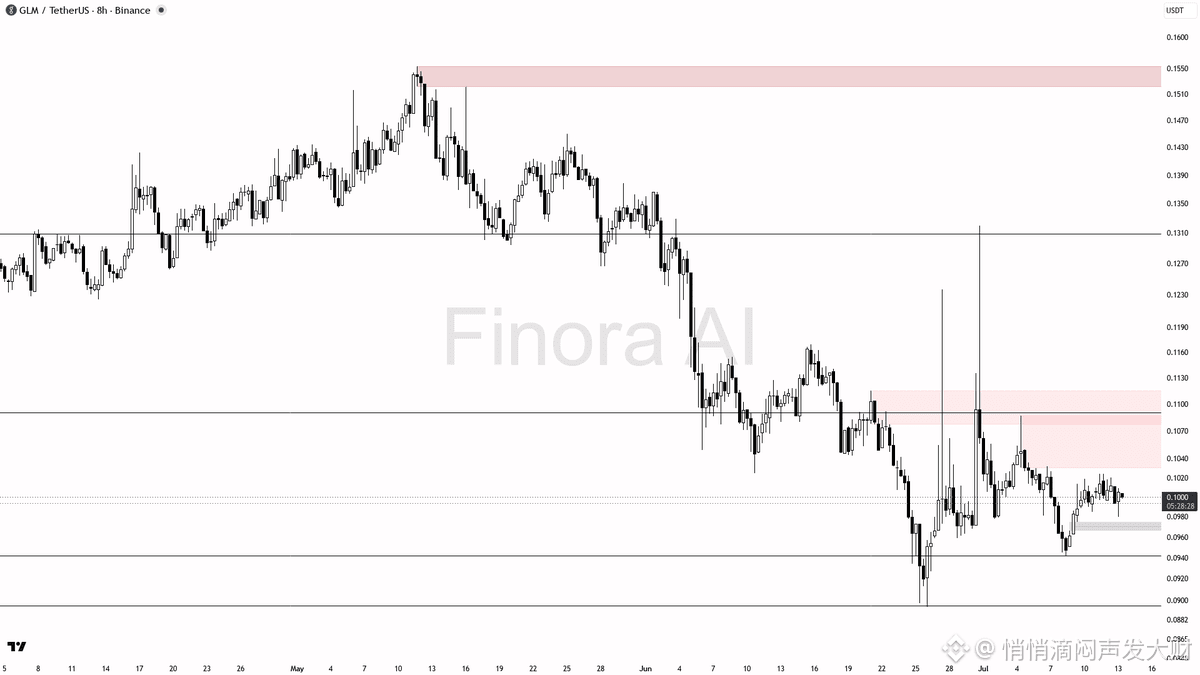
$GLM 8h Lesen: - Ich erwarte, dass der Preis vorerst in einer Spanne bleibt, aber die bullische Tendenz könnte die Oberhand gewinnen, wenn der Preis über 0.0942 bleibt und insbesondere, wenn er 0.1025 zurückerobert.
- Eine Long-Set-up mit hoher Wahrscheinlichkeit würde sich ergeben, wenn der Preis in den Bereich 0.0942-0.0895 fällt, Liquidität unter dem Swing-Low abräumt und ein starkes Umkehrsignal zeigt.
- Wenn das passiert, Beispiel-Trade: Einstieg über 0.0955 nach einem bullischen Engulfing im 8h oder nach einem Umkehrmuster im 2h, mit Zielen bei 0.1025, danach 0.1087. Der Stop-Loss sollte unter dem Swing-Low bei 0.0894 platziert werden.
- Auf Bestätigung zum Abwarten achten: Beobachte einen klaren Pin-Bar, bullisches Engulfing oder mehrere Dochte, die niedrigere Kurse abweisen – besonders nach einem schnellen Dip unter 0.0942 oder 0.0895 – und einer starken Rückeroberung.
- Wenn der Preis stattdessen direkt nach oben läuft, gehe long nur bei einem Ausbruch und anschließendem Retest von 0.1025 mit starkem Volumen und Bestätigung.
- Meine Tendenz würde erst dann bärisch werden, wenn der Preis unter dem zuletzt erfolgten Swing-Low (0.0894) schließt und es nicht zurückerobern kann; dann sind deutlich niedrigere Kursniveaus das Ziel.
🚨 Fange Trades früh mit kostenlosen, KI-gestützten Signalen.
Starte mit Finora → tinyurl.com/FinoraBot
#GLM
{future}(GLMUSDT)
$GLM
$GLM 8h Lesen: - Ich erwarte, dass der Preis vorerst in einer Spanne bleibt, aber die bullische Tendenz könnte die Oberhand gewinnen, wenn der Preis über 0.0942 bleibt und insbesondere, wenn er 0.1025 zurückerobert.
- Eine Long-Set-up mit hoher Wahrscheinlichkeit würde sich ergeben, wenn der Preis in den Bereich 0.0942-0.0895 fällt, Liquidität unter dem Swing-Low abräumt und ein starkes Umkehrsignal zeigt.
- Wenn das passiert, Beispiel-Trade: Einstieg über 0.0955 nach einem bullischen Engulfing im 8h oder nach einem Umkehrmuster im 2h, mit Zielen bei 0.1025, danach 0.1087. Der Stop-Loss sollte unter dem Swing-Low bei 0.0894 platziert werden.
- Auf Bestätigung zum Abwarten achten: Beobachte einen klaren Pin-Bar, bullisches Engulfing oder mehrere Dochte, die niedrigere Kurse abweisen – besonders nach einem schnellen Dip unter 0.0942 oder 0.0895 – und einer starken Rückeroberung.
- Wenn der Preis stattdessen direkt nach oben läuft, gehe long nur bei einem Ausbruch und anschließendem Retest von 0.1025 mit starkem Volumen und Bestätigung.
- Meine Tendenz würde erst dann bärisch werden, wenn der Preis unter dem zuletzt erfolgten Swing-Low (0.0894) schließt und es nicht zurückerobern kann; dann sind deutlich niedrigere Kursniveaus das Ziel.
🚨 Fange Trades früh mit kostenlosen, KI-gestützten Signalen.
Starte mit Finora → tinyurl.com/FinoraBot
#GLM
$GLM 8h Lesen: - Ich erwarte, dass der Preis vorerst in einer Spanne bleibt, aber die bullische Tendenz könnte die Oberhand gewinnen, wenn der Preis über 0.0942 bleibt und insbesondere, wenn er 0.1025 zurückerobert.
- Eine Long-Set-up mit hoher Wahrscheinlichkeit würde sich ergeben, wenn der Preis in den Bereich 0.0942-0.0895 fällt, Liquidität unter dem Swing-Low abräumt und ein starkes Umkehrsignal zeigt.
- Wenn das passiert, Beispiel-Trade: Einstieg über 0.0955 nach einem bullischen Engulfing im 8h oder nach einem Umkehrmuster im 2h, mit Zielen bei 0.1025, danach 0.1087. Der Stop-Loss sollte unter dem Swing-Low bei 0.0894 platziert werden.
- Auf Bestätigung zum Abwarten achten: Beobachte einen klaren Pin-Bar, bullisches Engulfing oder mehrere Dochte, die niedrigere Kurse abweisen – besonders nach einem schnellen Dip unter 0.0942 oder 0.0895 – und einer starken Rückeroberung.
- Wenn der Preis stattdessen direkt nach oben läuft, gehe long nur bei einem Ausbruch und anschließendem Retest von 0.1025 mit starkem Volumen und Bestätigung.
- Meine Tendenz würde erst dann bärisch werden, wenn der Preis unter dem zuletzt erfolgten Swing-Low (0.0894) schließt und es nicht zurückerobern kann; dann sind deutlich niedrigere Kursniveaus das Ziel.
🚨 Fange Trades früh mit kostenlosen, KI-gestützten Signalen.
Starte mit Finora → tinyurl.com/FinoraBot
#GLM
50
·
--
$B
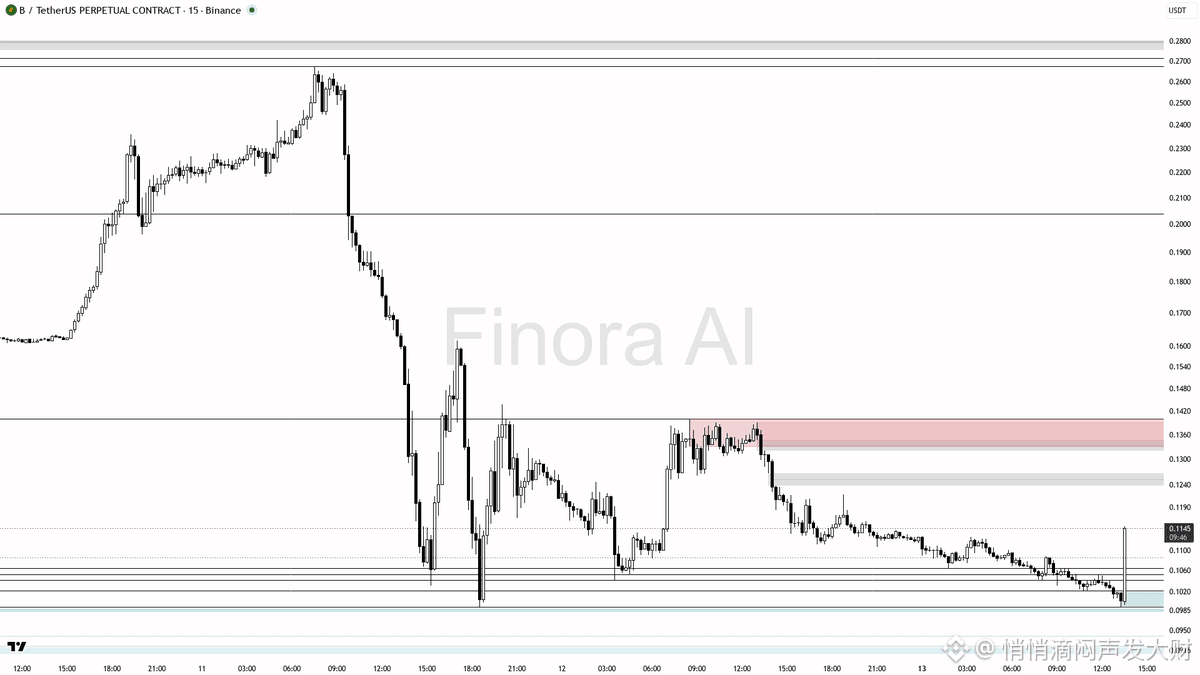
🟢 $B steigt mit einem 4,2-fachen Buy-Volume-Spike – kann das so weitergehen?
- Bei so einem Volumen und der Stärke der Indikatoren ist meine Erwartung, dass der Aufwärtstrend weiter an Momentum gewinnt, aber nur nach einem gesunden Pullback oder einer Konsolidierung. Das sieht sehr nach einer „Smart Money“-Akkumulation aus, wobei die erste Phase der Trendwende gerade zu spielen beginnt.
- Beispiel-Trade-Setup: Warte auf einen Pullback in Richtung 0.1065 oder sogar bis etwa 0.0992. Wenn du eine Bestätigung siehst (bullischer Pin Bar, bullisches Engulfing oder eine Reversal-Formation auf den unteren Timeframes), ziehe einen Long-Entry in Betracht – ungefähr auf diesen Levels.
- Take Profit 1: 0.1127 (erste Widerstandszone direkt darüber)
- Take Profit 2: 0.1270 (große Swing-Supply)
- Für aggressive Trader: Wenn 0.1270 mit Volumen durchbrochen wird, könnte als nächstes Ziel 0.1390 erreicht werden.
- Der Stop-Loss sollte unter dem letzten Swing-Low platziert werden oder unter einem klaren Invalidationspunkt auf den unteren Timeframes (z. B. ein Close unter 0.0992).
- Wenn der Kurs es nicht schafft, über 0.1065 zu halten, und beginnt unter 0.0992 zu schließen, würde ich die bullische Ausrichtung aufgeben und auf ein neues Setup warten. Wenn der Kurs zurückerobert und über 0.1127 hält, ist das eine starke Bestätigung, um die Long-Position zu halten oder aufzustocken.
- Absolut nicht dem Move hinterherjagen, nachdem ein Volumen-Spike passiert ist – warte immer auf eine Reaktion, einen Retracement und eine Bestätigung.
📝 Das ist keine Anlageberatung, sondern ein Bildungsbericht. Handel sicher und nutze immer Bestätigungen!
📊 Erhalte detaillierte kostenlose Analysen zu jeder Coin auf jedem Timeframe, den du willst. Teste Finora AI – dein Trade-Buddy – kostenlos → tinyurl.com/FinoraBot
#B
{future}(BUSDT)
$B
🟢 $B steigt mit einem 4,2-fachen Buy-Volume-Spike – kann das so weitergehen?
- Bei so einem Volumen und der Stärke der Indikatoren ist meine Erwartung, dass der Aufwärtstrend weiter an Momentum gewinnt, aber nur nach einem gesunden Pullback oder einer Konsolidierung. Das sieht sehr nach einer „Smart Money“-Akkumulation aus, wobei die erste Phase der Trendwende gerade zu spielen beginnt.
- Beispiel-Trade-Setup: Warte auf einen Pullback in Richtung 0.1065 oder sogar bis etwa 0.0992. Wenn du eine Bestätigung siehst (bullischer Pin Bar, bullisches Engulfing oder eine Reversal-Formation auf den unteren Timeframes), ziehe einen Long-Entry in Betracht – ungefähr auf diesen Levels.
- Take Profit 1: 0.1127 (erste Widerstandszone direkt darüber)
- Take Profit 2: 0.1270 (große Swing-Supply)
- Für aggressive Trader: Wenn 0.1270 mit Volumen durchbrochen wird, könnte als nächstes Ziel 0.1390 erreicht werden.
- Der Stop-Loss sollte unter dem letzten Swing-Low platziert werden oder unter einem klaren Invalidationspunkt auf den unteren Timeframes (z. B. ein Close unter 0.0992).
- Wenn der Kurs es nicht schafft, über 0.1065 zu halten, und beginnt unter 0.0992 zu schließen, würde ich die bullische Ausrichtung aufgeben und auf ein neues Setup warten. Wenn der Kurs zurückerobert und über 0.1127 hält, ist das eine starke Bestätigung, um die Long-Position zu halten oder aufzustocken.
- Absolut nicht dem Move hinterherjagen, nachdem ein Volumen-Spike passiert ist – warte immer auf eine Reaktion, einen Retracement und eine Bestätigung.
📝 Das ist keine Anlageberatung, sondern ein Bildungsbericht. Handel sicher und nutze immer Bestätigungen!
📊 Erhalte detaillierte kostenlose Analysen zu jeder Coin auf jedem Timeframe, den du willst. Teste Finora AI – dein Trade-Buddy – kostenlos → tinyurl.com/FinoraBot
#B
🟢 $B steigt mit einem 4,2-fachen Buy-Volume-Spike – kann das so weitergehen?
- Bei so einem Volumen und der Stärke der Indikatoren ist meine Erwartung, dass der Aufwärtstrend weiter an Momentum gewinnt, aber nur nach einem gesunden Pullback oder einer Konsolidierung. Das sieht sehr nach einer „Smart Money“-Akkumulation aus, wobei die erste Phase der Trendwende gerade zu spielen beginnt.
- Beispiel-Trade-Setup: Warte auf einen Pullback in Richtung 0.1065 oder sogar bis etwa 0.0992. Wenn du eine Bestätigung siehst (bullischer Pin Bar, bullisches Engulfing oder eine Reversal-Formation auf den unteren Timeframes), ziehe einen Long-Entry in Betracht – ungefähr auf diesen Levels.
- Take Profit 1: 0.1127 (erste Widerstandszone direkt darüber)
- Take Profit 2: 0.1270 (große Swing-Supply)
- Für aggressive Trader: Wenn 0.1270 mit Volumen durchbrochen wird, könnte als nächstes Ziel 0.1390 erreicht werden.
- Der Stop-Loss sollte unter dem letzten Swing-Low platziert werden oder unter einem klaren Invalidationspunkt auf den unteren Timeframes (z. B. ein Close unter 0.0992).
- Wenn der Kurs es nicht schafft, über 0.1065 zu halten, und beginnt unter 0.0992 zu schließen, würde ich die bullische Ausrichtung aufgeben und auf ein neues Setup warten. Wenn der Kurs zurückerobert und über 0.1127 hält, ist das eine starke Bestätigung, um die Long-Position zu halten oder aufzustocken.
- Absolut nicht dem Move hinterherjagen, nachdem ein Volumen-Spike passiert ist – warte immer auf eine Reaktion, einen Retracement und eine Bestätigung.
📝 Das ist keine Anlageberatung, sondern ein Bildungsbericht. Handel sicher und nutze immer Bestätigungen!
📊 Erhalte detaillierte kostenlose Analysen zu jeder Coin auf jedem Timeframe, den du willst. Teste Finora AI – dein Trade-Buddy – kostenlos → tinyurl.com/FinoraBot
#B
10
·
--
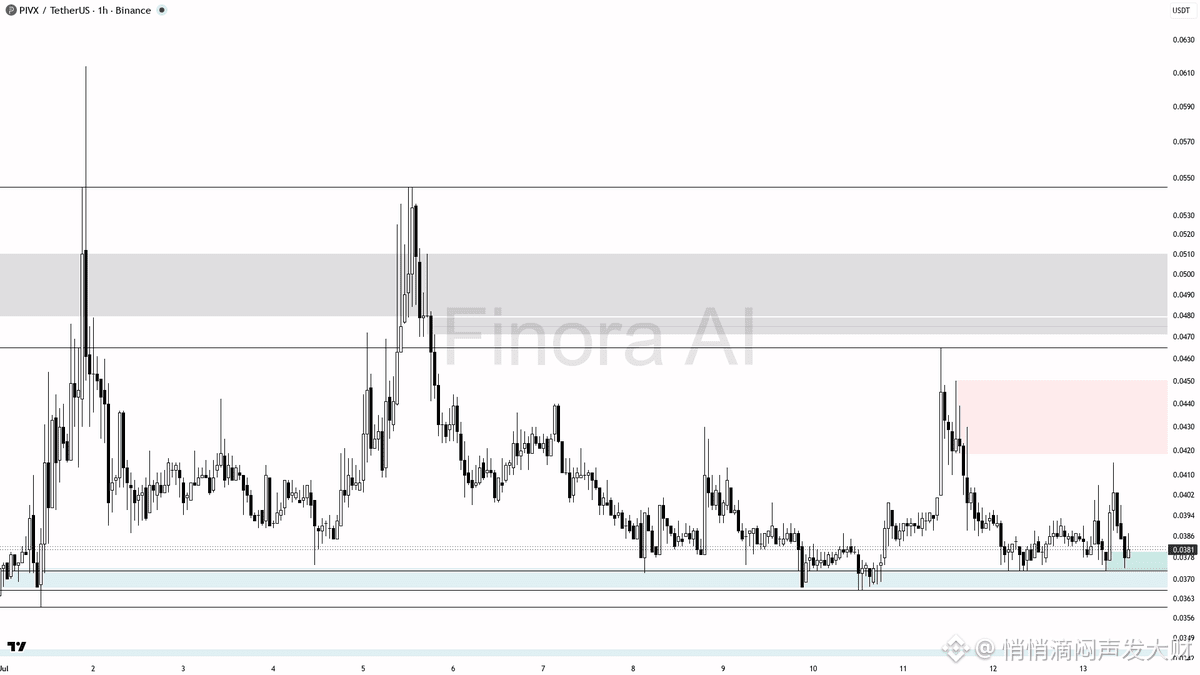
$PIVX
$PIVX 1h | Technischer Ausblick
- Ich erwarte, dass die Kursentwicklung vorerst in einer Spanne bleibt, zwischen 0.0373 und 0.0399; möglich sind Liquiditätsabgriffe unter 0.0373, bevor eine weitere Aufwärtsbewegung in Richtung 0.0393 und möglicherweise 0.0399 folgt, falls eine saubere Umkehr/„Rettung“ auftaucht
- Beobachte genau eine Manipulation oder einen Liquiditäts-Sweep unter 0.0373. Der ideale Long-Einstieg wäre auf einem scharfen Docht unter dieses Niveau, aber mit einem starken Close/ einer Umkehr zurück über 0.0376, mit Zielen zuerst 0.0393 und dann 0.0399
- Wenn der Kurs nach einem Sweep nicht mehr über 0.0373 hält und unter 0.0366 schließt, erwarte einen tieferen Abwärtsimpuls und wechsle die Tendenz auf Short
- Wenn es den Bullen gelingt, 0.0399 mit Volumen und Struktur zurückzuerobern, erwarte eine Bewegung zu 0.0418 und möglicherweise in Richtung des zuletzt erreichten Hochs bei 0.0465
🚨 Echtzeit-KI-Signale. Kein Rauschen, keine Vermutungen.
Nutze Finora kostenlos → tinyurl.com/FinoraBot
#PIVX
{future}(PIVXUSDT)
$PIVX
$PIVX 1h | Technischer Ausblick
- Ich erwarte, dass die Kursentwicklung vorerst in einer Spanne bleibt, zwischen 0.0373 und 0.0399; möglich sind Liquiditätsabgriffe unter 0.0373, bevor eine weitere Aufwärtsbewegung in Richtung 0.0393 und möglicherweise 0.0399 folgt, falls eine saubere Umkehr/„Rettung“ auftaucht
- Beobachte genau eine Manipulation oder einen Liquiditäts-Sweep unter 0.0373. Der ideale Long-Einstieg wäre auf einem scharfen Docht unter dieses Niveau, aber mit einem starken Close/ einer Umkehr zurück über 0.0376, mit Zielen zuerst 0.0393 und dann 0.0399
- Wenn der Kurs nach einem Sweep nicht mehr über 0.0373 hält und unter 0.0366 schließt, erwarte einen tieferen Abwärtsimpuls und wechsle die Tendenz auf Short
- Wenn es den Bullen gelingt, 0.0399 mit Volumen und Struktur zurückzuerobern, erwarte eine Bewegung zu 0.0418 und möglicherweise in Richtung des zuletzt erreichten Hochs bei 0.0465
🚨 Echtzeit-KI-Signale. Kein Rauschen, keine Vermutungen.
Nutze Finora kostenlos → tinyurl.com/FinoraBot
#PIVX
$PIVX 1h | Technischer Ausblick
- Ich erwarte, dass die Kursentwicklung vorerst in einer Spanne bleibt, zwischen 0.0373 und 0.0399; möglich sind Liquiditätsabgriffe unter 0.0373, bevor eine weitere Aufwärtsbewegung in Richtung 0.0393 und möglicherweise 0.0399 folgt, falls eine saubere Umkehr/„Rettung“ auftaucht
- Beobachte genau eine Manipulation oder einen Liquiditäts-Sweep unter 0.0373. Der ideale Long-Einstieg wäre auf einem scharfen Docht unter dieses Niveau, aber mit einem starken Close/ einer Umkehr zurück über 0.0376, mit Zielen zuerst 0.0393 und dann 0.0399
- Wenn der Kurs nach einem Sweep nicht mehr über 0.0373 hält und unter 0.0366 schließt, erwarte einen tieferen Abwärtsimpuls und wechsle die Tendenz auf Short
- Wenn es den Bullen gelingt, 0.0399 mit Volumen und Struktur zurückzuerobern, erwarte eine Bewegung zu 0.0418 und möglicherweise in Richtung des zuletzt erreichten Hochs bei 0.0465
🚨 Echtzeit-KI-Signale. Kein Rauschen, keine Vermutungen.
Nutze Finora kostenlos → tinyurl.com/FinoraBot
#PIVX
117
·
--
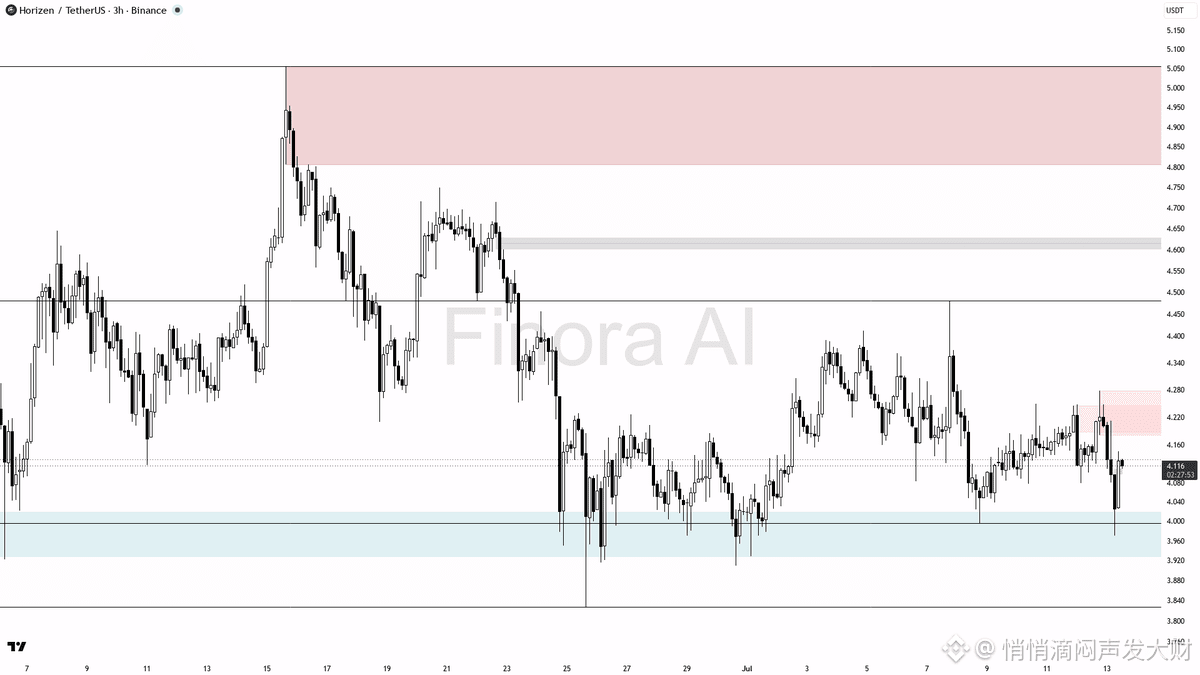
$ZEN
$ZEN 3h Update | finorabot.com
- Bärische Tendenz dominiert, da der Kurs knapp oberhalb des jüngsten Swing-Tiefs bei 3.91 verharrt
- Zentrale Widerstandszone zeichnet sich bei 4.247–4.278 ab und dürfte jegliche Erholungsrallys begrenzen
- Unterstützungscluster um 3.996–4.079 ist entscheidend für mögliche Reversal-Setups
- Ein Abwärtsimpuls könnte sich verstärken, falls 3.91 bricht, was auf einen tieferen Nachfrage-Test hindeutet
- Genau beobachten, wenn in diesen Bereichen ein eindeutiger Auslöser entsteht, der das Momentum drehen könnte – da braut sich etwas Großes zusammen 🔥
👇 Das komplette Trade-Setup mit Bestätigungssignalen & Zielen:
→ tinyurl.com/FinoraBot
#ZEN
{future}(ZENUSDT)
$ZEN
$ZEN 3h Update | finorabot.com
- Bärische Tendenz dominiert, da der Kurs knapp oberhalb des jüngsten Swing-Tiefs bei 3.91 verharrt
- Zentrale Widerstandszone zeichnet sich bei 4.247–4.278 ab und dürfte jegliche Erholungsrallys begrenzen
- Unterstützungscluster um 3.996–4.079 ist entscheidend für mögliche Reversal-Setups
- Ein Abwärtsimpuls könnte sich verstärken, falls 3.91 bricht, was auf einen tieferen Nachfrage-Test hindeutet
- Genau beobachten, wenn in diesen Bereichen ein eindeutiger Auslöser entsteht, der das Momentum drehen könnte – da braut sich etwas Großes zusammen 🔥
👇 Das komplette Trade-Setup mit Bestätigungssignalen & Zielen:
→ tinyurl.com/FinoraBot
#ZEN
$ZEN 3h Update | finorabot.com
- Bärische Tendenz dominiert, da der Kurs knapp oberhalb des jüngsten Swing-Tiefs bei 3.91 verharrt
- Zentrale Widerstandszone zeichnet sich bei 4.247–4.278 ab und dürfte jegliche Erholungsrallys begrenzen
- Unterstützungscluster um 3.996–4.079 ist entscheidend für mögliche Reversal-Setups
- Ein Abwärtsimpuls könnte sich verstärken, falls 3.91 bricht, was auf einen tieferen Nachfrage-Test hindeutet
- Genau beobachten, wenn in diesen Bereichen ein eindeutiger Auslöser entsteht, der das Momentum drehen könnte – da braut sich etwas Großes zusammen 🔥
👇 Das komplette Trade-Setup mit Bestätigungssignalen & Zielen:
→ tinyurl.com/FinoraBot
#ZEN
161
·
--
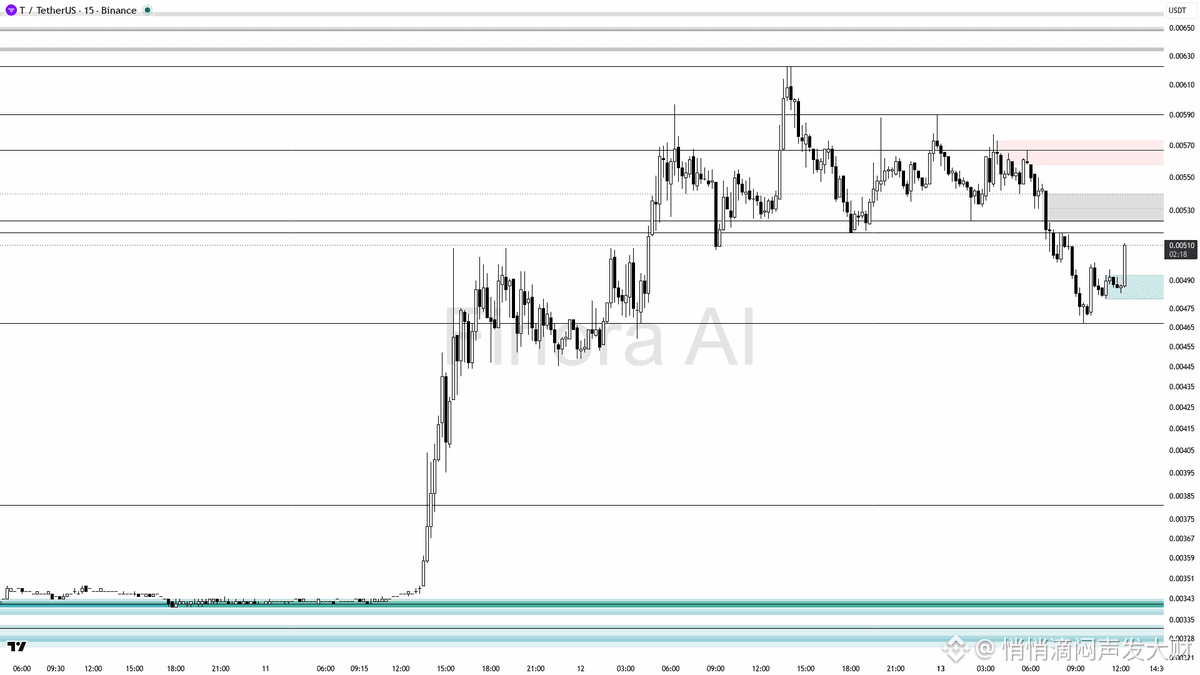
$T
💪 $T habe gerade 4,1x Kaufvolumen gesehen—echte Nachfrage oder Falle?
- Diese 4,1x-Volumen-Anomalie und der schnelle Preisanstieg deuten auf mögliches Smart-Money-Akumulieren hin, nachdem die Liquidität unter dem jüngsten Tief bei 0.00467 abgefischt wurde.
- Wenn der Preis über 0.00510 hält und insbesondere, wenn du auf einem niedrigeren Timeframe bullische Reversal-Signale bei einem Re-Test oder einem flachen Pullback siehst, erwarte ich einen Anstieg zunächst in Richtung 0.00524 und potenziell weiter zu 0.00577 sowie 0.00590 als nächste Ziele.
- Ein Beispiel-Trade könnte sein: Long eingehen bei bestätigtem bullischem Reversal (Pin-Bar, Engulfing oder starke Kerzenschlusskurse über 0.00510 bzw. 0.00490 nach einem Pullback). Take Profit zunächst bei 0.00524, mit möglicher Ausdehnung auf 0.00577 und 0.00590. Stop-Loss unter dem Swing-Low bei 0.00467 platzieren.
- Wenn der Preis bricht und mit Momentum wieder unter 0.00467 schließt, dann scheitert das bullische Szenario—in dem Fall erwarte erneutem Verkauf bis in tiefere Unterstützungsbereiche.
- Meine Tendenz: bullisch kurzfristig, vorausgesetzt, Käufer verteidigen die Zone 0.00510–0.00490 mit starkem Preisverhalten und Volumen.
📝 Das ist keine Anlageberatung, sondern nur ein Bildungsbericht. Achte auf Bestätigung und manage das Risiko sorgfältig—diese Volumen-Spikes können zu heftigen Rallyes, aber auch zu ebenso heftigen Umkehrungen führen. 🚀
📊 Erhalte eine detaillierte, kostenlose Analyse zu jeder Coin auf jedem Timeframe, den du willst. Teste Finora AI - dein Trade-Buddy kostenlos → tinyurl.com/FinoraBot
#T
{future}(TUSDT)
$T
💪 $T habe gerade 4,1x Kaufvolumen gesehen—echte Nachfrage oder Falle?
- Diese 4,1x-Volumen-Anomalie und der schnelle Preisanstieg deuten auf mögliches Smart-Money-Akumulieren hin, nachdem die Liquidität unter dem jüngsten Tief bei 0.00467 abgefischt wurde.
- Wenn der Preis über 0.00510 hält und insbesondere, wenn du auf einem niedrigeren Timeframe bullische Reversal-Signale bei einem Re-Test oder einem flachen Pullback siehst, erwarte ich einen Anstieg zunächst in Richtung 0.00524 und potenziell weiter zu 0.00577 sowie 0.00590 als nächste Ziele.
- Ein Beispiel-Trade könnte sein: Long eingehen bei bestätigtem bullischem Reversal (Pin-Bar, Engulfing oder starke Kerzenschlusskurse über 0.00510 bzw. 0.00490 nach einem Pullback). Take Profit zunächst bei 0.00524, mit möglicher Ausdehnung auf 0.00577 und 0.00590. Stop-Loss unter dem Swing-Low bei 0.00467 platzieren.
- Wenn der Preis bricht und mit Momentum wieder unter 0.00467 schließt, dann scheitert das bullische Szenario—in dem Fall erwarte erneutem Verkauf bis in tiefere Unterstützungsbereiche.
- Meine Tendenz: bullisch kurzfristig, vorausgesetzt, Käufer verteidigen die Zone 0.00510–0.00490 mit starkem Preisverhalten und Volumen.
📝 Das ist keine Anlageberatung, sondern nur ein Bildungsbericht. Achte auf Bestätigung und manage das Risiko sorgfältig—diese Volumen-Spikes können zu heftigen Rallyes, aber auch zu ebenso heftigen Umkehrungen führen. 🚀
📊 Erhalte eine detaillierte, kostenlose Analyse zu jeder Coin auf jedem Timeframe, den du willst. Teste Finora AI - dein Trade-Buddy kostenlos → tinyurl.com/FinoraBot
#T
💪 $T habe gerade 4,1x Kaufvolumen gesehen—echte Nachfrage oder Falle?
- Diese 4,1x-Volumen-Anomalie und der schnelle Preisanstieg deuten auf mögliches Smart-Money-Akumulieren hin, nachdem die Liquidität unter dem jüngsten Tief bei 0.00467 abgefischt wurde.
- Wenn der Preis über 0.00510 hält und insbesondere, wenn du auf einem niedrigeren Timeframe bullische Reversal-Signale bei einem Re-Test oder einem flachen Pullback siehst, erwarte ich einen Anstieg zunächst in Richtung 0.00524 und potenziell weiter zu 0.00577 sowie 0.00590 als nächste Ziele.
- Ein Beispiel-Trade könnte sein: Long eingehen bei bestätigtem bullischem Reversal (Pin-Bar, Engulfing oder starke Kerzenschlusskurse über 0.00510 bzw. 0.00490 nach einem Pullback). Take Profit zunächst bei 0.00524, mit möglicher Ausdehnung auf 0.00577 und 0.00590. Stop-Loss unter dem Swing-Low bei 0.00467 platzieren.
- Wenn der Preis bricht und mit Momentum wieder unter 0.00467 schließt, dann scheitert das bullische Szenario—in dem Fall erwarte erneutem Verkauf bis in tiefere Unterstützungsbereiche.
- Meine Tendenz: bullisch kurzfristig, vorausgesetzt, Käufer verteidigen die Zone 0.00510–0.00490 mit starkem Preisverhalten und Volumen.
📝 Das ist keine Anlageberatung, sondern nur ein Bildungsbericht. Achte auf Bestätigung und manage das Risiko sorgfältig—diese Volumen-Spikes können zu heftigen Rallyes, aber auch zu ebenso heftigen Umkehrungen führen. 🚀
📊 Erhalte eine detaillierte, kostenlose Analyse zu jeder Coin auf jedem Timeframe, den du willst. Teste Finora AI - dein Trade-Buddy kostenlos → tinyurl.com/FinoraBot
#T
192
·
--
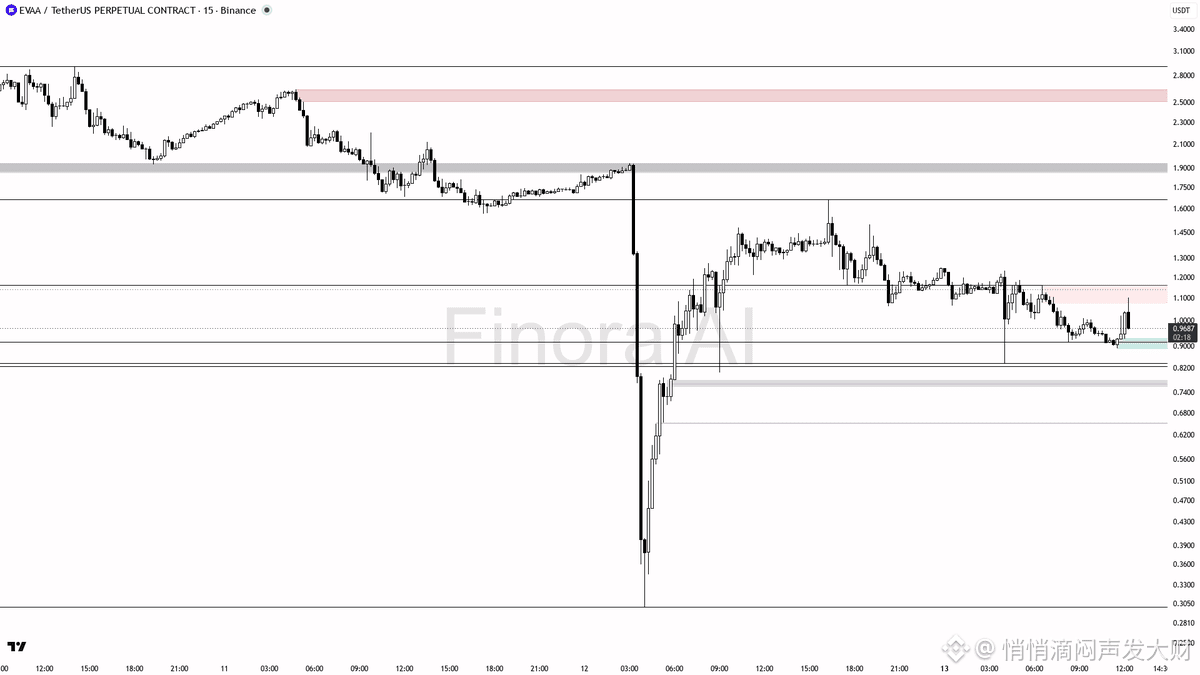
$EVAA
🔴 $EVAA hat gerade 5,9% abgeworfen – kurze Chance?
- Aufgrund des extremen Rückgangs, des sprunghaften Volumenanstiegs und der Tatsache, dass der Preis knapp über dem jüngsten Swing-Low liegt, besteht ein echtes Risiko, dass der Boden in der Nähe ist – zumindest vorübergehend. Daher ist das Verfolgen eines Shorts im Moment gefährlich, außer du siehst einen schwachen Rebound bis in den Widerstand, der scheitert.
- Eine sicherere Short-Chance würde erst dann entstehen, wenn der Preis auf den Widerstandsbereich 1.0360–1.1060 zurückprallt und eine klare Ablehnung oder eine niedrigere Hochbildung zeigt (Achte auf Reversal-Muster wie bearish engulfing, Pin-Bars oder einen Breakdown in den Charts von 5m/1m).
- Wenn du shorten willst: Warte, bis der Preis auf 1.0360–1.1060 steigt, suche nach einem tieferen Hoch und nach einer bärischen Bestätigung, und gehe dann in den Short. Als erstes Ziel 0.8869, danach 0.8355. Setze den Stop-Loss oberhalb des Swing-High des Rebounds.
- Wenn der Preis stattdessen bricht und über 1.1060 hält, insbesondere mit starkem Volumen und ohne Ablehnung, dann könnte der lokale Boden erstmal drin sein und der Preis könnte zurück in Richtung Gleichgewicht bei 1.035 oder höher laufen.
- Wenn der Preis unter 0.8575–0.8355 flushes und diese Zone dann schnell wieder zurückerobert – zum Beispiel mit einem bullish engulfing oder einer starken Umkehr – dann könntest du einen Scalplong in Betracht ziehen, Ziel bei 1.0360 und Stop unterhalb des Sweep-Lows.
- BETRETEKEINERLEI POSITION OHNE BESTÄTIGUNG! Warte auf klare Reversal-Muster (z. B. Pin-Bar-Ablehnung am Widerstand für Shorts oder bullish engulfing nach einem Sweep für Longs) oder auf Strukturbrüche in niedrigeren Zeiteinheiten.
📝 Das ist keine Anlageberatung, sondern eine bildungsorientierte Analyse, um dir zu helfen, kritische Levels und wahrscheinliche Szenarien zu verstehen. Warte immer auf Bestätigung, bevor du einen Trade machst, und manage dein Risiko sorgfältig, denn die hohe Volatilität nach so einem Dump kann sich schnell in beide Richtungen umkehren!
📊 Hol dir eine detaillierte kostenlose Analyse zu jeder Coin auf jedem gewünschten Timeframe. Teste Finora AI – dein Trade Buddy – kostenlos → tinyurl.com/FinoraBot
#EVAA
{future}(EVAAUSDT)
$EVAA
🔴 $EVAA hat gerade 5,9% abgeworfen – kurze Chance?
- Aufgrund des extremen Rückgangs, des sprunghaften Volumenanstiegs und der Tatsache, dass der Preis knapp über dem jüngsten Swing-Low liegt, besteht ein echtes Risiko, dass der Boden in der Nähe ist – zumindest vorübergehend. Daher ist das Verfolgen eines Shorts im Moment gefährlich, außer du siehst einen schwachen Rebound bis in den Widerstand, der scheitert.
- Eine sicherere Short-Chance würde erst dann entstehen, wenn der Preis auf den Widerstandsbereich 1.0360–1.1060 zurückprallt und eine klare Ablehnung oder eine niedrigere Hochbildung zeigt (Achte auf Reversal-Muster wie bearish engulfing, Pin-Bars oder einen Breakdown in den Charts von 5m/1m).
- Wenn du shorten willst: Warte, bis der Preis auf 1.0360–1.1060 steigt, suche nach einem tieferen Hoch und nach einer bärischen Bestätigung, und gehe dann in den Short. Als erstes Ziel 0.8869, danach 0.8355. Setze den Stop-Loss oberhalb des Swing-High des Rebounds.
- Wenn der Preis stattdessen bricht und über 1.1060 hält, insbesondere mit starkem Volumen und ohne Ablehnung, dann könnte der lokale Boden erstmal drin sein und der Preis könnte zurück in Richtung Gleichgewicht bei 1.035 oder höher laufen.
- Wenn der Preis unter 0.8575–0.8355 flushes und diese Zone dann schnell wieder zurückerobert – zum Beispiel mit einem bullish engulfing oder einer starken Umkehr – dann könntest du einen Scalplong in Betracht ziehen, Ziel bei 1.0360 und Stop unterhalb des Sweep-Lows.
- BETRETEKEINERLEI POSITION OHNE BESTÄTIGUNG! Warte auf klare Reversal-Muster (z. B. Pin-Bar-Ablehnung am Widerstand für Shorts oder bullish engulfing nach einem Sweep für Longs) oder auf Strukturbrüche in niedrigeren Zeiteinheiten.
📝 Das ist keine Anlageberatung, sondern eine bildungsorientierte Analyse, um dir zu helfen, kritische Levels und wahrscheinliche Szenarien zu verstehen. Warte immer auf Bestätigung, bevor du einen Trade machst, und manage dein Risiko sorgfältig, denn die hohe Volatilität nach so einem Dump kann sich schnell in beide Richtungen umkehren!
📊 Hol dir eine detaillierte kostenlose Analyse zu jeder Coin auf jedem gewünschten Timeframe. Teste Finora AI – dein Trade Buddy – kostenlos → tinyurl.com/FinoraBot
#EVAA
🔴 $EVAA hat gerade 5,9% abgeworfen – kurze Chance?
- Aufgrund des extremen Rückgangs, des sprunghaften Volumenanstiegs und der Tatsache, dass der Preis knapp über dem jüngsten Swing-Low liegt, besteht ein echtes Risiko, dass der Boden in der Nähe ist – zumindest vorübergehend. Daher ist das Verfolgen eines Shorts im Moment gefährlich, außer du siehst einen schwachen Rebound bis in den Widerstand, der scheitert.
- Eine sicherere Short-Chance würde erst dann entstehen, wenn der Preis auf den Widerstandsbereich 1.0360–1.1060 zurückprallt und eine klare Ablehnung oder eine niedrigere Hochbildung zeigt (Achte auf Reversal-Muster wie bearish engulfing, Pin-Bars oder einen Breakdown in den Charts von 5m/1m).
- Wenn du shorten willst: Warte, bis der Preis auf 1.0360–1.1060 steigt, suche nach einem tieferen Hoch und nach einer bärischen Bestätigung, und gehe dann in den Short. Als erstes Ziel 0.8869, danach 0.8355. Setze den Stop-Loss oberhalb des Swing-High des Rebounds.
- Wenn der Preis stattdessen bricht und über 1.1060 hält, insbesondere mit starkem Volumen und ohne Ablehnung, dann könnte der lokale Boden erstmal drin sein und der Preis könnte zurück in Richtung Gleichgewicht bei 1.035 oder höher laufen.
- Wenn der Preis unter 0.8575–0.8355 flushes und diese Zone dann schnell wieder zurückerobert – zum Beispiel mit einem bullish engulfing oder einer starken Umkehr – dann könntest du einen Scalplong in Betracht ziehen, Ziel bei 1.0360 und Stop unterhalb des Sweep-Lows.
- BETRETEKEINERLEI POSITION OHNE BESTÄTIGUNG! Warte auf klare Reversal-Muster (z. B. Pin-Bar-Ablehnung am Widerstand für Shorts oder bullish engulfing nach einem Sweep für Longs) oder auf Strukturbrüche in niedrigeren Zeiteinheiten.
📝 Das ist keine Anlageberatung, sondern eine bildungsorientierte Analyse, um dir zu helfen, kritische Levels und wahrscheinliche Szenarien zu verstehen. Warte immer auf Bestätigung, bevor du einen Trade machst, und manage dein Risiko sorgfältig, denn die hohe Volatilität nach so einem Dump kann sich schnell in beide Richtungen umkehren!
📊 Hol dir eine detaillierte kostenlose Analyse zu jeder Coin auf jedem gewünschten Timeframe. Teste Finora AI – dein Trade Buddy – kostenlos → tinyurl.com/FinoraBot
#EVAA
232
·
--
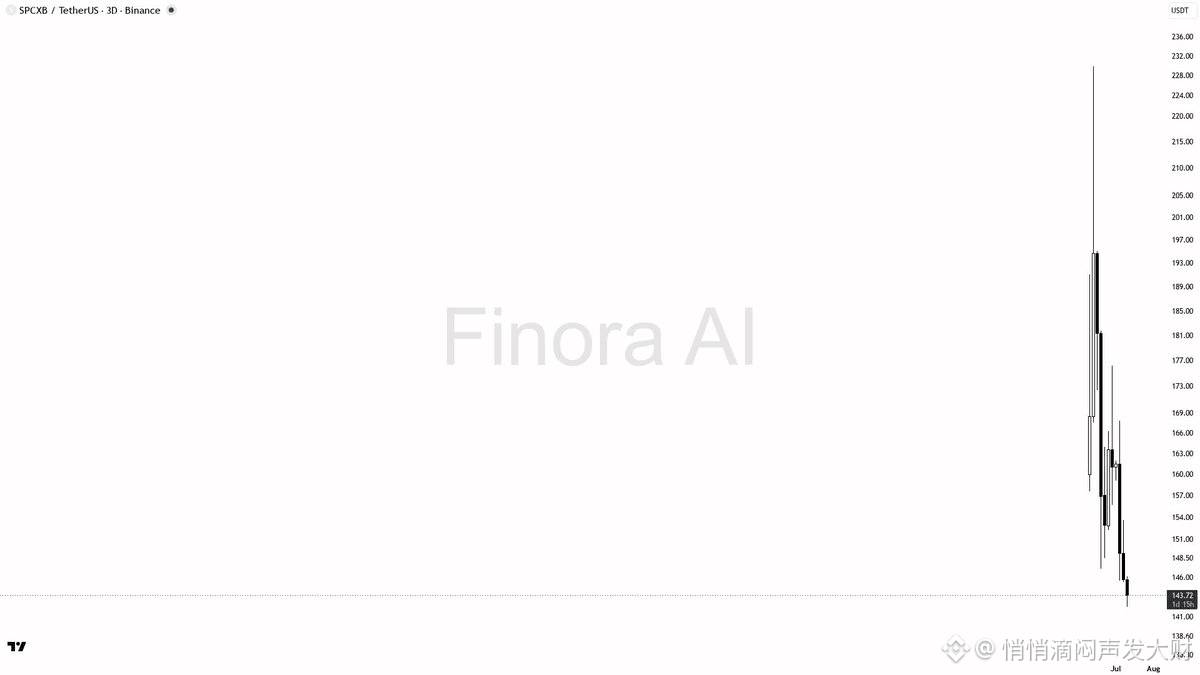
$SPCXB
$SPCXB 3D | Chartanalyse
- Angesichts der aktuellen Struktur ist der Weg des geringsten Widerstands weiterhin nach unten. Ich erwarte möglicherweise einen Ausblick/Abtastung des Niveaus bei 142,23, der kurzfristig Käufe auslösen könnte. Doch sofern der Preis nicht zurückerobert und mit Schwung über 145,85 hält, dürften die Verkäufer die Kontrolle behalten.
- Für Short-Trades wären ideale Einstiegspunkte im Bereich um 155,65–160,00 (Widerstands-/Supply-Zone) mit Bestätigung. Ziele wären zunächst 145,85 und danach 142,23.
- Für Long-Trades nur dann in Betracht ziehen, wenn der Preis unter 142,23 manipuliert und es dann schnell mit einer starken Umkehr zurückerobert (z. B. eine Engulfing-Kerze auf dem 4H/1D). Danach könnte es wieder Richtung 145,85 und eventuell zu höherem Widerstand gehen.
- Wenn der Preis oberhalb von 167,76 schließt und dort hält, wäre das ein Hinweis auf eine mögliche bullische Verschiebung, und ich würde meine Einschätzung neu bewerten.
🚨 Hol dir kostenlose KI-Trade-Signale, bevor die Bewegung startet.
Join Finora AI → tinyurl.com/FinoraBot
#SPCXB
{future}(SPCXBUSDT)
$SPCXB
$SPCXB 3D | Chartanalyse
- Angesichts der aktuellen Struktur ist der Weg des geringsten Widerstands weiterhin nach unten. Ich erwarte möglicherweise einen Ausblick/Abtastung des Niveaus bei 142,23, der kurzfristig Käufe auslösen könnte. Doch sofern der Preis nicht zurückerobert und mit Schwung über 145,85 hält, dürften die Verkäufer die Kontrolle behalten.
- Für Short-Trades wären ideale Einstiegspunkte im Bereich um 155,65–160,00 (Widerstands-/Supply-Zone) mit Bestätigung. Ziele wären zunächst 145,85 und danach 142,23.
- Für Long-Trades nur dann in Betracht ziehen, wenn der Preis unter 142,23 manipuliert und es dann schnell mit einer starken Umkehr zurückerobert (z. B. eine Engulfing-Kerze auf dem 4H/1D). Danach könnte es wieder Richtung 145,85 und eventuell zu höherem Widerstand gehen.
- Wenn der Preis oberhalb von 167,76 schließt und dort hält, wäre das ein Hinweis auf eine mögliche bullische Verschiebung, und ich würde meine Einschätzung neu bewerten.
🚨 Hol dir kostenlose KI-Trade-Signale, bevor die Bewegung startet.
Join Finora AI → tinyurl.com/FinoraBot
#SPCXB
$SPCXB 3D | Chartanalyse
- Angesichts der aktuellen Struktur ist der Weg des geringsten Widerstands weiterhin nach unten. Ich erwarte möglicherweise einen Ausblick/Abtastung des Niveaus bei 142,23, der kurzfristig Käufe auslösen könnte. Doch sofern der Preis nicht zurückerobert und mit Schwung über 145,85 hält, dürften die Verkäufer die Kontrolle behalten.
- Für Short-Trades wären ideale Einstiegspunkte im Bereich um 155,65–160,00 (Widerstands-/Supply-Zone) mit Bestätigung. Ziele wären zunächst 145,85 und danach 142,23.
- Für Long-Trades nur dann in Betracht ziehen, wenn der Preis unter 142,23 manipuliert und es dann schnell mit einer starken Umkehr zurückerobert (z. B. eine Engulfing-Kerze auf dem 4H/1D). Danach könnte es wieder Richtung 145,85 und eventuell zu höherem Widerstand gehen.
- Wenn der Preis oberhalb von 167,76 schließt und dort hält, wäre das ein Hinweis auf eine mögliche bullische Verschiebung, und ich würde meine Einschätzung neu bewerten.
🚨 Hol dir kostenlose KI-Trade-Signale, bevor die Bewegung startet.
Join Finora AI → tinyurl.com/FinoraBot
#SPCXB
124
·
--
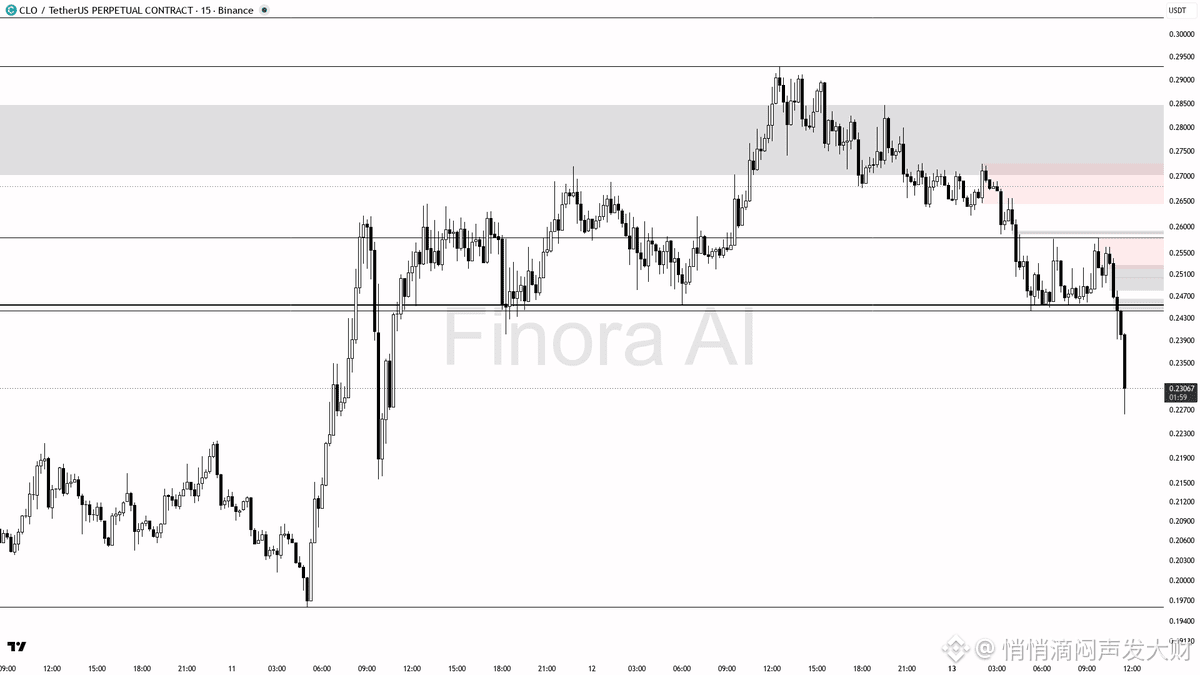
$CLO
📉 Starker Verkaufsdruck: 4,1% auf $CLO – ist der Boden nahe?
- Angesichts der extrem bärischen Dynamik und der allgemeinen Schwäche der Indikatoren ist weiteres Abwärts-Potenzial wahrscheinlich, sofern kein scharfes Umkehrsignal erscheint.
- Wenn du auf einen Short setzt, ziehe Einstiegsmöglichkeiten bei einem schwachen Rebound in Richtung 0.24425 in Betracht – mit Bestätigung, z. B. durch bärische Pin-Bars, Engulfing-Kerzen oder gescheiterte Ausbruchsversuche.
- Take-Profit-Ziele für Shorts wären zunächst 0.22990 und danach 0.21557, falls der Verkauf mit neuer Stärke wieder einsetzt.
- Der Stop-Loss sollte oberhalb des Swing-Highs gesetzt werden, das durch jeden Rücklauf entsteht, oder oberhalb der 0.24425-Zone, falls du dort bei einer Ablehnung einsteigst.
- Wenn – nach diesem Flush – der Kurs unter 0.22990 fällt und es dann schnell wieder zurückerobert, mit starkem bullischem Kursverhalten (z. B. durch eine plötzliche Engulfing-Kerze oder ein doppeltes Bottom), könnte das ein Hinweis auf einen potenziellen lokalen Boden sein und eine Scalping-Long-Chance Richtung 0.24425 bieten. Warte auf ein klares Umkehrmuster und einen Volumen-Boost zur Bestätigung!
- Wenn der Kurs zurück über das Gleichgewicht (0.2412) steigt und dabei mit starkem Kaufdruck hält, würde sich mein Bias von bärisch zu neutral bis leicht bullisch für einen Erholungs-Push verschieben.
- Verfolge Shorts gerade jetzt nicht unten – warte auf einen Bounce oder eine Bestätigung für eine weitere Breakdown-Phase. Das ist eine Zone, in der aggressive Verkäufer gefangen werden könnten, wenn der Preis nach dem Liquidity-Sweep schnell wieder dreht.
📝 Das ist keine Anlageberatung – nur eine edukative Analyse. Ich erwarte mehr Abwärtsbewegung, außer ein scharfes Umkehrsignal erscheint bei oder unter 0.22990. Warte auf Bestätigungen wie Pin-Bars, bullishes Engulfing auf niedriger Zeitebene oder gescheiterte Breakdowns, bevor du einen Reversal-Long in Erwägung ziehst. Für Shorts: Suche nach schwachen Rebounds in Richtung Widerstand, um mit Bestätigung einzusteigen. Handel vorsichtig!
📊 Hol dir eine detaillierte kostenlose Analyse zu jeder Coin auf jeder Zeitebene, die du willst. Teste Finora AI – Dein Trade-Buddy – kostenlos → tinyurl.com/FinoraBot
#CLO
{future}(CLOUSDT)
$CLO
📉 Starker Verkaufsdruck: 4,1% auf $CLO – ist der Boden nahe?
- Angesichts der extrem bärischen Dynamik und der allgemeinen Schwäche der Indikatoren ist weiteres Abwärts-Potenzial wahrscheinlich, sofern kein scharfes Umkehrsignal erscheint.
- Wenn du auf einen Short setzt, ziehe Einstiegsmöglichkeiten bei einem schwachen Rebound in Richtung 0.24425 in Betracht – mit Bestätigung, z. B. durch bärische Pin-Bars, Engulfing-Kerzen oder gescheiterte Ausbruchsversuche.
- Take-Profit-Ziele für Shorts wären zunächst 0.22990 und danach 0.21557, falls der Verkauf mit neuer Stärke wieder einsetzt.
- Der Stop-Loss sollte oberhalb des Swing-Highs gesetzt werden, das durch jeden Rücklauf entsteht, oder oberhalb der 0.24425-Zone, falls du dort bei einer Ablehnung einsteigst.
- Wenn – nach diesem Flush – der Kurs unter 0.22990 fällt und es dann schnell wieder zurückerobert, mit starkem bullischem Kursverhalten (z. B. durch eine plötzliche Engulfing-Kerze oder ein doppeltes Bottom), könnte das ein Hinweis auf einen potenziellen lokalen Boden sein und eine Scalping-Long-Chance Richtung 0.24425 bieten. Warte auf ein klares Umkehrmuster und einen Volumen-Boost zur Bestätigung!
- Wenn der Kurs zurück über das Gleichgewicht (0.2412) steigt und dabei mit starkem Kaufdruck hält, würde sich mein Bias von bärisch zu neutral bis leicht bullisch für einen Erholungs-Push verschieben.
- Verfolge Shorts gerade jetzt nicht unten – warte auf einen Bounce oder eine Bestätigung für eine weitere Breakdown-Phase. Das ist eine Zone, in der aggressive Verkäufer gefangen werden könnten, wenn der Preis nach dem Liquidity-Sweep schnell wieder dreht.
📝 Das ist keine Anlageberatung – nur eine edukative Analyse. Ich erwarte mehr Abwärtsbewegung, außer ein scharfes Umkehrsignal erscheint bei oder unter 0.22990. Warte auf Bestätigungen wie Pin-Bars, bullishes Engulfing auf niedriger Zeitebene oder gescheiterte Breakdowns, bevor du einen Reversal-Long in Erwägung ziehst. Für Shorts: Suche nach schwachen Rebounds in Richtung Widerstand, um mit Bestätigung einzusteigen. Handel vorsichtig!
📊 Hol dir eine detaillierte kostenlose Analyse zu jeder Coin auf jeder Zeitebene, die du willst. Teste Finora AI – Dein Trade-Buddy – kostenlos → tinyurl.com/FinoraBot
#CLO
📉 Starker Verkaufsdruck: 4,1% auf $CLO – ist der Boden nahe?
- Angesichts der extrem bärischen Dynamik und der allgemeinen Schwäche der Indikatoren ist weiteres Abwärts-Potenzial wahrscheinlich, sofern kein scharfes Umkehrsignal erscheint.
- Wenn du auf einen Short setzt, ziehe Einstiegsmöglichkeiten bei einem schwachen Rebound in Richtung 0.24425 in Betracht – mit Bestätigung, z. B. durch bärische Pin-Bars, Engulfing-Kerzen oder gescheiterte Ausbruchsversuche.
- Take-Profit-Ziele für Shorts wären zunächst 0.22990 und danach 0.21557, falls der Verkauf mit neuer Stärke wieder einsetzt.
- Der Stop-Loss sollte oberhalb des Swing-Highs gesetzt werden, das durch jeden Rücklauf entsteht, oder oberhalb der 0.24425-Zone, falls du dort bei einer Ablehnung einsteigst.
- Wenn – nach diesem Flush – der Kurs unter 0.22990 fällt und es dann schnell wieder zurückerobert, mit starkem bullischem Kursverhalten (z. B. durch eine plötzliche Engulfing-Kerze oder ein doppeltes Bottom), könnte das ein Hinweis auf einen potenziellen lokalen Boden sein und eine Scalping-Long-Chance Richtung 0.24425 bieten. Warte auf ein klares Umkehrmuster und einen Volumen-Boost zur Bestätigung!
- Wenn der Kurs zurück über das Gleichgewicht (0.2412) steigt und dabei mit starkem Kaufdruck hält, würde sich mein Bias von bärisch zu neutral bis leicht bullisch für einen Erholungs-Push verschieben.
- Verfolge Shorts gerade jetzt nicht unten – warte auf einen Bounce oder eine Bestätigung für eine weitere Breakdown-Phase. Das ist eine Zone, in der aggressive Verkäufer gefangen werden könnten, wenn der Preis nach dem Liquidity-Sweep schnell wieder dreht.
📝 Das ist keine Anlageberatung – nur eine edukative Analyse. Ich erwarte mehr Abwärtsbewegung, außer ein scharfes Umkehrsignal erscheint bei oder unter 0.22990. Warte auf Bestätigungen wie Pin-Bars, bullishes Engulfing auf niedriger Zeitebene oder gescheiterte Breakdowns, bevor du einen Reversal-Long in Erwägung ziehst. Für Shorts: Suche nach schwachen Rebounds in Richtung Widerstand, um mit Bestätigung einzusteigen. Handel vorsichtig!
📊 Hol dir eine detaillierte kostenlose Analyse zu jeder Coin auf jeder Zeitebene, die du willst. Teste Finora AI – Dein Trade-Buddy – kostenlos → tinyurl.com/FinoraBot
#CLO
68
·
--
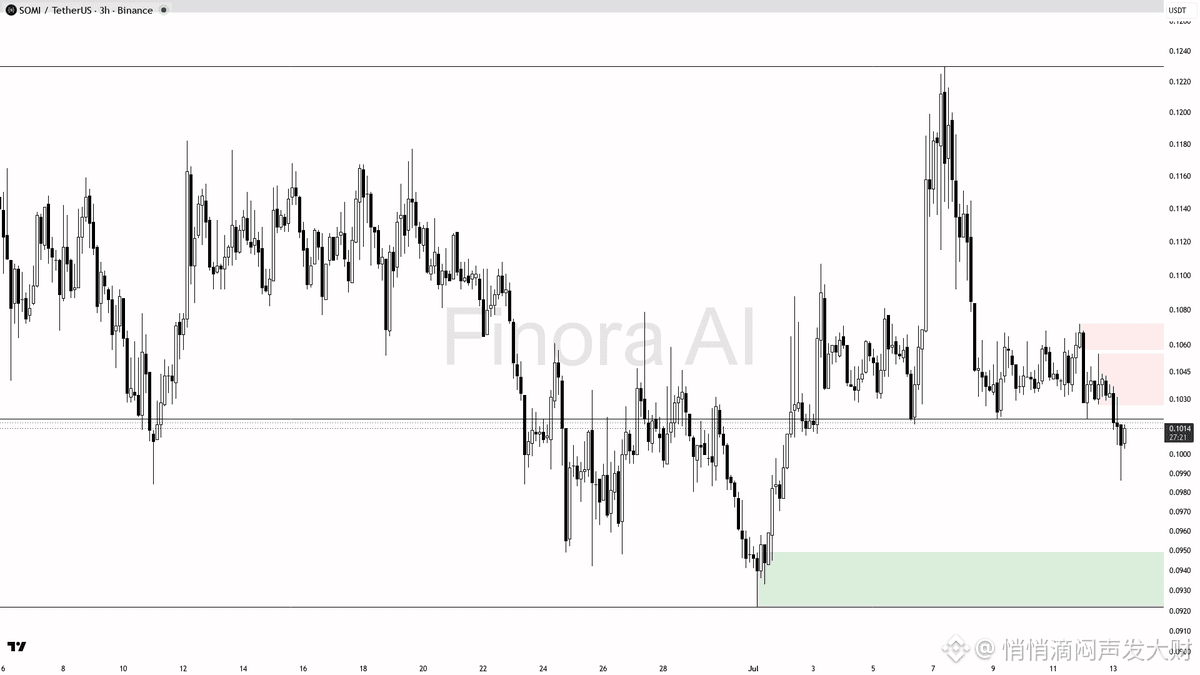
$SOMI
$SOMI 3h Preisdiagramm-Analyse
- Das Diagramm zeigt einen schwachen bärischen Trend, aber mit der Möglichkeit für einen kurzfristigen Rebound aus dem Support-/Nachfragebereich 0.0986–0.098. Wenn du hier ein starkes Umkehrmuster erkennst, ist ein Anstieg auf 0.1019 und möglicherweise 0.1055 wahrscheinlich.
- Wenn der Kurs es nicht schafft, über 0.098 zu halten, und bei starkem Volumen unter 0.098 schließt, erwarte einen weiteren Abwärtsimpuls in Richtung des zuletzt erreichten Swing-Tiefs bei 0.0922, wo erneut Käuferinteresse auftauchen könnte.
- Wenn der Kurs anzieht und 0.1072 stark zurückerobert (bestätigter Ausbruch), könnte die bärische Tendenz invalidiert werden, und ein Squeeze in Richtung 0.1107 oder höher könnte sich entfalten.
- Denk daran, nur dann Trades zu handeln, wenn du die nötige Bestätigung bekommst (z. B. eine Umkehr auf einem kleineren Zeiteinrahmen, bullish engulfing, oder ein starker Pin Bar für Longs bzw. ein bärisches Muster für Shorts).
📊 Wandle Charts in klare Trade-Insights um.
Teste Finora AI kostenlos → tinyurl.com/FinoraBot
#SOMI
{future}(SOMIUSDT)
$SOMI
$SOMI 3h Preisdiagramm-Analyse
- Das Diagramm zeigt einen schwachen bärischen Trend, aber mit der Möglichkeit für einen kurzfristigen Rebound aus dem Support-/Nachfragebereich 0.0986–0.098. Wenn du hier ein starkes Umkehrmuster erkennst, ist ein Anstieg auf 0.1019 und möglicherweise 0.1055 wahrscheinlich.
- Wenn der Kurs es nicht schafft, über 0.098 zu halten, und bei starkem Volumen unter 0.098 schließt, erwarte einen weiteren Abwärtsimpuls in Richtung des zuletzt erreichten Swing-Tiefs bei 0.0922, wo erneut Käuferinteresse auftauchen könnte.
- Wenn der Kurs anzieht und 0.1072 stark zurückerobert (bestätigter Ausbruch), könnte die bärische Tendenz invalidiert werden, und ein Squeeze in Richtung 0.1107 oder höher könnte sich entfalten.
- Denk daran, nur dann Trades zu handeln, wenn du die nötige Bestätigung bekommst (z. B. eine Umkehr auf einem kleineren Zeiteinrahmen, bullish engulfing, oder ein starker Pin Bar für Longs bzw. ein bärisches Muster für Shorts).
📊 Wandle Charts in klare Trade-Insights um.
Teste Finora AI kostenlos → tinyurl.com/FinoraBot
#SOMI
$SOMI 3h Preisdiagramm-Analyse
- Das Diagramm zeigt einen schwachen bärischen Trend, aber mit der Möglichkeit für einen kurzfristigen Rebound aus dem Support-/Nachfragebereich 0.0986–0.098. Wenn du hier ein starkes Umkehrmuster erkennst, ist ein Anstieg auf 0.1019 und möglicherweise 0.1055 wahrscheinlich.
- Wenn der Kurs es nicht schafft, über 0.098 zu halten, und bei starkem Volumen unter 0.098 schließt, erwarte einen weiteren Abwärtsimpuls in Richtung des zuletzt erreichten Swing-Tiefs bei 0.0922, wo erneut Käuferinteresse auftauchen könnte.
- Wenn der Kurs anzieht und 0.1072 stark zurückerobert (bestätigter Ausbruch), könnte die bärische Tendenz invalidiert werden, und ein Squeeze in Richtung 0.1107 oder höher könnte sich entfalten.
- Denk daran, nur dann Trades zu handeln, wenn du die nötige Bestätigung bekommst (z. B. eine Umkehr auf einem kleineren Zeiteinrahmen, bullish engulfing, oder ein starker Pin Bar für Longs bzw. ein bärisches Muster für Shorts).
📊 Wandle Charts in klare Trade-Insights um.
Teste Finora AI kostenlos → tinyurl.com/FinoraBot
#SOMI
194
·
--
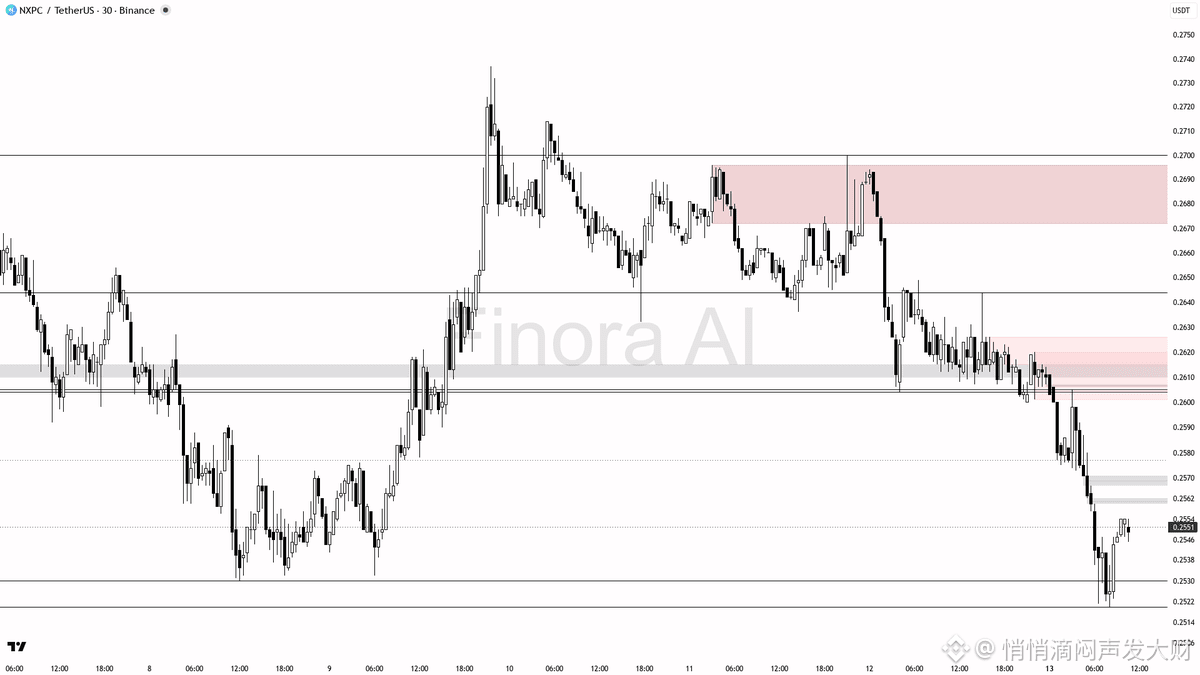
$NXPC
$NXPC 30m | Chartanalyse
- Es sieht so aus, als ob der Preis höhere Widerstände erneut testen möchte, nachdem bei 0.2532 Unterstützung gefunden wurde, aber der übergeordnete Trend ist insgesamt noch nicht eindeutig bullisch—eher ein Erleichterungs- oder Liquiditäts-Grab-Szenario.
- Ich erwarte kurzfristig einen Anstieg in Richtung 0.2568, möglicherweise mit einer Ausdehnung bis 0.2604, falls Käufer eingreifen. Der beste Long-Einstieg würde sich ergeben, nachdem ein Sweep unter 0.2532 erfolgt ist und es zu einer schnellen bullischen Umkehr kommt. Für die Bestätigung warte auf eine bullische Engulfing-Kerze oder eine Trendwende auf einem niedrigeren Timeframe.
- Wenn der Preis es nicht schafft, über 0.2568 auszubrechen und dort eine Umkehr bildet, kann ein Short-Trade in Betracht gezogen werden, mit dem Ziel zurück zu 0.2532.
- Wenn der Preis sauber über 0.2604 ausbricht und hält, könnte der nächste Schritt in Richtung 0.2632 und 0.2644 gehen.
- Wenn der Preis 0.2532 mit starkem Momentum verliert und es nicht zurückgewinnt, kippt das Bias ins Bärische und dann würde ich erwarten, dass 0.2500 und 0.2488 getestet werden.
📊 Noch eine zweite Meinung vor dem Trading?
Hol dir eine kostenlose KI-Analyse auf Finora → tinyurl.com/FinoraBot
#NXPC
{future}(NXPCUSDT)
$NXPC
$NXPC 30m | Chartanalyse
- Es sieht so aus, als ob der Preis höhere Widerstände erneut testen möchte, nachdem bei 0.2532 Unterstützung gefunden wurde, aber der übergeordnete Trend ist insgesamt noch nicht eindeutig bullisch—eher ein Erleichterungs- oder Liquiditäts-Grab-Szenario.
- Ich erwarte kurzfristig einen Anstieg in Richtung 0.2568, möglicherweise mit einer Ausdehnung bis 0.2604, falls Käufer eingreifen. Der beste Long-Einstieg würde sich ergeben, nachdem ein Sweep unter 0.2532 erfolgt ist und es zu einer schnellen bullischen Umkehr kommt. Für die Bestätigung warte auf eine bullische Engulfing-Kerze oder eine Trendwende auf einem niedrigeren Timeframe.
- Wenn der Preis es nicht schafft, über 0.2568 auszubrechen und dort eine Umkehr bildet, kann ein Short-Trade in Betracht gezogen werden, mit dem Ziel zurück zu 0.2532.
- Wenn der Preis sauber über 0.2604 ausbricht und hält, könnte der nächste Schritt in Richtung 0.2632 und 0.2644 gehen.
- Wenn der Preis 0.2532 mit starkem Momentum verliert und es nicht zurückgewinnt, kippt das Bias ins Bärische und dann würde ich erwarten, dass 0.2500 und 0.2488 getestet werden.
📊 Noch eine zweite Meinung vor dem Trading?
Hol dir eine kostenlose KI-Analyse auf Finora → tinyurl.com/FinoraBot
#NXPC
$NXPC 30m | Chartanalyse
- Es sieht so aus, als ob der Preis höhere Widerstände erneut testen möchte, nachdem bei 0.2532 Unterstützung gefunden wurde, aber der übergeordnete Trend ist insgesamt noch nicht eindeutig bullisch—eher ein Erleichterungs- oder Liquiditäts-Grab-Szenario.
- Ich erwarte kurzfristig einen Anstieg in Richtung 0.2568, möglicherweise mit einer Ausdehnung bis 0.2604, falls Käufer eingreifen. Der beste Long-Einstieg würde sich ergeben, nachdem ein Sweep unter 0.2532 erfolgt ist und es zu einer schnellen bullischen Umkehr kommt. Für die Bestätigung warte auf eine bullische Engulfing-Kerze oder eine Trendwende auf einem niedrigeren Timeframe.
- Wenn der Preis es nicht schafft, über 0.2568 auszubrechen und dort eine Umkehr bildet, kann ein Short-Trade in Betracht gezogen werden, mit dem Ziel zurück zu 0.2532.
- Wenn der Preis sauber über 0.2604 ausbricht und hält, könnte der nächste Schritt in Richtung 0.2632 und 0.2644 gehen.
- Wenn der Preis 0.2532 mit starkem Momentum verliert und es nicht zurückgewinnt, kippt das Bias ins Bärische und dann würde ich erwarten, dass 0.2500 und 0.2488 getestet werden.
📊 Noch eine zweite Meinung vor dem Trading?
Hol dir eine kostenlose KI-Analyse auf Finora → tinyurl.com/FinoraBot
#NXPC
201
·
--
$DODOX
📉 $DODOX mit 2,8x Verkaufs-Volumen-Sprung getroffen — ist das schon das Ende oder erst der Start?
- Durch den enormen Volumen-Sprung bei starkem Verkauf und einem deutlichen Rückgang von -3,9% wirkt das eher nach Distribution durch „smarte“ Geldgeber als nach reinem Panikverkauf—vor allem, weil der Preis mehrere Supports sowie Zonen mit Angebot von oben durchbrochen hat 🚨
- Ich erwarte weitere Abwärtsbewegung Richtung 0.018742 und kurzfristig möglicherweise 0.018000, sofern es nicht zu einem scharfen Reversal-Signal auf kleineren Timeframes kommt
- Ein Short-Trade könnte in Betracht gezogen werden, wenn:
- Der Preis schwach abprallt zu 0.020101 oder 0.021152 und dabei eine bärische Umkehrkerze bildet (z. B. Shooting Star oder Engulfing) auf dem 15m/5m-Timeframe
- Einstieg: etwa 0.020100–0.021100, nach Bestätigung der Ablehnung (warte auf ein klares Signal, nicht nur auf einen zufälligen Docht)
- Erster Zielbereich: 0.018742, dann 0.018200, dann 0.018000, falls die Bewegung sich ausdehnt
- Stop-Loss: oberhalb des Swing-High der Ablehnungs-Kerze setzen oder oberhalb von 0.021500, falls du konservativer agierst
- Wenn der Preis stattdessen mit hohem Volumen unter 0.018200 durchrutscht, warte auf einen Pullback, um einen Short beim Retest der Zone 0.018700–0.018900 zu nehmen, mit Zielen bei 0.016370/0.016001 als Nächstes
- Meine Einschätzung wird nur bullisch, wenn der Preis schnell wieder 0.021152 zurückerobert, mit starken grünen Kerzen und einem Close über dem Supply/FVG bei 0.022656–0.023464—dann wäre ein Bounce Richtung 0.023962/0.024595 möglich, aber aktuell ist das unwahrscheinlich, außer das Kaufvolumen zieht deutlich an
- Für alle Trades gilt: Warte auf Bestätigung wie eine Pin-Bar, bärisches Engulfing oder eine klare Trendfortsetzung auf kleineren Timeframes, bevor du einsteigst! Nicht hinterherlaufen ohne Signal—lass den Preis auf die Levels reagieren und steige nur ein, wenn du eine klare Ablehnung oder Umkehr siehst
📝 Das ist keine Anlageberatung—nur ein Bildungsbericht. Bei so hoher Volatilität und so viel Volumen immer professionelles Risikomanagement nutzen!
📊 Hol dir eine detaillierte kostenlose Analyse zu jeder Coin auf jedem Timeframe, den du willst. Probiere Finora AI - Your Trade Buddy kostenlos → tinyurl.com/FinoraBot
#DODOX
{future}(DODOXUSDT)
$DODOX
📉 $DODOX mit 2,8x Verkaufs-Volumen-Sprung getroffen — ist das schon das Ende oder erst der Start?
- Durch den enormen Volumen-Sprung bei starkem Verkauf und einem deutlichen Rückgang von -3,9% wirkt das eher nach Distribution durch „smarte“ Geldgeber als nach reinem Panikverkauf—vor allem, weil der Preis mehrere Supports sowie Zonen mit Angebot von oben durchbrochen hat 🚨
- Ich erwarte weitere Abwärtsbewegung Richtung 0.018742 und kurzfristig möglicherweise 0.018000, sofern es nicht zu einem scharfen Reversal-Signal auf kleineren Timeframes kommt
- Ein Short-Trade könnte in Betracht gezogen werden, wenn:
- Der Preis schwach abprallt zu 0.020101 oder 0.021152 und dabei eine bärische Umkehrkerze bildet (z. B. Shooting Star oder Engulfing) auf dem 15m/5m-Timeframe
- Einstieg: etwa 0.020100–0.021100, nach Bestätigung der Ablehnung (warte auf ein klares Signal, nicht nur auf einen zufälligen Docht)
- Erster Zielbereich: 0.018742, dann 0.018200, dann 0.018000, falls die Bewegung sich ausdehnt
- Stop-Loss: oberhalb des Swing-High der Ablehnungs-Kerze setzen oder oberhalb von 0.021500, falls du konservativer agierst
- Wenn der Preis stattdessen mit hohem Volumen unter 0.018200 durchrutscht, warte auf einen Pullback, um einen Short beim Retest der Zone 0.018700–0.018900 zu nehmen, mit Zielen bei 0.016370/0.016001 als Nächstes
- Meine Einschätzung wird nur bullisch, wenn der Preis schnell wieder 0.021152 zurückerobert, mit starken grünen Kerzen und einem Close über dem Supply/FVG bei 0.022656–0.023464—dann wäre ein Bounce Richtung 0.023962/0.024595 möglich, aber aktuell ist das unwahrscheinlich, außer das Kaufvolumen zieht deutlich an
- Für alle Trades gilt: Warte auf Bestätigung wie eine Pin-Bar, bärisches Engulfing oder eine klare Trendfortsetzung auf kleineren Timeframes, bevor du einsteigst! Nicht hinterherlaufen ohne Signal—lass den Preis auf die Levels reagieren und steige nur ein, wenn du eine klare Ablehnung oder Umkehr siehst
📝 Das ist keine Anlageberatung—nur ein Bildungsbericht. Bei so hoher Volatilität und so viel Volumen immer professionelles Risikomanagement nutzen!
📊 Hol dir eine detaillierte kostenlose Analyse zu jeder Coin auf jedem Timeframe, den du willst. Probiere Finora AI - Your Trade Buddy kostenlos → tinyurl.com/FinoraBot
#DODOX
📉 $DODOX mit 2,8x Verkaufs-Volumen-Sprung getroffen — ist das schon das Ende oder erst der Start?
- Durch den enormen Volumen-Sprung bei starkem Verkauf und einem deutlichen Rückgang von -3,9% wirkt das eher nach Distribution durch „smarte“ Geldgeber als nach reinem Panikverkauf—vor allem, weil der Preis mehrere Supports sowie Zonen mit Angebot von oben durchbrochen hat 🚨
- Ich erwarte weitere Abwärtsbewegung Richtung 0.018742 und kurzfristig möglicherweise 0.018000, sofern es nicht zu einem scharfen Reversal-Signal auf kleineren Timeframes kommt
- Ein Short-Trade könnte in Betracht gezogen werden, wenn:
- Der Preis schwach abprallt zu 0.020101 oder 0.021152 und dabei eine bärische Umkehrkerze bildet (z. B. Shooting Star oder Engulfing) auf dem 15m/5m-Timeframe
- Einstieg: etwa 0.020100–0.021100, nach Bestätigung der Ablehnung (warte auf ein klares Signal, nicht nur auf einen zufälligen Docht)
- Erster Zielbereich: 0.018742, dann 0.018200, dann 0.018000, falls die Bewegung sich ausdehnt
- Stop-Loss: oberhalb des Swing-High der Ablehnungs-Kerze setzen oder oberhalb von 0.021500, falls du konservativer agierst
- Wenn der Preis stattdessen mit hohem Volumen unter 0.018200 durchrutscht, warte auf einen Pullback, um einen Short beim Retest der Zone 0.018700–0.018900 zu nehmen, mit Zielen bei 0.016370/0.016001 als Nächstes
- Meine Einschätzung wird nur bullisch, wenn der Preis schnell wieder 0.021152 zurückerobert, mit starken grünen Kerzen und einem Close über dem Supply/FVG bei 0.022656–0.023464—dann wäre ein Bounce Richtung 0.023962/0.024595 möglich, aber aktuell ist das unwahrscheinlich, außer das Kaufvolumen zieht deutlich an
- Für alle Trades gilt: Warte auf Bestätigung wie eine Pin-Bar, bärisches Engulfing oder eine klare Trendfortsetzung auf kleineren Timeframes, bevor du einsteigst! Nicht hinterherlaufen ohne Signal—lass den Preis auf die Levels reagieren und steige nur ein, wenn du eine klare Ablehnung oder Umkehr siehst
📝 Das ist keine Anlageberatung—nur ein Bildungsbericht. Bei so hoher Volatilität und so viel Volumen immer professionelles Risikomanagement nutzen!
📊 Hol dir eine detaillierte kostenlose Analyse zu jeder Coin auf jedem Timeframe, den du willst. Probiere Finora AI - Your Trade Buddy kostenlos → tinyurl.com/FinoraBot
#DODOX
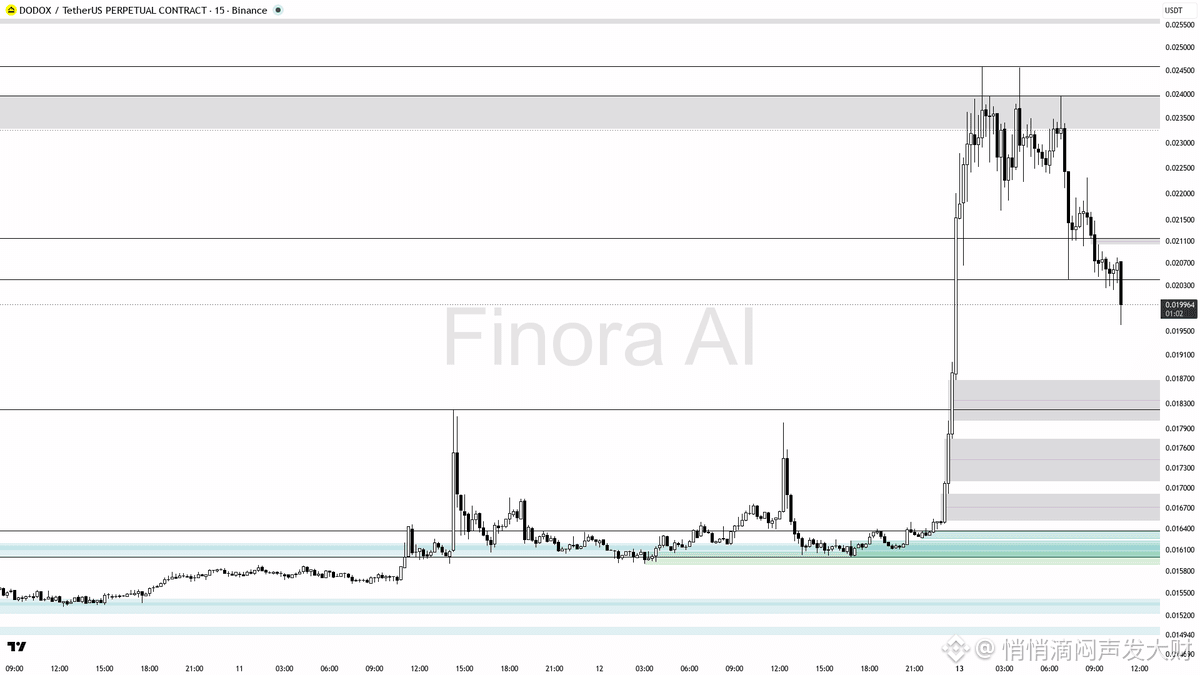
14
·
--
$SXT
$SXT 4h Marktlage lesen
- Die Gesamtneigung ist bullisch, trotz gemischter Impulssignale
- Die kritische Nachfragespanne liegt gebündelt bei 0.00769–0.00760 und könnte einen Bounce auslösen
- +15% Aufwärtspotenzial bis hin zu 0.00879 und möglicherweise einem Test von 0.01100
- Der jüngste scharfe Rücksetzer deutet auf einen Liquiditäts-Grab über dem letzten Swing-High hin
- Achte genau auf ein entscheidendes Price-Action-Event in der Nachfragespanne, das die Waage kippen könnte…
📊 Willst du die exakten Levels? Vollständiger Breakdown wartet auf dich:
→ tinyurl.com/FinoraBot
#SXT
{future}(SXTUSDT)
$SXT
$SXT 4h Marktlage lesen
- Die Gesamtneigung ist bullisch, trotz gemischter Impulssignale
- Die kritische Nachfragespanne liegt gebündelt bei 0.00769–0.00760 und könnte einen Bounce auslösen
- +15% Aufwärtspotenzial bis hin zu 0.00879 und möglicherweise einem Test von 0.01100
- Der jüngste scharfe Rücksetzer deutet auf einen Liquiditäts-Grab über dem letzten Swing-High hin
- Achte genau auf ein entscheidendes Price-Action-Event in der Nachfragespanne, das die Waage kippen könnte…
📊 Willst du die exakten Levels? Vollständiger Breakdown wartet auf dich:
→ tinyurl.com/FinoraBot
#SXT
$SXT 4h Marktlage lesen
- Die Gesamtneigung ist bullisch, trotz gemischter Impulssignale
- Die kritische Nachfragespanne liegt gebündelt bei 0.00769–0.00760 und könnte einen Bounce auslösen
- +15% Aufwärtspotenzial bis hin zu 0.00879 und möglicherweise einem Test von 0.01100
- Der jüngste scharfe Rücksetzer deutet auf einen Liquiditäts-Grab über dem letzten Swing-High hin
- Achte genau auf ein entscheidendes Price-Action-Event in der Nachfragespanne, das die Waage kippen könnte…
📊 Willst du die exakten Levels? Vollständiger Breakdown wartet auf dich:
→ tinyurl.com/FinoraBot
#SXT
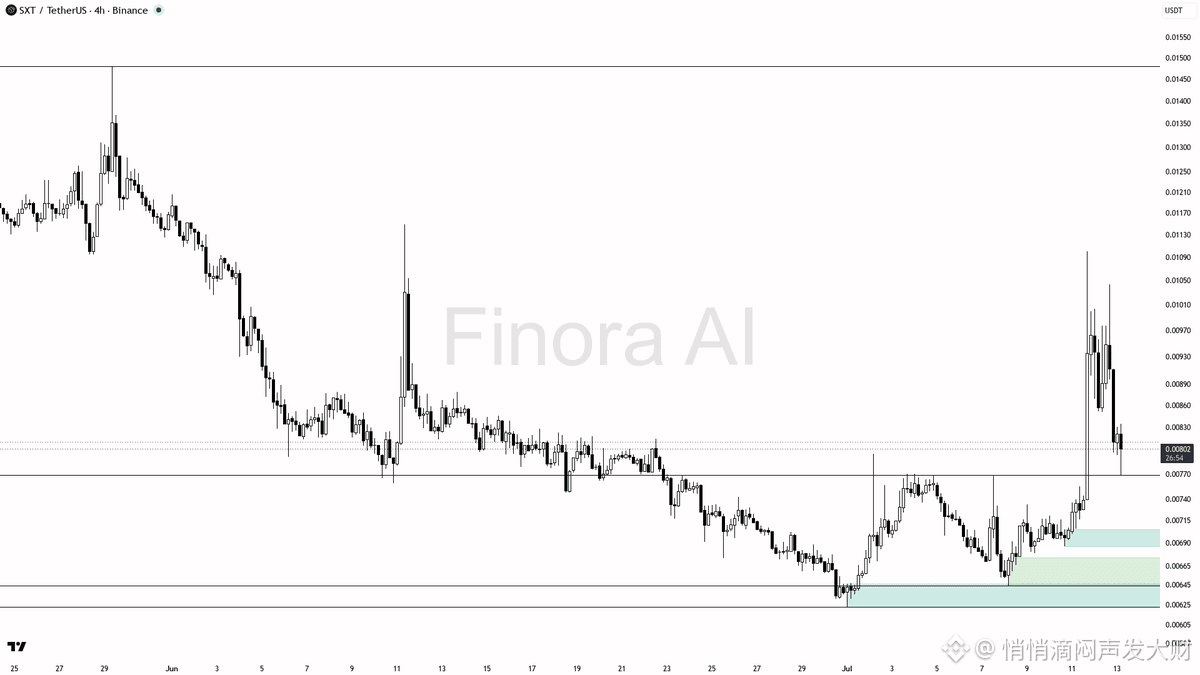
129
·
--
$MAGMA
✅ Massive Buy-Side-Volumen auf $MAGMA bei 3,1x
- Die massive Volumenanomalie und das aggressive Kaufen deuten darauf hin, dass es sich wahrscheinlich um eine kluge Geldansammlung handelt—nicht nur um Retail, das hinterherläuft.
- Meine Einschätzung ist, dass der Preis von hier aus voraussichtlich steigen wird, zumindest um die 0,36000 als Widerstand erneut zu testen, und bei anhaltendem Momentum möglicherweise bis in Richtung 0,38238 weiterläuft.
- Beispiel-Trade-Setup: Wenn der Preis in die Demand-Zone 0,31100–0,29240 zurückkehrt und dann ein bullishes Engulfing oder eine Pin-Bar mit hohem Volumen bildet, ziehe einen Long-Einstieg in Betracht.
- Einstieg: 0,31300–0,32000 (bei bestätigter Umkehr in der Demand-Zone)
- Take Profit 1: 0,36000 (erster Widerstand/strukturelles Ziel)
- Take Profit 2: 0,38238 (sekundärer Widerstand/Struktur)
- Der Stop-Loss sollte unter dem Swing-Low bei etwa 0,29240 gesetzt werden oder auf dem Niveau, auf dem der Trend sich klar wieder umkehren würde.
- Wenn der Preis stattdessen entschlossen über 0,36000 schließt—mit starkem Volumen und bullischer Kursaktion—wird ein Ausbruch-/Retest-Einstieg in Richtung 0,38238–0,42759 realistisch.
- Achte auf Bestätigung: bullishes Engulfing, Trendfortsetzung auf niedrigeren Timeframes oder wiederholte Abweisung tieferer Kurse.
- Diese Einschätzung wird nur dann bärisch, wenn der Preis unter 0,29240 fällt und dort mit starkem Verkauf schließt—wodurch die These der Ansammlung ungültig wird.
📝 Dies ist keine Anlageberatung, sondern eine pädagogische Analyse. Das aktuelle Setup deutet auf eine wahrscheinliche Fortsetzung nach oben hin, wobei Smart Money möglicherweise akkumuliert, nachdem eine Liquiditätsabholung erfolgt ist. Warte immer auf Bestätigung—geh nicht aus FOMO beim ersten Spike rein!
📊 Hol dir eine detaillierte kostenlose Analyse zu jeder Coin auf jedem Timeframe, den du willst. Probier Finora AI - Your Trade Buddy kostenlos → tinyurl.com/FinoraBot
#MAGMA
{future}(MAGMAUSDT)
$MAGMA
✅ Massive Buy-Side-Volumen auf $MAGMA bei 3,1x
- Die massive Volumenanomalie und das aggressive Kaufen deuten darauf hin, dass es sich wahrscheinlich um eine kluge Geldansammlung handelt—nicht nur um Retail, das hinterherläuft.
- Meine Einschätzung ist, dass der Preis von hier aus voraussichtlich steigen wird, zumindest um die 0,36000 als Widerstand erneut zu testen, und bei anhaltendem Momentum möglicherweise bis in Richtung 0,38238 weiterläuft.
- Beispiel-Trade-Setup: Wenn der Preis in die Demand-Zone 0,31100–0,29240 zurückkehrt und dann ein bullishes Engulfing oder eine Pin-Bar mit hohem Volumen bildet, ziehe einen Long-Einstieg in Betracht.
- Einstieg: 0,31300–0,32000 (bei bestätigter Umkehr in der Demand-Zone)
- Take Profit 1: 0,36000 (erster Widerstand/strukturelles Ziel)
- Take Profit 2: 0,38238 (sekundärer Widerstand/Struktur)
- Der Stop-Loss sollte unter dem Swing-Low bei etwa 0,29240 gesetzt werden oder auf dem Niveau, auf dem der Trend sich klar wieder umkehren würde.
- Wenn der Preis stattdessen entschlossen über 0,36000 schließt—mit starkem Volumen und bullischer Kursaktion—wird ein Ausbruch-/Retest-Einstieg in Richtung 0,38238–0,42759 realistisch.
- Achte auf Bestätigung: bullishes Engulfing, Trendfortsetzung auf niedrigeren Timeframes oder wiederholte Abweisung tieferer Kurse.
- Diese Einschätzung wird nur dann bärisch, wenn der Preis unter 0,29240 fällt und dort mit starkem Verkauf schließt—wodurch die These der Ansammlung ungültig wird.
📝 Dies ist keine Anlageberatung, sondern eine pädagogische Analyse. Das aktuelle Setup deutet auf eine wahrscheinliche Fortsetzung nach oben hin, wobei Smart Money möglicherweise akkumuliert, nachdem eine Liquiditätsabholung erfolgt ist. Warte immer auf Bestätigung—geh nicht aus FOMO beim ersten Spike rein!
📊 Hol dir eine detaillierte kostenlose Analyse zu jeder Coin auf jedem Timeframe, den du willst. Probier Finora AI - Your Trade Buddy kostenlos → tinyurl.com/FinoraBot
#MAGMA
✅ Massive Buy-Side-Volumen auf $MAGMA bei 3,1x
- Die massive Volumenanomalie und das aggressive Kaufen deuten darauf hin, dass es sich wahrscheinlich um eine kluge Geldansammlung handelt—nicht nur um Retail, das hinterherläuft.
- Meine Einschätzung ist, dass der Preis von hier aus voraussichtlich steigen wird, zumindest um die 0,36000 als Widerstand erneut zu testen, und bei anhaltendem Momentum möglicherweise bis in Richtung 0,38238 weiterläuft.
- Beispiel-Trade-Setup: Wenn der Preis in die Demand-Zone 0,31100–0,29240 zurückkehrt und dann ein bullishes Engulfing oder eine Pin-Bar mit hohem Volumen bildet, ziehe einen Long-Einstieg in Betracht.
- Einstieg: 0,31300–0,32000 (bei bestätigter Umkehr in der Demand-Zone)
- Take Profit 1: 0,36000 (erster Widerstand/strukturelles Ziel)
- Take Profit 2: 0,38238 (sekundärer Widerstand/Struktur)
- Der Stop-Loss sollte unter dem Swing-Low bei etwa 0,29240 gesetzt werden oder auf dem Niveau, auf dem der Trend sich klar wieder umkehren würde.
- Wenn der Preis stattdessen entschlossen über 0,36000 schließt—mit starkem Volumen und bullischer Kursaktion—wird ein Ausbruch-/Retest-Einstieg in Richtung 0,38238–0,42759 realistisch.
- Achte auf Bestätigung: bullishes Engulfing, Trendfortsetzung auf niedrigeren Timeframes oder wiederholte Abweisung tieferer Kurse.
- Diese Einschätzung wird nur dann bärisch, wenn der Preis unter 0,29240 fällt und dort mit starkem Verkauf schließt—wodurch die These der Ansammlung ungültig wird.
📝 Dies ist keine Anlageberatung, sondern eine pädagogische Analyse. Das aktuelle Setup deutet auf eine wahrscheinliche Fortsetzung nach oben hin, wobei Smart Money möglicherweise akkumuliert, nachdem eine Liquiditätsabholung erfolgt ist. Warte immer auf Bestätigung—geh nicht aus FOMO beim ersten Spike rein!
📊 Hol dir eine detaillierte kostenlose Analyse zu jeder Coin auf jedem Timeframe, den du willst. Probier Finora AI - Your Trade Buddy kostenlos → tinyurl.com/FinoraBot
#MAGMA
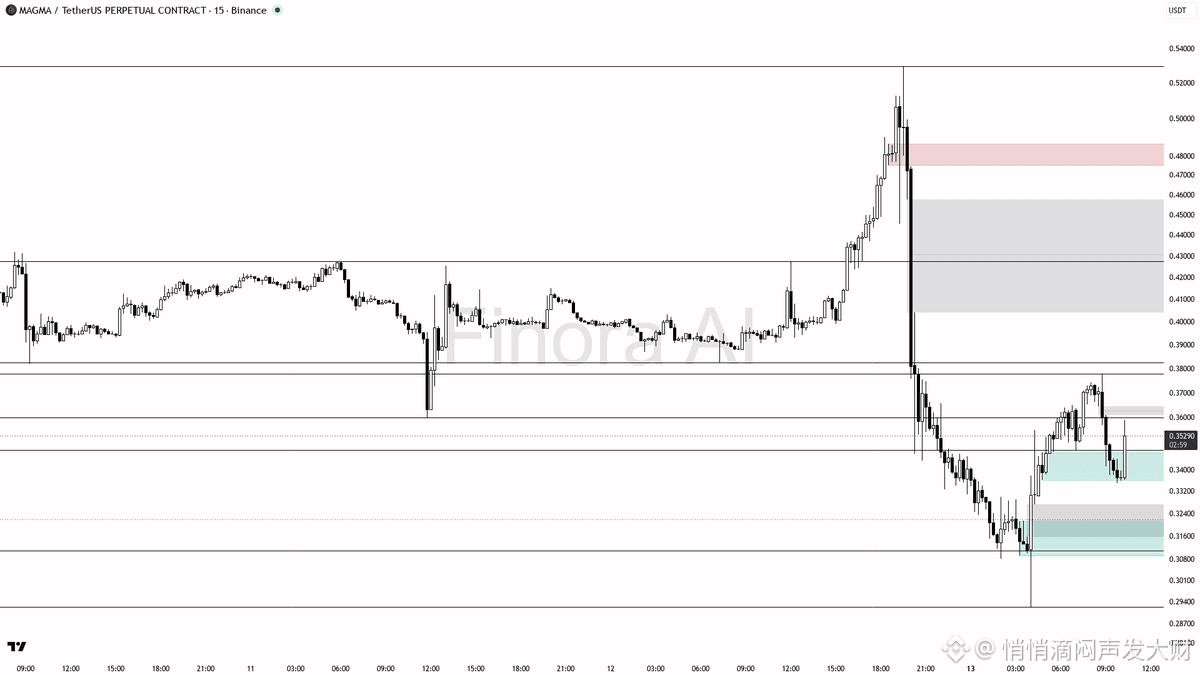
111
·
--
$NEIRO
$NEIRO 4h Update | finorabot.com
- Aufgrund der starken bärischen Struktur und der Häufung bärischer Indikatoren ist meine Hauptannahme weiteres Abwärtspotenzial. Da der Kurs jedoch derzeit nach einem starken Rückgang an einem lokalen Support reagiert, ist kurzfristig ein Bounce Richtung 0.00006150–0.00006300 möglich, falls ein Umkehrmuster bestätigt.
- Für einen Long-Trade: Warte auf eindeutige Umkehrsignale auf 15m–1h, z. B. eine Pin Bar oder ein bullishes Engulfing oberhalb von 0.00006078. Der Einstieg könnte bei ca. 0.00006080 liegen, mit dem ersten Ziel bei 0.00006150 und dem nächsten bei 0.00006300. Der Stop-Loss sollte unter dem jüngsten Swing-Low liegen (ca. 0.00005956).
- Für einen Short-Trade: Wenn der Kurs 0.00005900 verliert und starke bärische Kerzen entstehen, gehe bei einem Retest dieses Levels als Widerstand short und ziele auf 0.00005700 sowie anschließend 0.00005600. Der Stop-Loss sollte oberhalb des Swing-High des Breakdown-Moves liegen.
- Die Richtung würde erst dann auf bullisch kippen, wenn der Kurs 0.00006300–0.00006412 zurückerobern kann – mit starkem Volumen und einer bullischen Struktur oberhalb dieser FVG-Lieferzonen.
📊 Analysiere jede Crypto, jeden Timeframe — sofort.
Nutze Finora AI kostenlos → tinyurl.com/FinoraBot
#NEIRO
{future}(NEIROUSDT)
$NEIRO
$NEIRO 4h Update | finorabot.com
- Aufgrund der starken bärischen Struktur und der Häufung bärischer Indikatoren ist meine Hauptannahme weiteres Abwärtspotenzial. Da der Kurs jedoch derzeit nach einem starken Rückgang an einem lokalen Support reagiert, ist kurzfristig ein Bounce Richtung 0.00006150–0.00006300 möglich, falls ein Umkehrmuster bestätigt.
- Für einen Long-Trade: Warte auf eindeutige Umkehrsignale auf 15m–1h, z. B. eine Pin Bar oder ein bullishes Engulfing oberhalb von 0.00006078. Der Einstieg könnte bei ca. 0.00006080 liegen, mit dem ersten Ziel bei 0.00006150 und dem nächsten bei 0.00006300. Der Stop-Loss sollte unter dem jüngsten Swing-Low liegen (ca. 0.00005956).
- Für einen Short-Trade: Wenn der Kurs 0.00005900 verliert und starke bärische Kerzen entstehen, gehe bei einem Retest dieses Levels als Widerstand short und ziele auf 0.00005700 sowie anschließend 0.00005600. Der Stop-Loss sollte oberhalb des Swing-High des Breakdown-Moves liegen.
- Die Richtung würde erst dann auf bullisch kippen, wenn der Kurs 0.00006300–0.00006412 zurückerobern kann – mit starkem Volumen und einer bullischen Struktur oberhalb dieser FVG-Lieferzonen.
📊 Analysiere jede Crypto, jeden Timeframe — sofort.
Nutze Finora AI kostenlos → tinyurl.com/FinoraBot
#NEIRO
$NEIRO 4h Update | finorabot.com
- Aufgrund der starken bärischen Struktur und der Häufung bärischer Indikatoren ist meine Hauptannahme weiteres Abwärtspotenzial. Da der Kurs jedoch derzeit nach einem starken Rückgang an einem lokalen Support reagiert, ist kurzfristig ein Bounce Richtung 0.00006150–0.00006300 möglich, falls ein Umkehrmuster bestätigt.
- Für einen Long-Trade: Warte auf eindeutige Umkehrsignale auf 15m–1h, z. B. eine Pin Bar oder ein bullishes Engulfing oberhalb von 0.00006078. Der Einstieg könnte bei ca. 0.00006080 liegen, mit dem ersten Ziel bei 0.00006150 und dem nächsten bei 0.00006300. Der Stop-Loss sollte unter dem jüngsten Swing-Low liegen (ca. 0.00005956).
- Für einen Short-Trade: Wenn der Kurs 0.00005900 verliert und starke bärische Kerzen entstehen, gehe bei einem Retest dieses Levels als Widerstand short und ziele auf 0.00005700 sowie anschließend 0.00005600. Der Stop-Loss sollte oberhalb des Swing-High des Breakdown-Moves liegen.
- Die Richtung würde erst dann auf bullisch kippen, wenn der Kurs 0.00006300–0.00006412 zurückerobern kann – mit starkem Volumen und einer bullischen Struktur oberhalb dieser FVG-Lieferzonen.
📊 Analysiere jede Crypto, jeden Timeframe — sofort.
Nutze Finora AI kostenlos → tinyurl.com/FinoraBot
#NEIRO
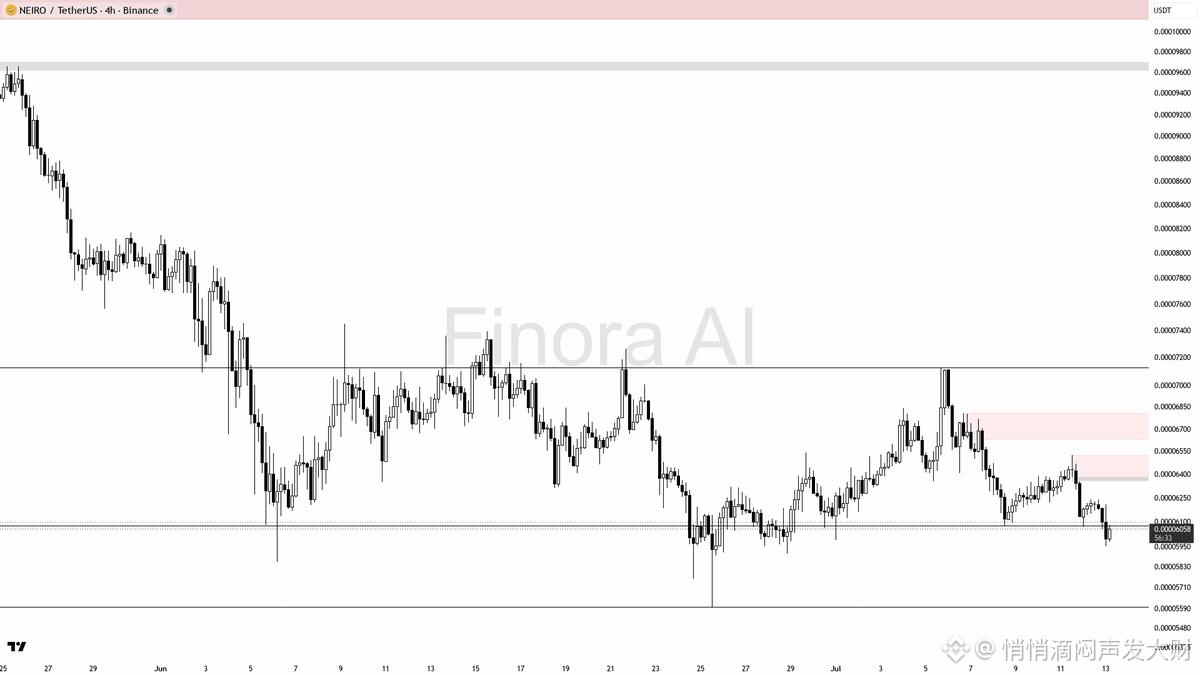
189
Anmelden und weiter Inhalte entdecken
Krypto-Nutzer weltweit auf Binance Square kennenlernen
⚡️ Bleib in Sachen Krypto stets am Puls.
💬 Die weltgrößte Kryptobörse vertraut darauf.
👍 Erhalte verlässliche Einblicke von verifizierten Creators.
E-Mail-Adresse/Telefonnummer
Trendthemen
ZcashETFPostsFirstWeeklyOutflow$93.6M
41,243 Aufrufe
134 Kommentare
ZCASH-ETF-UPDATE
Der Zcash-ETF verzeichnete seit dem Start im August erstmals einen wöchentlichen Nettoabfluss.
Anleger zogen 93,6 Mio. $ ab, da <a>$ZEC </a> in Richtung 1.300 $ fiel. Grayscale’s ZCSH hatte zwei Wochen zuvor 98,2 Mio. $ angezogen, doch laut SoSoValue wurden seit dem 22. September keine täglichen Nettozuflüsse mehr erfasst.
ZEC lag am 3. Oktober bei etwa 1.308 $, ein Rückgang von rund 17,5% für die Woche und etwa 23% im Vergleich zu seinem jüngsten Hoch bei 1.690 $.
$ZEC
Vicky-143
·3 Likes
·4.2k Aufrufe
GreekPoliceBustCryptoScamRingArrest17
100,670 Aufrufe
795 Kommentare
BitcoinRejectedAt$87K
133,799 Aufrufe
192 Kommentare