
RiseFinance
597 Beiträge

RiseFinance
Melden
Nutzer blockieren
1 Following
15 Follower
38 Like gegeben
Beiträge
·
--
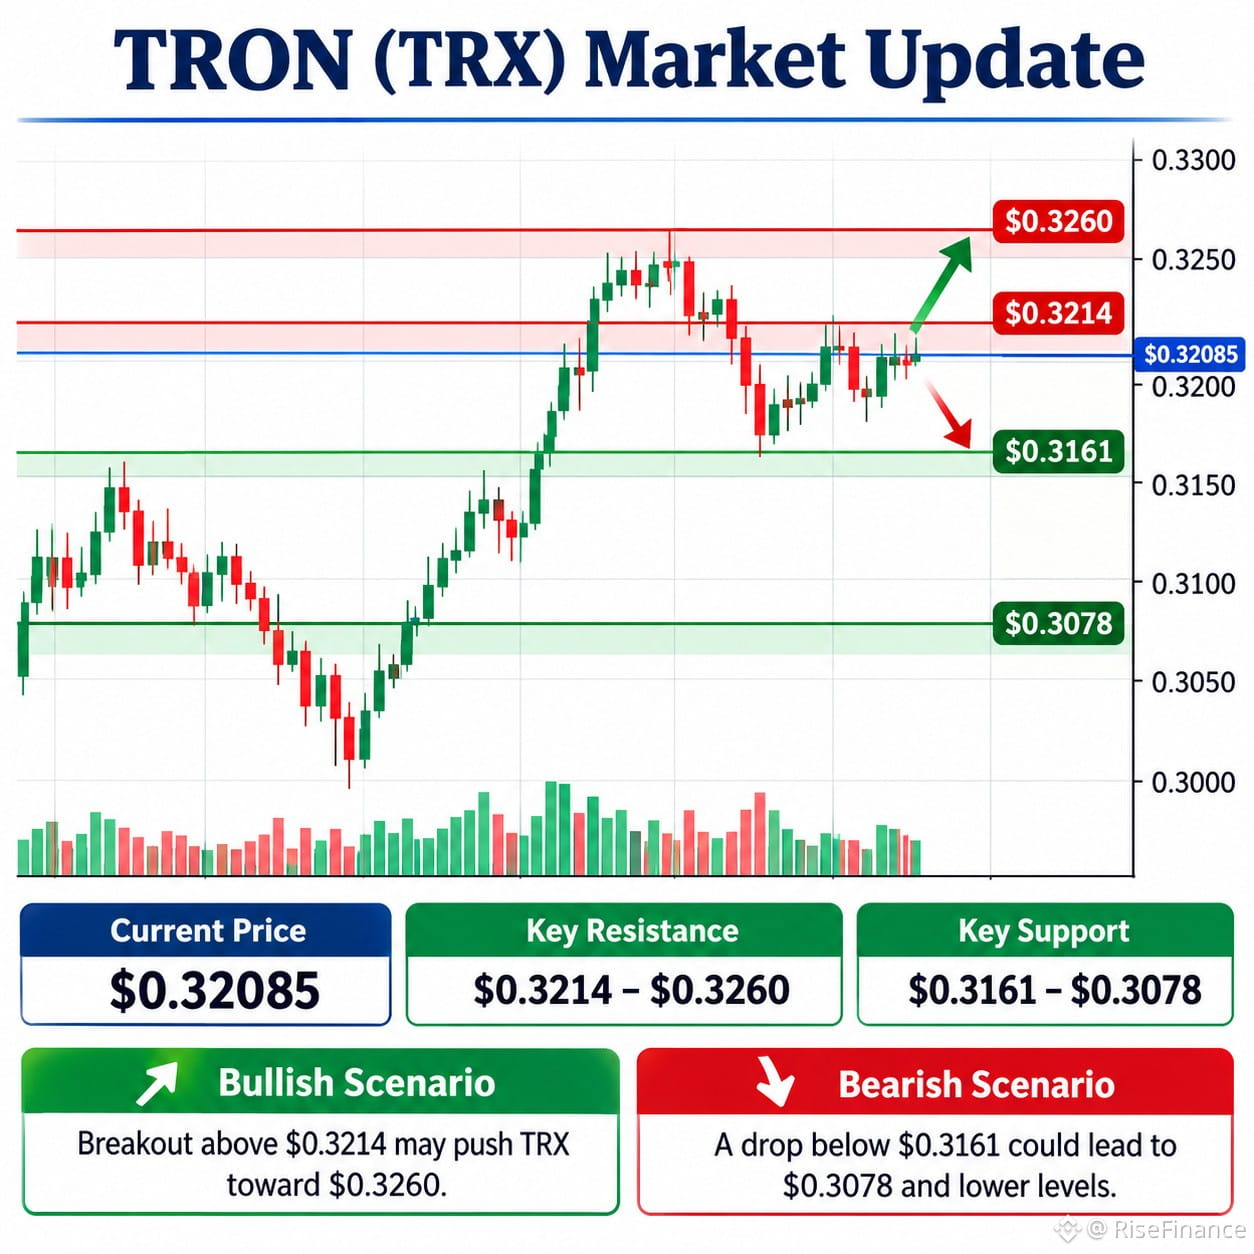
$TRX | TRON-Marktanalyse
Marktüberblick
TRON (TRX) zeigt relative Stärke, während der breitere Kryptowährungsmarkt unter Verkaufsdruck steht.
- Aktueller Preis: $0.32085
- Veränderung innerhalb von 24 Stunden: +1.80%
- Handelsvolumen innerhalb von 24 Stunden: $554.06 Millionen
- Marktkapitalisierung: $30.49 Milliarden
Markttrend: Seitwärts bis bärisch
TRX hat sich in den vergangenen 24 Stunden erholt, doch die übergeordnete kurzfristige Struktur bleibt schwach. Käufer müssen ihre Stärke bestätigen, bevor sich eine nachhaltige bullische Umkehr entwickeln kann.
Wichtige technische Niveaus
- Unterstützung: $0.3161 – $0.3078
- Widerstand: $0.3214 – $0.3260
Bullisches Szenario:
Ein bestätigter Ausbruch über $0.3214, begleitet von einem höheren Handelsvolumen, könnte den Weg in Richtung $0.3260 und möglicherweise zu höheren Niveaus ebnen.
Bärisches Szenario:
Sollte TRX die Marke von $0.3161 nicht halten, könnte der Verkaufsdruck den Preis in Richtung $0.3078 und möglicherweise $0.3000 drücken.
Risikomanagement
Achten Sie auf die Bestätigung eines Ausbruchs, anstatt plötzlichen Kursbewegungen hinterherzulaufen. Verwalten Sie Ihre Positionsgrößen sorgfältig und berücksichtigen Sie vor jeder Handelsentscheidung, bei welchen Niveaus Ihre Annahme widerlegt wäre.
Abschließende Beobachtung
TRX zeigt sich im Vergleich zum breiteren Markt widerstandsfähig, doch der Tagestrend hat eine bullische Umkehr noch nicht bestätigt. Die nächste Bewegung im Bereich von $0.3214 könnte ein nützliches Signal liefern.
Haftungsausschluss: Diese Analyse dient ausschließlich Bildungszwecken und ist keine Finanzberatung. Kryptowährungsmärkte sind mit erheblichen Risiken verbunden. Führen Sie stets eigene Recherchen durch.
#BinanceReopensWithdrawalsForMoreAssets #AppleReportsMixedResults #BinanceHourlyDepositsExceedWithdrawals #USMidtermElections #Nasdaq100EntersCorrection
{spot}(TRXUSDT)
$TRX | TRON-Marktanalyse
Marktüberblick
TRON (TRX) zeigt relative Stärke, während der breitere Kryptowährungsmarkt unter Verkaufsdruck steht.
- Aktueller Preis: $0.32085
- Veränderung innerhalb von 24 Stunden: +1.80%
- Handelsvolumen innerhalb von 24 Stunden: $554.06 Millionen
- Marktkapitalisierung: $30.49 Milliarden
Markttrend: Seitwärts bis bärisch
TRX hat sich in den vergangenen 24 Stunden erholt, doch die übergeordnete kurzfristige Struktur bleibt schwach. Käufer müssen ihre Stärke bestätigen, bevor sich eine nachhaltige bullische Umkehr entwickeln kann.
Wichtige technische Niveaus
- Unterstützung: $0.3161 – $0.3078
- Widerstand: $0.3214 – $0.3260
Bullisches Szenario:
Ein bestätigter Ausbruch über $0.3214, begleitet von einem höheren Handelsvolumen, könnte den Weg in Richtung $0.3260 und möglicherweise zu höheren Niveaus ebnen.
Bärisches Szenario:
Sollte TRX die Marke von $0.3161 nicht halten, könnte der Verkaufsdruck den Preis in Richtung $0.3078 und möglicherweise $0.3000 drücken.
Risikomanagement
Achten Sie auf die Bestätigung eines Ausbruchs, anstatt plötzlichen Kursbewegungen hinterherzulaufen. Verwalten Sie Ihre Positionsgrößen sorgfältig und berücksichtigen Sie vor jeder Handelsentscheidung, bei welchen Niveaus Ihre Annahme widerlegt wäre.
Abschließende Beobachtung
TRX zeigt sich im Vergleich zum breiteren Markt widerstandsfähig, doch der Tagestrend hat eine bullische Umkehr noch nicht bestätigt. Die nächste Bewegung im Bereich von $0.3214 könnte ein nützliches Signal liefern.
Haftungsausschluss: Diese Analyse dient ausschließlich Bildungszwecken und ist keine Finanzberatung. Kryptowährungsmärkte sind mit erheblichen Risiken verbunden. Führen Sie stets eigene Recherchen durch.
#BinanceReopensWithdrawalsForMoreAssets #AppleReportsMixedResults #BinanceHourlyDepositsExceedWithdrawals #USMidtermElections #Nasdaq100EntersCorrection
Marktüberblick
TRON (TRX) zeigt relative Stärke, während der breitere Kryptowährungsmarkt unter Verkaufsdruck steht.
- Aktueller Preis: $0.32085
- Veränderung innerhalb von 24 Stunden: +1.80%
- Handelsvolumen innerhalb von 24 Stunden: $554.06 Millionen
- Marktkapitalisierung: $30.49 Milliarden
Markttrend: Seitwärts bis bärisch
TRX hat sich in den vergangenen 24 Stunden erholt, doch die übergeordnete kurzfristige Struktur bleibt schwach. Käufer müssen ihre Stärke bestätigen, bevor sich eine nachhaltige bullische Umkehr entwickeln kann.
Wichtige technische Niveaus
- Unterstützung: $0.3161 – $0.3078
- Widerstand: $0.3214 – $0.3260
Bullisches Szenario:
Ein bestätigter Ausbruch über $0.3214, begleitet von einem höheren Handelsvolumen, könnte den Weg in Richtung $0.3260 und möglicherweise zu höheren Niveaus ebnen.
Bärisches Szenario:
Sollte TRX die Marke von $0.3161 nicht halten, könnte der Verkaufsdruck den Preis in Richtung $0.3078 und möglicherweise $0.3000 drücken.
Risikomanagement
Achten Sie auf die Bestätigung eines Ausbruchs, anstatt plötzlichen Kursbewegungen hinterherzulaufen. Verwalten Sie Ihre Positionsgrößen sorgfältig und berücksichtigen Sie vor jeder Handelsentscheidung, bei welchen Niveaus Ihre Annahme widerlegt wäre.
Abschließende Beobachtung
TRX zeigt sich im Vergleich zum breiteren Markt widerstandsfähig, doch der Tagestrend hat eine bullische Umkehr noch nicht bestätigt. Die nächste Bewegung im Bereich von $0.3214 könnte ein nützliches Signal liefern.
Haftungsausschluss: Diese Analyse dient ausschließlich Bildungszwecken und ist keine Finanzberatung. Kryptowährungsmärkte sind mit erheblichen Risiken verbunden. Führen Sie stets eigene Recherchen durch.
#BinanceReopensWithdrawalsForMoreAssets #AppleReportsMixedResults #BinanceHourlyDepositsExceedWithdrawals #USMidtermElections #Nasdaq100EntersCorrection
19
·
--
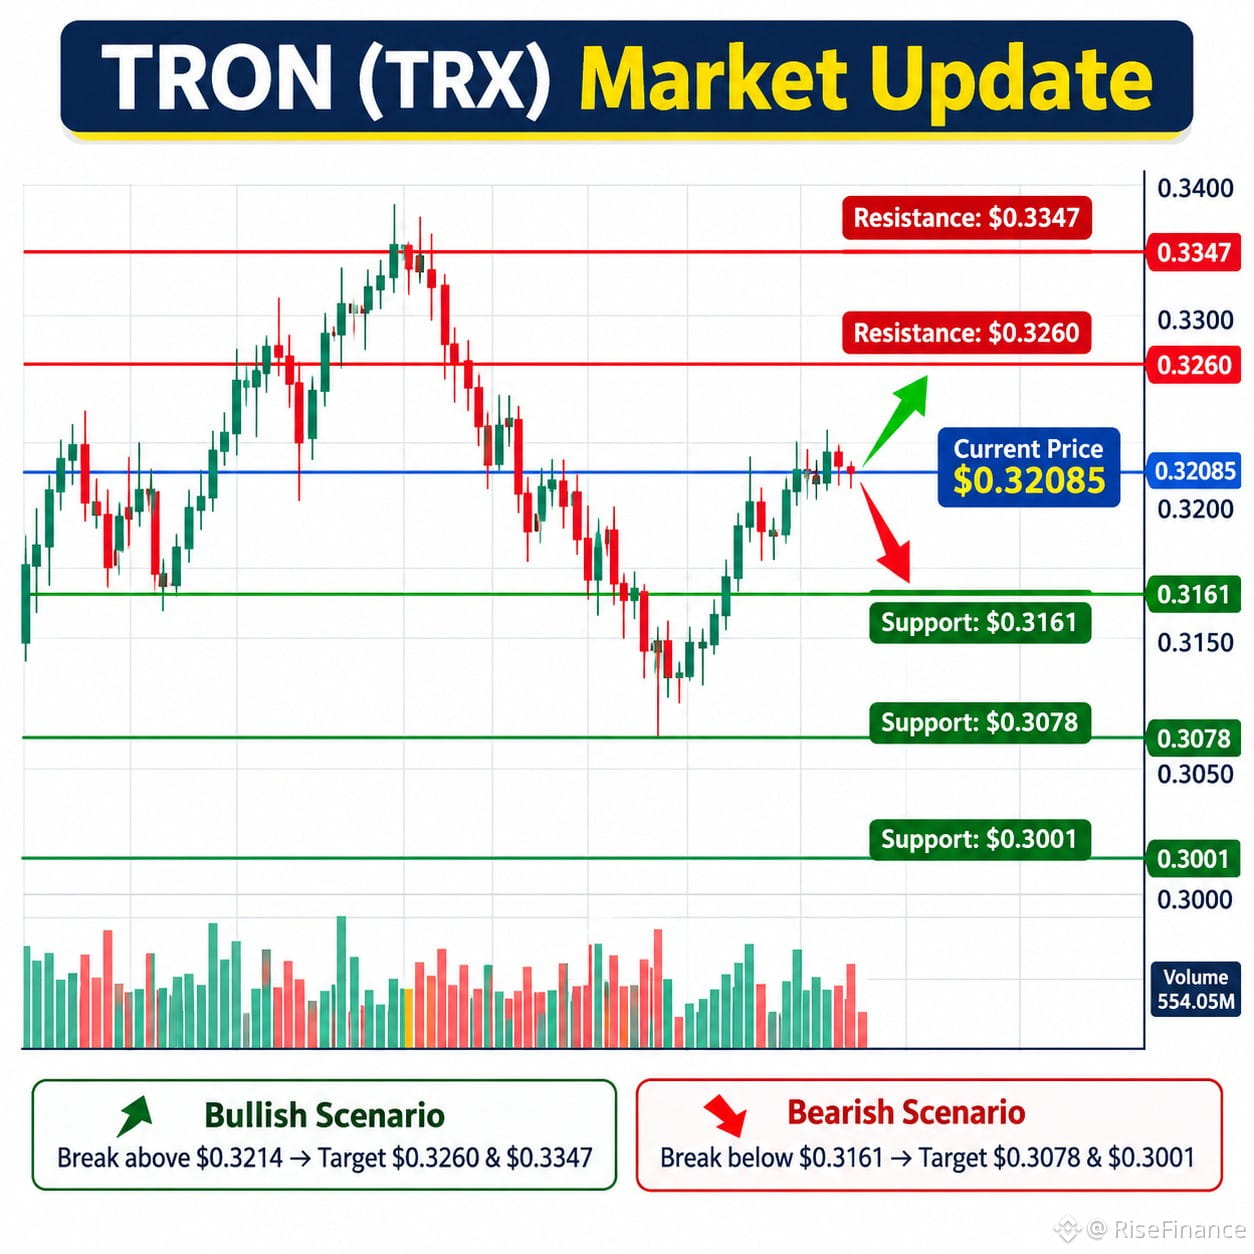
$TRX | TRON-Marktanalyse: Können Käufer den Widerstand durchbrechen?
Marktüberblick
TRON (TRX) zeigt kurzfristige Stärke, obwohl der breitere Kryptowährungsmarkt schwächelt.
- Aktueller Preis: $0.32085
- Veränderung in 24 Std.: +1.80%
- Handelsvolumen in 24 Std.: $554.05 Millionen
- Marktkapitalisierung: $30.48 Milliarden
Markttrend: Abwärtstendenz (kurzfristige Erholung)
TRX versucht, sich zu erholen, doch die übergeordnete tägliche technische Struktur bleibt bearish. Käufer müssen den nahegelegenen Widerstand überwinden, bevor eine stärkere Trendwende in Betracht gezogen werden kann.
Wichtige Unterstützungsniveaus
- $0.3161
- $0.3078
- $0.3001
Wichtige Widerstandsniveaus
- $0.3214
- $0.3260
- $0.3347
Bullishes Szenario
Wenn TRX die Marke von $0.3214 überschreitet und der Kaufdruck anhält, liegen die nächsten möglichen Widerstandsniveaus bei $0.3260 und $0.3347. Ein hohes Handelsvolumen würde helfen, den Ausbruch zu bestätigen.
Bearishes Szenario
Wenn es den Käufern nicht gelingt, $0.3161 zu verteidigen, könnte der Verkaufsdruck den Preis in Richtung $0.3078 und möglicherweise $0.3001 drücken.
Risikomanagement
Achten Sie auf bestätigte Kerzenschlusskurse, anstatt auf vorübergehende Kursbewegungen zu reagieren. Berücksichtigen Sie das Handelsvolumen, die Platzierung von Stop-Loss-Orders und die Positionsgröße. Vermeiden Sie es, plötzlichen Kursanstiegen hinterherzulaufen.
Haftungsausschluss: Diese Analyse dient ausschließlich Bildungszwecken und stellt keine Finanzberatung dar. Kryptowährungsmärkte sind volatil, und jeder Handel ist mit Risiken verbunden.
#BinanceReopensWithdrawalsForMoreAssets #AppleReportsMixedResults #BinanceHourlyDepositsExceedWithdrawals #USMidtermElections #USOctoberNFP-AreRateCutsStillPossible
{future}(TRXUSDT)
$TRX | TRON-Marktanalyse: Können Käufer den Widerstand durchbrechen?
Marktüberblick
TRON (TRX) zeigt kurzfristige Stärke, obwohl der breitere Kryptowährungsmarkt schwächelt.
- Aktueller Preis: $0.32085
- Veränderung in 24 Std.: +1.80%
- Handelsvolumen in 24 Std.: $554.05 Millionen
- Marktkapitalisierung: $30.48 Milliarden
Markttrend: Abwärtstendenz (kurzfristige Erholung)
TRX versucht, sich zu erholen, doch die übergeordnete tägliche technische Struktur bleibt bearish. Käufer müssen den nahegelegenen Widerstand überwinden, bevor eine stärkere Trendwende in Betracht gezogen werden kann.
Wichtige Unterstützungsniveaus
- $0.3161
- $0.3078
- $0.3001
Wichtige Widerstandsniveaus
- $0.3214
- $0.3260
- $0.3347
Bullishes Szenario
Wenn TRX die Marke von $0.3214 überschreitet und der Kaufdruck anhält, liegen die nächsten möglichen Widerstandsniveaus bei $0.3260 und $0.3347. Ein hohes Handelsvolumen würde helfen, den Ausbruch zu bestätigen.
Bearishes Szenario
Wenn es den Käufern nicht gelingt, $0.3161 zu verteidigen, könnte der Verkaufsdruck den Preis in Richtung $0.3078 und möglicherweise $0.3001 drücken.
Risikomanagement
Achten Sie auf bestätigte Kerzenschlusskurse, anstatt auf vorübergehende Kursbewegungen zu reagieren. Berücksichtigen Sie das Handelsvolumen, die Platzierung von Stop-Loss-Orders und die Positionsgröße. Vermeiden Sie es, plötzlichen Kursanstiegen hinterherzulaufen.
Haftungsausschluss: Diese Analyse dient ausschließlich Bildungszwecken und stellt keine Finanzberatung dar. Kryptowährungsmärkte sind volatil, und jeder Handel ist mit Risiken verbunden.
#BinanceReopensWithdrawalsForMoreAssets #AppleReportsMixedResults #BinanceHourlyDepositsExceedWithdrawals #USMidtermElections #USOctoberNFP-AreRateCutsStillPossible
Marktüberblick
TRON (TRX) zeigt kurzfristige Stärke, obwohl der breitere Kryptowährungsmarkt schwächelt.
- Aktueller Preis: $0.32085
- Veränderung in 24 Std.: +1.80%
- Handelsvolumen in 24 Std.: $554.05 Millionen
- Marktkapitalisierung: $30.48 Milliarden
Markttrend: Abwärtstendenz (kurzfristige Erholung)
TRX versucht, sich zu erholen, doch die übergeordnete tägliche technische Struktur bleibt bearish. Käufer müssen den nahegelegenen Widerstand überwinden, bevor eine stärkere Trendwende in Betracht gezogen werden kann.
Wichtige Unterstützungsniveaus
- $0.3161
- $0.3078
- $0.3001
Wichtige Widerstandsniveaus
- $0.3214
- $0.3260
- $0.3347
Bullishes Szenario
Wenn TRX die Marke von $0.3214 überschreitet und der Kaufdruck anhält, liegen die nächsten möglichen Widerstandsniveaus bei $0.3260 und $0.3347. Ein hohes Handelsvolumen würde helfen, den Ausbruch zu bestätigen.
Bearishes Szenario
Wenn es den Käufern nicht gelingt, $0.3161 zu verteidigen, könnte der Verkaufsdruck den Preis in Richtung $0.3078 und möglicherweise $0.3001 drücken.
Risikomanagement
Achten Sie auf bestätigte Kerzenschlusskurse, anstatt auf vorübergehende Kursbewegungen zu reagieren. Berücksichtigen Sie das Handelsvolumen, die Platzierung von Stop-Loss-Orders und die Positionsgröße. Vermeiden Sie es, plötzlichen Kursanstiegen hinterherzulaufen.
Haftungsausschluss: Diese Analyse dient ausschließlich Bildungszwecken und stellt keine Finanzberatung dar. Kryptowährungsmärkte sind volatil, und jeder Handel ist mit Risiken verbunden.
#BinanceReopensWithdrawalsForMoreAssets #AppleReportsMixedResults #BinanceHourlyDepositsExceedWithdrawals #USMidtermElections #USOctoberNFP-AreRateCutsStillPossible
58
·
--
Übersetzung ansehen
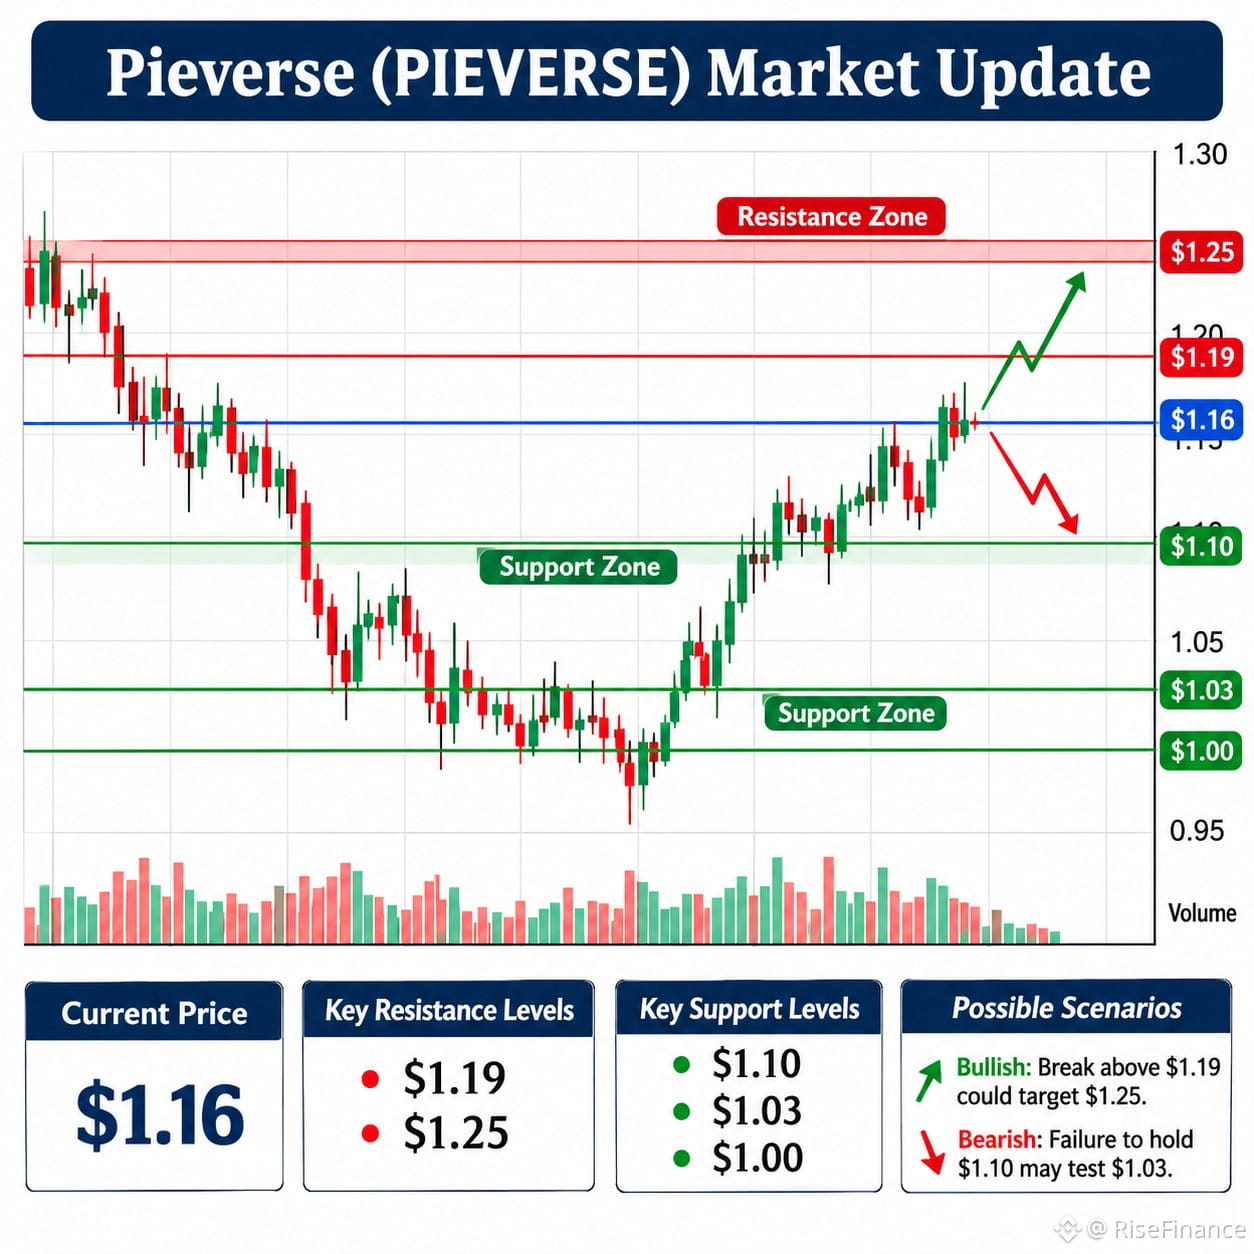
$PIEVERSE | Pieverse Market Analysis
Current Market Overview
Pieverse (PIEVERSE) is attracting attention with a positive short-term price movement and increased trading activity.
- Current Price: Approximately $1.16
- 24H Change: +9.2%
- 24H Trading Volume: Approximately $29.34 million
- Market Capitalization: Approximately $350.3 million
- 24H Price Range: $1.03–$1.19
Market figures are based on CoinMarketCap's latest available snapshot and may change.
Market Trend: Short-Term Bullish, Broader Trend Cautious
PIEVERSE is showing recovery momentum after recent weakness. However, the broader monthly trend remains under pressure, so confirmation is important before considering this a sustained reversal.
Key Support Levels
- $1.10 – Near-term support area
- $1.03 – Recent 24-hour low and important support
- $1.00 – Psychological support level
Key Resistance Levels
- $1.19 – Immediate resistance
- $1.25 – Potential next resistance if momentum continues
Technical levels are approximate areas based on recent price action, not guaranteed turning points.
Bullish Scenario
If buyers maintain momentum and price breaks above $1.19 with strong trading volume, PIEVERSE could attempt a move toward $1.25. A sustained breakout would strengthen the short-term bullish outlook.
Bearish Scenario
If the price fails to overcome resistance, sellers could push it back toward $1.10 and $1.03. A breakdown below $1.03 could expose the psychological $1.00 level.
Risk Management
Avoid chasing sudden price increases. Watch volume and candle-closing confirmation around key levels. Use appropriate position sizing, define invalidation levels and avoid excessive leverage.
Educational Disclaimer: This analysis is for educational purposes only and is not financial advice. Cryptocurrency markets are volatile, and all trading decisions involve risk.
#BinanceReopensWithdrawalsForMoreAssets #AppleReportsMixedResults #BinanceHourlyDepositsExceedWithdrawals #USMidtermElections #USOctoberNFP-AreRateCutsStillPossible
{alpha}(560x0e63b9c287e32a05e6b9ab8ee8df88a2760225a9)
$PIEVERSE | Pieverse Market Analysis
Current Market Overview
Pieverse (PIEVERSE) is attracting attention with a positive short-term price movement and increased trading activity.
- Current Price: Approximately $1.16
- 24H Change: +9.2%
- 24H Trading Volume: Approximately $29.34 million
- Market Capitalization: Approximately $350.3 million
- 24H Price Range: $1.03–$1.19
Market figures are based on CoinMarketCap's latest available snapshot and may change.
Market Trend: Short-Term Bullish, Broader Trend Cautious
PIEVERSE is showing recovery momentum after recent weakness. However, the broader monthly trend remains under pressure, so confirmation is important before considering this a sustained reversal.
Key Support Levels
- $1.10 – Near-term support area
- $1.03 – Recent 24-hour low and important support
- $1.00 – Psychological support level
Key Resistance Levels
- $1.19 – Immediate resistance
- $1.25 – Potential next resistance if momentum continues
Technical levels are approximate areas based on recent price action, not guaranteed turning points.
Bullish Scenario
If buyers maintain momentum and price breaks above $1.19 with strong trading volume, PIEVERSE could attempt a move toward $1.25. A sustained breakout would strengthen the short-term bullish outlook.
Bearish Scenario
If the price fails to overcome resistance, sellers could push it back toward $1.10 and $1.03. A breakdown below $1.03 could expose the psychological $1.00 level.
Risk Management
Avoid chasing sudden price increases. Watch volume and candle-closing confirmation around key levels. Use appropriate position sizing, define invalidation levels and avoid excessive leverage.
Educational Disclaimer: This analysis is for educational purposes only and is not financial advice. Cryptocurrency markets are volatile, and all trading decisions involve risk.
#BinanceReopensWithdrawalsForMoreAssets #AppleReportsMixedResults #BinanceHourlyDepositsExceedWithdrawals #USMidtermElections #USOctoberNFP-AreRateCutsStillPossible
Current Market Overview
Pieverse (PIEVERSE) is attracting attention with a positive short-term price movement and increased trading activity.
- Current Price: Approximately $1.16
- 24H Change: +9.2%
- 24H Trading Volume: Approximately $29.34 million
- Market Capitalization: Approximately $350.3 million
- 24H Price Range: $1.03–$1.19
Market figures are based on CoinMarketCap's latest available snapshot and may change.
Market Trend: Short-Term Bullish, Broader Trend Cautious
PIEVERSE is showing recovery momentum after recent weakness. However, the broader monthly trend remains under pressure, so confirmation is important before considering this a sustained reversal.
Key Support Levels
- $1.10 – Near-term support area
- $1.03 – Recent 24-hour low and important support
- $1.00 – Psychological support level
Key Resistance Levels
- $1.19 – Immediate resistance
- $1.25 – Potential next resistance if momentum continues
Technical levels are approximate areas based on recent price action, not guaranteed turning points.
Bullish Scenario
If buyers maintain momentum and price breaks above $1.19 with strong trading volume, PIEVERSE could attempt a move toward $1.25. A sustained breakout would strengthen the short-term bullish outlook.
Bearish Scenario
If the price fails to overcome resistance, sellers could push it back toward $1.10 and $1.03. A breakdown below $1.03 could expose the psychological $1.00 level.
Risk Management
Avoid chasing sudden price increases. Watch volume and candle-closing confirmation around key levels. Use appropriate position sizing, define invalidation levels and avoid excessive leverage.
Educational Disclaimer: This analysis is for educational purposes only and is not financial advice. Cryptocurrency markets are volatile, and all trading decisions involve risk.
#BinanceReopensWithdrawalsForMoreAssets #AppleReportsMixedResults #BinanceHourlyDepositsExceedWithdrawals #USMidtermElections #USOctoberNFP-AreRateCutsStillPossible
214
·
--
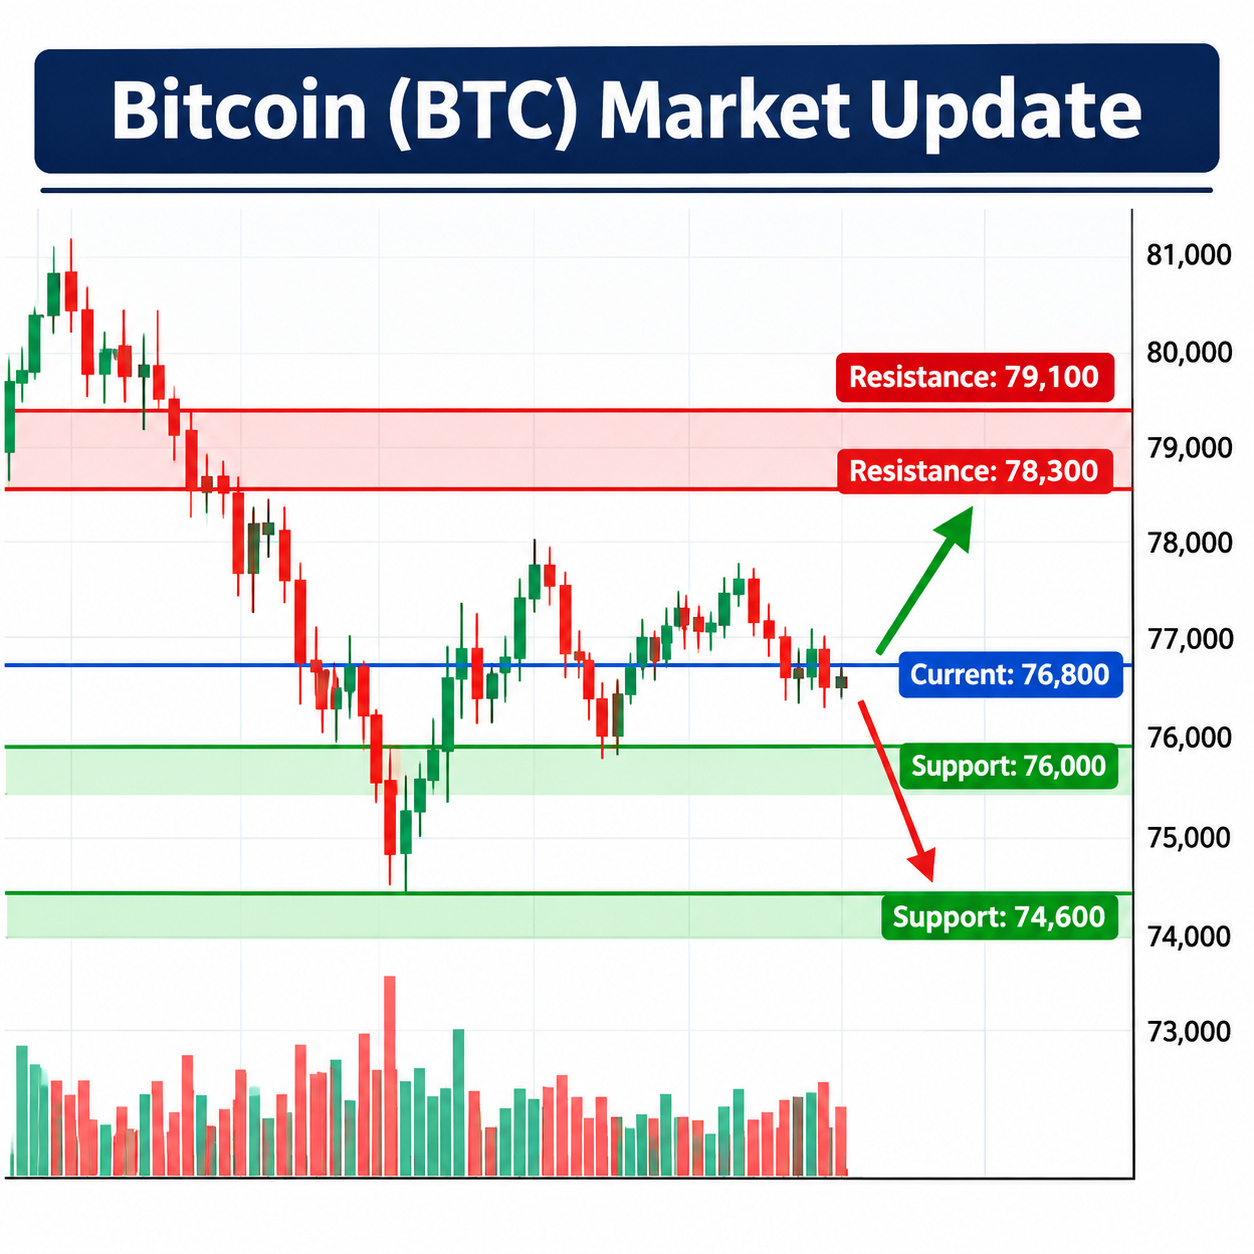
$BTC Bitcoin (BTC) Markt-Update – 3. November 2026
Aktueller Preis: etwa 76.800 $
Markttrend: bärisch 📉
Bitcoin steht erneut unter Verkaufsdruck, nachdem es nicht gelungen ist, die jüngste Erholung aufrechtzuerhalten. BTC wird nahe 76.800 $ gehandelt, wobei die kurzfristige Dynamik weiterhin schwach ist. Käufer versuchen, die Unterstützungszone bei 76.000 $ zu verteidigen, doch die Unsicherheit am Markt und der breitere Verkaufsdruck begrenzen die Aufwärtsdynamik.
Wichtige Unterstützungsniveaus:
- 76.500 $ – unmittelbare Unterstützung
- 76.000 $ – wichtige Unterstützung
- 74.600 $ – nächstes Abwärtsziel
Wichtige Widerstandsniveaus:
- 77.200 $ – erster Widerstand
- 78.300 $ – wichtiger Widerstand
- 79.100 $ – höheres Erholungsziel
Bullishes Szenario: Hält sich BTC über 76.000 $ und erobert die Marke von 77.200 $ zurück, könnten Käufer den Kurs in Richtung 78.300 $ und möglicherweise 79.100 $ treiben.
Bärisches Szenario: Fällt Bitcoin bei hohem Verkaufsvolumen unter 76.000 $, könnte ein weiterer Rückgang in Richtung 74.600 $ möglich werden.
Risikomanagement: Achten Sie auf bestätigte Kerzenschlüsse an wichtigen Niveaus, statt auf plötzliche Kursbewegungen zu reagieren. Vermeiden Sie einen übermäßigen Hebeleinsatz, verwalten Sie Ihre Positionsgrößen sorgfältig und berücksichtigen Sie stets die Marktvolatilität.
Wie geht es für BTC weiter? Die Unterstützungszone bei 76.000 $ bleibt ein wichtiges Niveau, das es zu beobachten gilt. Eine starke Erholung oder ein bestätigter Durchbruch nach unten könnte die nächste kurzfristige Richtung bestimmen.
Haftungsausschluss: Dieser Inhalt dient ausschließlich Bildungs- und Informationszwecken. Er stellt keine Finanzberatung dar. Führen Sie stets Ihre eigenen Recherchen durch.
#BinanceReopensWithdrawalsForMoreAssets #AppleReportsMixedResults #BinanceHourlyDepositsExceedWithdrawals #USMidtermElections #USOctoberNFP-AreRateCutsStillPossible
{spot}(BTCUSDT)
$BTC Bitcoin (BTC) Markt-Update – 3. November 2026
Aktueller Preis: etwa 76.800 $
Markttrend: bärisch 📉
Bitcoin steht erneut unter Verkaufsdruck, nachdem es nicht gelungen ist, die jüngste Erholung aufrechtzuerhalten. BTC wird nahe 76.800 $ gehandelt, wobei die kurzfristige Dynamik weiterhin schwach ist. Käufer versuchen, die Unterstützungszone bei 76.000 $ zu verteidigen, doch die Unsicherheit am Markt und der breitere Verkaufsdruck begrenzen die Aufwärtsdynamik.
Wichtige Unterstützungsniveaus:
- 76.500 $ – unmittelbare Unterstützung
- 76.000 $ – wichtige Unterstützung
- 74.600 $ – nächstes Abwärtsziel
Wichtige Widerstandsniveaus:
- 77.200 $ – erster Widerstand
- 78.300 $ – wichtiger Widerstand
- 79.100 $ – höheres Erholungsziel
Bullishes Szenario: Hält sich BTC über 76.000 $ und erobert die Marke von 77.200 $ zurück, könnten Käufer den Kurs in Richtung 78.300 $ und möglicherweise 79.100 $ treiben.
Bärisches Szenario: Fällt Bitcoin bei hohem Verkaufsvolumen unter 76.000 $, könnte ein weiterer Rückgang in Richtung 74.600 $ möglich werden.
Risikomanagement: Achten Sie auf bestätigte Kerzenschlüsse an wichtigen Niveaus, statt auf plötzliche Kursbewegungen zu reagieren. Vermeiden Sie einen übermäßigen Hebeleinsatz, verwalten Sie Ihre Positionsgrößen sorgfältig und berücksichtigen Sie stets die Marktvolatilität.
Wie geht es für BTC weiter? Die Unterstützungszone bei 76.000 $ bleibt ein wichtiges Niveau, das es zu beobachten gilt. Eine starke Erholung oder ein bestätigter Durchbruch nach unten könnte die nächste kurzfristige Richtung bestimmen.
Haftungsausschluss: Dieser Inhalt dient ausschließlich Bildungs- und Informationszwecken. Er stellt keine Finanzberatung dar. Führen Sie stets Ihre eigenen Recherchen durch.
#BinanceReopensWithdrawalsForMoreAssets #AppleReportsMixedResults #BinanceHourlyDepositsExceedWithdrawals #USMidtermElections #USOctoberNFP-AreRateCutsStillPossible
Aktueller Preis: etwa 76.800 $
Markttrend: bärisch 📉
Bitcoin steht erneut unter Verkaufsdruck, nachdem es nicht gelungen ist, die jüngste Erholung aufrechtzuerhalten. BTC wird nahe 76.800 $ gehandelt, wobei die kurzfristige Dynamik weiterhin schwach ist. Käufer versuchen, die Unterstützungszone bei 76.000 $ zu verteidigen, doch die Unsicherheit am Markt und der breitere Verkaufsdruck begrenzen die Aufwärtsdynamik.
Wichtige Unterstützungsniveaus:
- 76.500 $ – unmittelbare Unterstützung
- 76.000 $ – wichtige Unterstützung
- 74.600 $ – nächstes Abwärtsziel
Wichtige Widerstandsniveaus:
- 77.200 $ – erster Widerstand
- 78.300 $ – wichtiger Widerstand
- 79.100 $ – höheres Erholungsziel
Bullishes Szenario: Hält sich BTC über 76.000 $ und erobert die Marke von 77.200 $ zurück, könnten Käufer den Kurs in Richtung 78.300 $ und möglicherweise 79.100 $ treiben.
Bärisches Szenario: Fällt Bitcoin bei hohem Verkaufsvolumen unter 76.000 $, könnte ein weiterer Rückgang in Richtung 74.600 $ möglich werden.
Risikomanagement: Achten Sie auf bestätigte Kerzenschlüsse an wichtigen Niveaus, statt auf plötzliche Kursbewegungen zu reagieren. Vermeiden Sie einen übermäßigen Hebeleinsatz, verwalten Sie Ihre Positionsgrößen sorgfältig und berücksichtigen Sie stets die Marktvolatilität.
Wie geht es für BTC weiter? Die Unterstützungszone bei 76.000 $ bleibt ein wichtiges Niveau, das es zu beobachten gilt. Eine starke Erholung oder ein bestätigter Durchbruch nach unten könnte die nächste kurzfristige Richtung bestimmen.
Haftungsausschluss: Dieser Inhalt dient ausschließlich Bildungs- und Informationszwecken. Er stellt keine Finanzberatung dar. Führen Sie stets Ihre eigenen Recherchen durch.
#BinanceReopensWithdrawalsForMoreAssets #AppleReportsMixedResults #BinanceHourlyDepositsExceedWithdrawals #USMidtermElections #USOctoberNFP-AreRateCutsStillPossible
64
·
--
Übersetzung ansehen
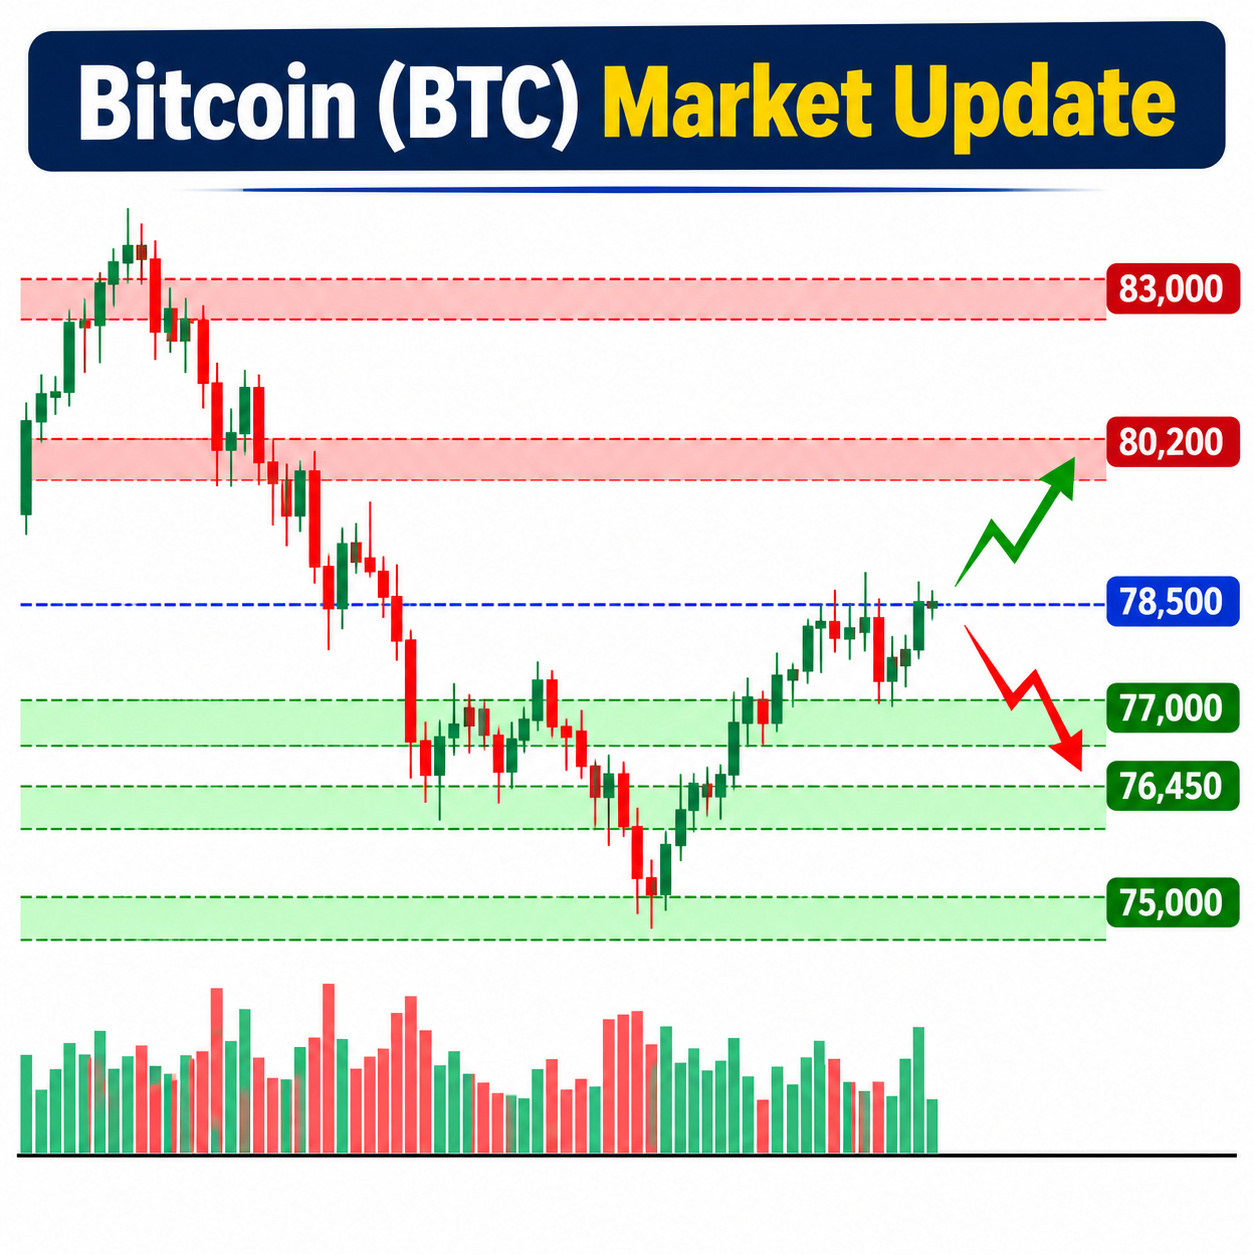
$BTC Bitcoin (BTC) Market Analysis | November 3, 2026
Current Price: Around $77,750
Market Trend: Bitcoin is showing a short-term recovery, but the overall market structure remains cautious and slightly bearish. BTC is trading below the important $80,000–$80,200 resistance zone, indicating that buyers still need stronger momentum to confirm a trend reversal.
Key Support Levels:
- $77,000 – Immediate support
- $76,450 – Major support
- $75,000 – Next downside level
Key Resistance Levels:
- $78,500 – Immediate resistance
- $80,200 – Major resistance
- $83,000 – Higher resistance
Bullish Scenario: If BTC holds above $77,000 and breaks through $78,500, buyers could push the price toward $80,200. A strong breakout above $80,200 may open the way toward $83,000.
Bearish Scenario: If Bitcoin fails to maintain support around $77,000, selling pressure could increase. A breakdown below $76,450 may expose the $75,000 level.
Risk Management: Watch daily candle closes, trading volume, and market momentum before confirming a breakout. Avoid excessive leverage and always use proper stop-loss levels.
Educational Disclaimer: This analysis is for educational purposes only and should not be considered financial advice. Always do your own research before making trading decisions.
#BinanceWithdrawalScamWarning #USMidtermElections #USOctoberNFP-AreRateCutsStillPossible #AppleEarningsAhead-CanStockHitNewHigh #Verify1to1BinanceReserves
{spot}(BTCUSDT)
$BTC Bitcoin (BTC) Market Analysis | November 3, 2026
Current Price: Around $77,750
Market Trend: Bitcoin is showing a short-term recovery, but the overall market structure remains cautious and slightly bearish. BTC is trading below the important $80,000–$80,200 resistance zone, indicating that buyers still need stronger momentum to confirm a trend reversal.
Key Support Levels:
- $77,000 – Immediate support
- $76,450 – Major support
- $75,000 – Next downside level
Key Resistance Levels:
- $78,500 – Immediate resistance
- $80,200 – Major resistance
- $83,000 – Higher resistance
Bullish Scenario: If BTC holds above $77,000 and breaks through $78,500, buyers could push the price toward $80,200. A strong breakout above $80,200 may open the way toward $83,000.
Bearish Scenario: If Bitcoin fails to maintain support around $77,000, selling pressure could increase. A breakdown below $76,450 may expose the $75,000 level.
Risk Management: Watch daily candle closes, trading volume, and market momentum before confirming a breakout. Avoid excessive leverage and always use proper stop-loss levels.
Educational Disclaimer: This analysis is for educational purposes only and should not be considered financial advice. Always do your own research before making trading decisions.
#BinanceWithdrawalScamWarning #USMidtermElections #USOctoberNFP-AreRateCutsStillPossible #AppleEarningsAhead-CanStockHitNewHigh #Verify1to1BinanceReserves
Current Price: Around $77,750
Market Trend: Bitcoin is showing a short-term recovery, but the overall market structure remains cautious and slightly bearish. BTC is trading below the important $80,000–$80,200 resistance zone, indicating that buyers still need stronger momentum to confirm a trend reversal.
Key Support Levels:
- $77,000 – Immediate support
- $76,450 – Major support
- $75,000 – Next downside level
Key Resistance Levels:
- $78,500 – Immediate resistance
- $80,200 – Major resistance
- $83,000 – Higher resistance
Bullish Scenario: If BTC holds above $77,000 and breaks through $78,500, buyers could push the price toward $80,200. A strong breakout above $80,200 may open the way toward $83,000.
Bearish Scenario: If Bitcoin fails to maintain support around $77,000, selling pressure could increase. A breakdown below $76,450 may expose the $75,000 level.
Risk Management: Watch daily candle closes, trading volume, and market momentum before confirming a breakout. Avoid excessive leverage and always use proper stop-loss levels.
Educational Disclaimer: This analysis is for educational purposes only and should not be considered financial advice. Always do your own research before making trading decisions.
#BinanceWithdrawalScamWarning #USMidtermElections #USOctoberNFP-AreRateCutsStillPossible #AppleEarningsAhead-CanStockHitNewHigh #Verify1to1BinanceReserves
3
53
·
--
Übersetzung ansehen
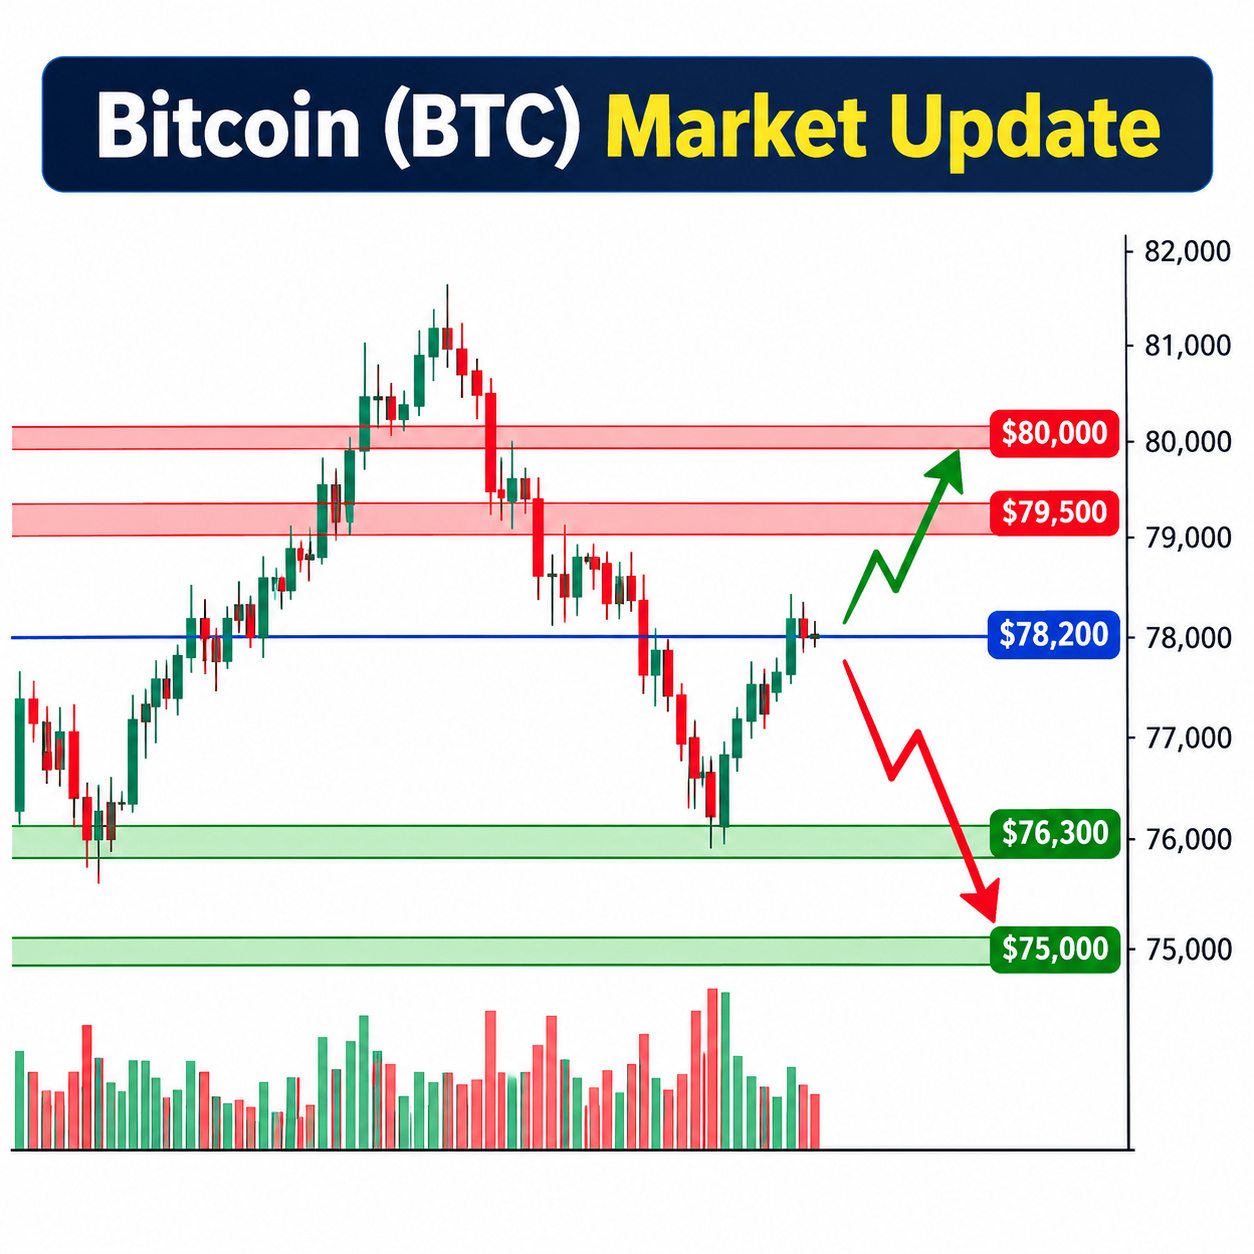
$BTC Bitcoin (BTC) Market Analysis – November 2, 2026
Current Price: Around $78,200
Market Trend: Bitcoin is showing a short-term recovery after falling to a six-week low near $76,200. However, the broader short-term structure remains cautious and bearish. Buyers are attempting to regain momentum, but strong resistance remains overhead.
Key Support Levels:
- $77,000 – Immediate support
- $76,300 – Major support
- $75,000 – Next downside target
Key Resistance Levels:
- $78,600 – Immediate resistance
- $79,500 – Important resistance
- $80,000 – Major breakout level
Bullish Scenario: If BTC holds above $77,000 and breaks through $79,500–$80,000 with strong buying volume, bullish momentum could strengthen, potentially opening the way toward $81,450.
Bearish Scenario: If Bitcoin fails to break resistance and drops below $76,300, selling pressure could increase, bringing the $75,000 support zone into focus.
Risk Management: Watch trading volume and daily candle closes before interpreting a breakout. Avoid emotional decisions, manage exposure carefully, and remember that false breakouts can occur in volatile markets.
Key Takeaway: Bitcoin is attempting to recover, but confirmation above $80,000 is important for a stronger bullish outlook. Until then, cautious trading and close monitoring of support levels remain essential.
Disclaimer: This analysis is for educational and informational purposes only. It is not financial advice. Always do your own research and understand the risks before making any trading decisions.
#BinanceWithdrawalScamWarning #USMidtermElections #USOctoberNFP-AreRateCutsStillPossible #AppleEarningsAhead-CanStockHitNewHigh #Verify1to1BinanceReserves
{spot}(BTCUSDT)
$BTC Bitcoin (BTC) Market Analysis – November 2, 2026
Current Price: Around $78,200
Market Trend: Bitcoin is showing a short-term recovery after falling to a six-week low near $76,200. However, the broader short-term structure remains cautious and bearish. Buyers are attempting to regain momentum, but strong resistance remains overhead.
Key Support Levels:
- $77,000 – Immediate support
- $76,300 – Major support
- $75,000 – Next downside target
Key Resistance Levels:
- $78,600 – Immediate resistance
- $79,500 – Important resistance
- $80,000 – Major breakout level
Bullish Scenario: If BTC holds above $77,000 and breaks through $79,500–$80,000 with strong buying volume, bullish momentum could strengthen, potentially opening the way toward $81,450.
Bearish Scenario: If Bitcoin fails to break resistance and drops below $76,300, selling pressure could increase, bringing the $75,000 support zone into focus.
Risk Management: Watch trading volume and daily candle closes before interpreting a breakout. Avoid emotional decisions, manage exposure carefully, and remember that false breakouts can occur in volatile markets.
Key Takeaway: Bitcoin is attempting to recover, but confirmation above $80,000 is important for a stronger bullish outlook. Until then, cautious trading and close monitoring of support levels remain essential.
Disclaimer: This analysis is for educational and informational purposes only. It is not financial advice. Always do your own research and understand the risks before making any trading decisions.
#BinanceWithdrawalScamWarning #USMidtermElections #USOctoberNFP-AreRateCutsStillPossible #AppleEarningsAhead-CanStockHitNewHigh #Verify1to1BinanceReserves
Current Price: Around $78,200
Market Trend: Bitcoin is showing a short-term recovery after falling to a six-week low near $76,200. However, the broader short-term structure remains cautious and bearish. Buyers are attempting to regain momentum, but strong resistance remains overhead.
Key Support Levels:
- $77,000 – Immediate support
- $76,300 – Major support
- $75,000 – Next downside target
Key Resistance Levels:
- $78,600 – Immediate resistance
- $79,500 – Important resistance
- $80,000 – Major breakout level
Bullish Scenario: If BTC holds above $77,000 and breaks through $79,500–$80,000 with strong buying volume, bullish momentum could strengthen, potentially opening the way toward $81,450.
Bearish Scenario: If Bitcoin fails to break resistance and drops below $76,300, selling pressure could increase, bringing the $75,000 support zone into focus.
Risk Management: Watch trading volume and daily candle closes before interpreting a breakout. Avoid emotional decisions, manage exposure carefully, and remember that false breakouts can occur in volatile markets.
Key Takeaway: Bitcoin is attempting to recover, but confirmation above $80,000 is important for a stronger bullish outlook. Until then, cautious trading and close monitoring of support levels remain essential.
Disclaimer: This analysis is for educational and informational purposes only. It is not financial advice. Always do your own research and understand the risks before making any trading decisions.
#BinanceWithdrawalScamWarning #USMidtermElections #USOctoberNFP-AreRateCutsStillPossible #AppleEarningsAhead-CanStockHitNewHigh #Verify1to1BinanceReserves
36
·
--
Übersetzung ansehen
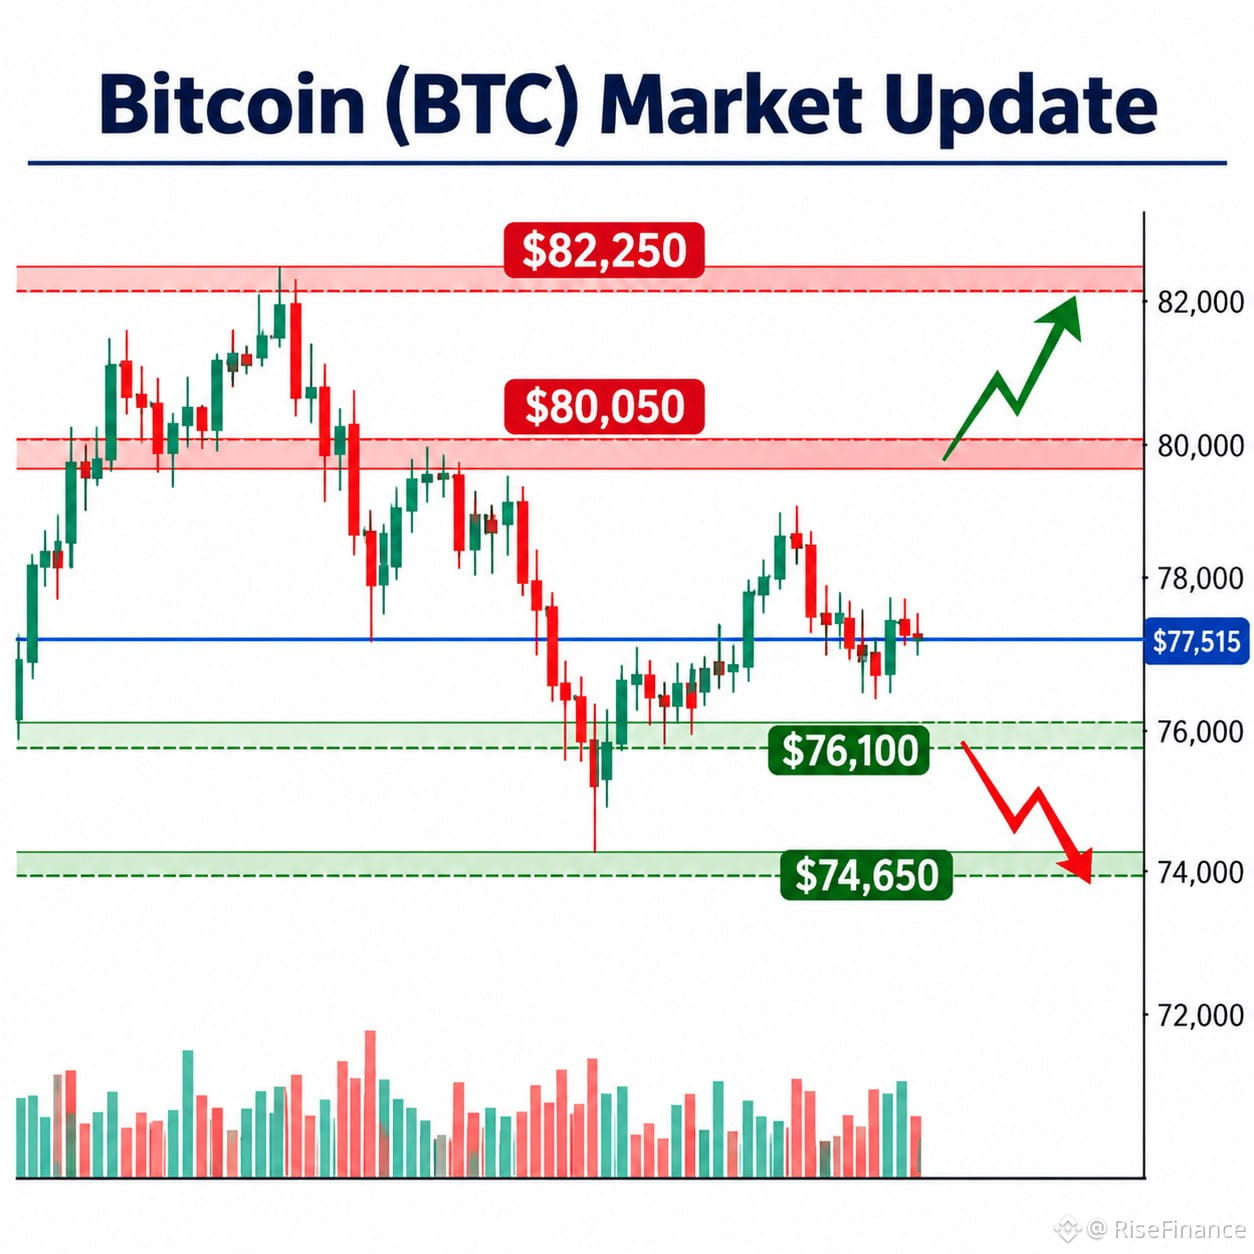
$BTC Bitcoin (BTC) Market Analysis – November 2, 2026
Current BTC Price: Around $77,515
Market Trend: Bitcoin is showing short-term bearish pressure while trading below its 50-day moving average. The market remains cautious, with buyers and sellers competing around important price levels.
Key Support Levels:
- $76,100 – Immediate support
- $74,650 – Next major support
Key Resistance Levels:
- $80,050 – Immediate resistance
- $82,250 – Stronger resistance
Bullish Scenario: If BTC holds above $76,100 and buyers regain momentum, a recovery toward $80,050 could develop. A confirmed breakout above this level may open the way toward $82,250.
Bearish Scenario: If Bitcoin loses the $76,100 support, selling pressure could increase, potentially pushing the price toward $74,650.
Market Outlook: BTC remains under short-term pressure, but the broader market structure still needs confirmation. Traders should watch trading volume and daily candle closes before assuming a trend reversal.
Risk Management: Avoid emotional decisions, use appropriate stop-loss levels, manage position sizes carefully, and wait for confirmation before reacting to breakouts.
Educational Disclaimer: This analysis is for educational purposes only and is not financial advice. Cryptocurrency markets are volatile, so always do your own research.
#BinanceWithdrawalScamWarning #USMidtermElections #USOctoberNFP-AreRateCutsStillPossible #AppleEarningsAhead-CanStockHitNewHigh #Verify1to1BinanceReserves
{spot}(BTCUSDT)
$BTC Bitcoin (BTC) Market Analysis – November 2, 2026
Current BTC Price: Around $77,515
Market Trend: Bitcoin is showing short-term bearish pressure while trading below its 50-day moving average. The market remains cautious, with buyers and sellers competing around important price levels.
Key Support Levels:
- $76,100 – Immediate support
- $74,650 – Next major support
Key Resistance Levels:
- $80,050 – Immediate resistance
- $82,250 – Stronger resistance
Bullish Scenario: If BTC holds above $76,100 and buyers regain momentum, a recovery toward $80,050 could develop. A confirmed breakout above this level may open the way toward $82,250.
Bearish Scenario: If Bitcoin loses the $76,100 support, selling pressure could increase, potentially pushing the price toward $74,650.
Market Outlook: BTC remains under short-term pressure, but the broader market structure still needs confirmation. Traders should watch trading volume and daily candle closes before assuming a trend reversal.
Risk Management: Avoid emotional decisions, use appropriate stop-loss levels, manage position sizes carefully, and wait for confirmation before reacting to breakouts.
Educational Disclaimer: This analysis is for educational purposes only and is not financial advice. Cryptocurrency markets are volatile, so always do your own research.
#BinanceWithdrawalScamWarning #USMidtermElections #USOctoberNFP-AreRateCutsStillPossible #AppleEarningsAhead-CanStockHitNewHigh #Verify1to1BinanceReserves
Current BTC Price: Around $77,515
Market Trend: Bitcoin is showing short-term bearish pressure while trading below its 50-day moving average. The market remains cautious, with buyers and sellers competing around important price levels.
Key Support Levels:
- $76,100 – Immediate support
- $74,650 – Next major support
Key Resistance Levels:
- $80,050 – Immediate resistance
- $82,250 – Stronger resistance
Bullish Scenario: If BTC holds above $76,100 and buyers regain momentum, a recovery toward $80,050 could develop. A confirmed breakout above this level may open the way toward $82,250.
Bearish Scenario: If Bitcoin loses the $76,100 support, selling pressure could increase, potentially pushing the price toward $74,650.
Market Outlook: BTC remains under short-term pressure, but the broader market structure still needs confirmation. Traders should watch trading volume and daily candle closes before assuming a trend reversal.
Risk Management: Avoid emotional decisions, use appropriate stop-loss levels, manage position sizes carefully, and wait for confirmation before reacting to breakouts.
Educational Disclaimer: This analysis is for educational purposes only and is not financial advice. Cryptocurrency markets are volatile, so always do your own research.
#BinanceWithdrawalScamWarning #USMidtermElections #USOctoberNFP-AreRateCutsStillPossible #AppleEarningsAhead-CanStockHitNewHigh #Verify1to1BinanceReserves
51
·
--
Übersetzung ansehen
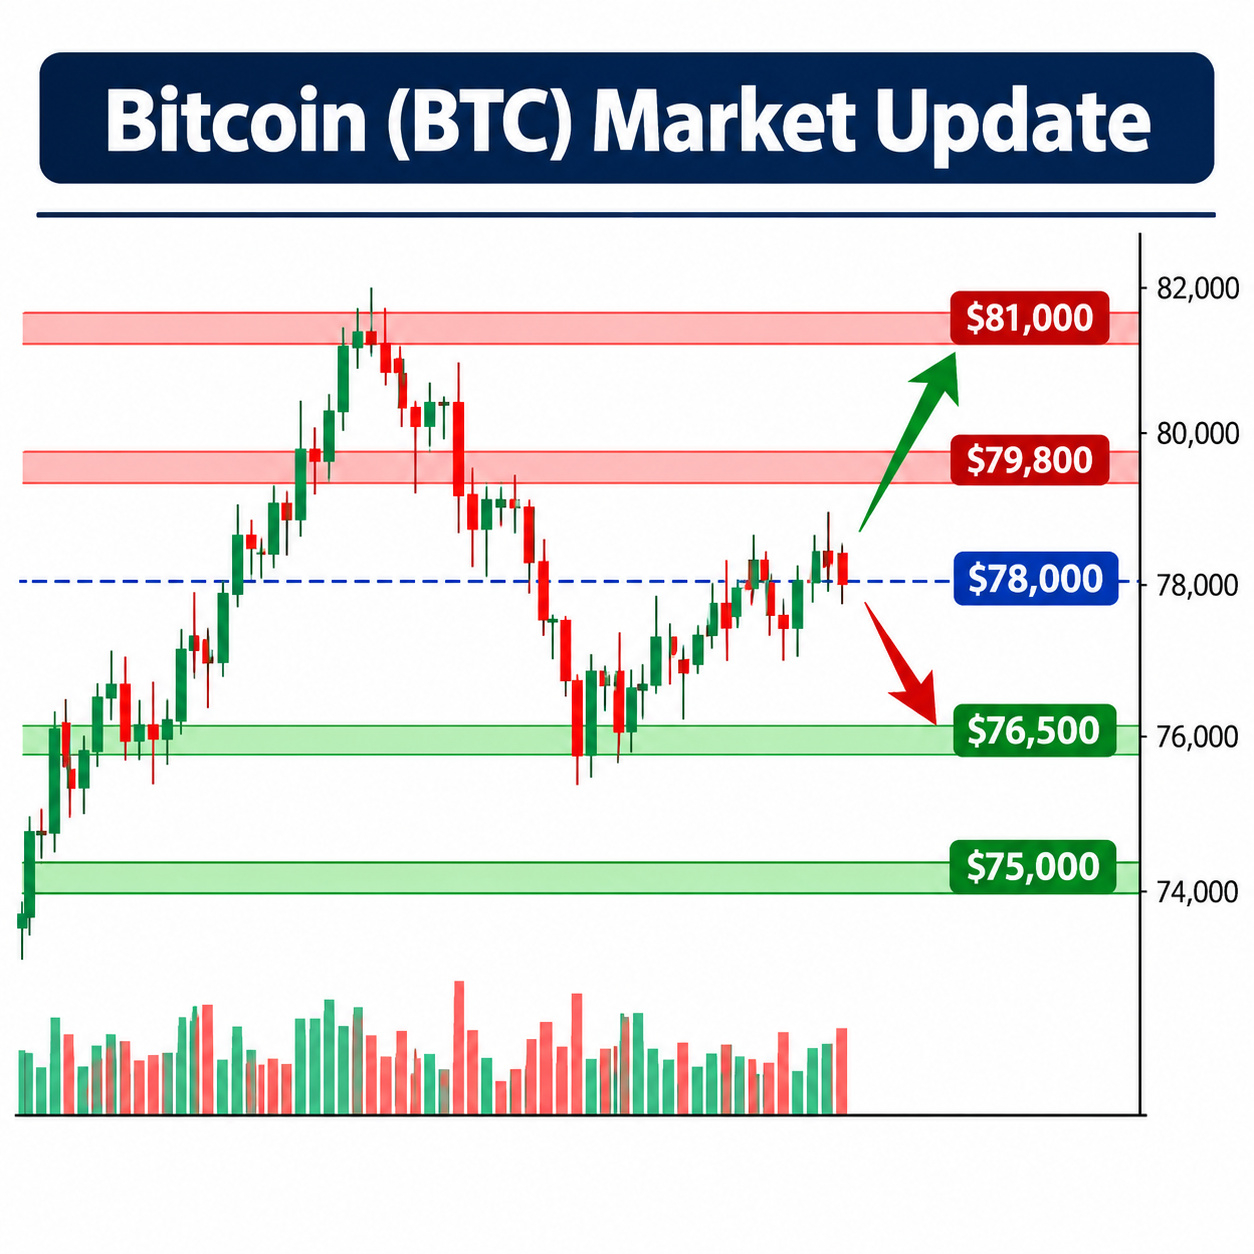
$BTC Bitcoin (BTC) Market Update – November 2, 2026
Bitcoin is currently trading around $78,000, showing a modest recovery after recent selling pressure. However, the overall short-term trend remains cautious as buyers and sellers struggle to establish clear market direction.
1. Market Trend: BTC is consolidating around the $78,000 level. Momentum remains weak, and a stronger recovery is needed to confirm a bullish trend.
2. Key Support Levels:
- $77,800 – Immediate support
- $76,500 – Major support
- $75,000 – Next downside level
3. Key Resistance Levels:
- $78,900 – Immediate resistance
- $79,800 – Strong resistance
- $81,000 – Next upside target
4. Bullish Scenario: If Bitcoin holds above $77,800 and breaks through $78,900 with strong buying volume, the price could move toward $79,800 and potentially $81,000.
5. Bearish Scenario: If BTC fails to maintain support around $77,800, selling pressure could push the price toward $76,500. A further breakdown may expose the $75,000 zone.
6. Risk Management: Watch for confirmed candle closes rather than reacting to sudden price movements. Avoid excessive leverage, manage position sizes carefully, and always consider market volatility.
What do you think? Will Bitcoin break above $79,000 or test lower support levels first?
Disclaimer: This analysis is for educational purposes only and is not financial advice. Cryptocurrency markets involve significant risks.
#BinanceWithdrawalScamWarning #USMidtermElections #USOctoberNFP-AreRateCutsStillPossible #AppleEarningsAhead-CanStockHitNewHigh #Verify1to1BinanceReserves
{spot}(BTCUSDT)
$BTC Bitcoin (BTC) Market Update – November 2, 2026
Bitcoin is currently trading around $78,000, showing a modest recovery after recent selling pressure. However, the overall short-term trend remains cautious as buyers and sellers struggle to establish clear market direction.
1. Market Trend: BTC is consolidating around the $78,000 level. Momentum remains weak, and a stronger recovery is needed to confirm a bullish trend.
2. Key Support Levels:
- $77,800 – Immediate support
- $76,500 – Major support
- $75,000 – Next downside level
3. Key Resistance Levels:
- $78,900 – Immediate resistance
- $79,800 – Strong resistance
- $81,000 – Next upside target
4. Bullish Scenario: If Bitcoin holds above $77,800 and breaks through $78,900 with strong buying volume, the price could move toward $79,800 and potentially $81,000.
5. Bearish Scenario: If BTC fails to maintain support around $77,800, selling pressure could push the price toward $76,500. A further breakdown may expose the $75,000 zone.
6. Risk Management: Watch for confirmed candle closes rather than reacting to sudden price movements. Avoid excessive leverage, manage position sizes carefully, and always consider market volatility.
What do you think? Will Bitcoin break above $79,000 or test lower support levels first?
Disclaimer: This analysis is for educational purposes only and is not financial advice. Cryptocurrency markets involve significant risks.
#BinanceWithdrawalScamWarning #USMidtermElections #USOctoberNFP-AreRateCutsStillPossible #AppleEarningsAhead-CanStockHitNewHigh #Verify1to1BinanceReserves
Bitcoin is currently trading around $78,000, showing a modest recovery after recent selling pressure. However, the overall short-term trend remains cautious as buyers and sellers struggle to establish clear market direction.
1. Market Trend: BTC is consolidating around the $78,000 level. Momentum remains weak, and a stronger recovery is needed to confirm a bullish trend.
2. Key Support Levels:
- $77,800 – Immediate support
- $76,500 – Major support
- $75,000 – Next downside level
3. Key Resistance Levels:
- $78,900 – Immediate resistance
- $79,800 – Strong resistance
- $81,000 – Next upside target
4. Bullish Scenario: If Bitcoin holds above $77,800 and breaks through $78,900 with strong buying volume, the price could move toward $79,800 and potentially $81,000.
5. Bearish Scenario: If BTC fails to maintain support around $77,800, selling pressure could push the price toward $76,500. A further breakdown may expose the $75,000 zone.
6. Risk Management: Watch for confirmed candle closes rather than reacting to sudden price movements. Avoid excessive leverage, manage position sizes carefully, and always consider market volatility.
What do you think? Will Bitcoin break above $79,000 or test lower support levels first?
Disclaimer: This analysis is for educational purposes only and is not financial advice. Cryptocurrency markets involve significant risks.
#BinanceWithdrawalScamWarning #USMidtermElections #USOctoberNFP-AreRateCutsStillPossible #AppleEarningsAhead-CanStockHitNewHigh #Verify1to1BinanceReserves
66
·
--
Übersetzung ansehen
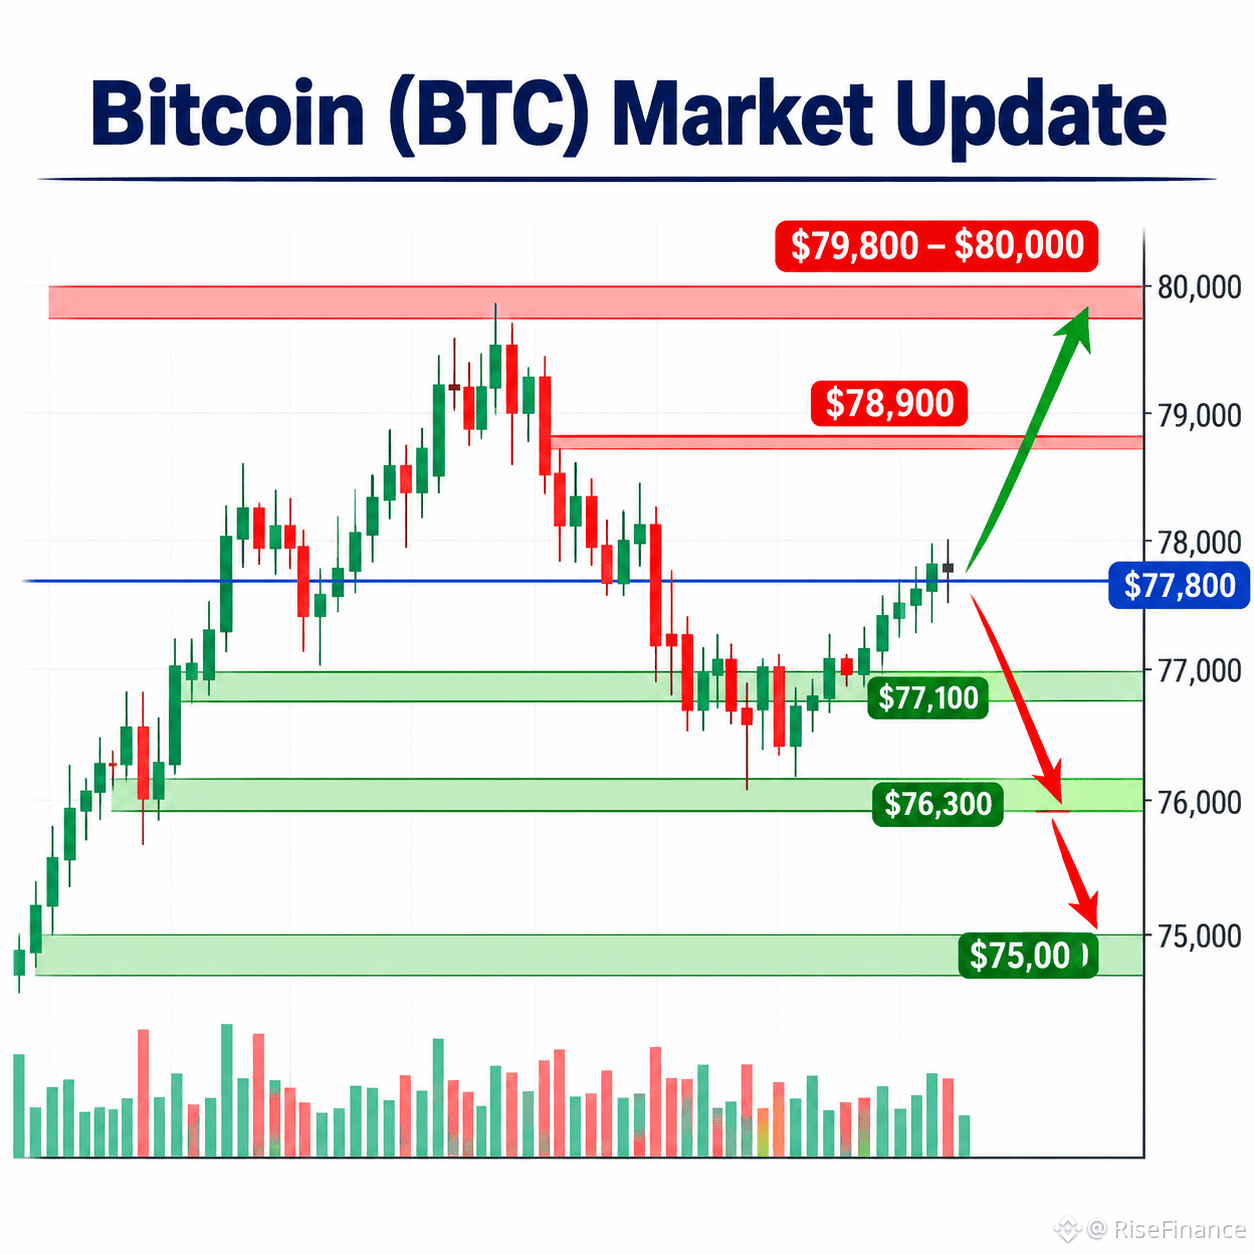
$BTC Bitcoin (BTC) Market Update – November 2, 2026
Current Price: $77,800 (approx.)
1. Market Trend: Bitcoin is showing a short-term recovery after recent selling pressure. However, the broader market remains cautious, with BTC still facing resistance around the $79,000–$80,000 zone. The next move depends on whether buyers can maintain momentum.
2. Key Support Levels:
- $77,100 – Immediate support
- $76,300 – Stronger support
- $75,000 – Major downside level
3. Key Resistance Levels:
- $78,900 – Immediate resistance
- $79,800 – Next resistance
- $80,000 – Important psychological level
4. Bullish Scenario: If BTC breaks above $78,900 and maintains momentum, buyers could push the price toward $79,800–$80,000. A sustained breakout above $80,000 may strengthen the bullish outlook.
5. Bearish Scenario: If BTC fails to break resistance and loses the $77,100 support, selling pressure could increase. A breakdown below $76,300 may open the door toward $75,000.
6. Risk Management: Watch trading volume and candle-closing confirmations before considering either direction. Avoid emotional decisions, use appropriate stop-loss levels, and never risk more than you can afford to lose.
Conclusion: Bitcoin is currently at an important decision zone. A confirmed breakout could support recovery, while a loss of key support may bring another downward move. Patience and careful market observation remain important.
Disclaimer: This content is for educational purposes only and is not financial advice. Always do your own research.
#USMidtermsAhead-WhereWillMarketGo #AppleEarningsAhead-CanStockHitNewHigh #Verify1to1BinanceReserves #BinanceRestores28FiatWithdrawals #HKMALaunchesSAGEAgenticFinanceProject
{spot}(BTCUSDT)
$BTC Bitcoin (BTC) Market Update – November 2, 2026
Current Price: $77,800 (approx.)
1. Market Trend: Bitcoin is showing a short-term recovery after recent selling pressure. However, the broader market remains cautious, with BTC still facing resistance around the $79,000–$80,000 zone. The next move depends on whether buyers can maintain momentum.
2. Key Support Levels:
- $77,100 – Immediate support
- $76,300 – Stronger support
- $75,000 – Major downside level
3. Key Resistance Levels:
- $78,900 – Immediate resistance
- $79,800 – Next resistance
- $80,000 – Important psychological level
4. Bullish Scenario: If BTC breaks above $78,900 and maintains momentum, buyers could push the price toward $79,800–$80,000. A sustained breakout above $80,000 may strengthen the bullish outlook.
5. Bearish Scenario: If BTC fails to break resistance and loses the $77,100 support, selling pressure could increase. A breakdown below $76,300 may open the door toward $75,000.
6. Risk Management: Watch trading volume and candle-closing confirmations before considering either direction. Avoid emotional decisions, use appropriate stop-loss levels, and never risk more than you can afford to lose.
Conclusion: Bitcoin is currently at an important decision zone. A confirmed breakout could support recovery, while a loss of key support may bring another downward move. Patience and careful market observation remain important.
Disclaimer: This content is for educational purposes only and is not financial advice. Always do your own research.
#USMidtermsAhead-WhereWillMarketGo #AppleEarningsAhead-CanStockHitNewHigh #Verify1to1BinanceReserves #BinanceRestores28FiatWithdrawals #HKMALaunchesSAGEAgenticFinanceProject
Current Price: $77,800 (approx.)
1. Market Trend: Bitcoin is showing a short-term recovery after recent selling pressure. However, the broader market remains cautious, with BTC still facing resistance around the $79,000–$80,000 zone. The next move depends on whether buyers can maintain momentum.
2. Key Support Levels:
- $77,100 – Immediate support
- $76,300 – Stronger support
- $75,000 – Major downside level
3. Key Resistance Levels:
- $78,900 – Immediate resistance
- $79,800 – Next resistance
- $80,000 – Important psychological level
4. Bullish Scenario: If BTC breaks above $78,900 and maintains momentum, buyers could push the price toward $79,800–$80,000. A sustained breakout above $80,000 may strengthen the bullish outlook.
5. Bearish Scenario: If BTC fails to break resistance and loses the $77,100 support, selling pressure could increase. A breakdown below $76,300 may open the door toward $75,000.
6. Risk Management: Watch trading volume and candle-closing confirmations before considering either direction. Avoid emotional decisions, use appropriate stop-loss levels, and never risk more than you can afford to lose.
Conclusion: Bitcoin is currently at an important decision zone. A confirmed breakout could support recovery, while a loss of key support may bring another downward move. Patience and careful market observation remain important.
Disclaimer: This content is for educational purposes only and is not financial advice. Always do your own research.
#USMidtermsAhead-WhereWillMarketGo #AppleEarningsAhead-CanStockHitNewHigh #Verify1to1BinanceReserves #BinanceRestores28FiatWithdrawals #HKMALaunchesSAGEAgenticFinanceProject
6
·
--
Übersetzung ansehen
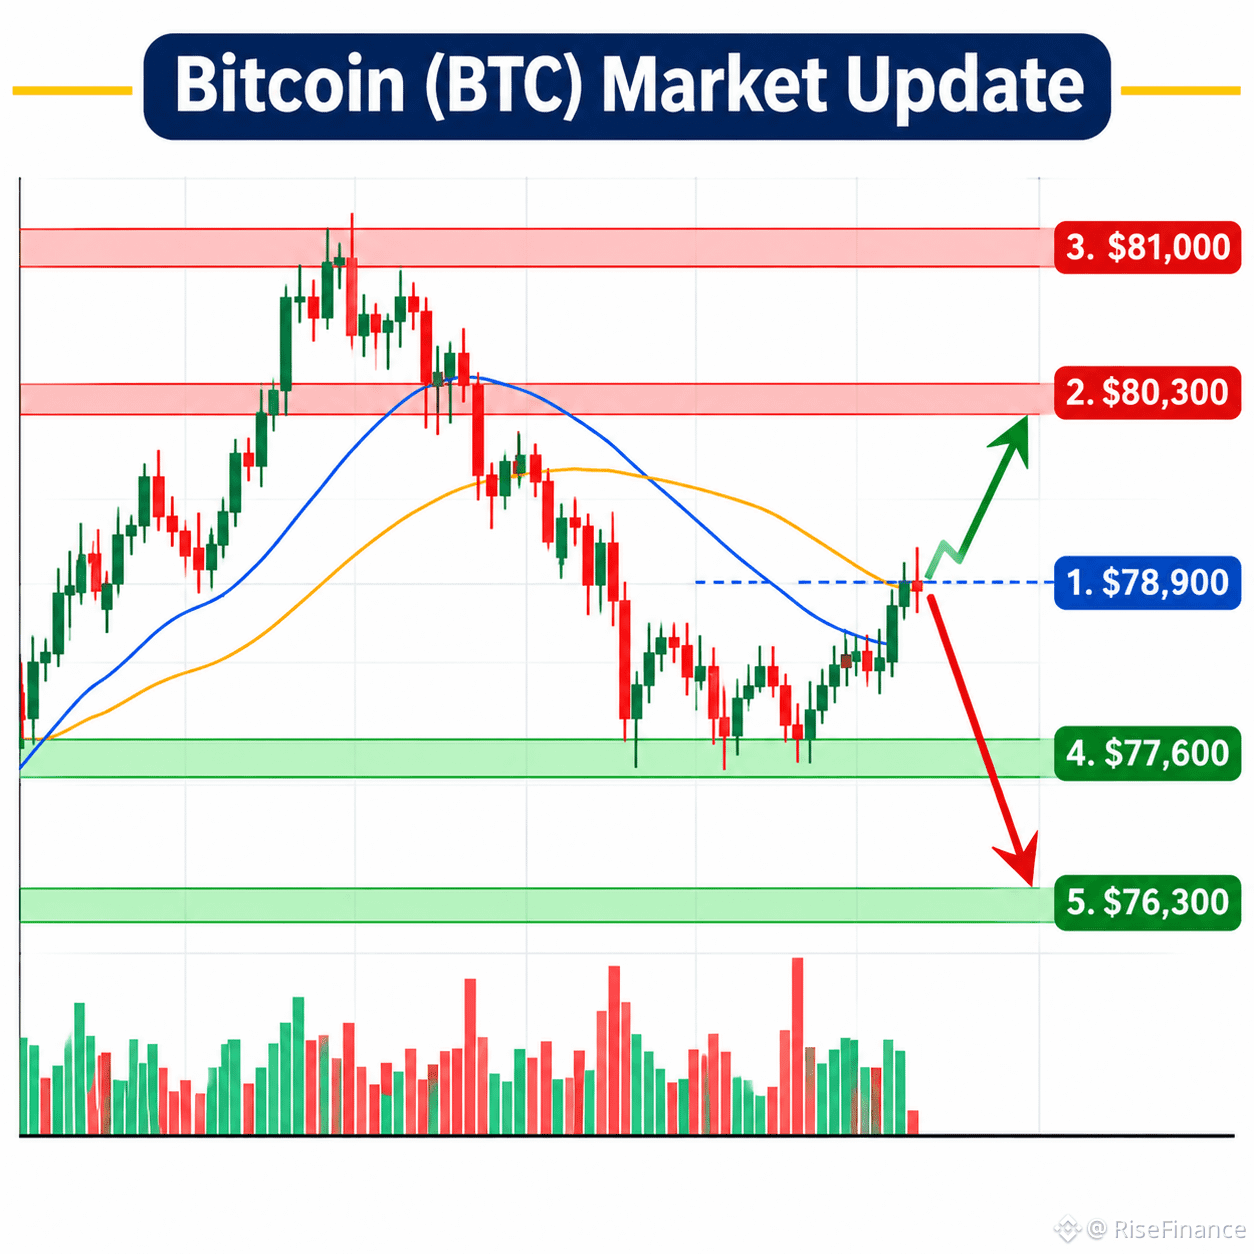
$BTC Bitcoin (BTC) Market Analysis – November 2, 2026
Current Price: Around $78,200
Market Trend: Bitcoin is showing a short-term sideways recovery after recent selling pressure. Buyers are attempting to stabilize the price, but the broader short-term trend remains cautious. BTC is still trading below its important 20-day and 50-day moving averages near $80,300.
Key Support Levels:
- $77,600 – Immediate support
- $76,300 – Major support
- $75,600 – Stronger downside support
Key Resistance Levels:
- $78,900 – Immediate resistance
- $80,300 – Major resistance zone
- $81,000 – Next upside barrier
Bullish Scenario: If BTC holds above $77,600 and breaks through $78,900, buyers could push the price toward $80,300. A strong daily close above this zone may improve bullish momentum.
Bearish Scenario: If Bitcoin loses the $77,600 support, selling pressure could increase toward $76,300 and potentially $75,600.
Risk Management: Watch for confirmed candle closes rather than reacting to sudden price movements. Avoid excessive leverage, manage position sizes carefully, and always consider volatility before making decisions.
Educational Disclaimer: This analysis is for educational purposes only and is not financial advice. Always do your own research (DYOR).
#BinanceRestores28FiatWithdrawals #HKMALaunchesSAGEAgenticFinanceProject #ETHFalls16.1%InOctober #SouthKoreaPlans11%TaxOnUSStockPerpetualFutures #BitcoinClosesAbove50WeekMAFor7thStraightWeek
{spot}(BTCUSDT)
$BTC Bitcoin (BTC) Market Analysis – November 2, 2026
Current Price: Around $78,200
Market Trend: Bitcoin is showing a short-term sideways recovery after recent selling pressure. Buyers are attempting to stabilize the price, but the broader short-term trend remains cautious. BTC is still trading below its important 20-day and 50-day moving averages near $80,300.
Key Support Levels:
- $77,600 – Immediate support
- $76,300 – Major support
- $75,600 – Stronger downside support
Key Resistance Levels:
- $78,900 – Immediate resistance
- $80,300 – Major resistance zone
- $81,000 – Next upside barrier
Bullish Scenario: If BTC holds above $77,600 and breaks through $78,900, buyers could push the price toward $80,300. A strong daily close above this zone may improve bullish momentum.
Bearish Scenario: If Bitcoin loses the $77,600 support, selling pressure could increase toward $76,300 and potentially $75,600.
Risk Management: Watch for confirmed candle closes rather than reacting to sudden price movements. Avoid excessive leverage, manage position sizes carefully, and always consider volatility before making decisions.
Educational Disclaimer: This analysis is for educational purposes only and is not financial advice. Always do your own research (DYOR).
#BinanceRestores28FiatWithdrawals #HKMALaunchesSAGEAgenticFinanceProject #ETHFalls16.1%InOctober #SouthKoreaPlans11%TaxOnUSStockPerpetualFutures #BitcoinClosesAbove50WeekMAFor7thStraightWeek
Current Price: Around $78,200
Market Trend: Bitcoin is showing a short-term sideways recovery after recent selling pressure. Buyers are attempting to stabilize the price, but the broader short-term trend remains cautious. BTC is still trading below its important 20-day and 50-day moving averages near $80,300.
Key Support Levels:
- $77,600 – Immediate support
- $76,300 – Major support
- $75,600 – Stronger downside support
Key Resistance Levels:
- $78,900 – Immediate resistance
- $80,300 – Major resistance zone
- $81,000 – Next upside barrier
Bullish Scenario: If BTC holds above $77,600 and breaks through $78,900, buyers could push the price toward $80,300. A strong daily close above this zone may improve bullish momentum.
Bearish Scenario: If Bitcoin loses the $77,600 support, selling pressure could increase toward $76,300 and potentially $75,600.
Risk Management: Watch for confirmed candle closes rather than reacting to sudden price movements. Avoid excessive leverage, manage position sizes carefully, and always consider volatility before making decisions.
Educational Disclaimer: This analysis is for educational purposes only and is not financial advice. Always do your own research (DYOR).
#BinanceRestores28FiatWithdrawals #HKMALaunchesSAGEAgenticFinanceProject #ETHFalls16.1%InOctober #SouthKoreaPlans11%TaxOnUSStockPerpetualFutures #BitcoinClosesAbove50WeekMAFor7thStraightWeek
9
·
--
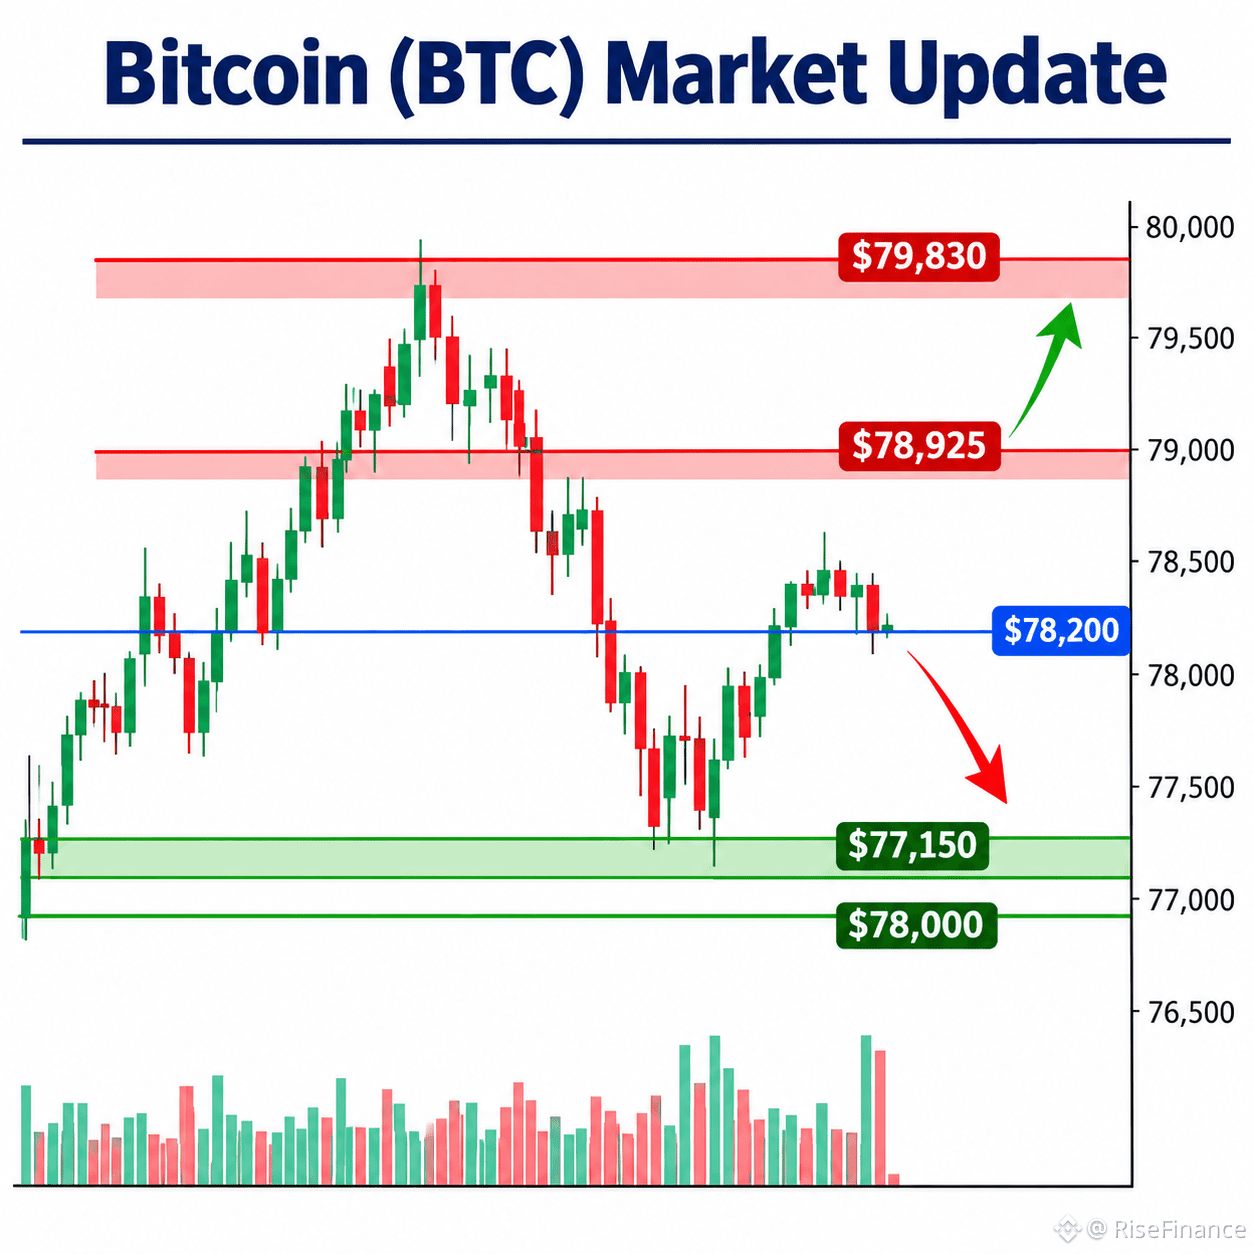
$BTC Bitcoin (BTC) Marktupdate | 2. November 2026
Aktueller Preis: Etwa 78.200 $
Markttrend: Bitcoin zeigt eine gemischte Dynamik. Zwar gab es innerhalb von 24 Stunden eine moderate Erholung, doch kurzfristige Schwäche ist weiterhin erkennbar. Der Markt bleibt vorsichtig, während Käufer und Verkäufer darum ringen, eine klare Richtung vorzugeben.
Wichtige Unterstützungsniveaus: 78.000 $ – 77.150 $
Wichtige Widerstandsniveaus: 78.925 $ – 79.830 $
Bullisches Szenario: Hält sich BTC über 78.000 $ und durchbricht den Widerstand bei 78.925 $ mit starkem Kaufvolumen, könnte der Kurs sich in Richtung 79.830 $ bewegen und möglicherweise höhere Niveaus testen.
Bärisches Szenario: Fällt Bitcoin unter die Unterstützung bei 78.000 $, könnte Verkaufsdruck den Kurs in Richtung 77.150 $ drücken. Ein weiterer Einbruch könnte die Marktstimmung verschlechtern.
Risikomanagement: Achten Sie auf bestätigte Kerzenschlusskurse und das Handelsvolumen, bevor Sie einen Ausbruch interpretieren. Vermeiden Sie emotionale Entscheidungen, wählen Sie Ihre Positionsgröße sorgfältig und berücksichtigen Sie stets mögliche Verluste.
Haftungsausschluss: Diese Analyse dient ausschließlich Bildungszwecken und ist keine Finanzberatung. Die Kryptowährungsmärkte sind sehr volatil. Informieren Sie sich daher stets selbst.
#BinanceRestores28FiatWithdrawals #ETHFalls16.1%InOctober #BitcoinClosesAbove50WeekMAFor7thStraightWeek #IndiaRBIAndFIUReviewOverseasCryptoCards #SolanaMobileRemovesMaliciousSKRClaimApp
{spot}(BTCUSDT)
$BTC Bitcoin (BTC) Marktupdate | 2. November 2026
Aktueller Preis: Etwa 78.200 $
Markttrend: Bitcoin zeigt eine gemischte Dynamik. Zwar gab es innerhalb von 24 Stunden eine moderate Erholung, doch kurzfristige Schwäche ist weiterhin erkennbar. Der Markt bleibt vorsichtig, während Käufer und Verkäufer darum ringen, eine klare Richtung vorzugeben.
Wichtige Unterstützungsniveaus: 78.000 $ – 77.150 $
Wichtige Widerstandsniveaus: 78.925 $ – 79.830 $
Bullisches Szenario: Hält sich BTC über 78.000 $ und durchbricht den Widerstand bei 78.925 $ mit starkem Kaufvolumen, könnte der Kurs sich in Richtung 79.830 $ bewegen und möglicherweise höhere Niveaus testen.
Bärisches Szenario: Fällt Bitcoin unter die Unterstützung bei 78.000 $, könnte Verkaufsdruck den Kurs in Richtung 77.150 $ drücken. Ein weiterer Einbruch könnte die Marktstimmung verschlechtern.
Risikomanagement: Achten Sie auf bestätigte Kerzenschlusskurse und das Handelsvolumen, bevor Sie einen Ausbruch interpretieren. Vermeiden Sie emotionale Entscheidungen, wählen Sie Ihre Positionsgröße sorgfältig und berücksichtigen Sie stets mögliche Verluste.
Haftungsausschluss: Diese Analyse dient ausschließlich Bildungszwecken und ist keine Finanzberatung. Die Kryptowährungsmärkte sind sehr volatil. Informieren Sie sich daher stets selbst.
#BinanceRestores28FiatWithdrawals #ETHFalls16.1%InOctober #BitcoinClosesAbove50WeekMAFor7thStraightWeek #IndiaRBIAndFIUReviewOverseasCryptoCards #SolanaMobileRemovesMaliciousSKRClaimApp
Aktueller Preis: Etwa 78.200 $
Markttrend: Bitcoin zeigt eine gemischte Dynamik. Zwar gab es innerhalb von 24 Stunden eine moderate Erholung, doch kurzfristige Schwäche ist weiterhin erkennbar. Der Markt bleibt vorsichtig, während Käufer und Verkäufer darum ringen, eine klare Richtung vorzugeben.
Wichtige Unterstützungsniveaus: 78.000 $ – 77.150 $
Wichtige Widerstandsniveaus: 78.925 $ – 79.830 $
Bullisches Szenario: Hält sich BTC über 78.000 $ und durchbricht den Widerstand bei 78.925 $ mit starkem Kaufvolumen, könnte der Kurs sich in Richtung 79.830 $ bewegen und möglicherweise höhere Niveaus testen.
Bärisches Szenario: Fällt Bitcoin unter die Unterstützung bei 78.000 $, könnte Verkaufsdruck den Kurs in Richtung 77.150 $ drücken. Ein weiterer Einbruch könnte die Marktstimmung verschlechtern.
Risikomanagement: Achten Sie auf bestätigte Kerzenschlusskurse und das Handelsvolumen, bevor Sie einen Ausbruch interpretieren. Vermeiden Sie emotionale Entscheidungen, wählen Sie Ihre Positionsgröße sorgfältig und berücksichtigen Sie stets mögliche Verluste.
Haftungsausschluss: Diese Analyse dient ausschließlich Bildungszwecken und ist keine Finanzberatung. Die Kryptowährungsmärkte sind sehr volatil. Informieren Sie sich daher stets selbst.
#BinanceRestores28FiatWithdrawals #ETHFalls16.1%InOctober #BitcoinClosesAbove50WeekMAFor7thStraightWeek #IndiaRBIAndFIUReviewOverseasCryptoCards #SolanaMobileRemovesMaliciousSKRClaimApp
94
·
--
Übersetzung ansehen
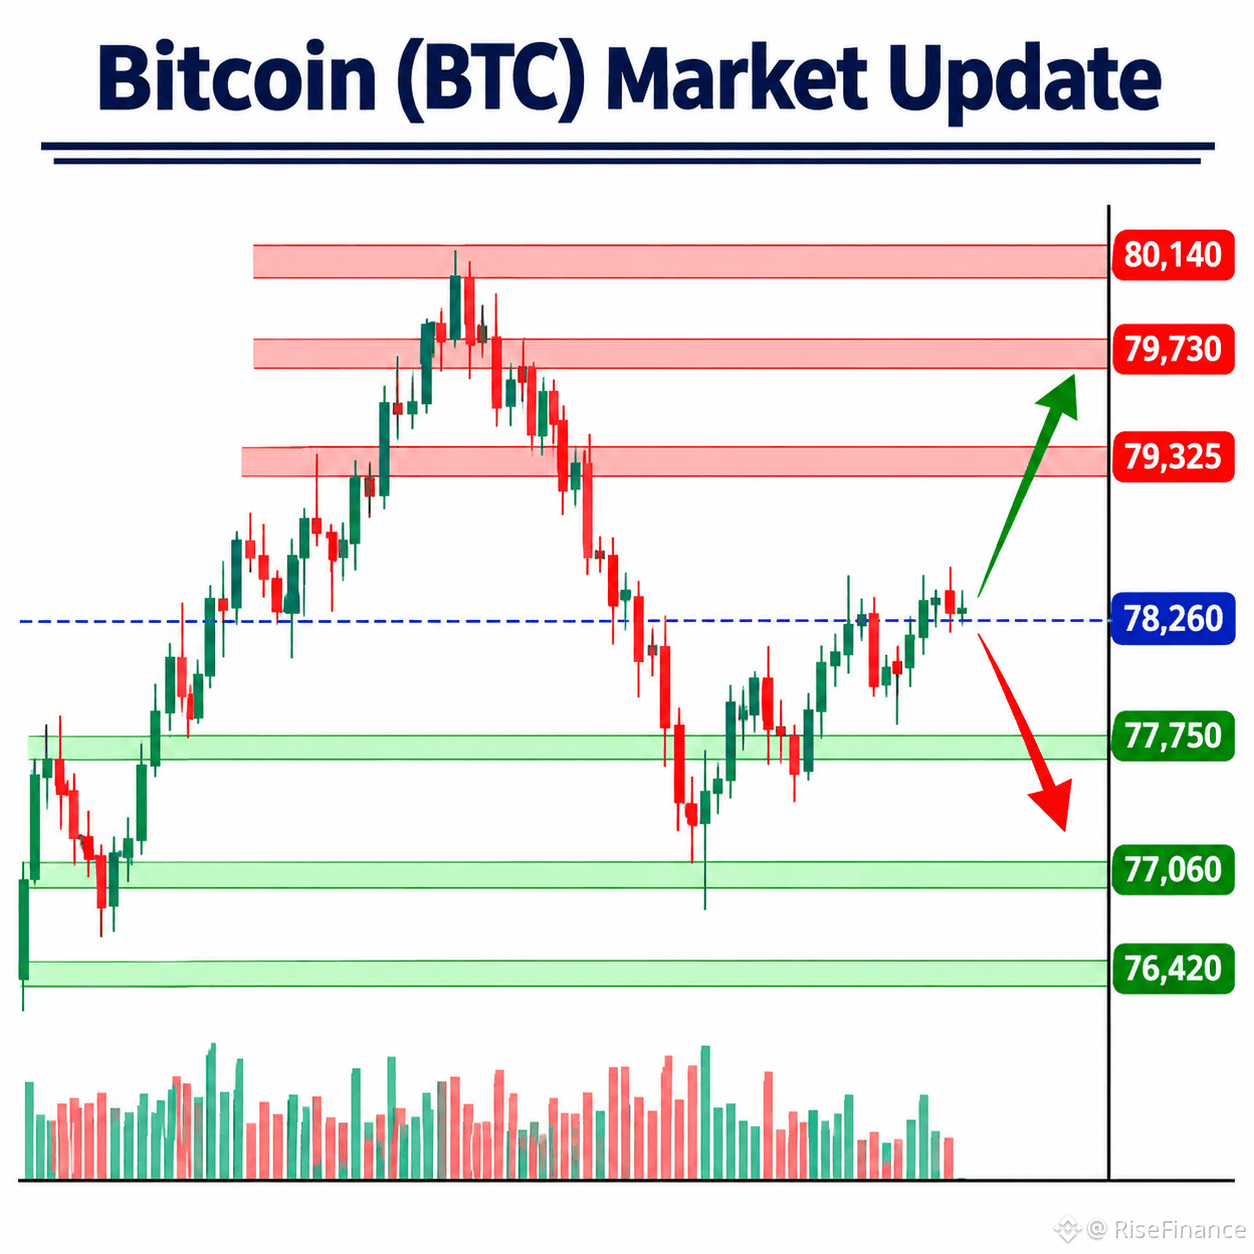
$BTC Bitcoin (BTC) Market Update – November 2, 2026
Current Market Trend: Short-Term Bearish, With an Intraday Recovery
Bitcoin is trading around $78,260, showing a modest recovery after recent selling pressure. However, the broader short-term trend remains cautious, as BTC is still facing resistance above its current price.
Key Support Levels:
- $77,750 – Immediate support
- $77,060 – Secondary support
- $76,420 – Major support
Key Resistance Levels:
- $79,325 – First resistance
- $79,730 – Second resistance
- $80,140 – Major resistance
Bullish Scenario: If BTC holds above $77,750 and breaks through $79,325, buyers could push the price toward $79,730 and $80,140.
Bearish Scenario: If Bitcoin loses the $77,750 support, selling pressure could increase, potentially bringing $77,060 and $76,420 into focus.
Risk Management: Watch for confirmed candle closes before interpreting breakouts. Avoid emotional decisions, manage position sizes carefully, and always consider market volatility.
What comes next? Will Bitcoin recover above $80,000 or face another rejection?
Disclaimer: This analysis is for educational purposes only and should not be considered financial advice. Cryptocurrency markets involve significant risk.
#BrazilVirtualAssetLicenseDeadlineDrawsAbout40Firms #BTCPayServerUrgesOperatorsToShutDownInstances #BinanceUpdatesProofofReservesAddresses #StudyFindsCircleAIAgentWalletLimitsCanBeBypassed
{spot}(BTCUSDT)
$BTC Bitcoin (BTC) Market Update – November 2, 2026
Current Market Trend: Short-Term Bearish, With an Intraday Recovery
Bitcoin is trading around $78,260, showing a modest recovery after recent selling pressure. However, the broader short-term trend remains cautious, as BTC is still facing resistance above its current price.
Key Support Levels:
- $77,750 – Immediate support
- $77,060 – Secondary support
- $76,420 – Major support
Key Resistance Levels:
- $79,325 – First resistance
- $79,730 – Second resistance
- $80,140 – Major resistance
Bullish Scenario: If BTC holds above $77,750 and breaks through $79,325, buyers could push the price toward $79,730 and $80,140.
Bearish Scenario: If Bitcoin loses the $77,750 support, selling pressure could increase, potentially bringing $77,060 and $76,420 into focus.
Risk Management: Watch for confirmed candle closes before interpreting breakouts. Avoid emotional decisions, manage position sizes carefully, and always consider market volatility.
What comes next? Will Bitcoin recover above $80,000 or face another rejection?
Disclaimer: This analysis is for educational purposes only and should not be considered financial advice. Cryptocurrency markets involve significant risk.
#BrazilVirtualAssetLicenseDeadlineDrawsAbout40Firms #BTCPayServerUrgesOperatorsToShutDownInstances #BinanceUpdatesProofofReservesAddresses #StudyFindsCircleAIAgentWalletLimitsCanBeBypassed
Current Market Trend: Short-Term Bearish, With an Intraday Recovery
Bitcoin is trading around $78,260, showing a modest recovery after recent selling pressure. However, the broader short-term trend remains cautious, as BTC is still facing resistance above its current price.
Key Support Levels:
- $77,750 – Immediate support
- $77,060 – Secondary support
- $76,420 – Major support
Key Resistance Levels:
- $79,325 – First resistance
- $79,730 – Second resistance
- $80,140 – Major resistance
Bullish Scenario: If BTC holds above $77,750 and breaks through $79,325, buyers could push the price toward $79,730 and $80,140.
Bearish Scenario: If Bitcoin loses the $77,750 support, selling pressure could increase, potentially bringing $77,060 and $76,420 into focus.
Risk Management: Watch for confirmed candle closes before interpreting breakouts. Avoid emotional decisions, manage position sizes carefully, and always consider market volatility.
What comes next? Will Bitcoin recover above $80,000 or face another rejection?
Disclaimer: This analysis is for educational purposes only and should not be considered financial advice. Cryptocurrency markets involve significant risk.
#BrazilVirtualAssetLicenseDeadlineDrawsAbout40Firms #BTCPayServerUrgesOperatorsToShutDownInstances #BinanceUpdatesProofofReservesAddresses #StudyFindsCircleAIAgentWalletLimitsCanBeBypassed
15
·
--
Übersetzung ansehen
$BTC Bitcoin (BTC) Market Analysis – November 2, 2026
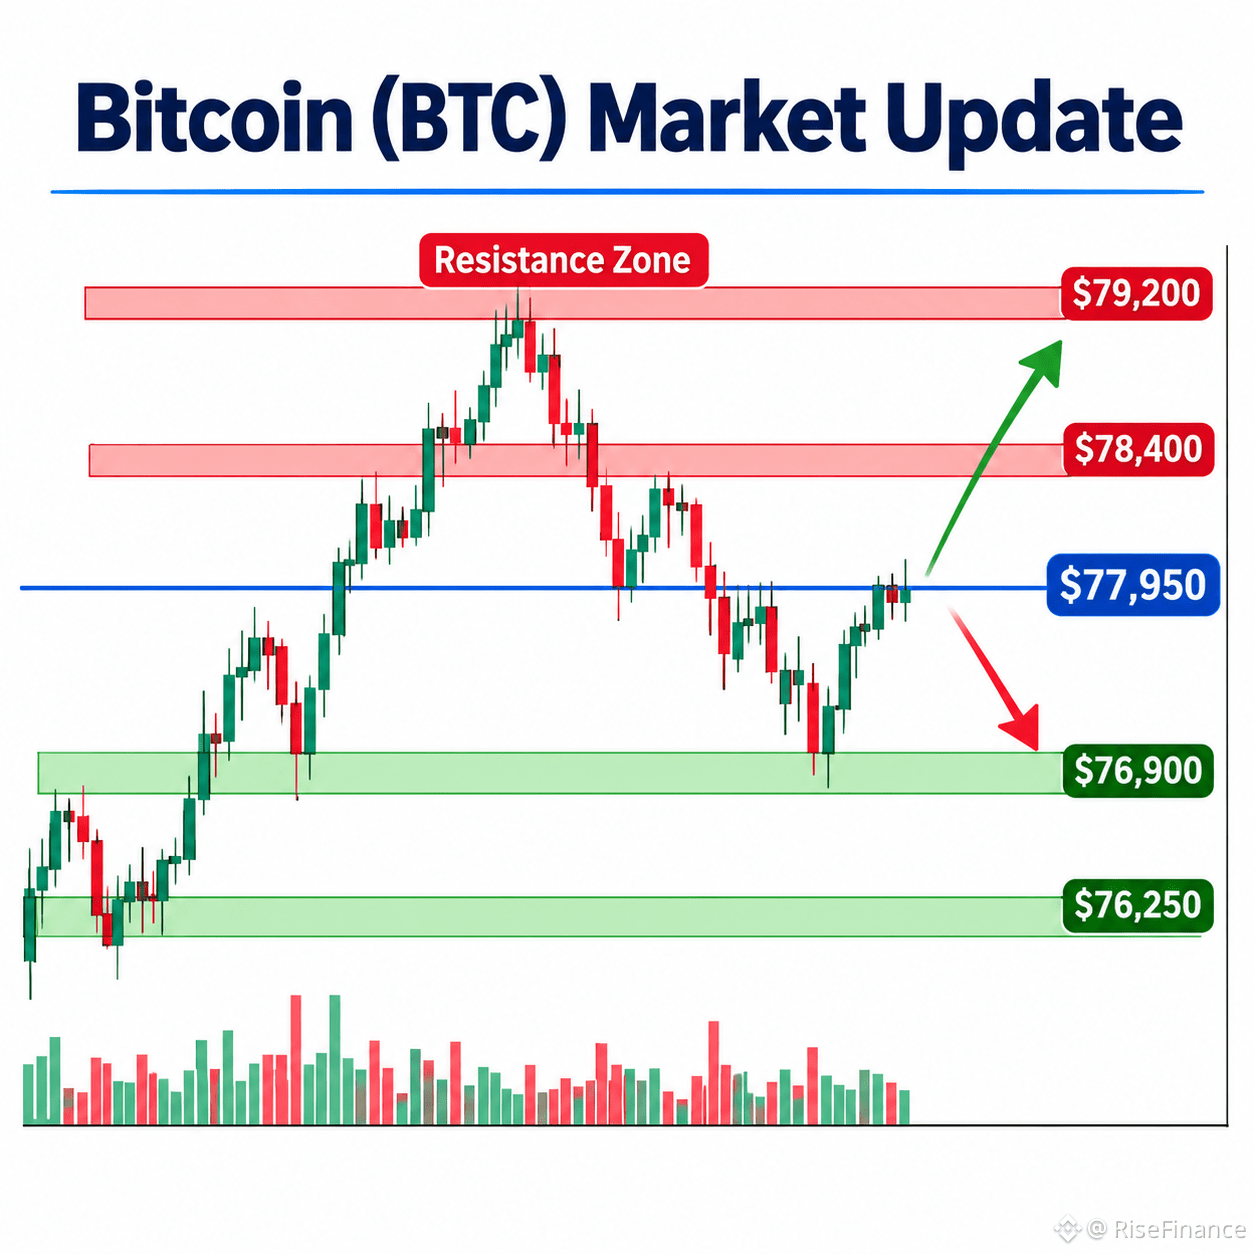
Bitcoin is currently trading around $77,950, showing a modest recovery of approximately 0.6% over the last 24 hours. However, the broader market structure remains cautious as BTC continues to face resistance after its recent decline.
📊 Current Market Trend
BTC is showing short-term recovery, but the overall trend remains neutral to bearish until buyers regain stronger momentum. The market is currently testing important price levels.
🔑 Key Support Levels
- $76,900 – Immediate support
- $76,250 – Stronger support
- $75,850 – Important downside level
🚀 Key Resistance Levels
- $78,400 – Immediate resistance
- $78,800 – Next resistance
- $79,200 – Major breakout area
📈 Bullish Scenario:
If Bitcoin holds above $76,900 and breaks through $78,400, buyers could push the price toward $78,800–$79,200. A strong breakout with increasing volume may support further recovery.
📉 Bearish Scenario:
If BTC fails to maintain support at $76,900, selling pressure could push the price toward $76,250 and potentially $75,850.
⚠️ Risk Management
Watch for confirmed candle closes rather than reacting to sudden price movements. Avoid excessive leverage, manage position sizes carefully, and always consider stop-loss levels.
What comes next? Bitcoin's ability to hold support or break resistance will be important in determining its next direction.
Disclaimer: This analysis is for educational and informational purposes only, not financial advice. Always do your own research before making trading decisions.
#BinanceUpdatesProofofReservesAddresses #BinanceToResumePhaseOneOfWithdrawals #CZDismissesClaimsBinanceHackWasPredicted #B14gReportsUnauthorizedTransferOfAbout97MCORE #USSpotETHETFsPost23StraightDaysOfNetOutflows
{spot}(BTCUSDT)
$BTC Bitcoin (BTC) Market Analysis – November 2, 2026
Bitcoin is currently trading around $77,950, showing a modest recovery of approximately 0.6% over the last 24 hours. However, the broader market structure remains cautious as BTC continues to face resistance after its recent decline.
📊 Current Market Trend
BTC is showing short-term recovery, but the overall trend remains neutral to bearish until buyers regain stronger momentum. The market is currently testing important price levels.
🔑 Key Support Levels
- $76,900 – Immediate support
- $76,250 – Stronger support
- $75,850 – Important downside level
🚀 Key Resistance Levels
- $78,400 – Immediate resistance
- $78,800 – Next resistance
- $79,200 – Major breakout area
📈 Bullish Scenario:
If Bitcoin holds above $76,900 and breaks through $78,400, buyers could push the price toward $78,800–$79,200. A strong breakout with increasing volume may support further recovery.
📉 Bearish Scenario:
If BTC fails to maintain support at $76,900, selling pressure could push the price toward $76,250 and potentially $75,850.
⚠️ Risk Management
Watch for confirmed candle closes rather than reacting to sudden price movements. Avoid excessive leverage, manage position sizes carefully, and always consider stop-loss levels.
What comes next? Bitcoin's ability to hold support or break resistance will be important in determining its next direction.
Disclaimer: This analysis is for educational and informational purposes only, not financial advice. Always do your own research before making trading decisions.
#BinanceUpdatesProofofReservesAddresses #BinanceToResumePhaseOneOfWithdrawals #CZDismissesClaimsBinanceHackWasPredicted #B14gReportsUnauthorizedTransferOfAbout97MCORE #USSpotETHETFsPost23StraightDaysOfNetOutflows
Bitcoin is currently trading around $77,950, showing a modest recovery of approximately 0.6% over the last 24 hours. However, the broader market structure remains cautious as BTC continues to face resistance after its recent decline.
📊 Current Market Trend
BTC is showing short-term recovery, but the overall trend remains neutral to bearish until buyers regain stronger momentum. The market is currently testing important price levels.
🔑 Key Support Levels
- $76,900 – Immediate support
- $76,250 – Stronger support
- $75,850 – Important downside level
🚀 Key Resistance Levels
- $78,400 – Immediate resistance
- $78,800 – Next resistance
- $79,200 – Major breakout area
📈 Bullish Scenario:
If Bitcoin holds above $76,900 and breaks through $78,400, buyers could push the price toward $78,800–$79,200. A strong breakout with increasing volume may support further recovery.
📉 Bearish Scenario:
If BTC fails to maintain support at $76,900, selling pressure could push the price toward $76,250 and potentially $75,850.
⚠️ Risk Management
Watch for confirmed candle closes rather than reacting to sudden price movements. Avoid excessive leverage, manage position sizes carefully, and always consider stop-loss levels.
What comes next? Bitcoin's ability to hold support or break resistance will be important in determining its next direction.
Disclaimer: This analysis is for educational and informational purposes only, not financial advice. Always do your own research before making trading decisions.
#BinanceUpdatesProofofReservesAddresses #BinanceToResumePhaseOneOfWithdrawals #CZDismissesClaimsBinanceHackWasPredicted #B14gReportsUnauthorizedTransferOfAbout97MCORE #USSpotETHETFsPost23StraightDaysOfNetOutflows
23
·
--
Übersetzung ansehen
$BTC Bitcoin (BTC) Market Analysis | November 1, 2026
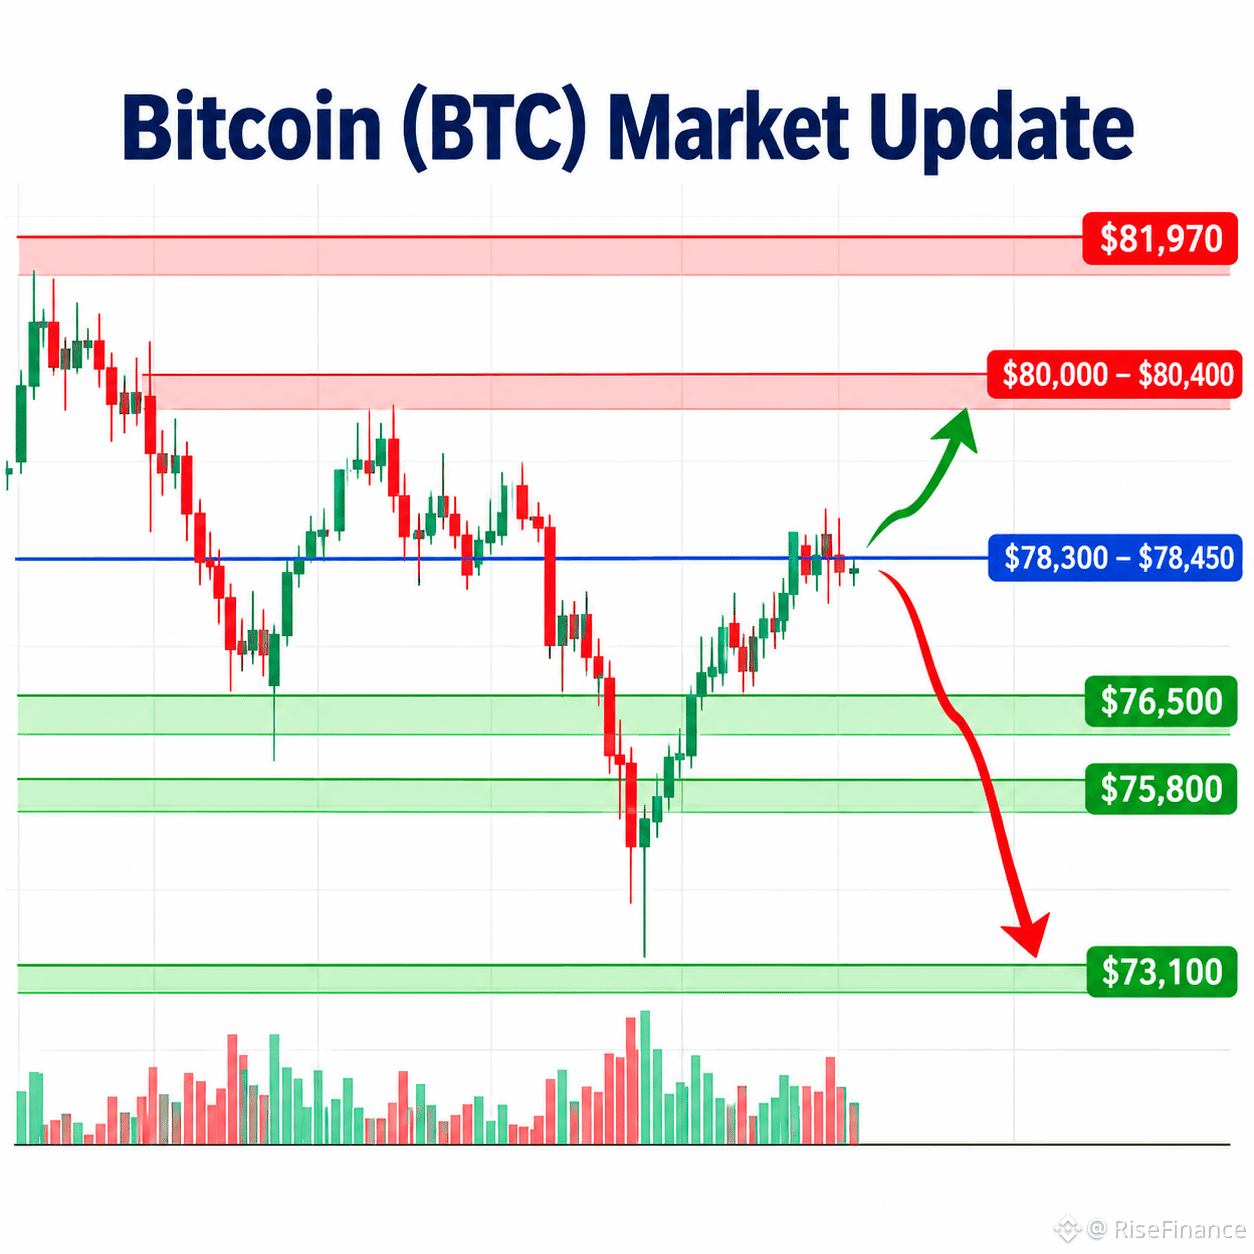
Bitcoin is currently trading around $78,000, showing a modest recovery after recent selling pressure. However, the overall short-term structure remains cautious, as BTC is still struggling to break above major resistance levels.
📊 Market Trend: BTC is moving sideways with a slightly bearish short-term bias. Buyers are attempting to regain control, but strong confirmation is still needed.
🟢 Key Support Levels:
- $76,500 – Immediate support
- $75,800 – Strong support zone
- $73,100 – Major downside support
🔴 Key Resistance Levels:
- $78,300–$78,450 – Immediate resistance
- $80,000–$80,400 – Major resistance zone
- $81,970 – Higher resistance
📈 Bullish Scenario: If BTC breaks above $78,450 and maintains its position, buyers could push the price toward $80,000–$80,400. A stronger breakout may open the door toward $81,970.
📉 Bearish Scenario: If Bitcoin fails to hold $76,500, selling pressure could increase, bringing $75,800 and potentially $73,100 into focus.
⚠️ Risk Management: Watch for confirmed candle closes, trading volume, and sudden volatility. Avoid excessive leverage and always manage risk carefully.
**What do you think? Will Bitcoin break above $80,000 or revisit lower support levels?
Disclaimer: This analysis is for educational purposes only and should not be considered financial advice. Cryptocurrency markets involve significant risk.
#BinanceUpdatesProofofReservesAddresses #BinanceToResumePhaseOneOfWithdrawals #CZDismissesClaimsBinanceHackWasPredicted #B14gReportsUnauthorizedTransferOfAbout97MCORE #USSpotETHETFsPost23StraightDaysOfNetOutflows
{spot}(BTCUSDT)
$BTC Bitcoin (BTC) Market Analysis | November 1, 2026
Bitcoin is currently trading around $78,000, showing a modest recovery after recent selling pressure. However, the overall short-term structure remains cautious, as BTC is still struggling to break above major resistance levels.
📊 Market Trend: BTC is moving sideways with a slightly bearish short-term bias. Buyers are attempting to regain control, but strong confirmation is still needed.
🟢 Key Support Levels:
- $76,500 – Immediate support
- $75,800 – Strong support zone
- $73,100 – Major downside support
🔴 Key Resistance Levels:
- $78,300–$78,450 – Immediate resistance
- $80,000–$80,400 – Major resistance zone
- $81,970 – Higher resistance
📈 Bullish Scenario: If BTC breaks above $78,450 and maintains its position, buyers could push the price toward $80,000–$80,400. A stronger breakout may open the door toward $81,970.
📉 Bearish Scenario: If Bitcoin fails to hold $76,500, selling pressure could increase, bringing $75,800 and potentially $73,100 into focus.
⚠️ Risk Management: Watch for confirmed candle closes, trading volume, and sudden volatility. Avoid excessive leverage and always manage risk carefully.
**What do you think? Will Bitcoin break above $80,000 or revisit lower support levels?
Disclaimer: This analysis is for educational purposes only and should not be considered financial advice. Cryptocurrency markets involve significant risk.
#BinanceUpdatesProofofReservesAddresses #BinanceToResumePhaseOneOfWithdrawals #CZDismissesClaimsBinanceHackWasPredicted #B14gReportsUnauthorizedTransferOfAbout97MCORE #USSpotETHETFsPost23StraightDaysOfNetOutflows
Bitcoin is currently trading around $78,000, showing a modest recovery after recent selling pressure. However, the overall short-term structure remains cautious, as BTC is still struggling to break above major resistance levels.
📊 Market Trend: BTC is moving sideways with a slightly bearish short-term bias. Buyers are attempting to regain control, but strong confirmation is still needed.
🟢 Key Support Levels:
- $76,500 – Immediate support
- $75,800 – Strong support zone
- $73,100 – Major downside support
🔴 Key Resistance Levels:
- $78,300–$78,450 – Immediate resistance
- $80,000–$80,400 – Major resistance zone
- $81,970 – Higher resistance
📈 Bullish Scenario: If BTC breaks above $78,450 and maintains its position, buyers could push the price toward $80,000–$80,400. A stronger breakout may open the door toward $81,970.
📉 Bearish Scenario: If Bitcoin fails to hold $76,500, selling pressure could increase, bringing $75,800 and potentially $73,100 into focus.
⚠️ Risk Management: Watch for confirmed candle closes, trading volume, and sudden volatility. Avoid excessive leverage and always manage risk carefully.
**What do you think? Will Bitcoin break above $80,000 or revisit lower support levels?
Disclaimer: This analysis is for educational purposes only and should not be considered financial advice. Cryptocurrency markets involve significant risk.
#BinanceUpdatesProofofReservesAddresses #BinanceToResumePhaseOneOfWithdrawals #CZDismissesClaimsBinanceHackWasPredicted #B14gReportsUnauthorizedTransferOfAbout97MCORE #USSpotETHETFsPost23StraightDaysOfNetOutflows
24
·
--
Übersetzung ansehen
$BTC Bitcoin (BTC) Market Update – November 1, 2026
Current Market Trend: Cautiously Bearish
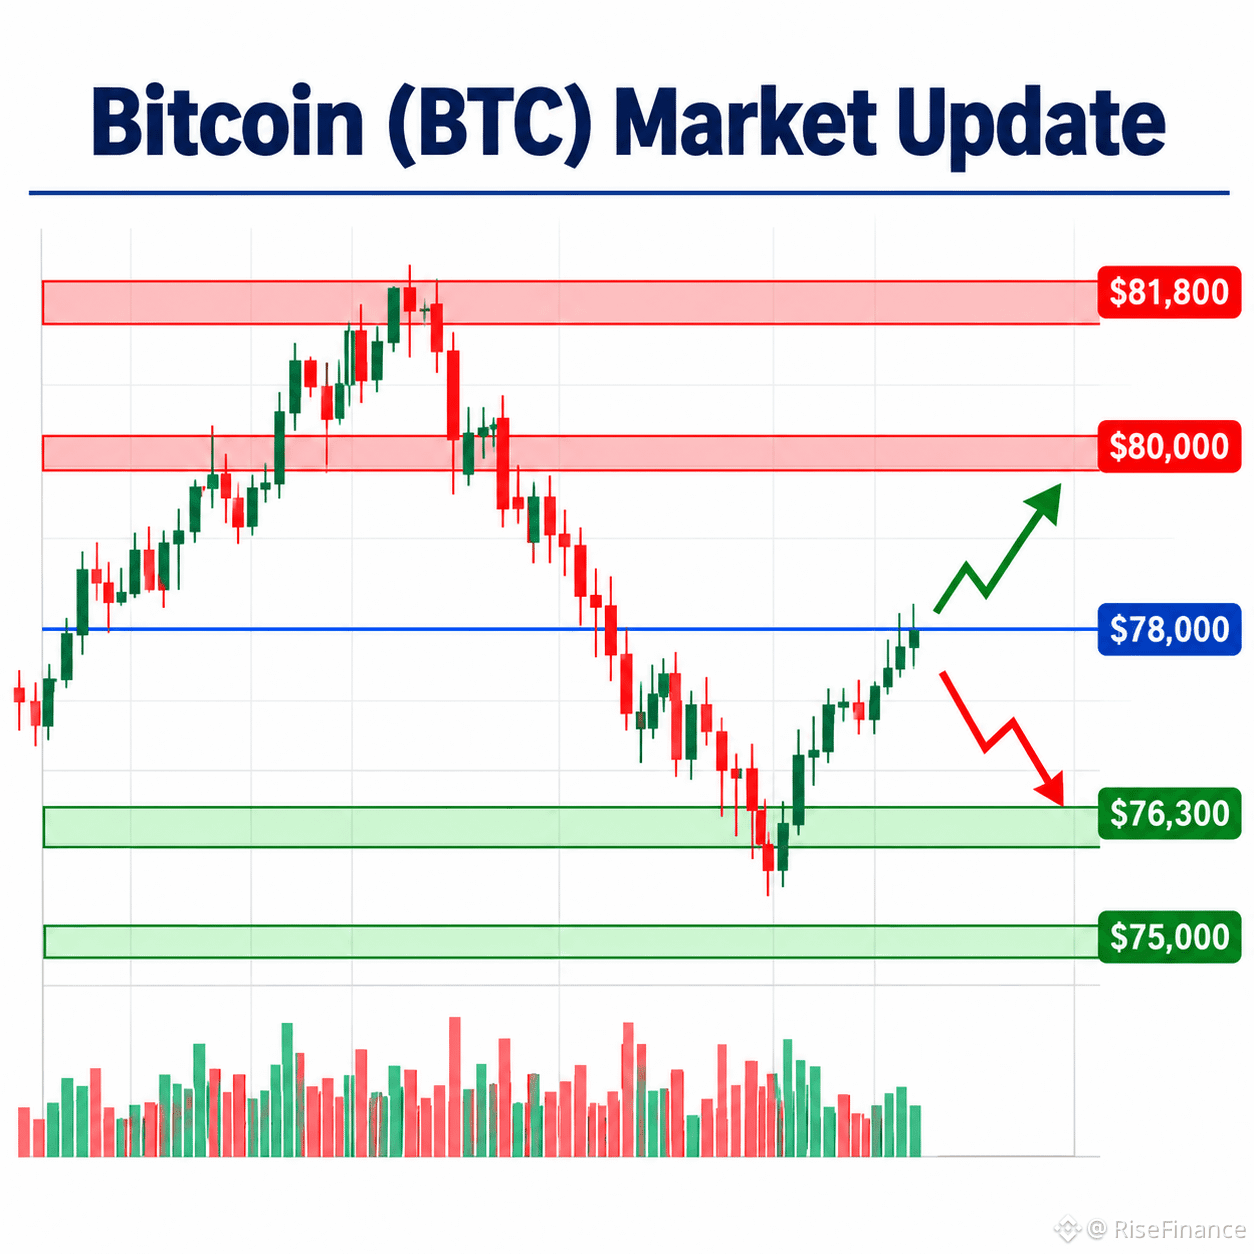
Bitcoin is trading around $77,567, showing a modest recovery of approximately 1% over the last 24 hours. However, BTC remains down around 3.7% over the past seven days, suggesting that broader short-term pressure is still present.
Key Support Levels:
- $76,600 – Immediate support
- $76,300 – Stronger short-term support
- $75,000 – Psychological support
Key Resistance Levels:
- $78,000 – Immediate resistance
- $80,000 – Major resistance
- $81,800 – Higher resistance zone
Bullish Scenario:
If BTC breaks above $78,000 and maintains momentum, buyers could push the price toward $80,000 and potentially $81,800. Strong trading volume would support this recovery.
Bearish Scenario:
If Bitcoin fails to hold the $76,300 support zone, selling pressure could increase, potentially bringing $75,000 into focus.
Market Outlook:
BTC is showing signs of a short-term recovery, but the broader trend remains under pressure. Traders should watch the $78,000 resistance and $76,300 support for confirmation of the next move.
Risk Management:
Avoid emotional trading, manage position sizes carefully, and always consider stop-loss levels. Wait for clear confirmation rather than reacting to sudden price movements.
Disclaimer: This analysis is for educational and informational purposes only. It is not financial advice. Always conduct your own research before making any trading decisions.
#BinanceUpdatesProofofReservesAddresses #BinanceToResumePhaseOneOfWithdrawals #CZDismissesClaimsBinanceHackWasPredicted #B14gReportsUnauthorizedTransferOfAbout97MCORE #USSpotETHETFsPost23StraightDaysOfNetOutflows
{spot}(BTCUSDT)
$BTC Bitcoin (BTC) Market Update – November 1, 2026
Current Market Trend: Cautiously Bearish
Bitcoin is trading around $77,567, showing a modest recovery of approximately 1% over the last 24 hours. However, BTC remains down around 3.7% over the past seven days, suggesting that broader short-term pressure is still present.
Key Support Levels:
- $76,600 – Immediate support
- $76,300 – Stronger short-term support
- $75,000 – Psychological support
Key Resistance Levels:
- $78,000 – Immediate resistance
- $80,000 – Major resistance
- $81,800 – Higher resistance zone
Bullish Scenario:
If BTC breaks above $78,000 and maintains momentum, buyers could push the price toward $80,000 and potentially $81,800. Strong trading volume would support this recovery.
Bearish Scenario:
If Bitcoin fails to hold the $76,300 support zone, selling pressure could increase, potentially bringing $75,000 into focus.
Market Outlook:
BTC is showing signs of a short-term recovery, but the broader trend remains under pressure. Traders should watch the $78,000 resistance and $76,300 support for confirmation of the next move.
Risk Management:
Avoid emotional trading, manage position sizes carefully, and always consider stop-loss levels. Wait for clear confirmation rather than reacting to sudden price movements.
Disclaimer: This analysis is for educational and informational purposes only. It is not financial advice. Always conduct your own research before making any trading decisions.
#BinanceUpdatesProofofReservesAddresses #BinanceToResumePhaseOneOfWithdrawals #CZDismissesClaimsBinanceHackWasPredicted #B14gReportsUnauthorizedTransferOfAbout97MCORE #USSpotETHETFsPost23StraightDaysOfNetOutflows
Current Market Trend: Cautiously Bearish
Bitcoin is trading around $77,567, showing a modest recovery of approximately 1% over the last 24 hours. However, BTC remains down around 3.7% over the past seven days, suggesting that broader short-term pressure is still present.
Key Support Levels:
- $76,600 – Immediate support
- $76,300 – Stronger short-term support
- $75,000 – Psychological support
Key Resistance Levels:
- $78,000 – Immediate resistance
- $80,000 – Major resistance
- $81,800 – Higher resistance zone
Bullish Scenario:
If BTC breaks above $78,000 and maintains momentum, buyers could push the price toward $80,000 and potentially $81,800. Strong trading volume would support this recovery.
Bearish Scenario:
If Bitcoin fails to hold the $76,300 support zone, selling pressure could increase, potentially bringing $75,000 into focus.
Market Outlook:
BTC is showing signs of a short-term recovery, but the broader trend remains under pressure. Traders should watch the $78,000 resistance and $76,300 support for confirmation of the next move.
Risk Management:
Avoid emotional trading, manage position sizes carefully, and always consider stop-loss levels. Wait for clear confirmation rather than reacting to sudden price movements.
Disclaimer: This analysis is for educational and informational purposes only. It is not financial advice. Always conduct your own research before making any trading decisions.
#BinanceUpdatesProofofReservesAddresses #BinanceToResumePhaseOneOfWithdrawals #CZDismissesClaimsBinanceHackWasPredicted #B14gReportsUnauthorizedTransferOfAbout97MCORE #USSpotETHETFsPost23StraightDaysOfNetOutflows
21
·
--
Übersetzung ansehen
$BTC Bitcoin (BTC) Market Analysis | November 1, 2026
Current Price: Around $77,800
Market Trend: Bitcoin is showing a short-term recovery, gaining around 1% in the last 24 hours. However, the weekly trend remains under pressure, with BTC still down approximately 3.7% over seven days.
Key Support Levels:
- $76,950 – Immediate support
- $76,070 – Next support
- $74,840 – Stronger downside support
Key Resistance Levels:
- $78,060 – Immediate resistance
- $79,130 – Next resistance
- $80,350 – Major resistance zone
Bullish Scenario: If BTC breaks above $78,060 and holds this level, buyers could push the price towards $79,130 and potentially $80,350.
Bearish Scenario: If Bitcoin fails to break resistance and drops below $76,950, selling pressure could increase, bringing $76,070 and $74,840 into focus.
Risk Management: Watch for confirmed candle closes before considering a breakout. Avoid emotional trading, manage position sizes carefully, and always consider market volatility.
Educational Disclaimer: This analysis is for educational purposes only and is not financial advice. Always do your own research before making trading decisions.
#BinanceUpdatesProofofReservesAddresses #BinanceToResumePhaseOneOfWithdrawals #BinanceSAFUFundTransferCompleted7499BTC #CZDismissesClaimsBinanceHackWasPredicted #B14gReportsUnauthorizedTransferOfAbout97MCORE
{spot}(BTCUSDT)
$BTC Bitcoin (BTC) Market Analysis | November 1, 2026
Current Price: Around $77,800
Market Trend: Bitcoin is showing a short-term recovery, gaining around 1% in the last 24 hours. However, the weekly trend remains under pressure, with BTC still down approximately 3.7% over seven days.
Key Support Levels:
- $76,950 – Immediate support
- $76,070 – Next support
- $74,840 – Stronger downside support
Key Resistance Levels:
- $78,060 – Immediate resistance
- $79,130 – Next resistance
- $80,350 – Major resistance zone
Bullish Scenario: If BTC breaks above $78,060 and holds this level, buyers could push the price towards $79,130 and potentially $80,350.
Bearish Scenario: If Bitcoin fails to break resistance and drops below $76,950, selling pressure could increase, bringing $76,070 and $74,840 into focus.
Risk Management: Watch for confirmed candle closes before considering a breakout. Avoid emotional trading, manage position sizes carefully, and always consider market volatility.
Educational Disclaimer: This analysis is for educational purposes only and is not financial advice. Always do your own research before making trading decisions.
#BinanceUpdatesProofofReservesAddresses #BinanceToResumePhaseOneOfWithdrawals #BinanceSAFUFundTransferCompleted7499BTC #CZDismissesClaimsBinanceHackWasPredicted #B14gReportsUnauthorizedTransferOfAbout97MCORE
Current Price: Around $77,800
Market Trend: Bitcoin is showing a short-term recovery, gaining around 1% in the last 24 hours. However, the weekly trend remains under pressure, with BTC still down approximately 3.7% over seven days.
Key Support Levels:
- $76,950 – Immediate support
- $76,070 – Next support
- $74,840 – Stronger downside support
Key Resistance Levels:
- $78,060 – Immediate resistance
- $79,130 – Next resistance
- $80,350 – Major resistance zone
Bullish Scenario: If BTC breaks above $78,060 and holds this level, buyers could push the price towards $79,130 and potentially $80,350.
Bearish Scenario: If Bitcoin fails to break resistance and drops below $76,950, selling pressure could increase, bringing $76,070 and $74,840 into focus.
Risk Management: Watch for confirmed candle closes before considering a breakout. Avoid emotional trading, manage position sizes carefully, and always consider market volatility.
Educational Disclaimer: This analysis is for educational purposes only and is not financial advice. Always do your own research before making trading decisions.
#BinanceUpdatesProofofReservesAddresses #BinanceToResumePhaseOneOfWithdrawals #BinanceSAFUFundTransferCompleted7499BTC #CZDismissesClaimsBinanceHackWasPredicted #B14gReportsUnauthorizedTransferOfAbout97MCORE
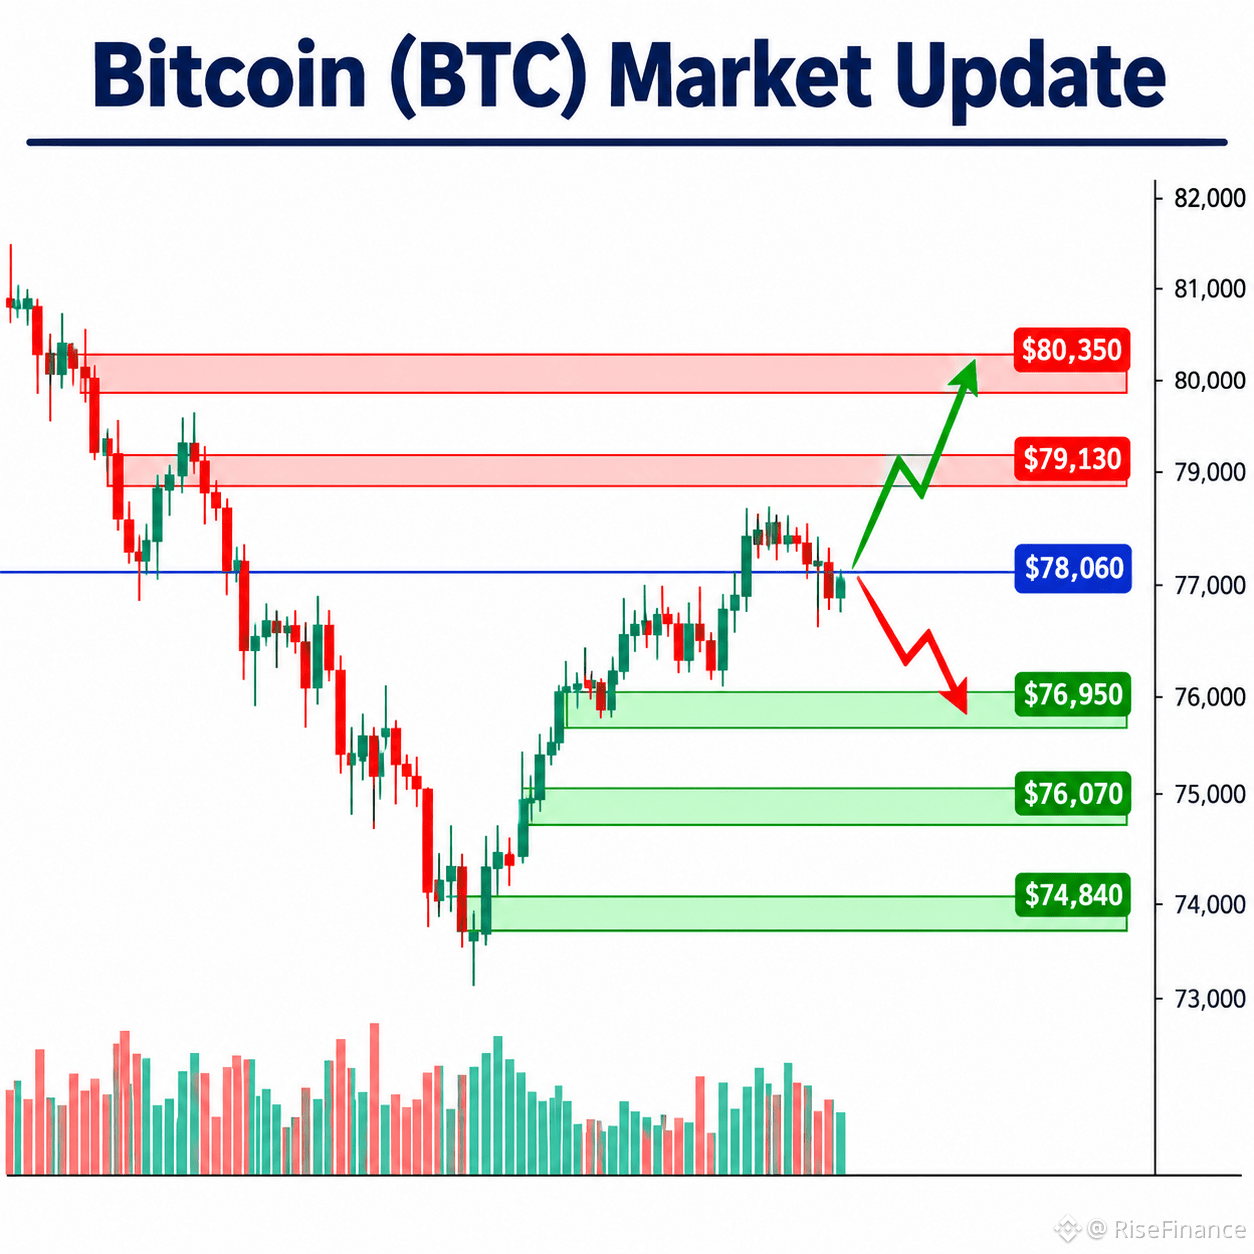
11
·
--
Übersetzung ansehen
$BTC Bitcoin (BTC) Market Analysis – November 1, 2026
Current Price: Around $78,000
Market Trend: Bitcoin is showing a short-term recovery, but the overall market structure remains cautious. Selling pressure is still visible on higher timeframes, while buyers are attempting to regain control. The market needs a confirmed breakout before a stronger bullish trend can develop.
Key Support Levels:
- $76,970 – Immediate support
- $76,070 – Major support
- $74,850 – Next downside support
Key Resistance Levels:
- $78,780 – Immediate resistance
- $80,340 – Strong resistance
- $81,925 – Major breakout level
Bullish Scenario 📈
If BTC holds above $76,970 and breaks through $78,780 with strong buying volume, the price could move towards $80,340 and potentially $81,925.
Bearish Scenario 📉
If Bitcoin loses the $76,970 support, selling pressure could increase. A further decline may bring $76,070 and $74,850 into focus.
Risk Management
Avoid emotional trading and chasing sudden price movements. Always use proper stop-loss levels, manage position size, and wait for confirmation before making trading decisions.
Market Outlook: Bitcoin remains in a cautious recovery phase. The next confirmed breakout or breakdown will help determine its short-term direction.
Disclaimer: This analysis is for educational purposes only and is not financial advice. Cryptocurrency markets are highly volatile. Always do your own research before making any trading decisions.
#BinanceUpdatesProofofReservesAddresses #BinanceToResumePhaseOneOfWithdrawals #BinanceSAFUFundTransferCompleted7499BTC #CZDismissesClaimsBinanceHackWasPredicted #YiHe:ProofOfReserves:10TokensAt100%Backing
{spot}(BTCUSDT)
$BTC Bitcoin (BTC) Market Analysis – November 1, 2026
Current Price: Around $78,000
Market Trend: Bitcoin is showing a short-term recovery, but the overall market structure remains cautious. Selling pressure is still visible on higher timeframes, while buyers are attempting to regain control. The market needs a confirmed breakout before a stronger bullish trend can develop.
Key Support Levels:
- $76,970 – Immediate support
- $76,070 – Major support
- $74,850 – Next downside support
Key Resistance Levels:
- $78,780 – Immediate resistance
- $80,340 – Strong resistance
- $81,925 – Major breakout level
Bullish Scenario 📈
If BTC holds above $76,970 and breaks through $78,780 with strong buying volume, the price could move towards $80,340 and potentially $81,925.
Bearish Scenario 📉
If Bitcoin loses the $76,970 support, selling pressure could increase. A further decline may bring $76,070 and $74,850 into focus.
Risk Management
Avoid emotional trading and chasing sudden price movements. Always use proper stop-loss levels, manage position size, and wait for confirmation before making trading decisions.
Market Outlook: Bitcoin remains in a cautious recovery phase. The next confirmed breakout or breakdown will help determine its short-term direction.
Disclaimer: This analysis is for educational purposes only and is not financial advice. Cryptocurrency markets are highly volatile. Always do your own research before making any trading decisions.
#BinanceUpdatesProofofReservesAddresses #BinanceToResumePhaseOneOfWithdrawals #BinanceSAFUFundTransferCompleted7499BTC #CZDismissesClaimsBinanceHackWasPredicted #YiHe:ProofOfReserves:10TokensAt100%Backing
Current Price: Around $78,000
Market Trend: Bitcoin is showing a short-term recovery, but the overall market structure remains cautious. Selling pressure is still visible on higher timeframes, while buyers are attempting to regain control. The market needs a confirmed breakout before a stronger bullish trend can develop.
Key Support Levels:
- $76,970 – Immediate support
- $76,070 – Major support
- $74,850 – Next downside support
Key Resistance Levels:
- $78,780 – Immediate resistance
- $80,340 – Strong resistance
- $81,925 – Major breakout level
Bullish Scenario 📈
If BTC holds above $76,970 and breaks through $78,780 with strong buying volume, the price could move towards $80,340 and potentially $81,925.
Bearish Scenario 📉
If Bitcoin loses the $76,970 support, selling pressure could increase. A further decline may bring $76,070 and $74,850 into focus.
Risk Management
Avoid emotional trading and chasing sudden price movements. Always use proper stop-loss levels, manage position size, and wait for confirmation before making trading decisions.
Market Outlook: Bitcoin remains in a cautious recovery phase. The next confirmed breakout or breakdown will help determine its short-term direction.
Disclaimer: This analysis is for educational purposes only and is not financial advice. Cryptocurrency markets are highly volatile. Always do your own research before making any trading decisions.
#BinanceUpdatesProofofReservesAddresses #BinanceToResumePhaseOneOfWithdrawals #BinanceSAFUFundTransferCompleted7499BTC #CZDismissesClaimsBinanceHackWasPredicted #YiHe:ProofOfReserves:10TokensAt100%Backing
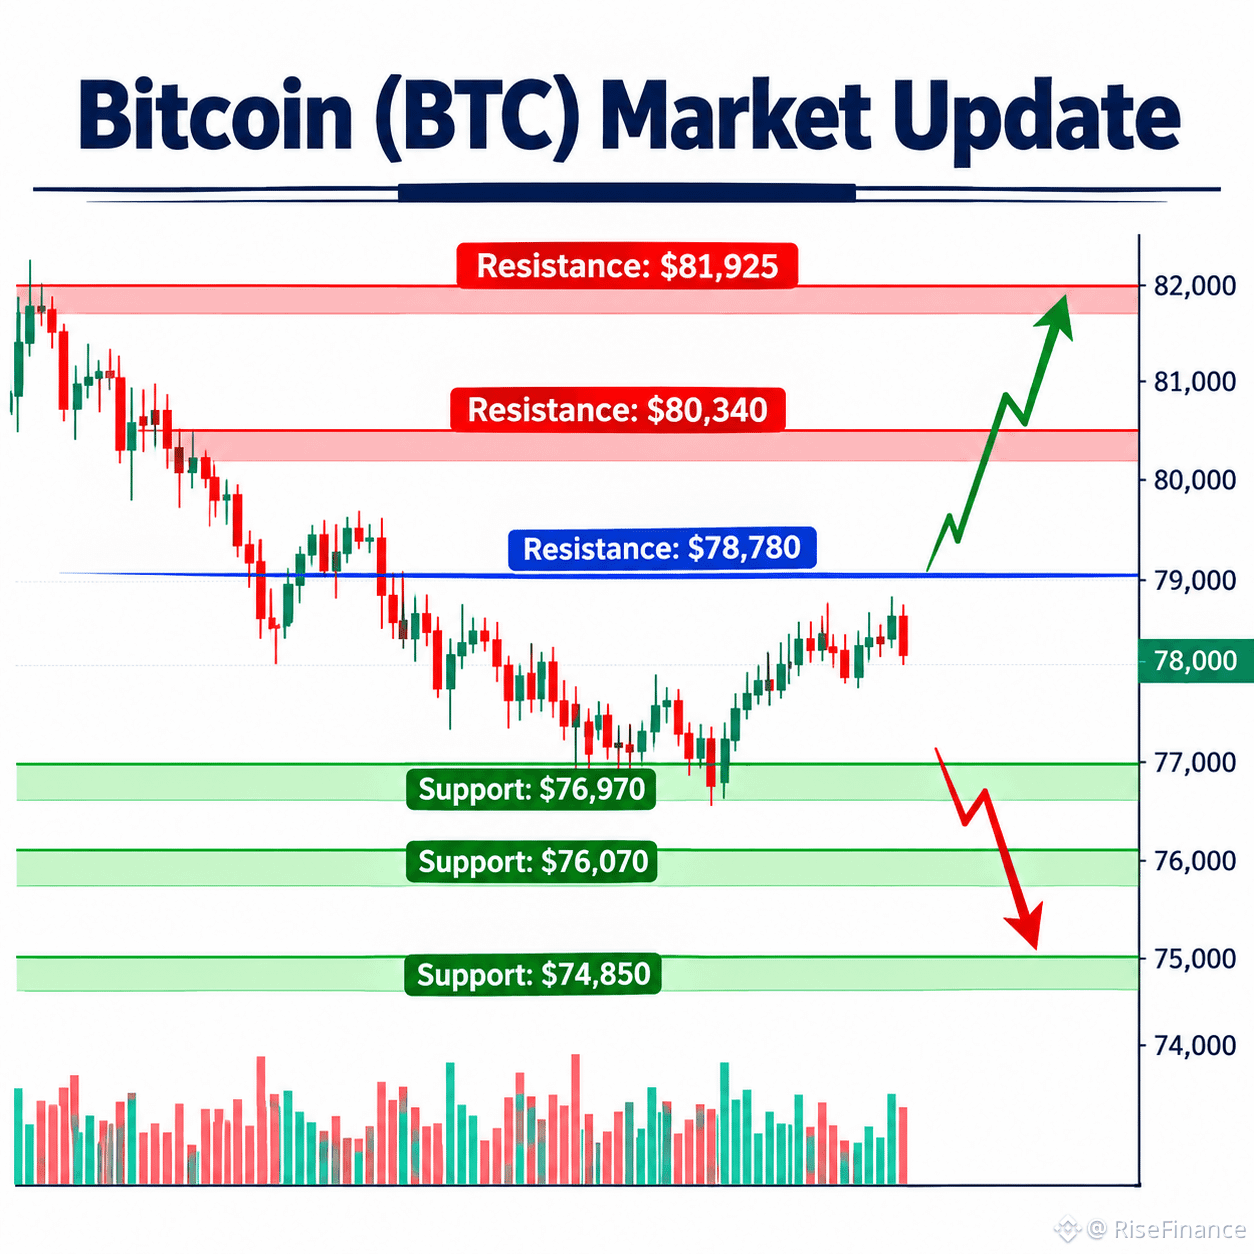
43
·
--
Übersetzung ansehen
$BTC Bitcoin (BTC) Market Update 📊
Current Price: Around $78,000
Market Trend: Bitcoin is showing a mixed market structure. Short-term momentum remains weak, while the broader trend is still trying to recover. Buyers and sellers are fighting around the $78K zone.
Key Support Levels:
- $76,970
- $76,070
- $75,000
Key Resistance Levels:
- $78,780
- $80,330
- $81,900
Bullish Scenario 🟢
If BTC holds above $76,970 and breaks through $78,780 with strong trading volume, buyers could push the price toward $80,330 and potentially $81,900.
Bearish Scenario 🔴
If Bitcoin loses the $76,970 support, selling pressure could increase. A further decline may bring $76,070 and $75,000 into focus.
Risk Management ⚠️
Avoid entering trades based on emotions. Wait for confirmed breakouts, use proper stop-loss levels, and keep position sizes under control. Always consider market volatility.
Final Thoughts:
Bitcoin is at an important decision zone. A confirmed breakout above resistance could improve market sentiment, while a breakdown below support may increase bearish pressure. Watch price action and volume before making any decisions.
Disclaimer: This analysis is for educational purposes only and is not financial advice. Cryptocurrency trading involves significant risk.
#BinanceUpdatesProofofReservesAddresses #BinanceToResumePhaseOneOfWithdrawals #BinanceSAFUFundTransferCompleted7499BTC #CZDismissesClaimsBinanceHackWasPredicted #YiHe:ProofOfReserves:10TokensAt100%Backing
{spot}(BTCUSDT)
$BTC Bitcoin (BTC) Market Update 📊
Current Price: Around $78,000
Market Trend: Bitcoin is showing a mixed market structure. Short-term momentum remains weak, while the broader trend is still trying to recover. Buyers and sellers are fighting around the $78K zone.
Key Support Levels:
- $76,970
- $76,070
- $75,000
Key Resistance Levels:
- $78,780
- $80,330
- $81,900
Bullish Scenario 🟢
If BTC holds above $76,970 and breaks through $78,780 with strong trading volume, buyers could push the price toward $80,330 and potentially $81,900.
Bearish Scenario 🔴
If Bitcoin loses the $76,970 support, selling pressure could increase. A further decline may bring $76,070 and $75,000 into focus.
Risk Management ⚠️
Avoid entering trades based on emotions. Wait for confirmed breakouts, use proper stop-loss levels, and keep position sizes under control. Always consider market volatility.
Final Thoughts:
Bitcoin is at an important decision zone. A confirmed breakout above resistance could improve market sentiment, while a breakdown below support may increase bearish pressure. Watch price action and volume before making any decisions.
Disclaimer: This analysis is for educational purposes only and is not financial advice. Cryptocurrency trading involves significant risk.
#BinanceUpdatesProofofReservesAddresses #BinanceToResumePhaseOneOfWithdrawals #BinanceSAFUFundTransferCompleted7499BTC #CZDismissesClaimsBinanceHackWasPredicted #YiHe:ProofOfReserves:10TokensAt100%Backing
Current Price: Around $78,000
Market Trend: Bitcoin is showing a mixed market structure. Short-term momentum remains weak, while the broader trend is still trying to recover. Buyers and sellers are fighting around the $78K zone.
Key Support Levels:
- $76,970
- $76,070
- $75,000
Key Resistance Levels:
- $78,780
- $80,330
- $81,900
Bullish Scenario 🟢
If BTC holds above $76,970 and breaks through $78,780 with strong trading volume, buyers could push the price toward $80,330 and potentially $81,900.
Bearish Scenario 🔴
If Bitcoin loses the $76,970 support, selling pressure could increase. A further decline may bring $76,070 and $75,000 into focus.
Risk Management ⚠️
Avoid entering trades based on emotions. Wait for confirmed breakouts, use proper stop-loss levels, and keep position sizes under control. Always consider market volatility.
Final Thoughts:
Bitcoin is at an important decision zone. A confirmed breakout above resistance could improve market sentiment, while a breakdown below support may increase bearish pressure. Watch price action and volume before making any decisions.
Disclaimer: This analysis is for educational purposes only and is not financial advice. Cryptocurrency trading involves significant risk.
#BinanceUpdatesProofofReservesAddresses #BinanceToResumePhaseOneOfWithdrawals #BinanceSAFUFundTransferCompleted7499BTC #CZDismissesClaimsBinanceHackWasPredicted #YiHe:ProofOfReserves:10TokensAt100%Backing
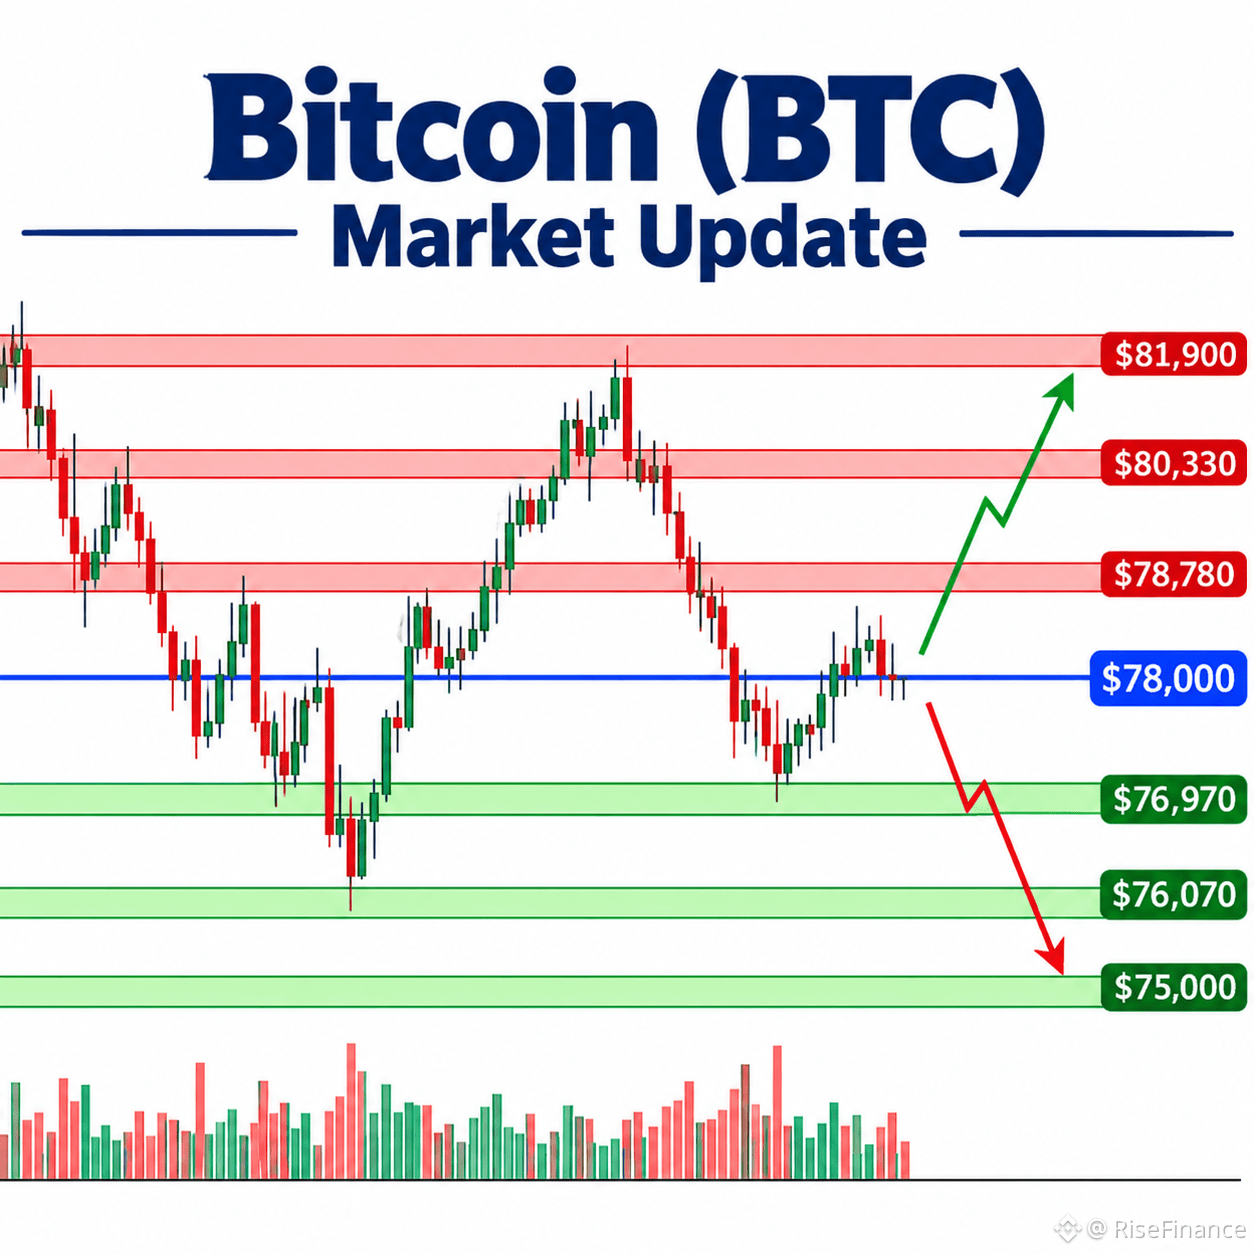
45
·
--
Übersetzung ansehen
$BTC Bitcoin (BTC) Market Update 📊
Current Price: Around $77,850
Market Trend: Bearish with a short-term recovery attempt.
Bitcoin is showing signs of a modest recovery after recent selling pressure. However, the broader short-term structure remains weak, and buyers still need to overcome key resistance levels to confirm a stronger reversal.
Key Support Levels:
- $76,600 – Immediate support
- $75,000 – Major support zone
Key Resistance Levels:
- $78,000 – Immediate resistance
- $78,900 – Next resistance
- $80,700 – Major resistance
📈 Bullish Scenario:
If BTC breaks above $78,000 and holds this level, buyers could push the price toward $78,900 and potentially $80,700.
📉 Bearish Scenario:
If Bitcoin fails to hold $76,600, selling pressure could increase, bringing $75,000 into focus.
⚠️ Risk Management:
Watch for candle-closing confirmation before reacting to breakouts. Avoid excessive leverage, use appropriate stop-loss levels, and never risk more than you can afford to lose.
Final Thoughts:
Bitcoin is at an important decision zone. The next move will depend on whether buyers can reclaim resistance or sellers push the price below support. Patience and confirmation remain important.
Disclaimer: This analysis is for educational purposes only and is not financial advice. Cryptocurrency trading involves significant risk. Always do your own research (DYOR).
#BinanceUpdatesProofofReservesAddresses #BinanceToResumePhaseOneOfWithdrawals #BinanceSAFUFundTransferCompleted7499BTC #CZDismissesClaimsBinanceHackWasPredicted #YiHe:ProofOfReserves:10TokensAt100%Backing
{spot}(BTCUSDT)
$BTC Bitcoin (BTC) Market Update 📊
Current Price: Around $77,850
Market Trend: Bearish with a short-term recovery attempt.
Bitcoin is showing signs of a modest recovery after recent selling pressure. However, the broader short-term structure remains weak, and buyers still need to overcome key resistance levels to confirm a stronger reversal.
Key Support Levels:
- $76,600 – Immediate support
- $75,000 – Major support zone
Key Resistance Levels:
- $78,000 – Immediate resistance
- $78,900 – Next resistance
- $80,700 – Major resistance
📈 Bullish Scenario:
If BTC breaks above $78,000 and holds this level, buyers could push the price toward $78,900 and potentially $80,700.
📉 Bearish Scenario:
If Bitcoin fails to hold $76,600, selling pressure could increase, bringing $75,000 into focus.
⚠️ Risk Management:
Watch for candle-closing confirmation before reacting to breakouts. Avoid excessive leverage, use appropriate stop-loss levels, and never risk more than you can afford to lose.
Final Thoughts:
Bitcoin is at an important decision zone. The next move will depend on whether buyers can reclaim resistance or sellers push the price below support. Patience and confirmation remain important.
Disclaimer: This analysis is for educational purposes only and is not financial advice. Cryptocurrency trading involves significant risk. Always do your own research (DYOR).
#BinanceUpdatesProofofReservesAddresses #BinanceToResumePhaseOneOfWithdrawals #BinanceSAFUFundTransferCompleted7499BTC #CZDismissesClaimsBinanceHackWasPredicted #YiHe:ProofOfReserves:10TokensAt100%Backing
Current Price: Around $77,850
Market Trend: Bearish with a short-term recovery attempt.
Bitcoin is showing signs of a modest recovery after recent selling pressure. However, the broader short-term structure remains weak, and buyers still need to overcome key resistance levels to confirm a stronger reversal.
Key Support Levels:
- $76,600 – Immediate support
- $75,000 – Major support zone
Key Resistance Levels:
- $78,000 – Immediate resistance
- $78,900 – Next resistance
- $80,700 – Major resistance
📈 Bullish Scenario:
If BTC breaks above $78,000 and holds this level, buyers could push the price toward $78,900 and potentially $80,700.
📉 Bearish Scenario:
If Bitcoin fails to hold $76,600, selling pressure could increase, bringing $75,000 into focus.
⚠️ Risk Management:
Watch for candle-closing confirmation before reacting to breakouts. Avoid excessive leverage, use appropriate stop-loss levels, and never risk more than you can afford to lose.
Final Thoughts:
Bitcoin is at an important decision zone. The next move will depend on whether buyers can reclaim resistance or sellers push the price below support. Patience and confirmation remain important.
Disclaimer: This analysis is for educational purposes only and is not financial advice. Cryptocurrency trading involves significant risk. Always do your own research (DYOR).
#BinanceUpdatesProofofReservesAddresses #BinanceToResumePhaseOneOfWithdrawals #BinanceSAFUFundTransferCompleted7499BTC #CZDismissesClaimsBinanceHackWasPredicted #YiHe:ProofOfReserves:10TokensAt100%Backing
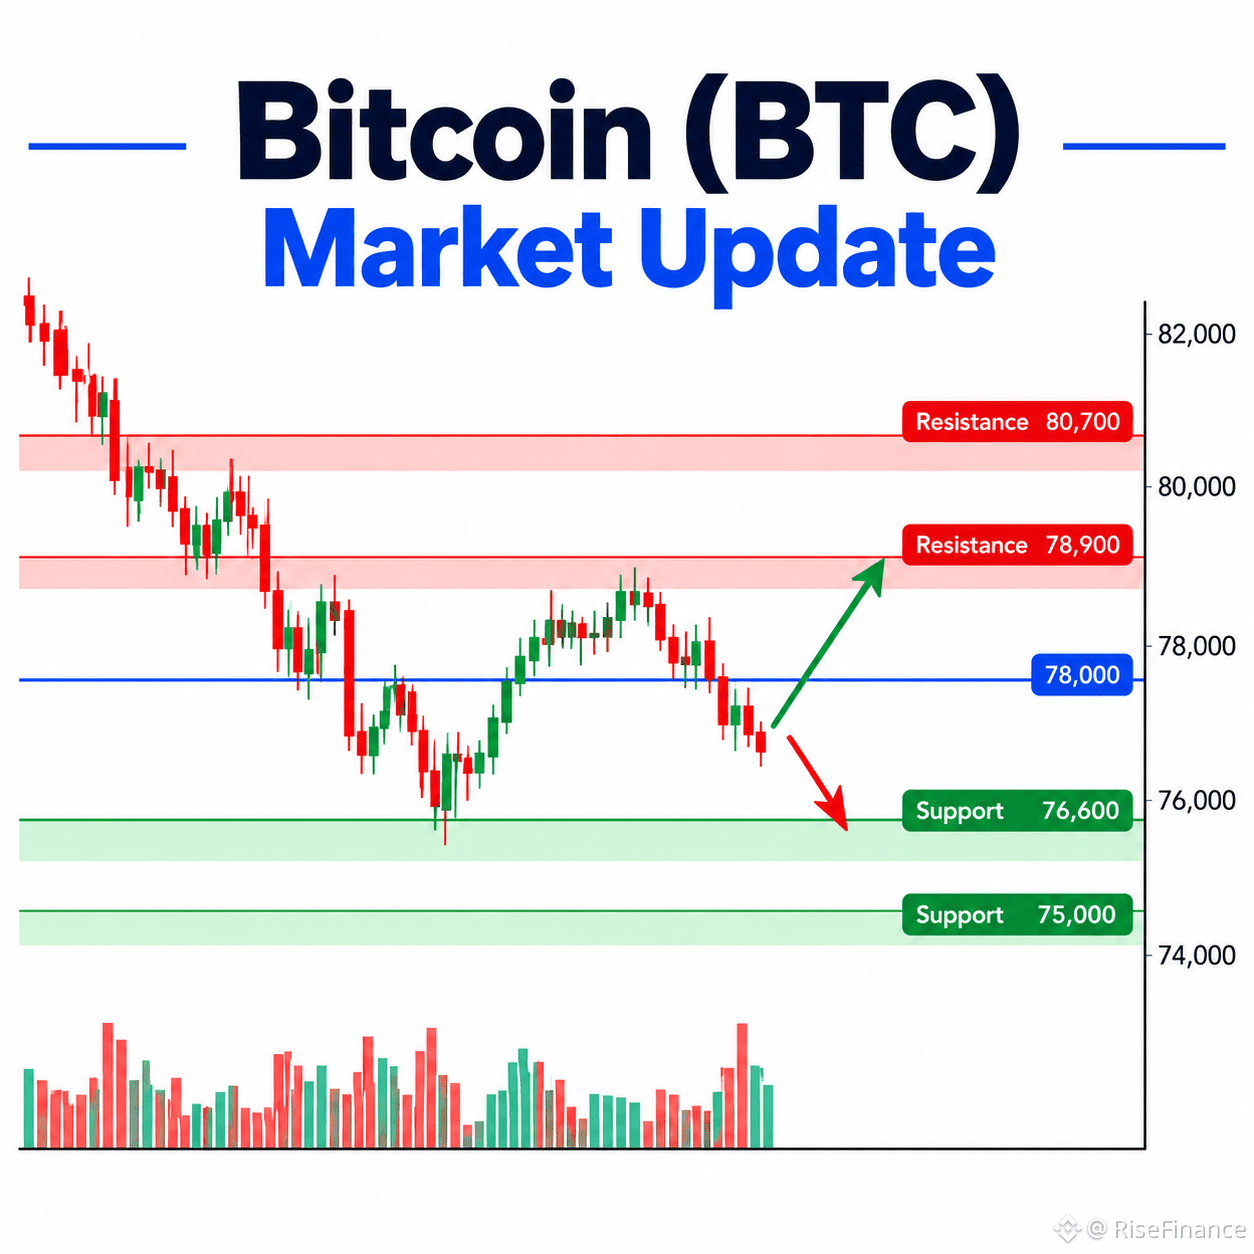
45
·
--
$BTC Bitcoin (BTC) Marktupdate | 1. November 2026
Markttrend: Bitcoin wird nahe 77.761 $ gehandelt und verzeichnet eine leichte Erholung innerhalb von 24 Stunden. Die übergeordnete kurzfristige Struktur bleibt jedoch bärisch, da BTC kürzlich unter die Marke von 80.000 $ gefallen ist. Käufer benötigen mehr Momentum, um eine nachhaltige Erholung zu bestätigen.
**Wichtige Unterstützungsniveaus:**
- 77.000–76.000 $: Unmittelbare Unterstützungszone
- 75.000 $: Wichtige Unterstützung, die es zu beobachten gilt
**Wichtige Widerstandsniveaus:**
- 78.500–80.000 $: Unmittelbare Widerstandszone
- 82.000 $: Mögliches Erholungsziel, falls das bullische Momentum zunimmt
**Bullisches Szenario:** Hält sich BTC über 76.000 $ und steigt bei hohem Handelsvolumen über 80.000 $, könnte der Preis in Richtung 82.000 $ steigen.
**Bärisches Szenario:** Fällt BTC unter die Unterstützungszone bei 76.000 $, könnte Verkaufsdruck den Preis auf 75.000 $ oder darunter drücken.
**Risikomanagement:** Achten Sie auf Kerzenschlusskurse und Handelsvolumen, bevor Sie einen Ausbruch bestätigen. Vermeiden Sie emotionale Entscheidungen, wählen Sie eine angemessene Positionsgröße und legen Sie Stop-Loss-Marken entsprechend Ihrer Risikotoleranz fest.
**Fazit:** Bitcoin befindet sich an einem kritischen Punkt, an dem Käufer ihre Stärke unter Beweis stellen müssen. Der nächste bestätigte Ausbruch nach oben oder unten könnte eine klarere Richtung vorgeben.
*Haftungsausschluss: Dieser Inhalt dient ausschließlich Bildungszwecken und stellt keine Finanzberatung dar. Kryptowährungsmärkte sind sehr volatil, und Verluste sind möglich.*
#BinanceUpdatesProofofReservesAddresses #BinanceToResumePhaseOneOfWithdrawals #BinanceSAFUFundTransferCompleted7499BTC #CZDismissesClaimsBinanceHackWasPredicted #YiHe:ProofOfReserves:10TokensAt100%Backing
{spot}(BTCUSDT)
$BTC Bitcoin (BTC) Marktupdate | 1. November 2026
Markttrend: Bitcoin wird nahe 77.761 $ gehandelt und verzeichnet eine leichte Erholung innerhalb von 24 Stunden. Die übergeordnete kurzfristige Struktur bleibt jedoch bärisch, da BTC kürzlich unter die Marke von 80.000 $ gefallen ist. Käufer benötigen mehr Momentum, um eine nachhaltige Erholung zu bestätigen.
**Wichtige Unterstützungsniveaus:**
- 77.000–76.000 $: Unmittelbare Unterstützungszone
- 75.000 $: Wichtige Unterstützung, die es zu beobachten gilt
**Wichtige Widerstandsniveaus:**
- 78.500–80.000 $: Unmittelbare Widerstandszone
- 82.000 $: Mögliches Erholungsziel, falls das bullische Momentum zunimmt
**Bullisches Szenario:** Hält sich BTC über 76.000 $ und steigt bei hohem Handelsvolumen über 80.000 $, könnte der Preis in Richtung 82.000 $ steigen.
**Bärisches Szenario:** Fällt BTC unter die Unterstützungszone bei 76.000 $, könnte Verkaufsdruck den Preis auf 75.000 $ oder darunter drücken.
**Risikomanagement:** Achten Sie auf Kerzenschlusskurse und Handelsvolumen, bevor Sie einen Ausbruch bestätigen. Vermeiden Sie emotionale Entscheidungen, wählen Sie eine angemessene Positionsgröße und legen Sie Stop-Loss-Marken entsprechend Ihrer Risikotoleranz fest.
**Fazit:** Bitcoin befindet sich an einem kritischen Punkt, an dem Käufer ihre Stärke unter Beweis stellen müssen. Der nächste bestätigte Ausbruch nach oben oder unten könnte eine klarere Richtung vorgeben.
*Haftungsausschluss: Dieser Inhalt dient ausschließlich Bildungszwecken und stellt keine Finanzberatung dar. Kryptowährungsmärkte sind sehr volatil, und Verluste sind möglich.*
#BinanceUpdatesProofofReservesAddresses #BinanceToResumePhaseOneOfWithdrawals #BinanceSAFUFundTransferCompleted7499BTC #CZDismissesClaimsBinanceHackWasPredicted #YiHe:ProofOfReserves:10TokensAt100%Backing
Markttrend: Bitcoin wird nahe 77.761 $ gehandelt und verzeichnet eine leichte Erholung innerhalb von 24 Stunden. Die übergeordnete kurzfristige Struktur bleibt jedoch bärisch, da BTC kürzlich unter die Marke von 80.000 $ gefallen ist. Käufer benötigen mehr Momentum, um eine nachhaltige Erholung zu bestätigen.
**Wichtige Unterstützungsniveaus:**
- 77.000–76.000 $: Unmittelbare Unterstützungszone
- 75.000 $: Wichtige Unterstützung, die es zu beobachten gilt
**Wichtige Widerstandsniveaus:**
- 78.500–80.000 $: Unmittelbare Widerstandszone
- 82.000 $: Mögliches Erholungsziel, falls das bullische Momentum zunimmt
**Bullisches Szenario:** Hält sich BTC über 76.000 $ und steigt bei hohem Handelsvolumen über 80.000 $, könnte der Preis in Richtung 82.000 $ steigen.
**Bärisches Szenario:** Fällt BTC unter die Unterstützungszone bei 76.000 $, könnte Verkaufsdruck den Preis auf 75.000 $ oder darunter drücken.
**Risikomanagement:** Achten Sie auf Kerzenschlusskurse und Handelsvolumen, bevor Sie einen Ausbruch bestätigen. Vermeiden Sie emotionale Entscheidungen, wählen Sie eine angemessene Positionsgröße und legen Sie Stop-Loss-Marken entsprechend Ihrer Risikotoleranz fest.
**Fazit:** Bitcoin befindet sich an einem kritischen Punkt, an dem Käufer ihre Stärke unter Beweis stellen müssen. Der nächste bestätigte Ausbruch nach oben oder unten könnte eine klarere Richtung vorgeben.
*Haftungsausschluss: Dieser Inhalt dient ausschließlich Bildungszwecken und stellt keine Finanzberatung dar. Kryptowährungsmärkte sind sehr volatil, und Verluste sind möglich.*
#BinanceUpdatesProofofReservesAddresses #BinanceToResumePhaseOneOfWithdrawals #BinanceSAFUFundTransferCompleted7499BTC #CZDismissesClaimsBinanceHackWasPredicted #YiHe:ProofOfReserves:10TokensAt100%Backing
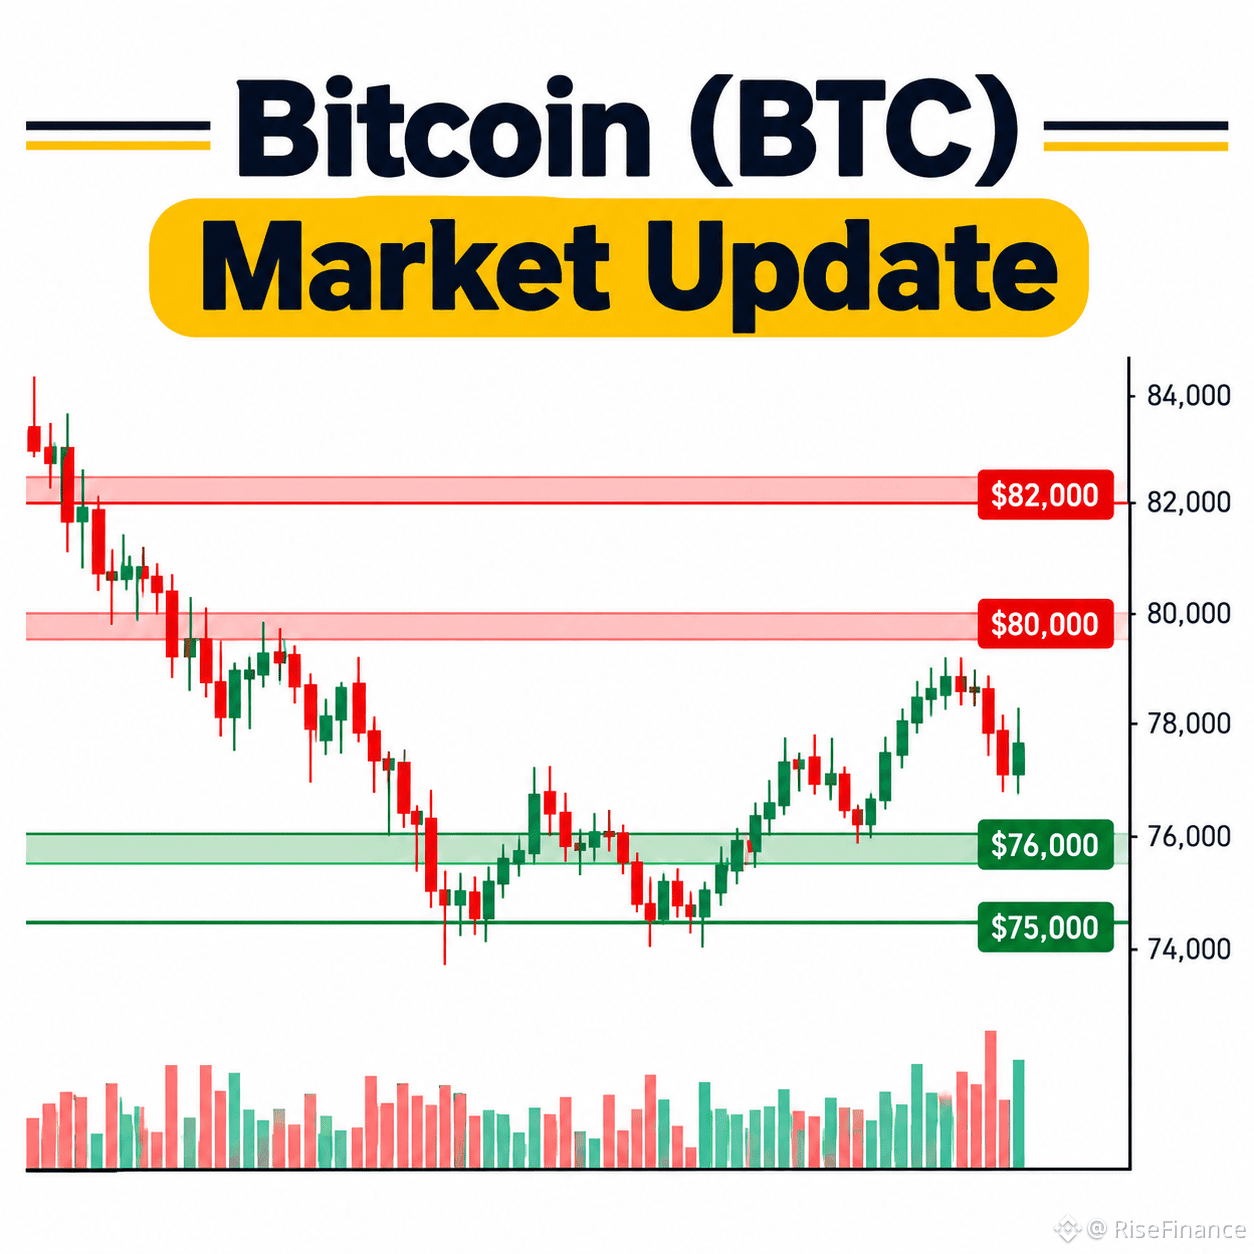
72
Anmelden und weiter Inhalte entdecken
Krypto-Nutzer weltweit auf Binance Square kennenlernen
⚡️ Bleib in Sachen Krypto stets am Puls.
💬 Die weltgrößte Kryptobörse vertraut darauf.
👍 Erhalte verlässliche Einblicke von verifizierten Creators.
E-Mail-Adresse/Telefonnummer
Trendthemen
BinanceReopensWithdrawalsForMoreAssets
42,202 Aufrufe
910 Kommentare
Sicherheitsvorfall | Update zur Wiederherstellung Nr. 6: Auszahlungen für weitere Assets werden wieder aufgenommen (2026-11-03)
Binance Announcement
·177 Likes
·489k Aufrufe
AppleReportsMixedResults
25,171 Aufrufe
646 Kommentare
BinanceHourlyDepositsExceedWithdrawals
11,752 Aufrufe
302 Kommentare