
Usman_trading_co
5 Beiträge

Usman_trading_co
Melden
Nutzer blockieren
0 Following
0 Follower
0 Like gegeben
Beiträge
·
--
Bärisch
Übersetzung ansehen
PEPE/USDT Market Update: Testing Key Levels! 🐸📉
Looking at the current 15m chart, PEPE is showing some interesting volatility. Here is a quick breakdown of the current market condition:
Current Price: $0.00000403 (Down ~6.06% in the last 24h)
24h Range: Low of $0.0000369 📉 | High of $0.0000431 📈
Volume: Strong trading activity with 16.97T PEPE ($66.70M USDT) traded.
Bollinger Bands (BOLL): The price is bouncing back toward the middle band ($0.0000401) after touching a low of $0.0000369, showing signs of a potential short-term recovery or consolidation.
What's your next move?
Are we about to see a bullish rebound from here, or is a deeper dip coming? Drop your thoughts and trading strategies in the comments below! 👇
#pepe #CryptoTrading #BİNANCESQUARE #memecoin s #TechnicalAnalysis_Tickeron
{spot}(PEPEUSDT)
PEPE/USDT Market Update: Testing Key Levels! 🐸📉
Looking at the current 15m chart, PEPE is showing some interesting volatility. Here is a quick breakdown of the current market condition:
Current Price: $0.00000403 (Down ~6.06% in the last 24h)
24h Range: Low of $0.0000369 📉 | High of $0.0000431 📈
Volume: Strong trading activity with 16.97T PEPE ($66.70M USDT) traded.
Bollinger Bands (BOLL): The price is bouncing back toward the middle band ($0.0000401) after touching a low of $0.0000369, showing signs of a potential short-term recovery or consolidation.
What's your next move?
Are we about to see a bullish rebound from here, or is a deeper dip coming? Drop your thoughts and trading strategies in the comments below! 👇
#pepe #CryptoTrading #BİNANCESQUARE #memecoin s #TechnicalAnalysis_Tickeron
Looking at the current 15m chart, PEPE is showing some interesting volatility. Here is a quick breakdown of the current market condition:
Current Price: $0.00000403 (Down ~6.06% in the last 24h)
24h Range: Low of $0.0000369 📉 | High of $0.0000431 📈
Volume: Strong trading activity with 16.97T PEPE ($66.70M USDT) traded.
Bollinger Bands (BOLL): The price is bouncing back toward the middle band ($0.0000401) after touching a low of $0.0000369, showing signs of a potential short-term recovery or consolidation.
What's your next move?
Are we about to see a bullish rebound from here, or is a deeper dip coming? Drop your thoughts and trading strategies in the comments below! 👇
#pepe #CryptoTrading #BİNANCESQUARE #memecoin s #TechnicalAnalysis_Tickeron
113
Artikel
Übersetzung ansehen
Read it before it's too late{spot}(USDEBUSDT)
USDEB/USDT Analysis: Is This the Right Time to Buy?
If you are tracking tokenized stocks on Binance, you might have noticed StablecoinX (USDEB) taking a significant hit recently. Let’s break down the current market structure and whether it’s a smart entry point right now.
📊 Current Market Overview
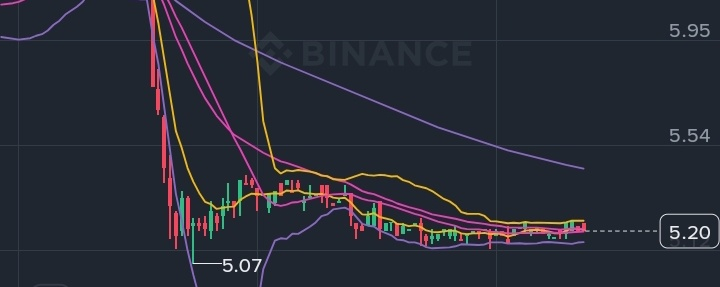
Price Action: USDEB has dropped sharply from its 24-hour high of $6.38 down to $5.07, currently consolidating around $5.20 (-16.93%).
Wider Trend: Looking at the bigger picture, the token is down -20.97% over the last 7 days and -55.82% over the past 30 days, keeping a strong bearish momentum intact.
Technical Setup: On the 15-minute chart, price action has slowed down with Bollinger Bands tightening, indicating a quiet phase before the next major move.
⚠️ Why Buying Right Now is Risky
Upcoming Earnings (Monday, Nov 16): StablecoinX Inc. is scheduled to release its Q3 financial results very soon. Earnings reports often bring extreme volatility—strong numbers could trigger a sharp rebound, while weak data might push the price below the critical $5.00 support level.
Low Weekend Volume: With today being Saturday and traditional US stock markets closed, trading volume is quite thin, making price movements less predictable.
Falling Knife Risk: In trading, catching a falling asset without a clear reversal confirmation can lead to further drawdowns.
💡 Smart Strategy to Approach This:
Wait for Confirmation: It is generally safer to wait for the market to digest the upcoming Q3 earnings report before taking a large position.
Dollar-Cost Averaging (DCA): If you are bullish on the asset and want to enter at these levels, consider deploying only a small portion of your capital (e.g., 20%-30%) now, keeping cash ready in case it dips further.
Risk Management: Always use a strict stop-loss (e.g., just below the $5.00 psychological level) if you are opening a short-term trade.
Disclaimer: This post is for informational purposes only and does not constitute financial advice. Always do your own research before trading tokenized stocks.
Read it before it's too late
USDEB/USDT Analysis: Is This the Right Time to Buy?
If you are tracking tokenized stocks on Binance, you might have noticed StablecoinX (USDEB) taking a significant hit recently. Let’s break down the current market structure and whether it’s a smart entry point right now.
📊 Current Market Overview
Price Action: USDEB has dropped sharply from its 24-hour high of $6.38 down to $5.07, currently consolidating around $5.20 (-16.93%).
Wider Trend: Looking at the bigger picture, the token is down -20.97% over the last 7 days and -55.82% over the past 30 days, keeping a strong bearish momentum intact.
Technical Setup: On the 15-minute chart, price action has slowed down with Bollinger Bands tightening, indicating a quiet phase before the next major move.
⚠️ Why Buying Right Now is Risky
Upcoming Earnings (Monday, Nov 16): StablecoinX Inc. is scheduled to release its Q3 financial results very soon. Earnings reports often bring extreme volatility—strong numbers could trigger a sharp rebound, while weak data might push the price below the critical $5.00 support level.
Low Weekend Volume: With today being Saturday and traditional US stock markets closed, trading volume is quite thin, making price movements less predictable.
Falling Knife Risk: In trading, catching a falling asset without a clear reversal confirmation can lead to further drawdowns.
💡 Smart Strategy to Approach This:
Wait for Confirmation: It is generally safer to wait for the market to digest the upcoming Q3 earnings report before taking a large position.
Dollar-Cost Averaging (DCA): If you are bullish on the asset and want to enter at these levels, consider deploying only a small portion of your capital (e.g., 20%-30%) now, keeping cash ready in case it dips further.
Risk Management: Always use a strict stop-loss (e.g., just below the $5.00 psychological level) if you are opening a short-term trade.
Disclaimer: This post is for informational purposes only and does not constitute financial advice. Always do your own research before trading tokenized stocks.
If you are tracking tokenized stocks on Binance, you might have noticed StablecoinX (USDEB) taking a significant hit recently. Let’s break down the current market structure and whether it’s a smart entry point right now.
📊 Current Market Overview
Price Action: USDEB has dropped sharply from its 24-hour high of $6.38 down to $5.07, currently consolidating around $5.20 (-16.93%).
Wider Trend: Looking at the bigger picture, the token is down -20.97% over the last 7 days and -55.82% over the past 30 days, keeping a strong bearish momentum intact.
Technical Setup: On the 15-minute chart, price action has slowed down with Bollinger Bands tightening, indicating a quiet phase before the next major move.
⚠️ Why Buying Right Now is Risky
Upcoming Earnings (Monday, Nov 16): StablecoinX Inc. is scheduled to release its Q3 financial results very soon. Earnings reports often bring extreme volatility—strong numbers could trigger a sharp rebound, while weak data might push the price below the critical $5.00 support level.
Low Weekend Volume: With today being Saturday and traditional US stock markets closed, trading volume is quite thin, making price movements less predictable.
Falling Knife Risk: In trading, catching a falling asset without a clear reversal confirmation can lead to further drawdowns.
💡 Smart Strategy to Approach This:
Wait for Confirmation: It is generally safer to wait for the market to digest the upcoming Q3 earnings report before taking a large position.
Dollar-Cost Averaging (DCA): If you are bullish on the asset and want to enter at these levels, consider deploying only a small portion of your capital (e.g., 20%-30%) now, keeping cash ready in case it dips further.
Risk Management: Always use a strict stop-loss (e.g., just below the $5.00 psychological level) if you are opening a short-term trade.
Disclaimer: This post is for informational purposes only and does not constitute financial advice. Always do your own research before trading tokenized stocks.
80
Übersetzung ansehen
Navigating the Current Market Storm: Why Bitcoin Dropped Below $70,000 and What’s NextThe cryptocurrency market has entered a turbulent phase as Bitcoin ($BTC) slipped below the crucial psychological support level of $70,000, testing lows around $68,000. This sharp pullback has sent shockwaves through the broader digital asset ecosystem, raising fresh questions about short-term momentum and macro pressures.
Here is a breakdown of what is driving the current market trend and what traders should watch closely.
1. What Triggered the Recent Market Pullback?
Macro & Interest Rate Pressures: A resurgent
{spot}(BTCUSDT)
U.S. dollar and shifting expectations around Federal Reserve rate cuts have dampened risk appetite across global financial markets, with investors re-evaluating risk assets.
Liquidation Cascade: The breakdown below $70,000 triggered heavy liquidations, flushing out over-leveraged long positions and accelerating downside momentum.
Broader Market Sentiment: With the Fear & Greed Index dipping into extreme fear territory, market participants are displaying heightened caution amidst ongoing macro volatility and equity market fluctuations.
2. Key Technical Levels to Watch
Support Zones: Bulls are currently fighting to stabilize price action near the $68,000–$69,000 range. If this zone holds, it could pave the way for a relief bounce. However, a breakdown below support could expose lower levels around the 200-week moving average and deeper support tiers.
Resistance Hurdles: For Bitcoin to regain its bullish structure, it must decisively reclaim the $70,000 mark and clear overhead resistance near $74,000 before challenging higher targets.3. Strategy for Crypto Traders
In high-volatility environments like this, emotional trading is the fastest way to take losses.
Prioritize Risk Management: Avoid high-leverage trades and ensure strict stop-loss measures are in place.
Avoid FOMO / Panic Selling: Sharp sell-offs often test investor patience, but disciplined traders wait for clear confirmation of trend stabilization rather than chasing red candles.Are you looking to buy the dip or waiting on the sidelines for a confirmed trend reversal? Share your thoughts below! 👇
#CryptoMarket #BTC #BinanceSquare #MarketTrends #TradingInsights
Navigating the Current Market Storm: Why Bitcoin Dropped Below $70,000 and What’s Next
The cryptocurrency market has entered a turbulent phase as Bitcoin ($BTC) slipped below the crucial psychological support level of $70,000, testing lows around $68,000. This sharp pullback has sent shockwaves through the broader digital asset ecosystem, raising fresh questions about short-term momentum and macro pressures.
Here is a breakdown of what is driving the current market trend and what traders should watch closely.
1. What Triggered the Recent Market Pullback?
Macro & Interest Rate Pressures: A resurgent
U.S. dollar and shifting expectations around Federal Reserve rate cuts have dampened risk appetite across global financial markets, with investors re-evaluating risk assets.
Liquidation Cascade: The breakdown below $70,000 triggered heavy liquidations, flushing out over-leveraged long positions and accelerating downside momentum.
Broader Market Sentiment: With the Fear & Greed Index dipping into extreme fear territory, market participants are displaying heightened caution amidst ongoing macro volatility and equity market fluctuations.
2. Key Technical Levels to Watch
Support Zones: Bulls are currently fighting to stabilize price action near the $68,000–$69,000 range. If this zone holds, it could pave the way for a relief bounce. However, a breakdown below support could expose lower levels around the 200-week moving average and deeper support tiers.
Resistance Hurdles: For Bitcoin to regain its bullish structure, it must decisively reclaim the $70,000 mark and clear overhead resistance near $74,000 before challenging higher targets.3. Strategy for Crypto Traders
In high-volatility environments like this, emotional trading is the fastest way to take losses.
Prioritize Risk Management: Avoid high-leverage trades and ensure strict stop-loss measures are in place.
Avoid FOMO / Panic Selling: Sharp sell-offs often test investor patience, but disciplined traders wait for clear confirmation of trend stabilization rather than chasing red candles.Are you looking to buy the dip or waiting on the sidelines for a confirmed trend reversal? Share your thoughts below! 👇
#CryptoMarket #BTC #BinanceSquare #MarketTrends #TradingInsights
Here is a breakdown of what is driving the current market trend and what traders should watch closely.
1. What Triggered the Recent Market Pullback?
Macro & Interest Rate Pressures: A resurgent
U.S. dollar and shifting expectations around Federal Reserve rate cuts have dampened risk appetite across global financial markets, with investors re-evaluating risk assets.
Liquidation Cascade: The breakdown below $70,000 triggered heavy liquidations, flushing out over-leveraged long positions and accelerating downside momentum.
Broader Market Sentiment: With the Fear & Greed Index dipping into extreme fear territory, market participants are displaying heightened caution amidst ongoing macro volatility and equity market fluctuations.
2. Key Technical Levels to Watch
Support Zones: Bulls are currently fighting to stabilize price action near the $68,000–$69,000 range. If this zone holds, it could pave the way for a relief bounce. However, a breakdown below support could expose lower levels around the 200-week moving average and deeper support tiers.
Resistance Hurdles: For Bitcoin to regain its bullish structure, it must decisively reclaim the $70,000 mark and clear overhead resistance near $74,000 before challenging higher targets.3. Strategy for Crypto Traders
In high-volatility environments like this, emotional trading is the fastest way to take losses.
Prioritize Risk Management: Avoid high-leverage trades and ensure strict stop-loss measures are in place.
Avoid FOMO / Panic Selling: Sharp sell-offs often test investor patience, but disciplined traders wait for clear confirmation of trend stabilization rather than chasing red candles.Are you looking to buy the dip or waiting on the sidelines for a confirmed trend reversal? Share your thoughts below! 👇
#CryptoMarket #BTC #BinanceSquare #MarketTrends #TradingInsights
139
{spot}(BTCUSDT)
😉Bitcoin (BTC/USDT) – Marktüberblick
Aktueller Preis und Rückgang: Bitcoin wird bei etwa 69.129 bis 69.149 $ gehandelt und steht unter starkem Abwärtsdruck. Der Tagesverlust beträgt ungefähr -3,65 % bis -4,01 %.
Trend und Zeiträume: In den vergangenen 7 Tagen ist BTC um etwa -9,14 % gefallen. Das spiegelt die anhaltende Volatilität und Unsicherheit am Markt wider.
Aktivität im Orderbuch: Das Orderbuch zeigt starke Verschiebungen zwischen Kaufgeboten und Verkaufsangeboten. Dies deutet auf eine hohe Anspannung am Markt hin, während Händler nahe der Unterstützung bei 69.000 $ um die Oberhand kämpfen.
#BTC
😉Bitcoin (BTC/USDT) – Marktüberblick
Aktueller Preis und Rückgang: Bitcoin wird bei etwa 69.129 bis 69.149 $ gehandelt und steht unter starkem Abwärtsdruck. Der Tagesverlust beträgt ungefähr -3,65 % bis -4,01 %.
Trend und Zeiträume: In den vergangenen 7 Tagen ist BTC um etwa -9,14 % gefallen. Das spiegelt die anhaltende Volatilität und Unsicherheit am Markt wider.
Aktivität im Orderbuch: Das Orderbuch zeigt starke Verschiebungen zwischen Kaufgeboten und Verkaufsangeboten. Dies deutet auf eine hohe Anspannung am Markt hin, während Händler nahe der Unterstützung bei 69.000 $ um die Oberhand kämpfen.
#BTC
Aktueller Preis und Rückgang: Bitcoin wird bei etwa 69.129 bis 69.149 $ gehandelt und steht unter starkem Abwärtsdruck. Der Tagesverlust beträgt ungefähr -3,65 % bis -4,01 %.
Trend und Zeiträume: In den vergangenen 7 Tagen ist BTC um etwa -9,14 % gefallen. Das spiegelt die anhaltende Volatilität und Unsicherheit am Markt wider.
Aktivität im Orderbuch: Das Orderbuch zeigt starke Verschiebungen zwischen Kaufgeboten und Verkaufsangeboten. Dies deutet auf eine hohe Anspannung am Markt hin, während Händler nahe der Unterstützung bei 69.000 $ um die Oberhand kämpfen.
#BTC
109
·
--
Bärisch
Warum ist der Kryptomarkt heute eingebrochen? Bitcoin fällt unter 70.000 $
Der Kryptomarkt startete heute mit einer heftigen roten Welle in den Tag. Bitcoin ($BTC) fiel um etwa 6 % und durchbrach die wichtige Unterstützungsmarke von 70.000 $, bevor er sich bei rund 69.000 $ einpendelte.
Der plötzliche Abschwung löste innerhalb der vergangenen 24 Stunden marktweit Liquidationen im Wert von über 1,3 Milliarden $ aus und überraschte übermäßig gehebelte Long-Trader.
Was steckt hinter dem Rückgang?
Makroökonomischer Druck: Neue US-Inflationsdaten fielen höher als erwartet aus. Das dämpfte die Hoffnung auf baldige Zinssenkungen und ließ Anleger Risikoanlagen meiden.
Abflüsse aus Spot-ETFs: Die institutionelle Nachfrage legte eine Verschnaufpause ein; bei großen Bitcoin-Spot-ETFs wurden spürbare Nettoabflüsse verzeichnet.
Liquidationskaskade: Als BTC unter die psychologisch wichtige Marke von 70.000 $ fiel, beschleunigten automatisierte Stop-Loss-Aufträge und Margin Calls den Ausverkauf bei Altcoins.
Wie halten sich Altcoins?
Während Bitcoin einen kräftigen Rückschlag erlitt, zeigten große Altcoins wie Ethereum ($ETH), das sich nahe 2.000 $ hielt, und Solana ($SOL) eine relative Widerstandsfähigkeit und fingen den Verkaufsdruck besser als erwartet ab.
Was sollten Trader jetzt tun?
Die Marktstimmung ist in den Bereich „Extreme Angst“ gefallen. Historisch gesehen spülen heftige Liquidationsereignisse schwache Hände aus dem Markt und setzen die Funding-Rates zurück – oft schaffen sie damit die Voraussetzungen für eine gesündere Kursentwicklung.
Vermeide Panikverkäufe bei roten Kerzen und Rache-Trading mit hohem Hebel. Beobachte, wie BTC auf die Zone zwischen 68.000 $ und 69.000 $ reagiert, bevor du deinen nächsten Schritt machst.
Kaufst du diesen Rücksetzer oder wartest du lieber ab? Schreib deine Gedanken unten in die Kommentare! 👇
#Bitcoin $#BTC #BinanceSquareFamily e #tradingtips
Warum ist der Kryptomarkt heute eingebrochen? Bitcoin fällt unter 70.000 $
Der Kryptomarkt startete heute mit einer heftigen roten Welle in den Tag. Bitcoin ($BTC) fiel um etwa 6 % und durchbrach die wichtige Unterstützungsmarke von 70.000 $, bevor er sich bei rund 69.000 $ einpendelte.
Der plötzliche Abschwung löste innerhalb der vergangenen 24 Stunden marktweit Liquidationen im Wert von über 1,3 Milliarden $ aus und überraschte übermäßig gehebelte Long-Trader.
Was steckt hinter dem Rückgang?
Makroökonomischer Druck: Neue US-Inflationsdaten fielen höher als erwartet aus. Das dämpfte die Hoffnung auf baldige Zinssenkungen und ließ Anleger Risikoanlagen meiden.
Abflüsse aus Spot-ETFs: Die institutionelle Nachfrage legte eine Verschnaufpause ein; bei großen Bitcoin-Spot-ETFs wurden spürbare Nettoabflüsse verzeichnet.
Liquidationskaskade: Als BTC unter die psychologisch wichtige Marke von 70.000 $ fiel, beschleunigten automatisierte Stop-Loss-Aufträge und Margin Calls den Ausverkauf bei Altcoins.
Wie halten sich Altcoins?
Während Bitcoin einen kräftigen Rückschlag erlitt, zeigten große Altcoins wie Ethereum ($ETH), das sich nahe 2.000 $ hielt, und Solana ($SOL) eine relative Widerstandsfähigkeit und fingen den Verkaufsdruck besser als erwartet ab.
Was sollten Trader jetzt tun?
Die Marktstimmung ist in den Bereich „Extreme Angst“ gefallen. Historisch gesehen spülen heftige Liquidationsereignisse schwache Hände aus dem Markt und setzen die Funding-Rates zurück – oft schaffen sie damit die Voraussetzungen für eine gesündere Kursentwicklung.
Vermeide Panikverkäufe bei roten Kerzen und Rache-Trading mit hohem Hebel. Beobachte, wie BTC auf die Zone zwischen 68.000 $ und 69.000 $ reagiert, bevor du deinen nächsten Schritt machst.
Kaufst du diesen Rücksetzer oder wartest du lieber ab? Schreib deine Gedanken unten in die Kommentare! 👇
#Bitcoin $#BTC #BinanceSquareFamily e #tradingtips
Der Kryptomarkt startete heute mit einer heftigen roten Welle in den Tag. Bitcoin ($BTC) fiel um etwa 6 % und durchbrach die wichtige Unterstützungsmarke von 70.000 $, bevor er sich bei rund 69.000 $ einpendelte.
Der plötzliche Abschwung löste innerhalb der vergangenen 24 Stunden marktweit Liquidationen im Wert von über 1,3 Milliarden $ aus und überraschte übermäßig gehebelte Long-Trader.
Was steckt hinter dem Rückgang?
Makroökonomischer Druck: Neue US-Inflationsdaten fielen höher als erwartet aus. Das dämpfte die Hoffnung auf baldige Zinssenkungen und ließ Anleger Risikoanlagen meiden.
Abflüsse aus Spot-ETFs: Die institutionelle Nachfrage legte eine Verschnaufpause ein; bei großen Bitcoin-Spot-ETFs wurden spürbare Nettoabflüsse verzeichnet.
Liquidationskaskade: Als BTC unter die psychologisch wichtige Marke von 70.000 $ fiel, beschleunigten automatisierte Stop-Loss-Aufträge und Margin Calls den Ausverkauf bei Altcoins.
Wie halten sich Altcoins?
Während Bitcoin einen kräftigen Rückschlag erlitt, zeigten große Altcoins wie Ethereum ($ETH), das sich nahe 2.000 $ hielt, und Solana ($SOL) eine relative Widerstandsfähigkeit und fingen den Verkaufsdruck besser als erwartet ab.
Was sollten Trader jetzt tun?
Die Marktstimmung ist in den Bereich „Extreme Angst“ gefallen. Historisch gesehen spülen heftige Liquidationsereignisse schwache Hände aus dem Markt und setzen die Funding-Rates zurück – oft schaffen sie damit die Voraussetzungen für eine gesündere Kursentwicklung.
Vermeide Panikverkäufe bei roten Kerzen und Rache-Trading mit hohem Hebel. Beobachte, wie BTC auf die Zone zwischen 68.000 $ und 69.000 $ reagiert, bevor du deinen nächsten Schritt machst.
Kaufst du diesen Rücksetzer oder wartest du lieber ab? Schreib deine Gedanken unten in die Kommentare! 👇
#Bitcoin $#BTC #BinanceSquareFamily e #tradingtips
114
Anmelden und weiter Inhalte entdecken
Krypto-Nutzer weltweit auf Binance Square kennenlernen
⚡️ Bleib in Sachen Krypto stets am Puls.
💬 Die weltgrößte Kryptobörse vertraut darauf.
👍 Erhalte verlässliche Einblicke von verifizierten Creators.
E-Mail-Adresse/Telefonnummer
Trendthemen
CryptoSelloffTriggersMultipleWhaleLiquidations
130,789 Aufrufe
1,468 Kommentare
Krypto-Liquidationen binnen 24 Stunden über 2 Milliarden US-Dollar – 329.000 Trader ausgelöscht
Binance News
·35 Likes
·42.6k Aufrufe
USSpotXRPETFsSeeLargestWeeklyOutflowIn8Months
127,410 Aufrufe
1,406 Kommentare
WillFOMCMinutesReinforceRateHikeExpectations?
33,427 Aufrufe
619 Kommentare