
MA Official
6 Beiträge

MA Official
Melden
Nutzer blockieren
Trade eröffnen
Gelegenheitstrader
4.6 Jahre
8 Following
1 Follower
2 Like gegeben
Beiträge
Portfolio
·
--
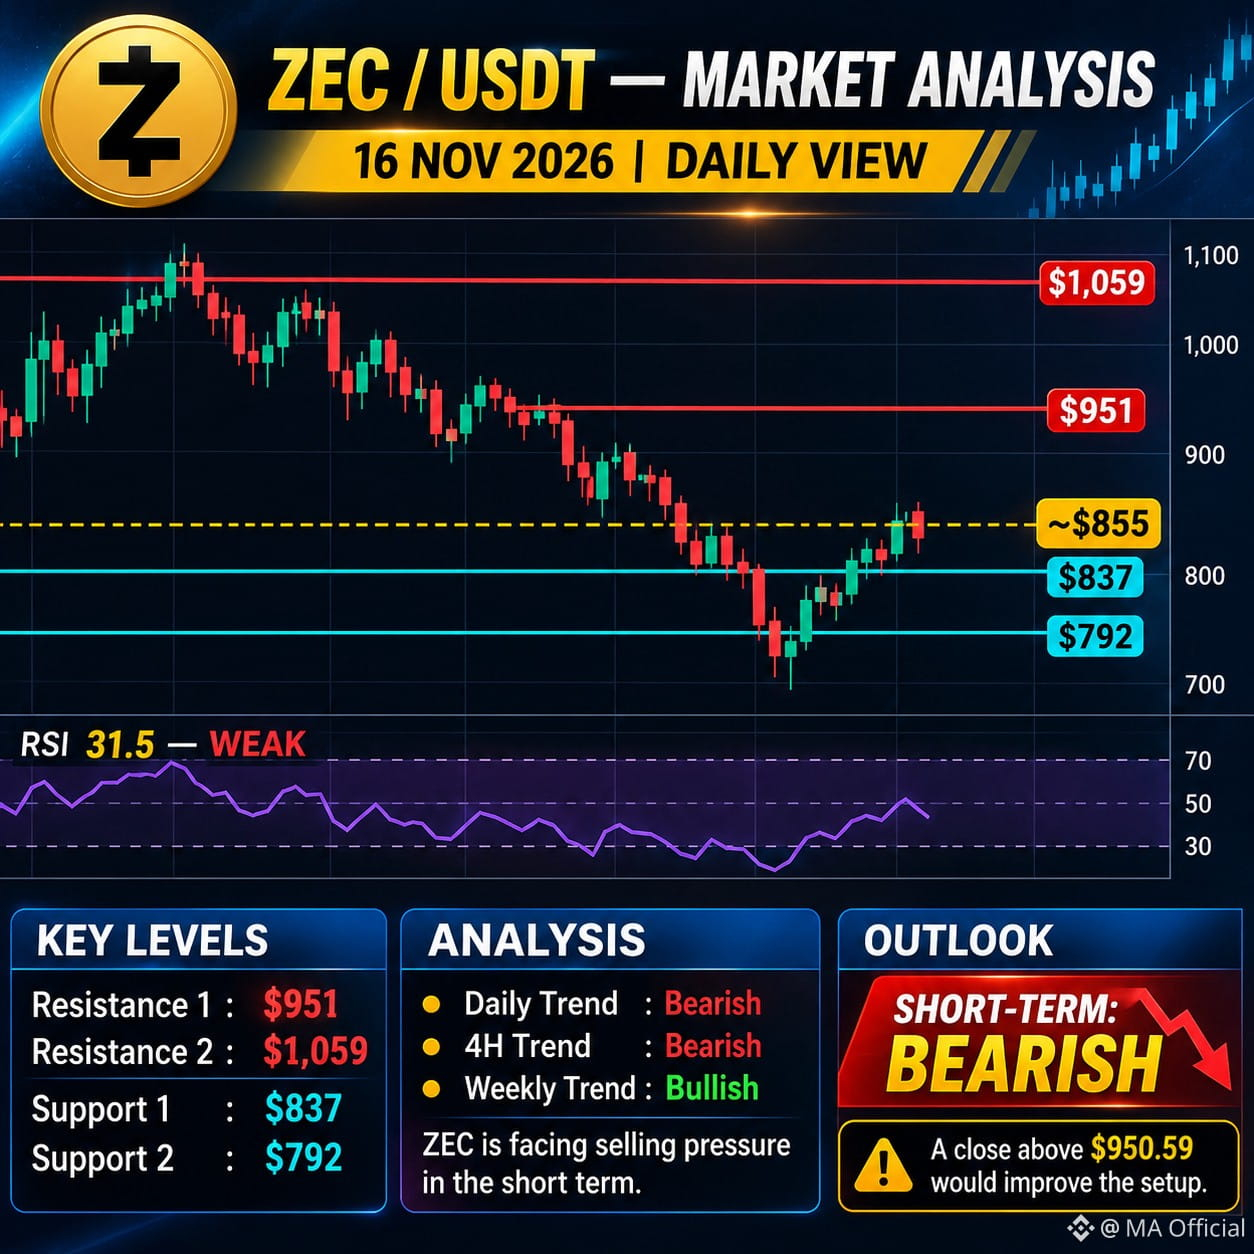
$ZEC (Zcash) ist eine auf Datenschutz ausgerichtete Kryptowährung. Ihre Kursentwicklung kann attraktive Handelsmöglichkeiten bieten, doch Trader sollten wichtige Unterstützungs- und Widerstandsniveaus, das Handelsvolumen und die Marktrichtung von Bitcoin im Auge behalten.
Die folgende Analyse dient Bildungszwecken und ist kein garantiertes Handelssignal.
Technische Niveaus für ZEC/USDT
~$855
Indikator Wert
RSI (14)
31.5 – Schwach
Tagtrend Bärisch
4-Stunden-Trend Bärisch
Wochentrend Bullisch
Wichtige Unterstützung
S1: $837
S2: $792
Wichtiger Widerstand
R1: $951
R2: $1,059
Handelsausblick
Bärisches Szenario: Ein Durchbruch unter $837 könnte den Weg bis $792 freimachen.
Bullisches Szenario: Ein starker Schlusskurs über $951 könnte auf eine Erholung in Richtung $1,059 hindeuten.
RSI: Nahe am überverkauften Bereich, daher ist eine Erholungsbewegung möglich, eine Trendwende ist jedoch nicht bestätigt.
Meine Einschätzung: Vermeiden Sie es, Einstiegen hinterherzujagen. Warten Sie auf eine Bestätigung im Bereich der Unterstützung bei $837 oder auf einen Ausbruch über $951.
#AnthropicIPOTestsInvestorAppetiteForAI #BitcoinExtendsLosingStreakToSixWeeks #HuangReportedlyConsidersReturnToNvidia #SP500AndNasdaqFuturesHitQuarterlyLows #MUFGSMFGMizuhoPlanYenBackedStablecoin
{spot}(ZECUSDT)
$ZEC (Zcash) ist eine auf Datenschutz ausgerichtete Kryptowährung. Ihre Kursentwicklung kann attraktive Handelsmöglichkeiten bieten, doch Trader sollten wichtige Unterstützungs- und Widerstandsniveaus, das Handelsvolumen und die Marktrichtung von Bitcoin im Auge behalten.
Die folgende Analyse dient Bildungszwecken und ist kein garantiertes Handelssignal.
Technische Niveaus für ZEC/USDT
~$855
Indikator Wert
RSI (14)
31.5 – Schwach
Tagtrend Bärisch
4-Stunden-Trend Bärisch
Wochentrend Bullisch
Wichtige Unterstützung
S1: $837
S2: $792
Wichtiger Widerstand
R1: $951
R2: $1,059
Handelsausblick
Bärisches Szenario: Ein Durchbruch unter $837 könnte den Weg bis $792 freimachen.
Bullisches Szenario: Ein starker Schlusskurs über $951 könnte auf eine Erholung in Richtung $1,059 hindeuten.
RSI: Nahe am überverkauften Bereich, daher ist eine Erholungsbewegung möglich, eine Trendwende ist jedoch nicht bestätigt.
Meine Einschätzung: Vermeiden Sie es, Einstiegen hinterherzujagen. Warten Sie auf eine Bestätigung im Bereich der Unterstützung bei $837 oder auf einen Ausbruch über $951.
#AnthropicIPOTestsInvestorAppetiteForAI #BitcoinExtendsLosingStreakToSixWeeks #HuangReportedlyConsidersReturnToNvidia #SP500AndNasdaqFuturesHitQuarterlyLows #MUFGSMFGMizuhoPlanYenBackedStablecoin
Die folgende Analyse dient Bildungszwecken und ist kein garantiertes Handelssignal.
Technische Niveaus für ZEC/USDT
~$855
Indikator Wert
RSI (14)
31.5 – Schwach
Tagtrend Bärisch
4-Stunden-Trend Bärisch
Wochentrend Bullisch
Wichtige Unterstützung
S1: $837
S2: $792
Wichtiger Widerstand
R1: $951
R2: $1,059
Handelsausblick
Bärisches Szenario: Ein Durchbruch unter $837 könnte den Weg bis $792 freimachen.
Bullisches Szenario: Ein starker Schlusskurs über $951 könnte auf eine Erholung in Richtung $1,059 hindeuten.
RSI: Nahe am überverkauften Bereich, daher ist eine Erholungsbewegung möglich, eine Trendwende ist jedoch nicht bestätigt.
Meine Einschätzung: Vermeiden Sie es, Einstiegen hinterherzujagen. Warten Sie auf eine Bestätigung im Bereich der Unterstützung bei $837 oder auf einen Ausbruch über $951.
#AnthropicIPOTestsInvestorAppetiteForAI #BitcoinExtendsLosingStreakToSixWeeks #HuangReportedlyConsidersReturnToNvidia #SP500AndNasdaqFuturesHitQuarterlyLows #MUFGSMFGMizuhoPlanYenBackedStablecoin
315
·
--
Übersetzung ansehen
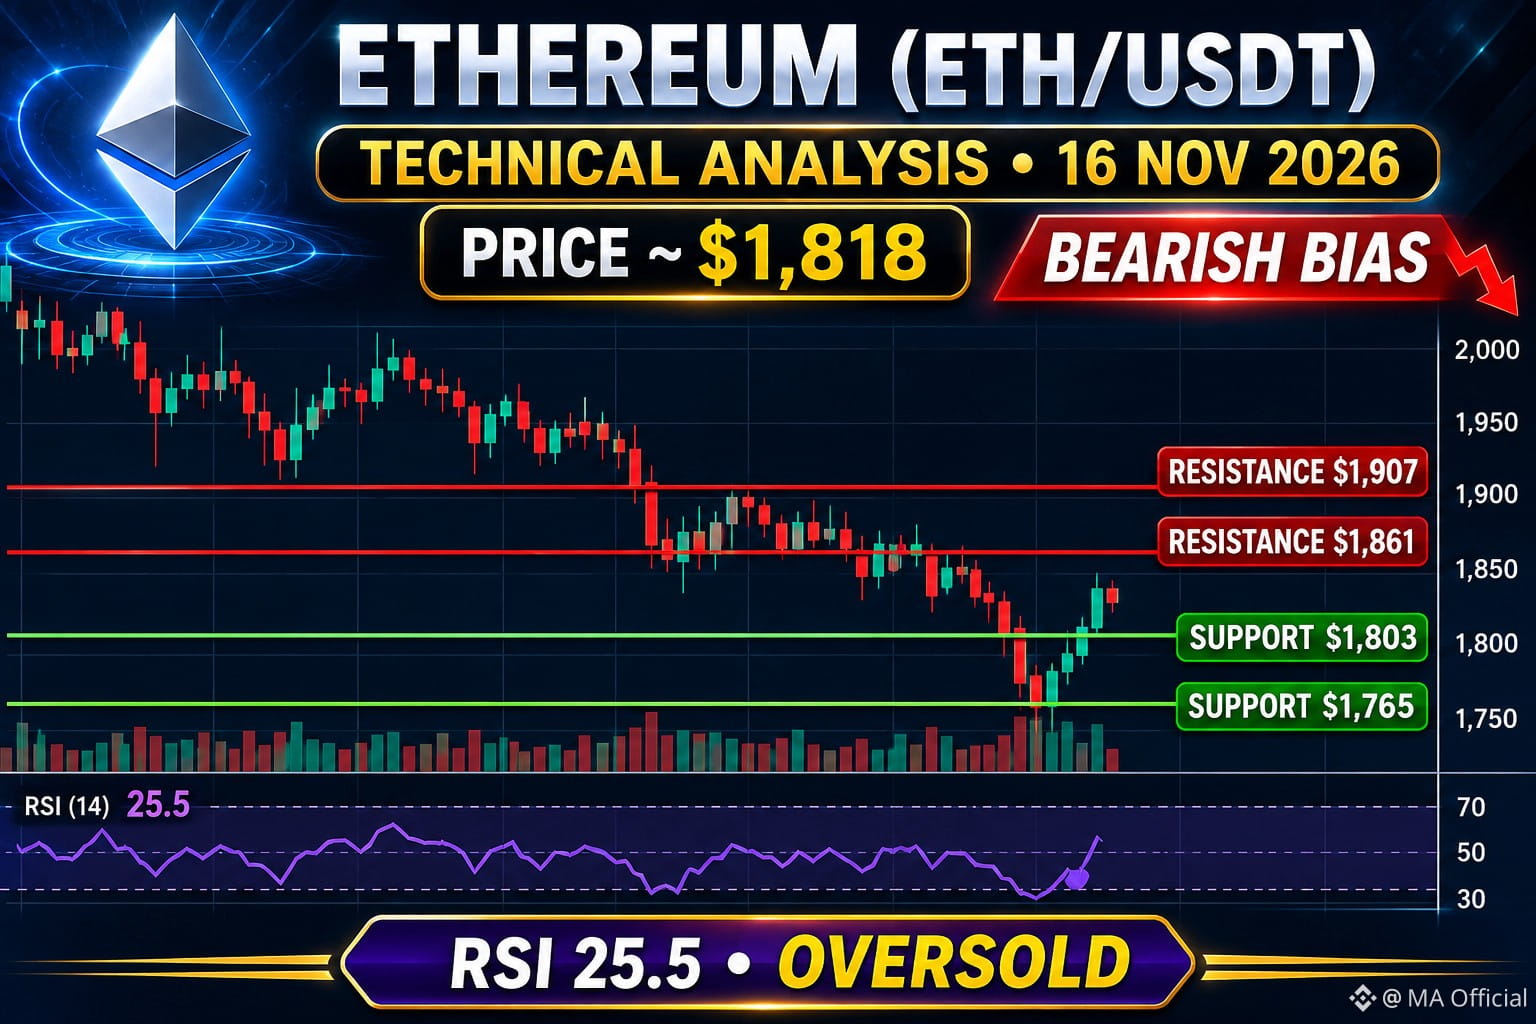
$ETH Ethereum is showing a bearish market structure across the 4-hour and daily timeframes. Selling pressure remains dominant, although the RSI indicates oversold conditions that could lead to a temporary recovery.
Market trend: Bearish
RSI (14): 25.5 – Oversold
Momentum: Weak
Short-term outlook: Cautious
Support & Resistance
Level Price
Resistance 2 $1,907
Resistance 1 $1,861
Current price $1,818
Support 1 $1,803
Support 2 $1,765
Source:
Trading Scenarios
Bullish Scenario
If ETH holds above $1,803 and breaks $1,861, a recovery towards $1,907 could develop.
Bearish Scenario
If ETH breaks below $1,803, the next downside level to watch is $1,765.
Trading Strategy
Avoid chasing trades during high volatility.
Watch for a confirmed breakout above $1,861.
Watch for a confirmed breakdown below $1,803.
Use stop-loss protection and manage position size carefully.
Final Prediction
Bearish / Cautious
ETH remains under bearish pressure. However, the oversold RSI means a short-term bounce is possible. Confirmation from price action is important before entering a trade.
Trade carefully. Protect your capital.
#AnthropicIPOTestsInvestorAppetiteForAI #HuangReportedlyConsidersReturnToNvidia #CryptoSelloffTriggersMultipleWhaleLiquidations #About64000BitcoinMiningMachinesReportedlyHijacked #USSpotXRPETFsSeeLargestWeeklyOutflowIn8Months
{spot}(ETHUSDT)
$ETH Ethereum is showing a bearish market structure across the 4-hour and daily timeframes. Selling pressure remains dominant, although the RSI indicates oversold conditions that could lead to a temporary recovery.
Market trend: Bearish
RSI (14): 25.5 – Oversold
Momentum: Weak
Short-term outlook: Cautious
Support & Resistance
Level Price
Resistance 2 $1,907
Resistance 1 $1,861
Current price $1,818
Support 1 $1,803
Support 2 $1,765
Source:
Trading Scenarios
Bullish Scenario
If ETH holds above $1,803 and breaks $1,861, a recovery towards $1,907 could develop.
Bearish Scenario
If ETH breaks below $1,803, the next downside level to watch is $1,765.
Trading Strategy
Avoid chasing trades during high volatility.
Watch for a confirmed breakout above $1,861.
Watch for a confirmed breakdown below $1,803.
Use stop-loss protection and manage position size carefully.
Final Prediction
Bearish / Cautious
ETH remains under bearish pressure. However, the oversold RSI means a short-term bounce is possible. Confirmation from price action is important before entering a trade.
Trade carefully. Protect your capital.
#AnthropicIPOTestsInvestorAppetiteForAI #HuangReportedlyConsidersReturnToNvidia #CryptoSelloffTriggersMultipleWhaleLiquidations #About64000BitcoinMiningMachinesReportedlyHijacked #USSpotXRPETFsSeeLargestWeeklyOutflowIn8Months
Market trend: Bearish
RSI (14): 25.5 – Oversold
Momentum: Weak
Short-term outlook: Cautious
Support & Resistance
Level Price
Resistance 2 $1,907
Resistance 1 $1,861
Current price $1,818
Support 1 $1,803
Support 2 $1,765
Source:
Trading Scenarios
Bullish Scenario
If ETH holds above $1,803 and breaks $1,861, a recovery towards $1,907 could develop.
Bearish Scenario
If ETH breaks below $1,803, the next downside level to watch is $1,765.
Trading Strategy
Avoid chasing trades during high volatility.
Watch for a confirmed breakout above $1,861.
Watch for a confirmed breakdown below $1,803.
Use stop-loss protection and manage position size carefully.
Final Prediction
Bearish / Cautious
ETH remains under bearish pressure. However, the oversold RSI means a short-term bounce is possible. Confirmation from price action is important before entering a trade.
Trade carefully. Protect your capital.
#AnthropicIPOTestsInvestorAppetiteForAI #HuangReportedlyConsidersReturnToNvidia #CryptoSelloffTriggersMultipleWhaleLiquidations #About64000BitcoinMiningMachinesReportedlyHijacked #USSpotXRPETFsSeeLargestWeeklyOutflowIn8Months
63
·
--
Übersetzung ansehen
$XAU
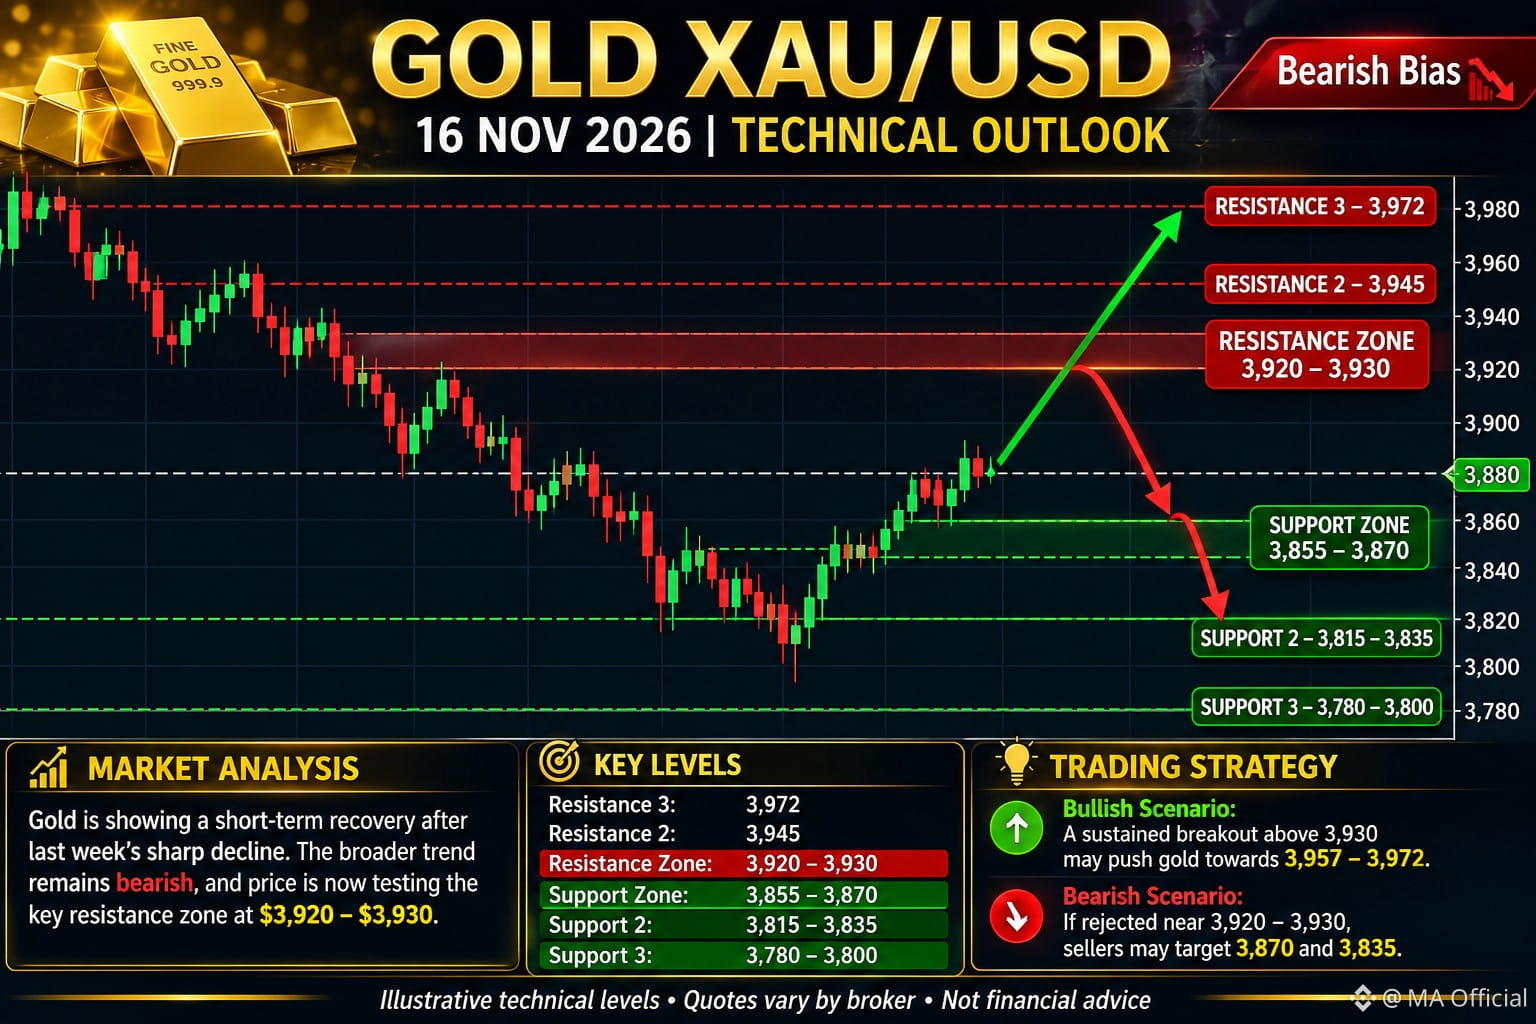
$3,880
Approximate spot gold price; live quotes vary between brokers.
1. Market Overview
Gold is showing weakness after a sharp decline last week. The price is attempting a short-term recovery, but the broader technical trend remains bearish.
Strong US dollar and rising Treasury yields are putting pressure on gold.
Buyers are attempting to defend the $3,855–$3,870 support zone.
A breakout above $3,930 could encourage further recovery.
2. Important Trading Levels
Level XAU/USD
Resistance 3 $3,972
Resistance 2 $3,945
Resistance 1 $3,920–3,930
Current reference $3,880
Support 1 $3,870–3,855
Support 2 $3,835–3,815
Support 3 $3,780
BUY scenario: If $XAU holds $3,855–$3,870 and forms a bullish reversal, a recovery toward $3,920 and $3,957 is possible.
SELL scenario: If gold faces rejection around $3,920–$3,930, bearish momentum could return toward $3,870 and $3,835.
Breakout confirmation: A sustained move above $3,930 would improve the bullish outlook. A decisive break below $3,855 would strengthen the bearish outlook.
Gold remains under selling pressure unless it reclaims the $3,930 resistance zone. Avoid entering trades without candle confirmation.
Risk management: Use a stop-loss, avoid over-leveraging, and wait for confirmation on the 15-minute or 1-hour chart.
Analysis is educational, not a guaranteed trading signal.
#HuangReportedlyConsidersReturnToNvidia #CryptoSelloffTriggersMultipleWhaleLiquidations #About64000BitcoinMiningMachinesReportedlyHijacked #USSpotXRPETFsSeeLargestWeeklyOutflowIn8Months #BitcoinActiveSupplyInProfitDropsBelow45%
{future}(XAUUSDT)
$XAU
$3,880
Approximate spot gold price; live quotes vary between brokers.
1. Market Overview
Gold is showing weakness after a sharp decline last week. The price is attempting a short-term recovery, but the broader technical trend remains bearish.
Strong US dollar and rising Treasury yields are putting pressure on gold.
Buyers are attempting to defend the $3,855–$3,870 support zone.
A breakout above $3,930 could encourage further recovery.
2. Important Trading Levels
Level XAU/USD
Resistance 3 $3,972
Resistance 2 $3,945
Resistance 1 $3,920–3,930
Current reference $3,880
Support 1 $3,870–3,855
Support 2 $3,835–3,815
Support 3 $3,780
BUY scenario: If $XAU holds $3,855–$3,870 and forms a bullish reversal, a recovery toward $3,920 and $3,957 is possible.
SELL scenario: If gold faces rejection around $3,920–$3,930, bearish momentum could return toward $3,870 and $3,835.
Breakout confirmation: A sustained move above $3,930 would improve the bullish outlook. A decisive break below $3,855 would strengthen the bearish outlook.
Gold remains under selling pressure unless it reclaims the $3,930 resistance zone. Avoid entering trades without candle confirmation.
Risk management: Use a stop-loss, avoid over-leveraging, and wait for confirmation on the 15-minute or 1-hour chart.
Analysis is educational, not a guaranteed trading signal.
#HuangReportedlyConsidersReturnToNvidia #CryptoSelloffTriggersMultipleWhaleLiquidations #About64000BitcoinMiningMachinesReportedlyHijacked #USSpotXRPETFsSeeLargestWeeklyOutflowIn8Months #BitcoinActiveSupplyInProfitDropsBelow45%
$3,880
Approximate spot gold price; live quotes vary between brokers.
1. Market Overview
Gold is showing weakness after a sharp decline last week. The price is attempting a short-term recovery, but the broader technical trend remains bearish.
Strong US dollar and rising Treasury yields are putting pressure on gold.
Buyers are attempting to defend the $3,855–$3,870 support zone.
A breakout above $3,930 could encourage further recovery.
2. Important Trading Levels
Level XAU/USD
Resistance 3 $3,972
Resistance 2 $3,945
Resistance 1 $3,920–3,930
Current reference $3,880
Support 1 $3,870–3,855
Support 2 $3,835–3,815
Support 3 $3,780
BUY scenario: If $XAU holds $3,855–$3,870 and forms a bullish reversal, a recovery toward $3,920 and $3,957 is possible.
SELL scenario: If gold faces rejection around $3,920–$3,930, bearish momentum could return toward $3,870 and $3,835.
Breakout confirmation: A sustained move above $3,930 would improve the bullish outlook. A decisive break below $3,855 would strengthen the bearish outlook.
Gold remains under selling pressure unless it reclaims the $3,930 resistance zone. Avoid entering trades without candle confirmation.
Risk management: Use a stop-loss, avoid over-leveraging, and wait for confirmation on the 15-minute or 1-hour chart.
Analysis is educational, not a guaranteed trading signal.
#HuangReportedlyConsidersReturnToNvidia #CryptoSelloffTriggersMultipleWhaleLiquidations #About64000BitcoinMiningMachinesReportedlyHijacked #USSpotXRPETFsSeeLargestWeeklyOutflowIn8Months #BitcoinActiveSupplyInProfitDropsBelow45%
1
123
·
--
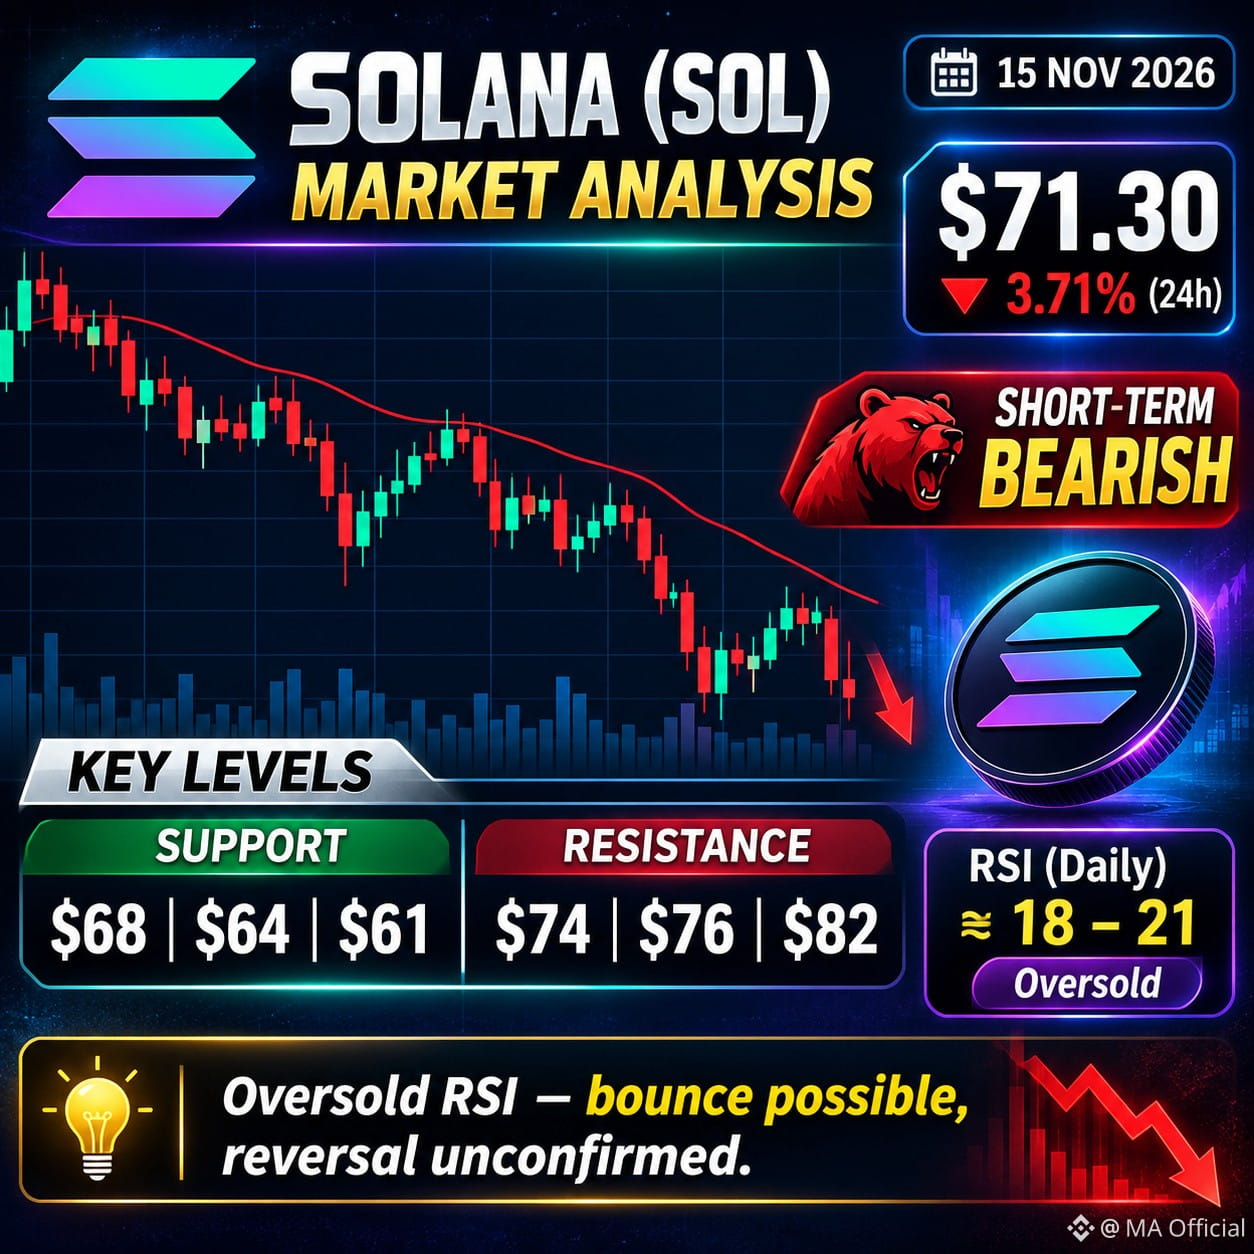
$SOL
Technischer Ausblick
Bullishes Szenario: Eine starke Erholung über 74 $ könnte den Weg in Richtung 76 $ und anschließend 82 $ ebnen.
Bearishes Szenario: Ein Rückgang unter 68 $ könnte 64 $ und 61 $ in den Fokus rücken.
Genau beobachten: Ein überverkaufter RSI kann eine kurzfristige Erholung auslösen, bestätigt jedoch keine Trendwende.
Fazit zum Handel
Solana zeigt derzeit eine bearishe Struktur. Der überverkaufte RSI macht eine Entlastungserholung möglich, doch die Käufer müssen die Marke von 74–76 $ zurückerobern, bevor die Erholung überzeugender wird.
Meine Einschätzung: Bearish, bis der Widerstand zurückerobert ist. Vermeiden Sie es, Trades hinterherzulaufen, und achten Sie auf ein striktes Stop-Loss-Management.
Starker Widerstand 82,36 $
Unterstützung 1 68,19 $
Unterstützung 2 64,42 $
Starke Unterstützung 61,39 $
#CryptoSelloffTriggersMultipleWhaleLiquidations #USSpotXRPETFsSeeLargestWeeklyOutflowIn8Months #WhatWillDriveCryptoandStocks’NextRebound? #WhoWillSucceedJensenHuangatNvidia? #TradFiForBeginners
{spot}(SOLUSDT)
$SOL
Technischer Ausblick
Bullishes Szenario: Eine starke Erholung über 74 $ könnte den Weg in Richtung 76 $ und anschließend 82 $ ebnen.
Bearishes Szenario: Ein Rückgang unter 68 $ könnte 64 $ und 61 $ in den Fokus rücken.
Genau beobachten: Ein überverkaufter RSI kann eine kurzfristige Erholung auslösen, bestätigt jedoch keine Trendwende.
Fazit zum Handel
Solana zeigt derzeit eine bearishe Struktur. Der überverkaufte RSI macht eine Entlastungserholung möglich, doch die Käufer müssen die Marke von 74–76 $ zurückerobern, bevor die Erholung überzeugender wird.
Meine Einschätzung: Bearish, bis der Widerstand zurückerobert ist. Vermeiden Sie es, Trades hinterherzulaufen, und achten Sie auf ein striktes Stop-Loss-Management.
Starker Widerstand 82,36 $
Unterstützung 1 68,19 $
Unterstützung 2 64,42 $
Starke Unterstützung 61,39 $
#CryptoSelloffTriggersMultipleWhaleLiquidations #USSpotXRPETFsSeeLargestWeeklyOutflowIn8Months #WhatWillDriveCryptoandStocks’NextRebound? #WhoWillSucceedJensenHuangatNvidia? #TradFiForBeginners
Technischer Ausblick
Bullishes Szenario: Eine starke Erholung über 74 $ könnte den Weg in Richtung 76 $ und anschließend 82 $ ebnen.
Bearishes Szenario: Ein Rückgang unter 68 $ könnte 64 $ und 61 $ in den Fokus rücken.
Genau beobachten: Ein überverkaufter RSI kann eine kurzfristige Erholung auslösen, bestätigt jedoch keine Trendwende.
Fazit zum Handel
Solana zeigt derzeit eine bearishe Struktur. Der überverkaufte RSI macht eine Entlastungserholung möglich, doch die Käufer müssen die Marke von 74–76 $ zurückerobern, bevor die Erholung überzeugender wird.
Meine Einschätzung: Bearish, bis der Widerstand zurückerobert ist. Vermeiden Sie es, Trades hinterherzulaufen, und achten Sie auf ein striktes Stop-Loss-Management.
Starker Widerstand 82,36 $
Unterstützung 1 68,19 $
Unterstützung 2 64,42 $
Starke Unterstützung 61,39 $
#CryptoSelloffTriggersMultipleWhaleLiquidations #USSpotXRPETFsSeeLargestWeeklyOutflowIn8Months #WhatWillDriveCryptoandStocks’NextRebound? #WhoWillSucceedJensenHuangatNvidia? #TradFiForBeginners
1
1
279
·
--
Übersetzung ansehen
Coin: OpenGradient (OPG)
$OPG Current price: Approximately $0.137 USD.
Key market levels
Indicator Price
Resistance 1 $0.141
Support 1 $0.128
24h high $0.1414
24h low $0.1283
📈 Market outlook
Bullish: A strong breakout above $0.141 with volume could indicate further upside.
Bearish: A breakdown below $0.128 could increase selling pressure.
Strategy: Watch volume and wait for confirmation before entering a trade.
My view: OPG is currently in a volatile consolidation zone. Avoid chasing sudden price movements. Wait for a confirmed breakout or support retest.
#KavaSaysAbnormalActivityLimitedToKavaLend #BitcoinActiveSupplyInProfitDropsBelow45% #TradFiForBeginners #WhoWillSucceedJensenHuangatNvidia?
{future}(OPGUSDT)
Coin: OpenGradient (OPG)
$OPG Current price: Approximately $0.137 USD.
Key market levels
Indicator Price
Resistance 1 $0.141
Support 1 $0.128
24h high $0.1414
24h low $0.1283
📈 Market outlook
Bullish: A strong breakout above $0.141 with volume could indicate further upside.
Bearish: A breakdown below $0.128 could increase selling pressure.
Strategy: Watch volume and wait for confirmation before entering a trade.
My view: OPG is currently in a volatile consolidation zone. Avoid chasing sudden price movements. Wait for a confirmed breakout or support retest.
#KavaSaysAbnormalActivityLimitedToKavaLend #BitcoinActiveSupplyInProfitDropsBelow45% #TradFiForBeginners #WhoWillSucceedJensenHuangatNvidia?
$OPG Current price: Approximately $0.137 USD.
Key market levels
Indicator Price
Resistance 1 $0.141
Support 1 $0.128
24h high $0.1414
24h low $0.1283
📈 Market outlook
Bullish: A strong breakout above $0.141 with volume could indicate further upside.
Bearish: A breakdown below $0.128 could increase selling pressure.
Strategy: Watch volume and wait for confirmation before entering a trade.
My view: OPG is currently in a volatile consolidation zone. Avoid chasing sudden price movements. Wait for a confirmed breakout or support retest.
#KavaSaysAbnormalActivityLimitedToKavaLend #BitcoinActiveSupplyInProfitDropsBelow45% #TradFiForBeginners #WhoWillSucceedJensenHuangatNvidia?

253
·
--
Übersetzung ansehen
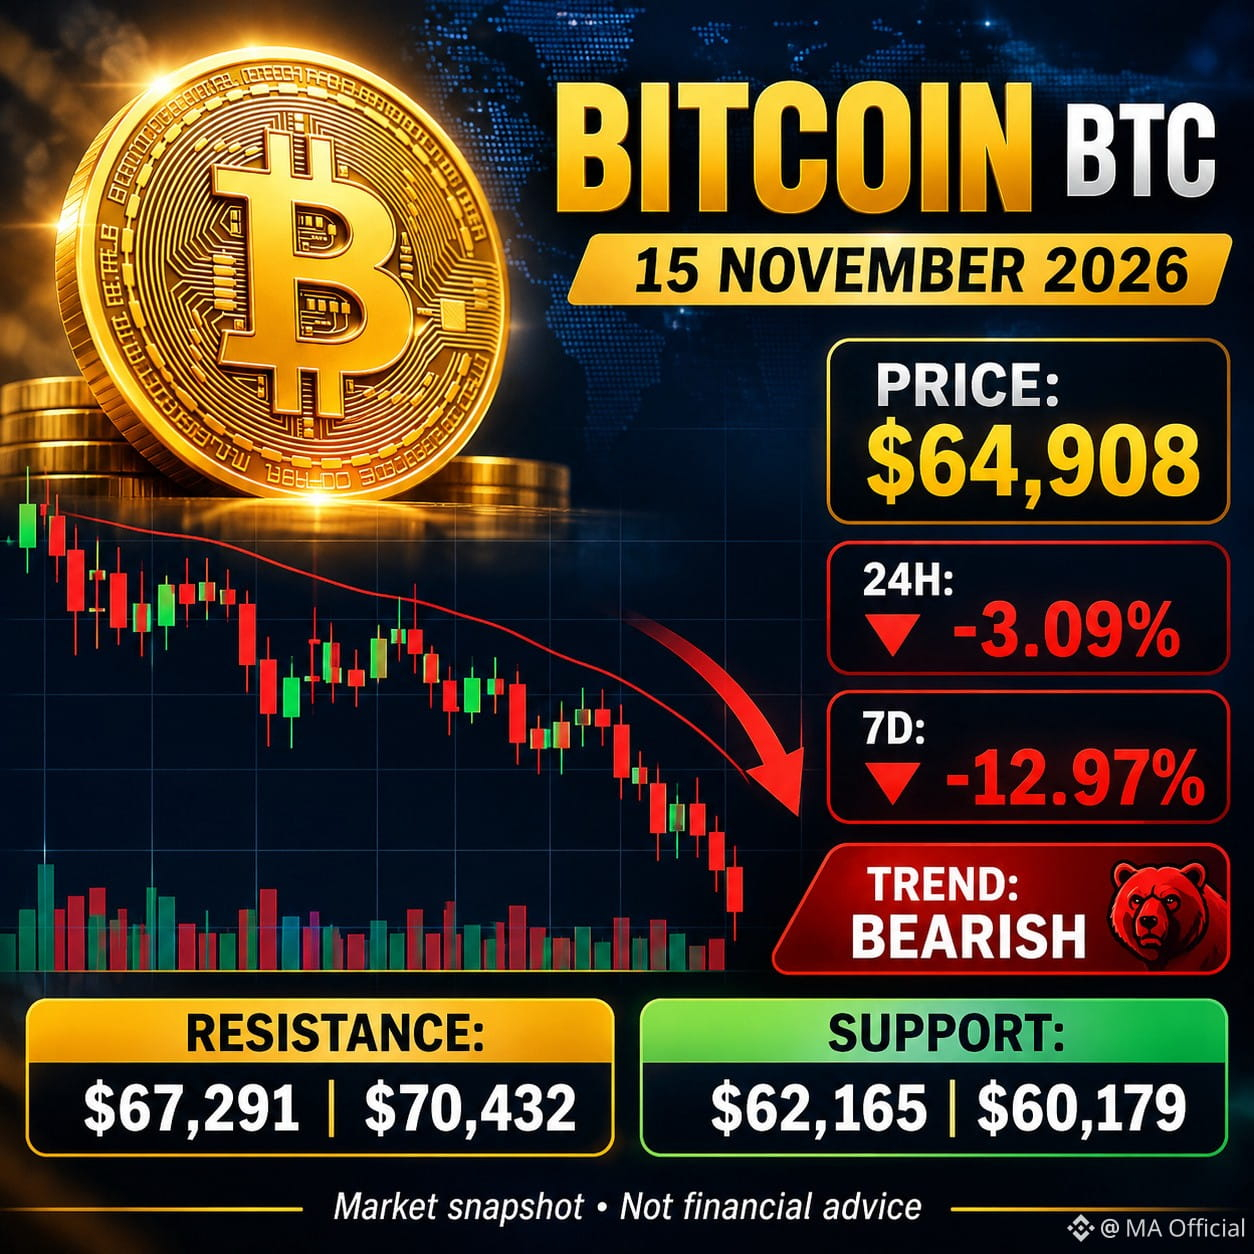
$BTC is facing strong selling pressure, dropping around 3.09% in the last 24 hours and nearly 13% over the past 7 days. Market sentiment remains weak due to heavy liquidations and institutional ETF outflows.
Key technical levels
Level Price
Resistance 2 $70,432
Resistance 1 $67,291
Current price $64,908
Support 1 $62,165
Support 2 $60,179
Market outlook:
Bullish: A daily close above $67,291 could signal a recovery toward $70,432.
Bearish: A breakdown below $62,165 could expose $60,179.
Strategy: Avoid chasing trades during high volatility. Wait for confirmation.
Overall view: Short-term bearish, with a possible oversold bounce. This is market analysis, not financial advice.
#BitcoinActiveSupplyInProfitDropsBelow45% #KavaSaysAbnormalActivityLimitedToKavaLend #TradFiForBeginners #WhatWillDriveCryptoandStocks’NextRebound?
{spot}(BTCUSDT)
$BTC is facing strong selling pressure, dropping around 3.09% in the last 24 hours and nearly 13% over the past 7 days. Market sentiment remains weak due to heavy liquidations and institutional ETF outflows.
Key technical levels
Level Price
Resistance 2 $70,432
Resistance 1 $67,291
Current price $64,908
Support 1 $62,165
Support 2 $60,179
Market outlook:
Bullish: A daily close above $67,291 could signal a recovery toward $70,432.
Bearish: A breakdown below $62,165 could expose $60,179.
Strategy: Avoid chasing trades during high volatility. Wait for confirmation.
Overall view: Short-term bearish, with a possible oversold bounce. This is market analysis, not financial advice.
#BitcoinActiveSupplyInProfitDropsBelow45% #KavaSaysAbnormalActivityLimitedToKavaLend #TradFiForBeginners #WhatWillDriveCryptoandStocks’NextRebound?
Key technical levels
Level Price
Resistance 2 $70,432
Resistance 1 $67,291
Current price $64,908
Support 1 $62,165
Support 2 $60,179
Market outlook:
Bullish: A daily close above $67,291 could signal a recovery toward $70,432.
Bearish: A breakdown below $62,165 could expose $60,179.
Strategy: Avoid chasing trades during high volatility. Wait for confirmation.
Overall view: Short-term bearish, with a possible oversold bounce. This is market analysis, not financial advice.
#BitcoinActiveSupplyInProfitDropsBelow45% #KavaSaysAbnormalActivityLimitedToKavaLend #TradFiForBeginners #WhatWillDriveCryptoandStocks’NextRebound?
101
Anmelden und weiter Inhalte entdecken
Krypto-Nutzer weltweit auf Binance Square kennenlernen
⚡️ Bleib in Sachen Krypto stets am Puls.
💬 Die weltgrößte Kryptobörse vertraut darauf.
👍 Erhalte verlässliche Einblicke von verifizierten Creators.
E-Mail-Adresse/Telefonnummer
Trendthemen
A Packed Week of Earnings and Data Tests Markets
53,260 Aufrufe
362 Kommentare
Nvidia, Anthropic und die Fed: drei Bewährungsproben in einer Woche
Nick_Invest
·3 Likes
·1k Aufrufe
AnthropicIPOTestsInvestorAppetiteForAI
92,243 Aufrufe
1,235 Kommentare
BitcoinExtendsLosingStreakToSixWeeks
55,839 Aufrufe
593 Kommentare