
haseeb_khan000
11 Beiträge

haseeb_khan000
Melden
Nutzer blockieren
Trader & Market Analyst Charts | Analysis | Strategies Knowledge Distributor Learn • Analyze • Grow
3 Following
0 Follower
1 Like gegeben
Beiträge
#FETUSD
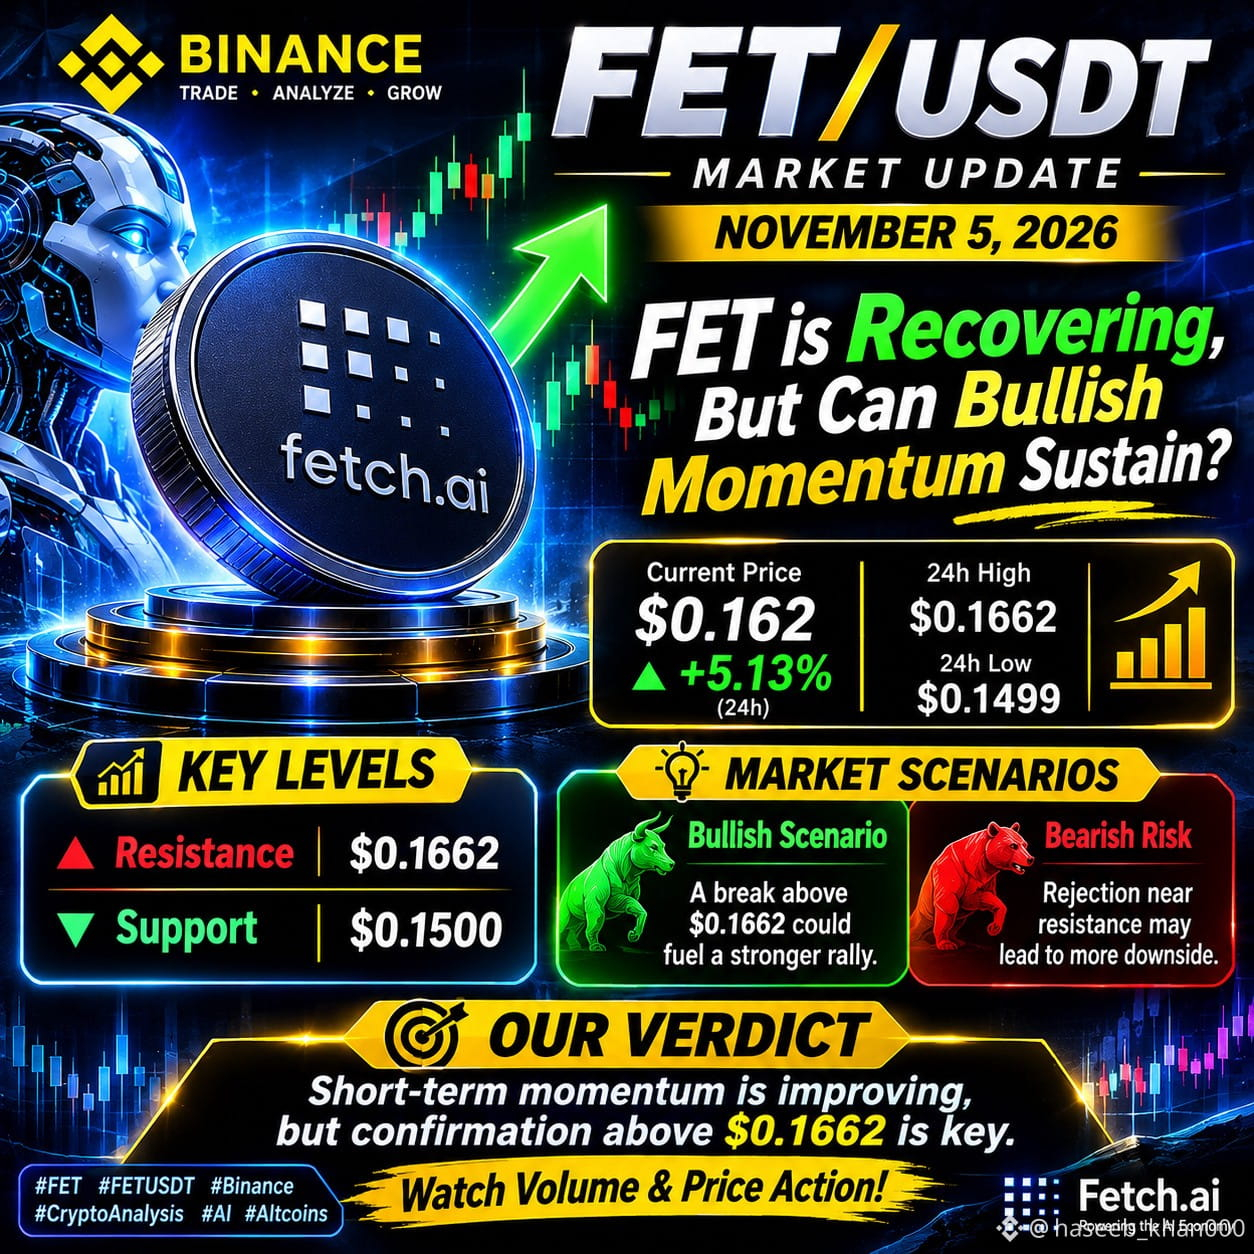
🚨 FET/USDT — MARKTUPDATE |
FET erholt sich, aber kann die Aufwärtsdynamik anhalten?
FET wird nahe 0,162 $ gehandelt und liegt innerhalb von 24 Stunden etwa 5,1 % im Plus. Gleichzeitig nimmt die gemeldete Handelsaktivität zu. Das Open Interest bei Futures ist jedoch zurückgegangen. Dies deutet darauf hin, dass die Preiserholung durch die Positionierung in Derivaten noch nicht vollständig bestätigt wird.
🔹 Wichtiger Widerstand: 0,1662 $
🔹 Wichtige Unterstützung: 0,1500 $
🔹 Bullishes Szenario: Ein anhaltender Ausbruch über 0,1662 $ könnte die Erholungsdynamik verstärken.
🔹 Risiko: Eine Zurückweisung nahe dem Widerstand könnte erneut Verkaufsdruck auslösen.
Markteinschätzung: Die kurzfristige Dynamik verbessert sich, doch eine Bestätigung oberhalb des Widerstands bleibt wichtig. Beobachten Sie Volumen und Kursverlauf, bevor Sie eine fundiertere Einschätzung treffen.
#FETUSDT #Binance #Altcoins #MarketAnalysis
{future}(FETUSDT)
#FETUSD
🚨 FET/USDT — MARKTUPDATE |
FET erholt sich, aber kann die Aufwärtsdynamik anhalten?
FET wird nahe 0,162 $ gehandelt und liegt innerhalb von 24 Stunden etwa 5,1 % im Plus. Gleichzeitig nimmt die gemeldete Handelsaktivität zu. Das Open Interest bei Futures ist jedoch zurückgegangen. Dies deutet darauf hin, dass die Preiserholung durch die Positionierung in Derivaten noch nicht vollständig bestätigt wird.
🔹 Wichtiger Widerstand: 0,1662 $
🔹 Wichtige Unterstützung: 0,1500 $
🔹 Bullishes Szenario: Ein anhaltender Ausbruch über 0,1662 $ könnte die Erholungsdynamik verstärken.
🔹 Risiko: Eine Zurückweisung nahe dem Widerstand könnte erneut Verkaufsdruck auslösen.
Markteinschätzung: Die kurzfristige Dynamik verbessert sich, doch eine Bestätigung oberhalb des Widerstands bleibt wichtig. Beobachten Sie Volumen und Kursverlauf, bevor Sie eine fundiertere Einschätzung treffen.
#FETUSDT #Binance #Altcoins #MarketAnalysis
🚨 FET/USDT — MARKTUPDATE |
FET erholt sich, aber kann die Aufwärtsdynamik anhalten?
FET wird nahe 0,162 $ gehandelt und liegt innerhalb von 24 Stunden etwa 5,1 % im Plus. Gleichzeitig nimmt die gemeldete Handelsaktivität zu. Das Open Interest bei Futures ist jedoch zurückgegangen. Dies deutet darauf hin, dass die Preiserholung durch die Positionierung in Derivaten noch nicht vollständig bestätigt wird.
🔹 Wichtiger Widerstand: 0,1662 $
🔹 Wichtige Unterstützung: 0,1500 $
🔹 Bullishes Szenario: Ein anhaltender Ausbruch über 0,1662 $ könnte die Erholungsdynamik verstärken.
🔹 Risiko: Eine Zurückweisung nahe dem Widerstand könnte erneut Verkaufsdruck auslösen.
Markteinschätzung: Die kurzfristige Dynamik verbessert sich, doch eine Bestätigung oberhalb des Widerstands bleibt wichtig. Beobachten Sie Volumen und Kursverlauf, bevor Sie eine fundiertere Einschätzung treffen.
#FETUSDT #Binance #Altcoins #MarketAnalysis
125
#TAO/USDT
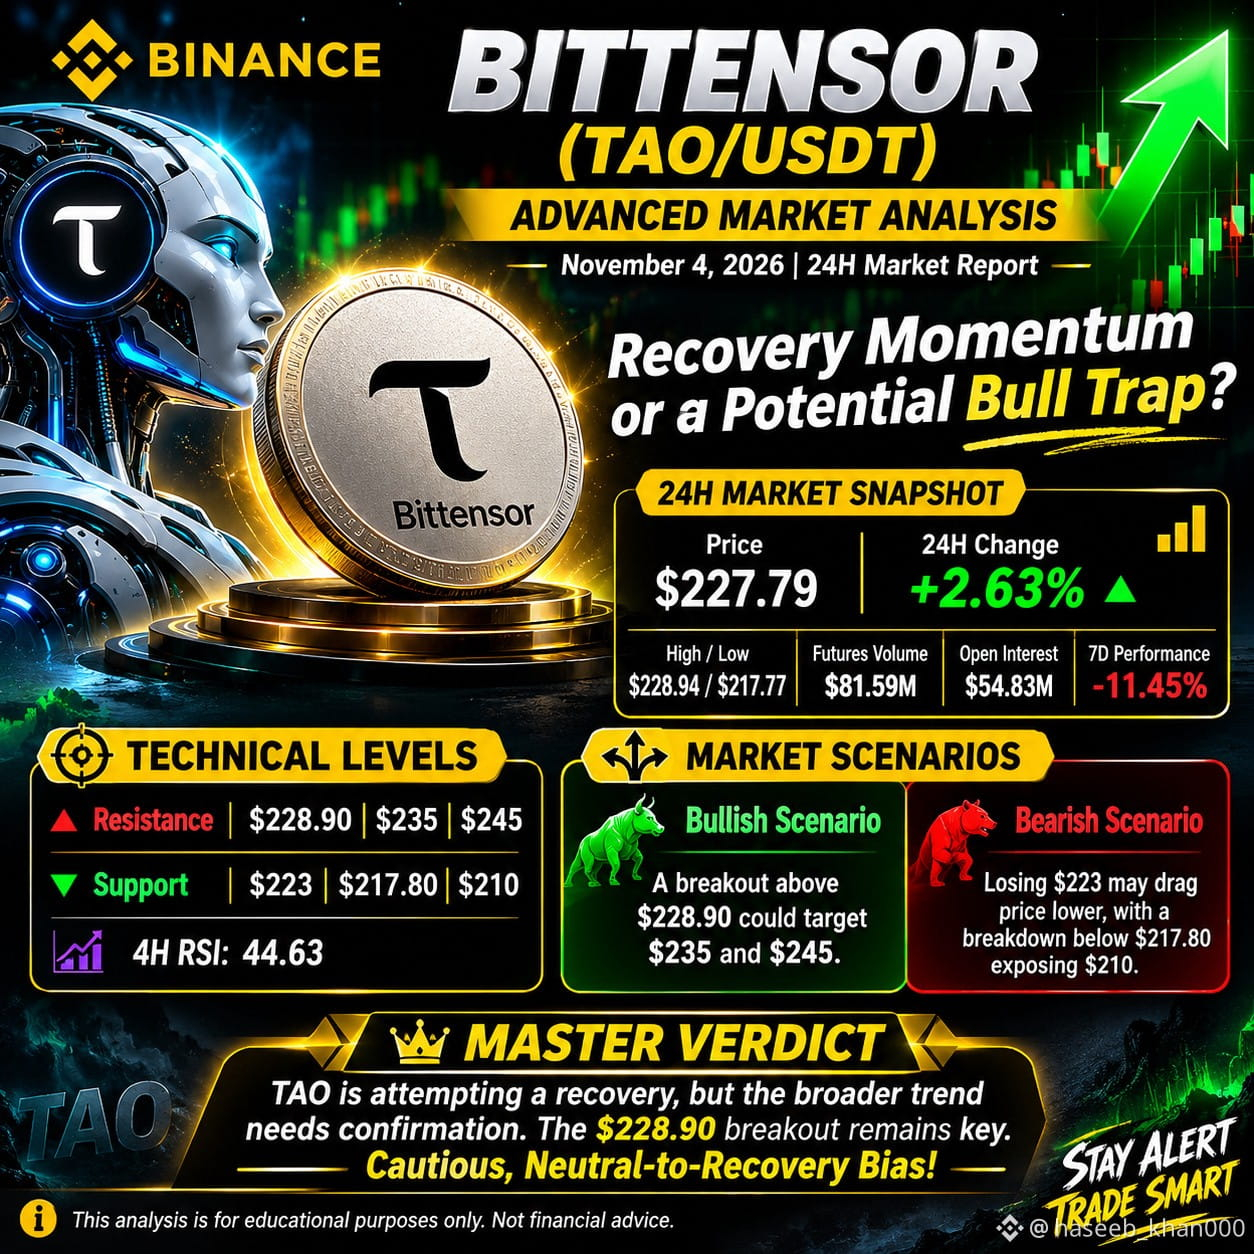
🚨 TAO/USDT — MARKTAUSBLICK AUF INSTITUTIONELLEM NIVEAU
Erholungsdynamik oder eine mögliche Bullenfalle?
Bittensor (TAO) zeigt erste Erholungssignale und legt innerhalb von 24 Stunden um 2.63% zu. Die übergeordnete Struktur bleibt jedoch unter Druck, weshalb eine Bestätigung entscheidend ist, bevor von einer bullischen Trendwende gesprochen werden kann.
📊 24-STUNDEN-MARKTÜBERBLICK
- Preis: $227.79
- Veränderung: +2.63%
- Hoch / Tief: $228.94 / $217.77
- Futures-Volumen: $81.59M
- Open Interest: $54.83M
- Wochenperformance: -11.45%
🔍 WICHTIGE TECHNISCHE NIVEAUS
Widerstand: $228.90 | $235 | $245
Unterstützung: $223 | $217.80 | $210
4H-RSI: 44.63 — Die Dynamik liegt weiterhin unterhalb des bullischen Bereichs.
📈 MARKTSZENARIEN
Bullisch: Ein klarer Ausbruch über $228.90 bei starkem Volumen könnte den Weg in Richtung $235 und $245 ebnen.
Bärisch: Ein Unterschreiten von $223 könnte die Erholungsdynamik schwächen, während ein Durchbruch unter $217.80 den Weg bis $210 freimachen könnte.
🧠 GESAMTFAZIT
TAO versucht sich zu erholen, doch der übergeordnete Trend hat eine Trendwende noch nicht bestätigt. Der Ausbruch über $228.90 bleibt der entscheidende Auslöser. Bis dahin ist eine vorsichtige, neutrale bis erholungsorientierte Einschätzung gerechtfertigt.
{future}(TAOUSDT)
#AI #CryptoAnalysis #Altcoins #binanacesquare
#TAO/USDT
🚨 TAO/USDT — MARKTAUSBLICK AUF INSTITUTIONELLEM NIVEAU
Erholungsdynamik oder eine mögliche Bullenfalle?
Bittensor (TAO) zeigt erste Erholungssignale und legt innerhalb von 24 Stunden um 2.63% zu. Die übergeordnete Struktur bleibt jedoch unter Druck, weshalb eine Bestätigung entscheidend ist, bevor von einer bullischen Trendwende gesprochen werden kann.
📊 24-STUNDEN-MARKTÜBERBLICK
- Preis: $227.79
- Veränderung: +2.63%
- Hoch / Tief: $228.94 / $217.77
- Futures-Volumen: $81.59M
- Open Interest: $54.83M
- Wochenperformance: -11.45%
🔍 WICHTIGE TECHNISCHE NIVEAUS
Widerstand: $228.90 | $235 | $245
Unterstützung: $223 | $217.80 | $210
4H-RSI: 44.63 — Die Dynamik liegt weiterhin unterhalb des bullischen Bereichs.
📈 MARKTSZENARIEN
Bullisch: Ein klarer Ausbruch über $228.90 bei starkem Volumen könnte den Weg in Richtung $235 und $245 ebnen.
Bärisch: Ein Unterschreiten von $223 könnte die Erholungsdynamik schwächen, während ein Durchbruch unter $217.80 den Weg bis $210 freimachen könnte.
🧠 GESAMTFAZIT
TAO versucht sich zu erholen, doch der übergeordnete Trend hat eine Trendwende noch nicht bestätigt. Der Ausbruch über $228.90 bleibt der entscheidende Auslöser. Bis dahin ist eine vorsichtige, neutrale bis erholungsorientierte Einschätzung gerechtfertigt.
#AI #CryptoAnalysis #Altcoins #binanacesquare
🚨 TAO/USDT — MARKTAUSBLICK AUF INSTITUTIONELLEM NIVEAU
Erholungsdynamik oder eine mögliche Bullenfalle?
Bittensor (TAO) zeigt erste Erholungssignale und legt innerhalb von 24 Stunden um 2.63% zu. Die übergeordnete Struktur bleibt jedoch unter Druck, weshalb eine Bestätigung entscheidend ist, bevor von einer bullischen Trendwende gesprochen werden kann.
📊 24-STUNDEN-MARKTÜBERBLICK
- Preis: $227.79
- Veränderung: +2.63%
- Hoch / Tief: $228.94 / $217.77
- Futures-Volumen: $81.59M
- Open Interest: $54.83M
- Wochenperformance: -11.45%
🔍 WICHTIGE TECHNISCHE NIVEAUS
Widerstand: $228.90 | $235 | $245
Unterstützung: $223 | $217.80 | $210
4H-RSI: 44.63 — Die Dynamik liegt weiterhin unterhalb des bullischen Bereichs.
📈 MARKTSZENARIEN
Bullisch: Ein klarer Ausbruch über $228.90 bei starkem Volumen könnte den Weg in Richtung $235 und $245 ebnen.
Bärisch: Ein Unterschreiten von $223 könnte die Erholungsdynamik schwächen, während ein Durchbruch unter $217.80 den Weg bis $210 freimachen könnte.
🧠 GESAMTFAZIT
TAO versucht sich zu erholen, doch der übergeordnete Trend hat eine Trendwende noch nicht bestätigt. Der Ausbruch über $228.90 bleibt der entscheidende Auslöser. Bis dahin ist eine vorsichtige, neutrale bis erholungsorientierte Einschätzung gerechtfertigt.
#AI #CryptoAnalysis #Altcoins #binanacesquare
1
241
#ICP/USTD
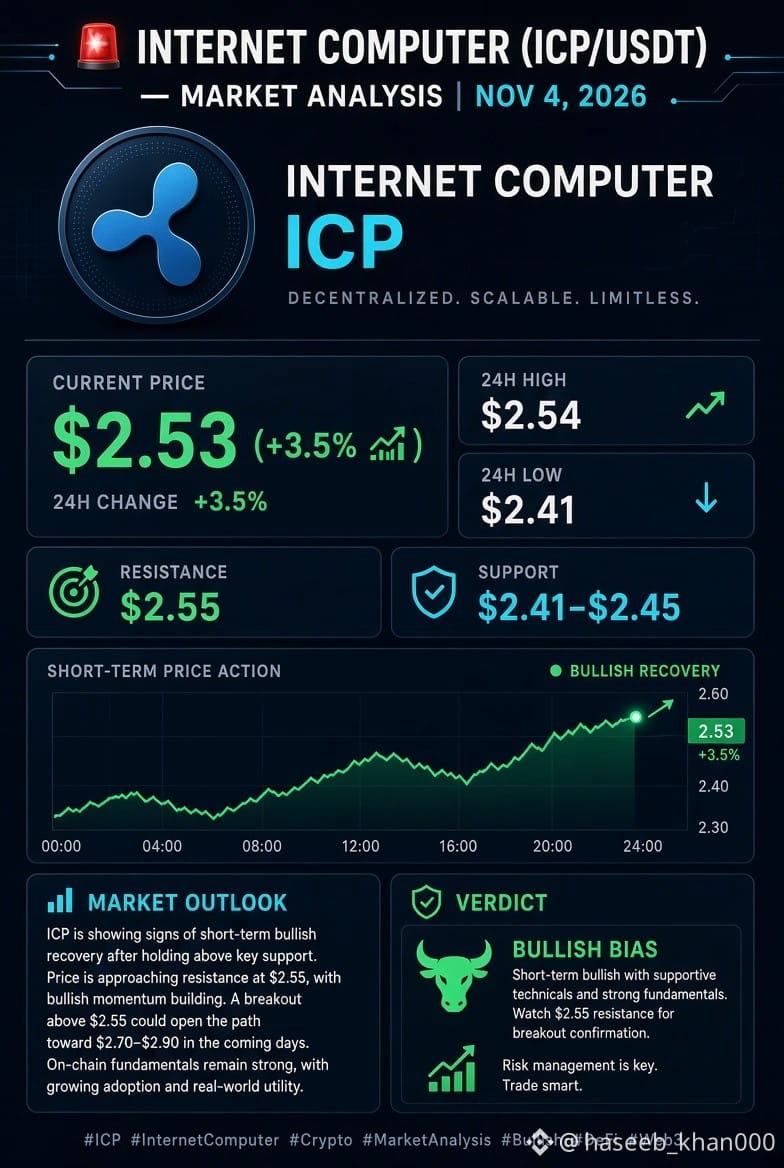
🚨 INTERNET COMPUTER (ICP/USDT) — MARKTANALYSE
ICP zeigt eine bullische kurzfristige Erholung und wird auf Binance nahe $2.53 (+3.5% in 24H) gehandelt. Der Kurs hat sich von der Unterstützungszone bei $2.41 erholt und nähert sich dem kritischen Widerstandsbereich von $2.54–$2.55.
📊 Wichtige Markteinblicke:
24-Stunden-Hoch: $2.54
24-Stunden-Tief: $2.41
Widerstand: $2.55
Unterstützung: $2.41–$2.45
Kurzfristiger Trend: Bullische Erholung
🔍 Marktausblick: Ein bestätigter Ausbruch über $2.55 könnte die bullische Dynamik verstärken. Eine Zurückweisung am Widerstand könnte jedoch eine weitere Konsolidierungsphase auslösen.
Fazit: ICP zeigt kurzfristig zunehmende Stärke, doch eine Bestätigung oberhalb des Widerstands bleibt entscheidend.
{future}(ICPUSDT)
#CryptoAnalysis #Altcoins #CryptoMarket #TradingUpdate
#ICP/USTD
🚨 INTERNET COMPUTER (ICP/USDT) — MARKTANALYSE
ICP zeigt eine bullische kurzfristige Erholung und wird auf Binance nahe $2.53 (+3.5% in 24H) gehandelt. Der Kurs hat sich von der Unterstützungszone bei $2.41 erholt und nähert sich dem kritischen Widerstandsbereich von $2.54–$2.55.
📊 Wichtige Markteinblicke:
24-Stunden-Hoch: $2.54
24-Stunden-Tief: $2.41
Widerstand: $2.55
Unterstützung: $2.41–$2.45
Kurzfristiger Trend: Bullische Erholung
🔍 Marktausblick: Ein bestätigter Ausbruch über $2.55 könnte die bullische Dynamik verstärken. Eine Zurückweisung am Widerstand könnte jedoch eine weitere Konsolidierungsphase auslösen.
Fazit: ICP zeigt kurzfristig zunehmende Stärke, doch eine Bestätigung oberhalb des Widerstands bleibt entscheidend.
#CryptoAnalysis #Altcoins #CryptoMarket #TradingUpdate
🚨 INTERNET COMPUTER (ICP/USDT) — MARKTANALYSE
ICP zeigt eine bullische kurzfristige Erholung und wird auf Binance nahe $2.53 (+3.5% in 24H) gehandelt. Der Kurs hat sich von der Unterstützungszone bei $2.41 erholt und nähert sich dem kritischen Widerstandsbereich von $2.54–$2.55.
📊 Wichtige Markteinblicke:
24-Stunden-Hoch: $2.54
24-Stunden-Tief: $2.41
Widerstand: $2.55
Unterstützung: $2.41–$2.45
Kurzfristiger Trend: Bullische Erholung
🔍 Marktausblick: Ein bestätigter Ausbruch über $2.55 könnte die bullische Dynamik verstärken. Eine Zurückweisung am Widerstand könnte jedoch eine weitere Konsolidierungsphase auslösen.
Fazit: ICP zeigt kurzfristig zunehmende Stärke, doch eine Bestätigung oberhalb des Widerstands bleibt entscheidend.
#CryptoAnalysis #Altcoins #CryptoMarket #TradingUpdate
114
Übersetzung ansehen
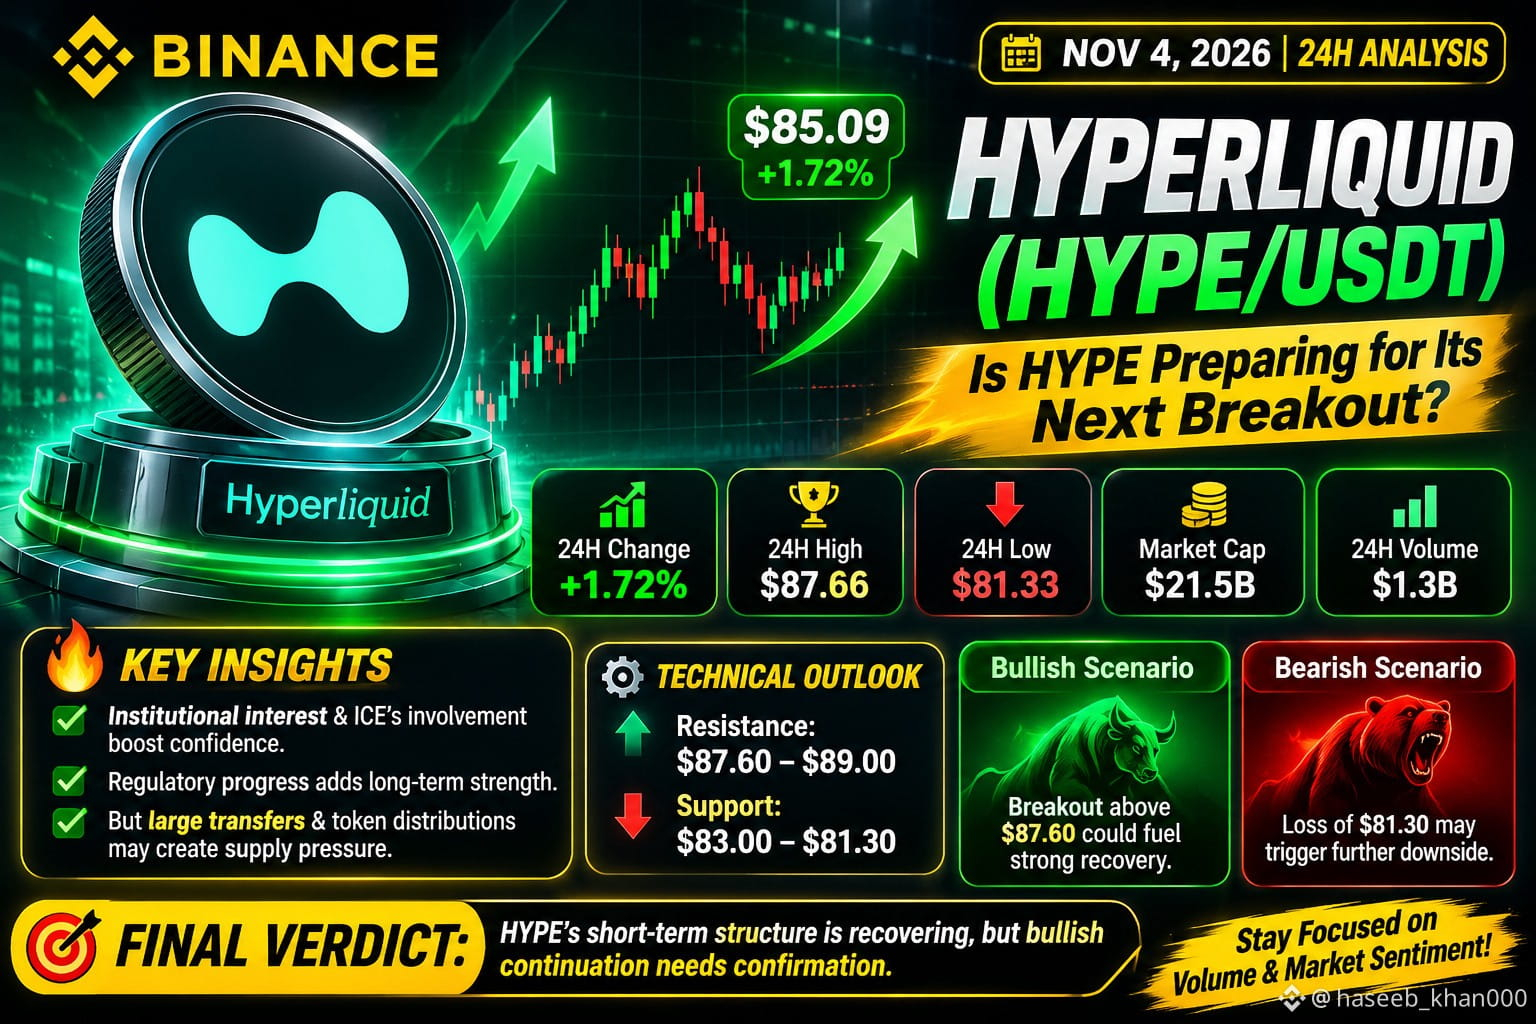
$HYPE 🚨 HYPERLIQUID (HYPE/USDT) — ADVANCED MARKET ANALYSIS |
Is HYPE Preparing for Its Next Breakout or Facing Another Rejection?
HYPE is showing renewed bullish momentum, trading around $85.09, up approximately 1.72% over 24 hours. Price recently recovered from $81.33, but resistance near $87.66 remains a critical hurdle.
📊 Key Market Insights
24H Change: +1.72%
24H High: $87.66
24H Low: $81.33
Market Cap: $21.5B
24H Volume: $1.3B
🔥 Fundamental Catalysts: Institutional interest surrounding Hyperliquid's infrastructure, ICE's planned involvement in a US perpetual futures venue, and recent regulatory developments are attracting attention. However, large exchange transfers and upcoming token distributions remain potential supply-side risks.
🎯 Technical Outlook:
Resistance: $87.60–$89.00
Support: $83.00–$81.30
{future}(HYPEUSDT)
Bullish Scenario: A convincing breakout above $87.60 could strengthen recovery momentum.
Bearish Scenario: Losing $81.30 could expose HYPE to further downside pressure.
⚡ Final Verdict: HYPE's short-term structure is recovering, but bullish continuation still requires confirmation. Rising institutional attention is constructive, while supply pressure and market positioning demand caution.
Stay focused on volume, resistance reactions, and broader market sentiment.
#HYPEUSDT #Binance #CryptoAnalysis #Altcoins #CryptoMarket
$HYPE 🚨 HYPERLIQUID (HYPE/USDT) — ADVANCED MARKET ANALYSIS |
Is HYPE Preparing for Its Next Breakout or Facing Another Rejection?
HYPE is showing renewed bullish momentum, trading around $85.09, up approximately 1.72% over 24 hours. Price recently recovered from $81.33, but resistance near $87.66 remains a critical hurdle.
📊 Key Market Insights
24H Change: +1.72%
24H High: $87.66
24H Low: $81.33
Market Cap: $21.5B
24H Volume: $1.3B
🔥 Fundamental Catalysts: Institutional interest surrounding Hyperliquid's infrastructure, ICE's planned involvement in a US perpetual futures venue, and recent regulatory developments are attracting attention. However, large exchange transfers and upcoming token distributions remain potential supply-side risks.
🎯 Technical Outlook:
Resistance: $87.60–$89.00
Support: $83.00–$81.30
Bullish Scenario: A convincing breakout above $87.60 could strengthen recovery momentum.
Bearish Scenario: Losing $81.30 could expose HYPE to further downside pressure.
⚡ Final Verdict: HYPE's short-term structure is recovering, but bullish continuation still requires confirmation. Rising institutional attention is constructive, while supply pressure and market positioning demand caution.
Stay focused on volume, resistance reactions, and broader market sentiment.
#HYPEUSDT #Binance #CryptoAnalysis #Altcoins #CryptoMarket
Is HYPE Preparing for Its Next Breakout or Facing Another Rejection?
HYPE is showing renewed bullish momentum, trading around $85.09, up approximately 1.72% over 24 hours. Price recently recovered from $81.33, but resistance near $87.66 remains a critical hurdle.
📊 Key Market Insights
24H Change: +1.72%
24H High: $87.66
24H Low: $81.33
Market Cap: $21.5B
24H Volume: $1.3B
🔥 Fundamental Catalysts: Institutional interest surrounding Hyperliquid's infrastructure, ICE's planned involvement in a US perpetual futures venue, and recent regulatory developments are attracting attention. However, large exchange transfers and upcoming token distributions remain potential supply-side risks.
🎯 Technical Outlook:
Resistance: $87.60–$89.00
Support: $83.00–$81.30
Bullish Scenario: A convincing breakout above $87.60 could strengthen recovery momentum.
Bearish Scenario: Losing $81.30 could expose HYPE to further downside pressure.
⚡ Final Verdict: HYPE's short-term structure is recovering, but bullish continuation still requires confirmation. Rising institutional attention is constructive, while supply pressure and market positioning demand caution.
Stay focused on volume, resistance reactions, and broader market sentiment.
#HYPEUSDT #Binance #CryptoAnalysis #Altcoins #CryptoMarket
101
Übersetzung ansehen
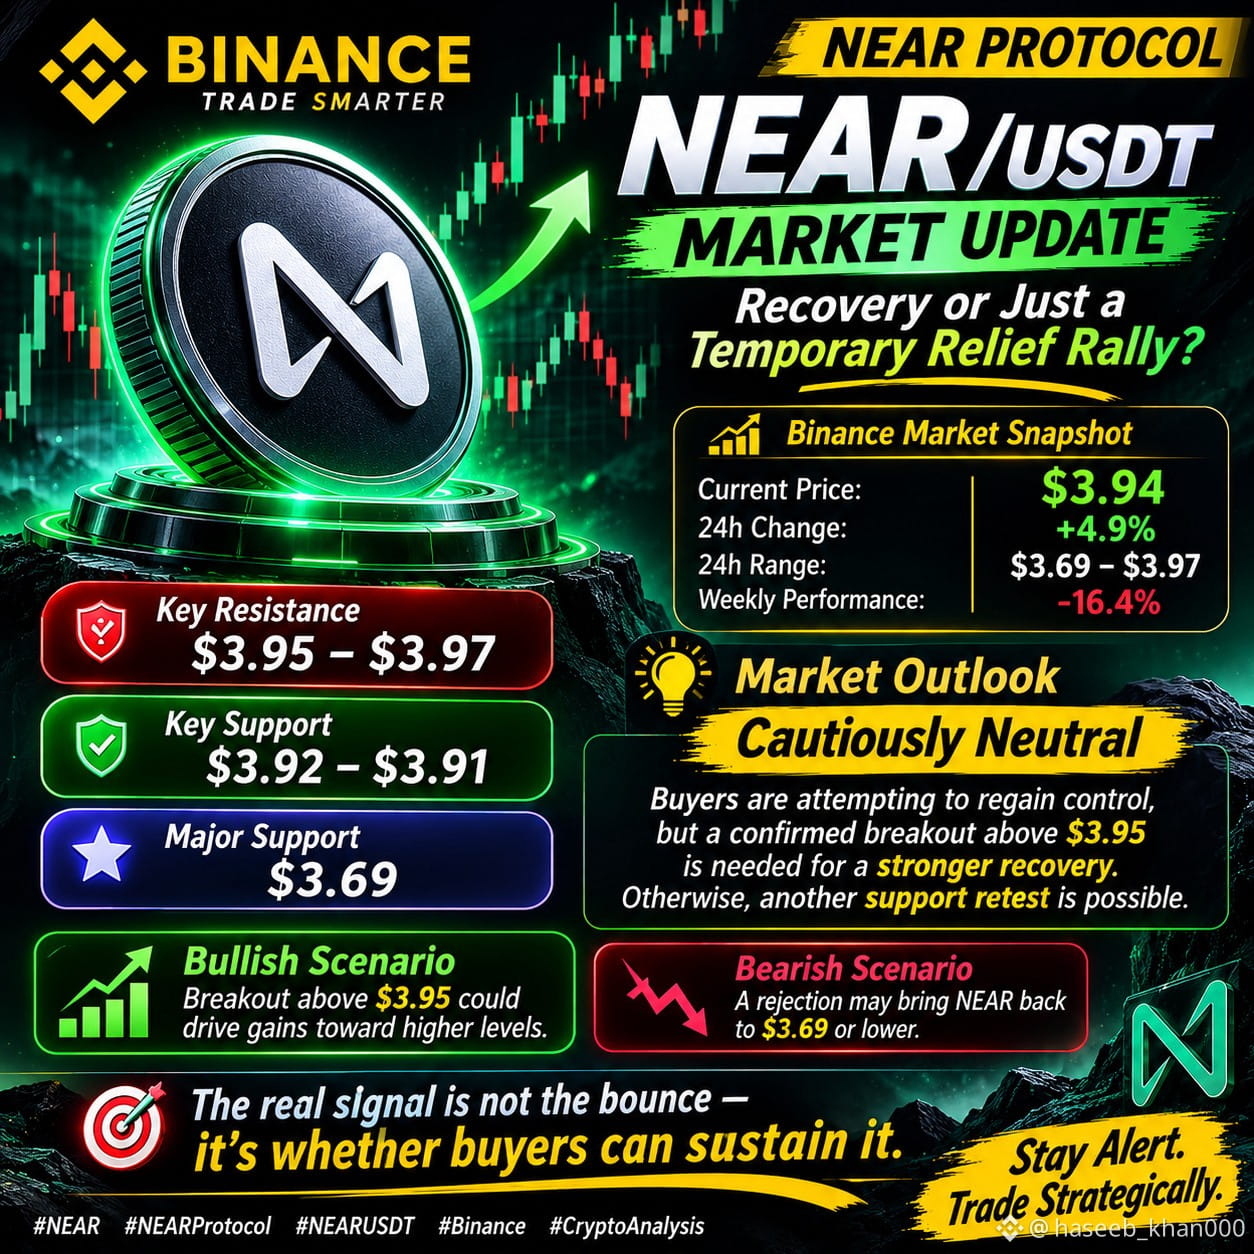
$NEAR 🚨 NEAR/USDT — BINANCE MARKET STRUCTURE UPDATE
Recovery or Just a Temporary Relief Rally?
NEAR is showing a short-term rebound, but its broader market structure remains under pressure.
📊 Binance Market Snapshot:
- Price: ~$3.94
- 24H Change: +4.9%
- 24H Range: $3.69–$3.97
- Weekly Performance: -16.4%
🔴 Resistance: $3.95–$3.97
🟢 Support: $3.92–$3.91
🎯 Major Support: $3.69
Market Bias: Cautiously Neutral
Buyers are attempting to regain control, but sustained volume and a confirmed breakout above resistance are needed to strengthen the recovery.
A rejection could expose NEAR to another support retest.
The real signal is not the bounce — it's whether buyers can sustain it.
{future}(NEARUSDT)
#NEAR #NEARUSDT #Binance #CryptoMarket #TechnicalAnalysis #Altcoins
$NEAR 🚨 NEAR/USDT — BINANCE MARKET STRUCTURE UPDATE
Recovery or Just a Temporary Relief Rally?
NEAR is showing a short-term rebound, but its broader market structure remains under pressure.
📊 Binance Market Snapshot:
- Price: ~$3.94
- 24H Change: +4.9%
- 24H Range: $3.69–$3.97
- Weekly Performance: -16.4%
🔴 Resistance: $3.95–$3.97
🟢 Support: $3.92–$3.91
🎯 Major Support: $3.69
Market Bias: Cautiously Neutral
Buyers are attempting to regain control, but sustained volume and a confirmed breakout above resistance are needed to strengthen the recovery.
A rejection could expose NEAR to another support retest.
The real signal is not the bounce — it's whether buyers can sustain it.
#NEAR #NEARUSDT #Binance #CryptoMarket #TechnicalAnalysis #Altcoins
Recovery or Just a Temporary Relief Rally?
NEAR is showing a short-term rebound, but its broader market structure remains under pressure.
📊 Binance Market Snapshot:
- Price: ~$3.94
- 24H Change: +4.9%
- 24H Range: $3.69–$3.97
- Weekly Performance: -16.4%
🔴 Resistance: $3.95–$3.97
🟢 Support: $3.92–$3.91
🎯 Major Support: $3.69
Market Bias: Cautiously Neutral
Buyers are attempting to regain control, but sustained volume and a confirmed breakout above resistance are needed to strengthen the recovery.
A rejection could expose NEAR to another support retest.
The real signal is not the bounce — it's whether buyers can sustain it.
#NEAR #NEARUSDT #Binance #CryptoMarket #TechnicalAnalysis #Altcoins
97
Übersetzung ansehen
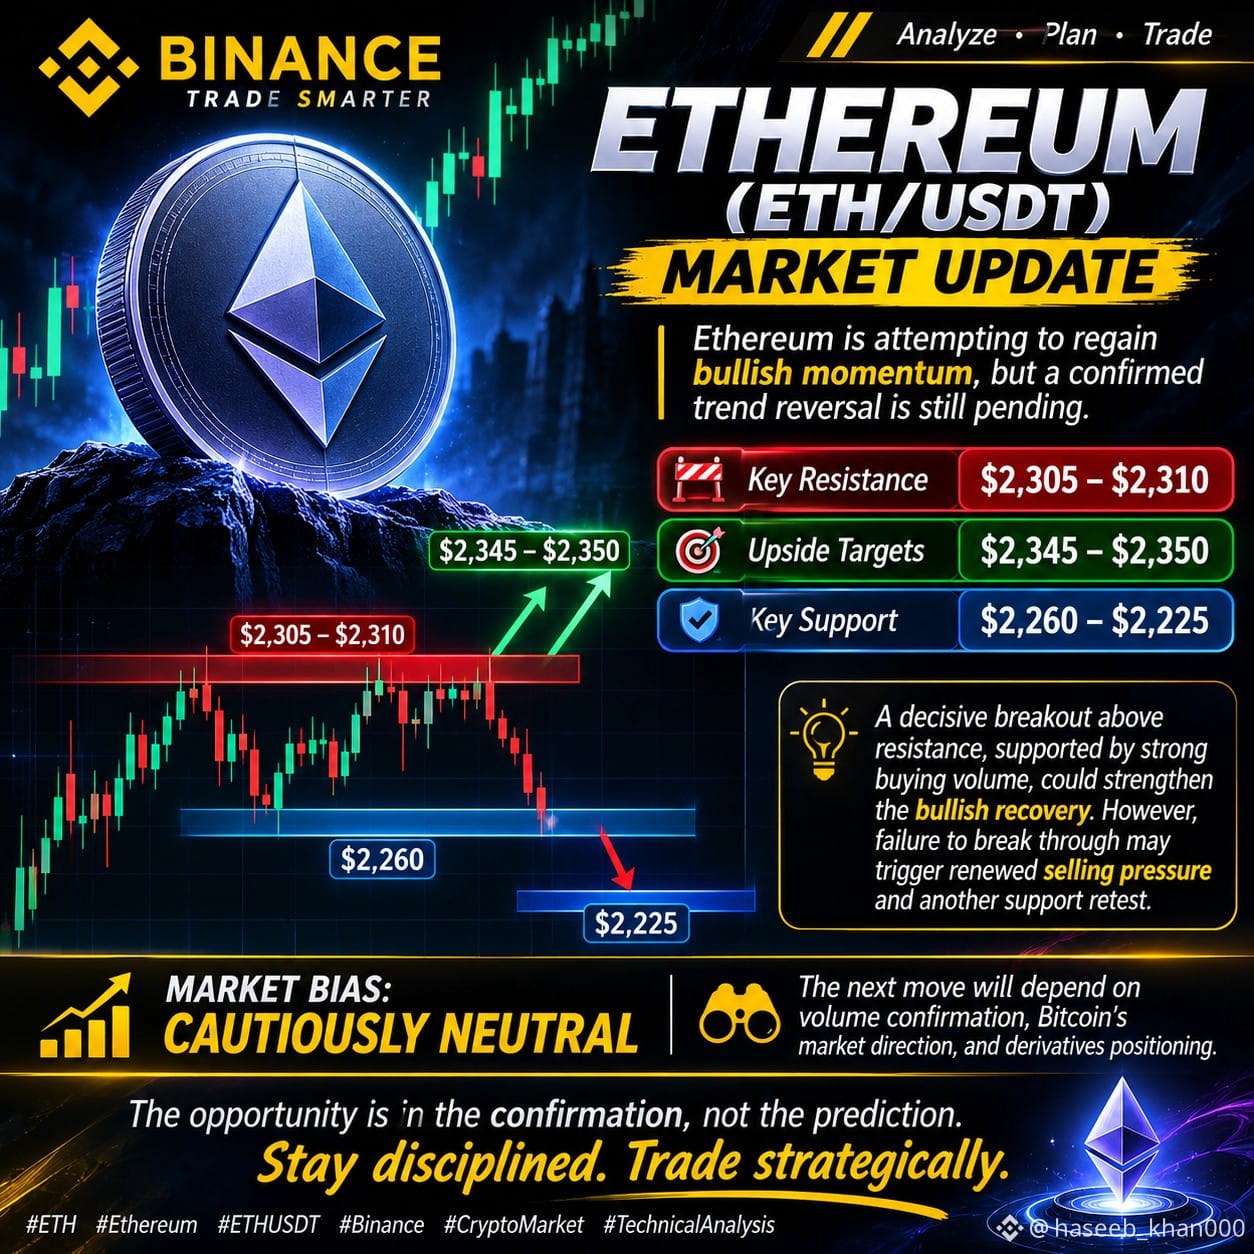
$ETH 🚨 ETHEREUM (ETH/USDT) — CRITICAL MARKET OUTLOOK
{spot}(ETHUSDT)
Ethereum is attempting to regain bullish momentum, but a confirmed trend reversal is still pending.
📈 Key Resistance: $2,305–$2,310
🎯 Upside Targets: $2,345–$2,350
🛡️ Key Support: $2,260–$2,225
A decisive breakout above resistance, supported by strong buying volume, could strengthen the bullish recovery. However, failure to break through may trigger renewed selling pressure and another support retest.
Market Bias: CAUTIOUSLY NEUTRAL
The next move will depend on volume confirmation, Bitcoin's market direction, and derivatives positioning.
The opportunity is in the confirmation, not the prediction. Stay disciplined. Trade strategically.
#ETH #Ethereum #ETHUSDT #Binance #CryptoMarket #TechnicalAnalysis #CryptoTrading
$ETH 🚨 ETHEREUM (ETH/USDT) — CRITICAL MARKET OUTLOOK
Ethereum is attempting to regain bullish momentum, but a confirmed trend reversal is still pending.
📈 Key Resistance: $2,305–$2,310
🎯 Upside Targets: $2,345–$2,350
🛡️ Key Support: $2,260–$2,225
A decisive breakout above resistance, supported by strong buying volume, could strengthen the bullish recovery. However, failure to break through may trigger renewed selling pressure and another support retest.
Market Bias: CAUTIOUSLY NEUTRAL
The next move will depend on volume confirmation, Bitcoin's market direction, and derivatives positioning.
The opportunity is in the confirmation, not the prediction. Stay disciplined. Trade strategically.
#ETH #Ethereum #ETHUSDT #Binance #CryptoMarket #TechnicalAnalysis #CryptoTrading
Ethereum is attempting to regain bullish momentum, but a confirmed trend reversal is still pending.
📈 Key Resistance: $2,305–$2,310
🎯 Upside Targets: $2,345–$2,350
🛡️ Key Support: $2,260–$2,225
A decisive breakout above resistance, supported by strong buying volume, could strengthen the bullish recovery. However, failure to break through may trigger renewed selling pressure and another support retest.
Market Bias: CAUTIOUSLY NEUTRAL
The next move will depend on volume confirmation, Bitcoin's market direction, and derivatives positioning.
The opportunity is in the confirmation, not the prediction. Stay disciplined. Trade strategically.
#ETH #Ethereum #ETHUSDT #Binance #CryptoMarket #TechnicalAnalysis #CryptoTrading
44
Übersetzung ansehen
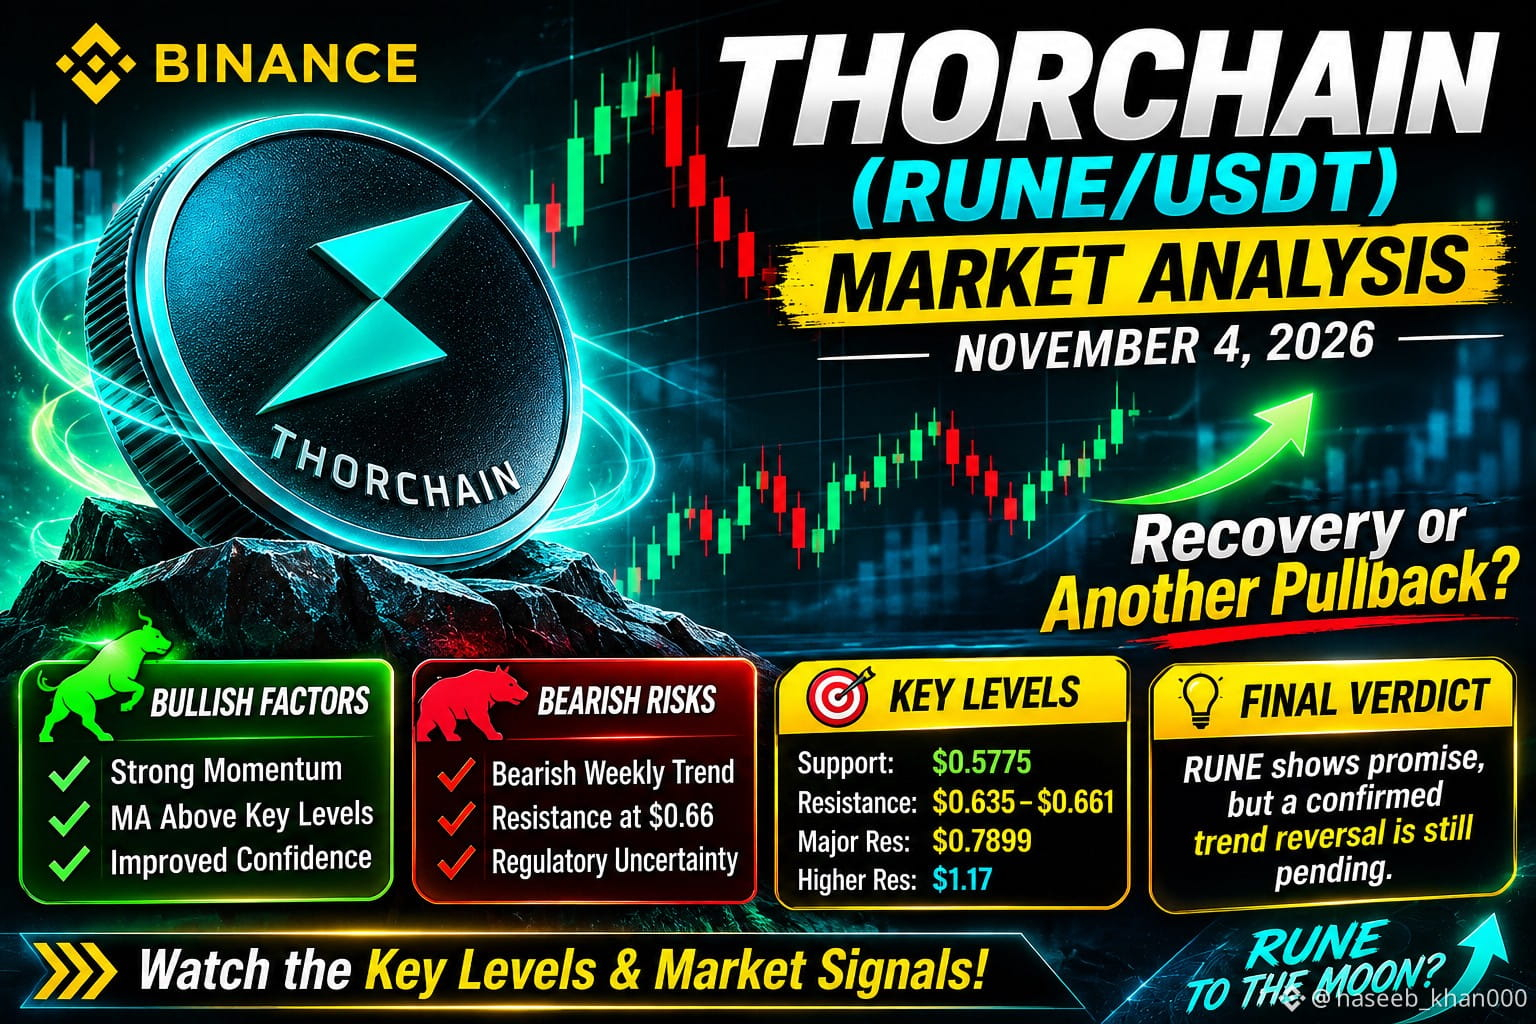
$RUNE 🚨 THORCHAIN (RUNE/USDT) — MARKET ANALYSIS
Is RUNE Entering a Sustainable Recovery or Facing Another Temporary Rebound?
THORChain (RUNE) is gaining renewed market attention following a notable price surge. Nevertheless, its broader trend remains uncertain, with technical resistance and fundamental risks shaping the outlook.
📊 MARKET OVERVIEW
- Current price: $0.62–$0.64
- 24H gains: Approximately 12–14%
- Market capitalization: $205M–$211M
- Trading activity: Increasing market participation.
🐂 BULLISH CATALYSTS
- Improving short-term momentum.
- Recovery above key moving averages.
- Progress on previous solvency concerns.
- Potential restoration of investor confidence.
🐻 BEARISH RISKS
- Broader weekly trend remains bearish.
- Inconclusive MACD confirmation.
- Cross-chain operational disruptions.
- Persistent regulatory uncertainty.
🎯 KEY PRICE LEVELS
- $0.5775 — Support
- $0.635–$0.661 — Immediate resistance
- $0.7899 — Major resistance
- $1.17 — Higher resistance reference
📈 MARKET OUTLOOK
A decisive breakout above resistance, supported by sustained volume and improving fundamentals, could strengthen the recovery narrative.
Conversely, renewed selling pressure and weakening support could expose RUNE to further downside.
🧠 FINAL VERDICT
RUNE is displaying encouraging short-term momentum, but a confirmed trend reversal remains elusive. Sustainable upside will depend on stronger demand, technical confirmation and renewed confidence in THORChain's ecosystem.
{future}(RUNEUSDT)
$RUNE 🚨 THORCHAIN (RUNE/USDT) — MARKET ANALYSIS
Is RUNE Entering a Sustainable Recovery or Facing Another Temporary Rebound?
THORChain (RUNE) is gaining renewed market attention following a notable price surge. Nevertheless, its broader trend remains uncertain, with technical resistance and fundamental risks shaping the outlook.
📊 MARKET OVERVIEW
- Current price: $0.62–$0.64
- 24H gains: Approximately 12–14%
- Market capitalization: $205M–$211M
- Trading activity: Increasing market participation.
🐂 BULLISH CATALYSTS
- Improving short-term momentum.
- Recovery above key moving averages.
- Progress on previous solvency concerns.
- Potential restoration of investor confidence.
🐻 BEARISH RISKS
- Broader weekly trend remains bearish.
- Inconclusive MACD confirmation.
- Cross-chain operational disruptions.
- Persistent regulatory uncertainty.
🎯 KEY PRICE LEVELS
- $0.5775 — Support
- $0.635–$0.661 — Immediate resistance
- $0.7899 — Major resistance
- $1.17 — Higher resistance reference
📈 MARKET OUTLOOK
A decisive breakout above resistance, supported by sustained volume and improving fundamentals, could strengthen the recovery narrative.
Conversely, renewed selling pressure and weakening support could expose RUNE to further downside.
🧠 FINAL VERDICT
RUNE is displaying encouraging short-term momentum, but a confirmed trend reversal remains elusive. Sustainable upside will depend on stronger demand, technical confirmation and renewed confidence in THORChain's ecosystem.
Is RUNE Entering a Sustainable Recovery or Facing Another Temporary Rebound?
THORChain (RUNE) is gaining renewed market attention following a notable price surge. Nevertheless, its broader trend remains uncertain, with technical resistance and fundamental risks shaping the outlook.
📊 MARKET OVERVIEW
- Current price: $0.62–$0.64
- 24H gains: Approximately 12–14%
- Market capitalization: $205M–$211M
- Trading activity: Increasing market participation.
🐂 BULLISH CATALYSTS
- Improving short-term momentum.
- Recovery above key moving averages.
- Progress on previous solvency concerns.
- Potential restoration of investor confidence.
🐻 BEARISH RISKS
- Broader weekly trend remains bearish.
- Inconclusive MACD confirmation.
- Cross-chain operational disruptions.
- Persistent regulatory uncertainty.
🎯 KEY PRICE LEVELS
- $0.5775 — Support
- $0.635–$0.661 — Immediate resistance
- $0.7899 — Major resistance
- $1.17 — Higher resistance reference
📈 MARKET OUTLOOK
A decisive breakout above resistance, supported by sustained volume and improving fundamentals, could strengthen the recovery narrative.
Conversely, renewed selling pressure and weakening support could expose RUNE to further downside.
🧠 FINAL VERDICT
RUNE is displaying encouraging short-term momentum, but a confirmed trend reversal remains elusive. Sustainable upside will depend on stronger demand, technical confirmation and renewed confidence in THORChain's ecosystem.
101
Übersetzung ansehen
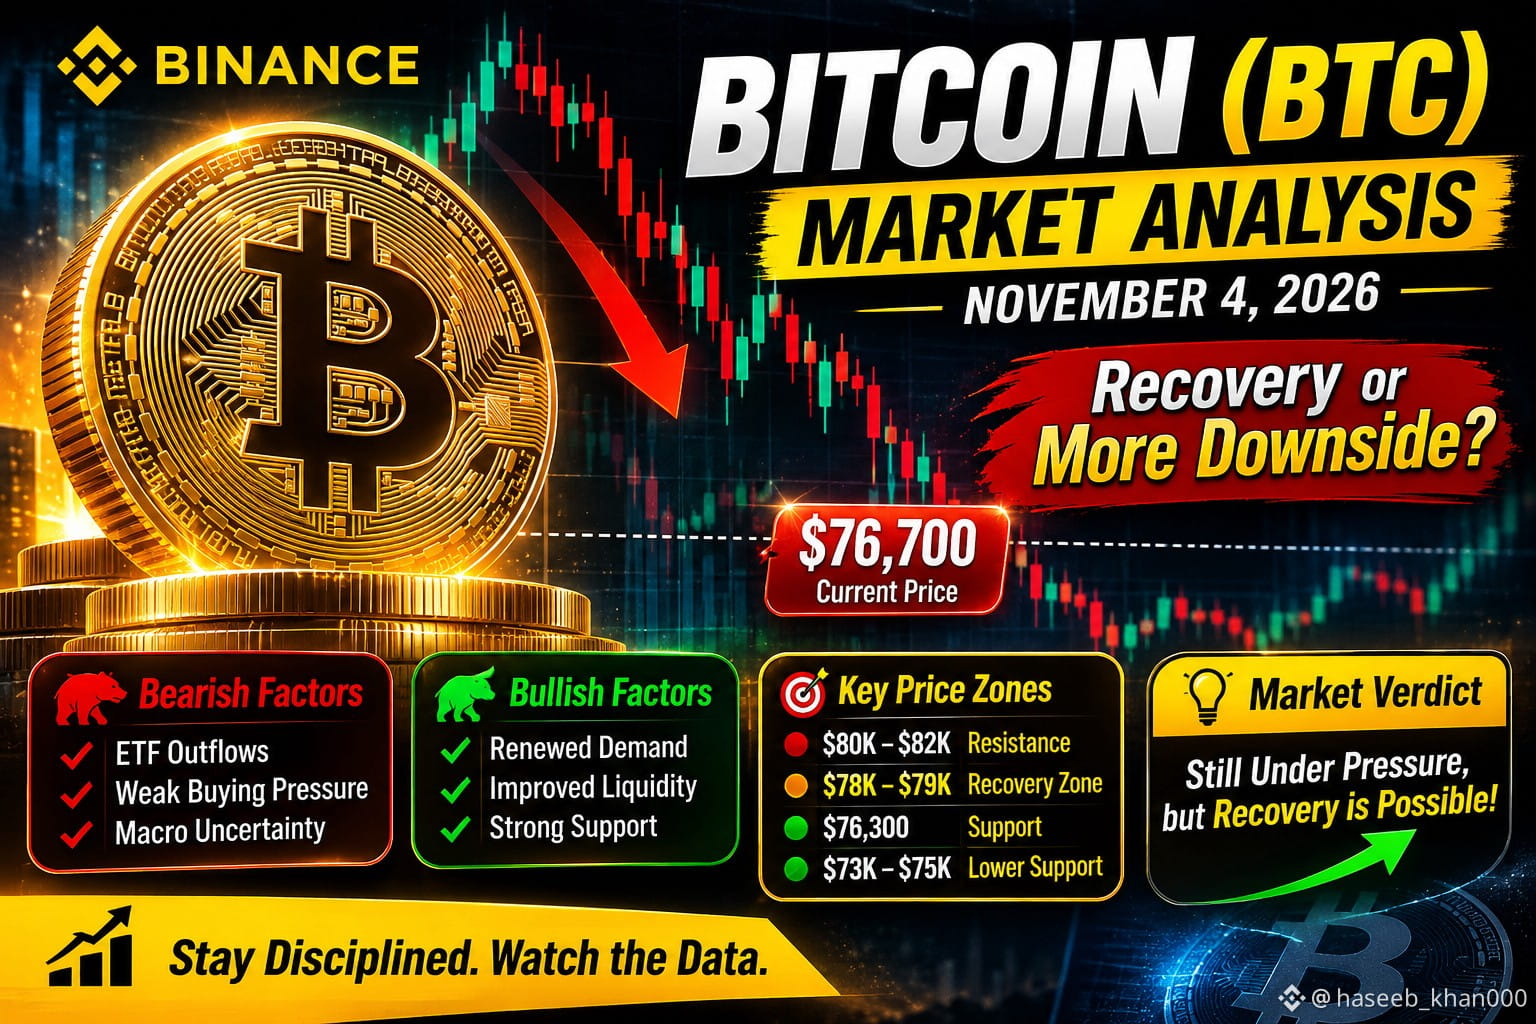
🚨 BITCOIN (BTC)
Is Bitcoin Preparing for a Recovery or Facing Further Downside Pressure?
Bitcoin is navigating a challenging market environment, with institutional ETF outflows, weakening sentiment and increased derivatives activity creating short-term uncertainty.
📊 Market Overview
- BTC recently traded around $76,700–$76,900.
- Spot Bitcoin ETFs recorded approximately $399M in outflows.
- Futures activity and liquidations increased significantly.
- Market sentiment remains in the Fear zone.
🐻 Bearish Outlook
Continued ETF outflows, weak buying pressure and macroeconomic uncertainty could limit Bitcoin's recovery.
🐂 Bullish Outlook
Renewed institutional demand, stronger spot volume and improved liquidity could support a potential rebound.
🎯 Key Price Levels
- $76,300 — Recent price reference.
- $78K–$79K — Recovery zone.
- $80K–$82K — Major resistance region.
- $73K–$75K — Lower support reference.
🧠 Market Verdict
Bitcoin remains under short-term pressure, but its broader outlook is not necessarily broken. A sustainable recovery will require stronger spot demand, institutional inflows and confirmation from market volume.
Stay disciplined. Watch the data. Never confuse market volatility with a confirmed trend reversal.
{future}(BTCUSDT)
🚨 BITCOIN (BTC)
Is Bitcoin Preparing for a Recovery or Facing Further Downside Pressure?
Bitcoin is navigating a challenging market environment, with institutional ETF outflows, weakening sentiment and increased derivatives activity creating short-term uncertainty.
📊 Market Overview
- BTC recently traded around $76,700–$76,900.
- Spot Bitcoin ETFs recorded approximately $399M in outflows.
- Futures activity and liquidations increased significantly.
- Market sentiment remains in the Fear zone.
🐻 Bearish Outlook
Continued ETF outflows, weak buying pressure and macroeconomic uncertainty could limit Bitcoin's recovery.
🐂 Bullish Outlook
Renewed institutional demand, stronger spot volume and improved liquidity could support a potential rebound.
🎯 Key Price Levels
- $76,300 — Recent price reference.
- $78K–$79K — Recovery zone.
- $80K–$82K — Major resistance region.
- $73K–$75K — Lower support reference.
🧠 Market Verdict
Bitcoin remains under short-term pressure, but its broader outlook is not necessarily broken. A sustainable recovery will require stronger spot demand, institutional inflows and confirmation from market volume.
Stay disciplined. Watch the data. Never confuse market volatility with a confirmed trend reversal.
Is Bitcoin Preparing for a Recovery or Facing Further Downside Pressure?
Bitcoin is navigating a challenging market environment, with institutional ETF outflows, weakening sentiment and increased derivatives activity creating short-term uncertainty.
📊 Market Overview
- BTC recently traded around $76,700–$76,900.
- Spot Bitcoin ETFs recorded approximately $399M in outflows.
- Futures activity and liquidations increased significantly.
- Market sentiment remains in the Fear zone.
🐻 Bearish Outlook
Continued ETF outflows, weak buying pressure and macroeconomic uncertainty could limit Bitcoin's recovery.
🐂 Bullish Outlook
Renewed institutional demand, stronger spot volume and improved liquidity could support a potential rebound.
🎯 Key Price Levels
- $76,300 — Recent price reference.
- $78K–$79K — Recovery zone.
- $80K–$82K — Major resistance region.
- $73K–$75K — Lower support reference.
🧠 Market Verdict
Bitcoin remains under short-term pressure, but its broader outlook is not necessarily broken. A sustainable recovery will require stronger spot demand, institutional inflows and confirmation from market volume.
Stay disciplined. Watch the data. Never confuse market volatility with a confirmed trend reversal.
68
Übersetzung ansehen
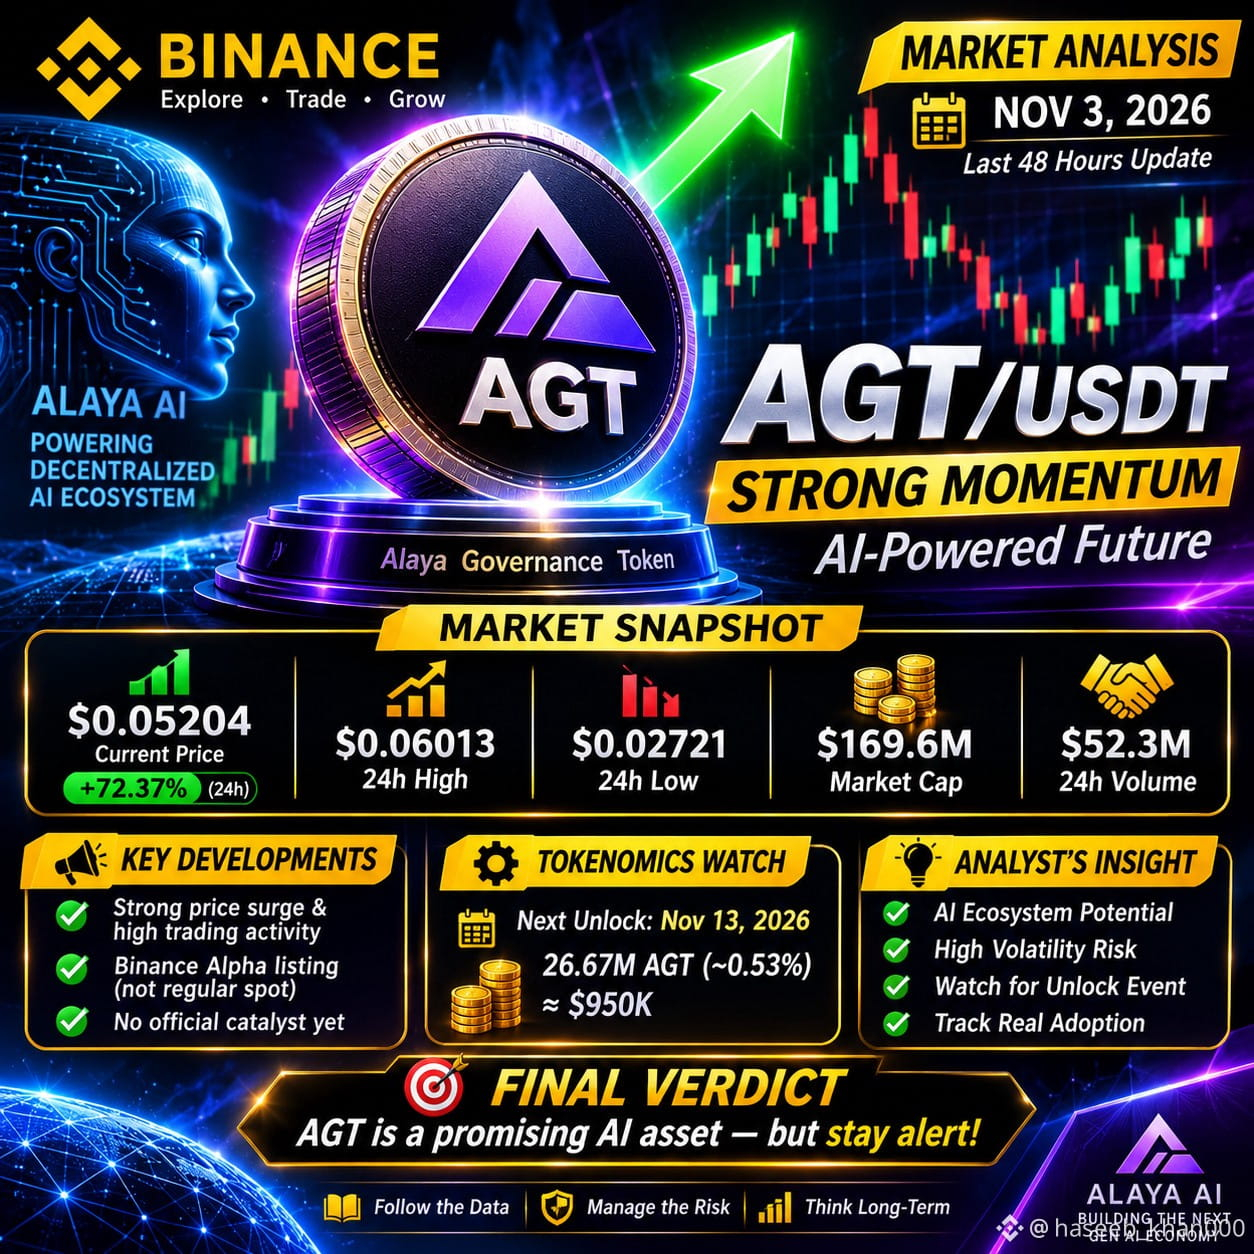
$AGT 🚨 AGT TOKEN — MASTER MARKET ANALYSIS
📊 NOVEMBER 3, 2026 | MARKET & FUNDAMENTAL UPDATE
🔥 1. MARKET OVERVIEW
💰 Price: $0.05204
📈 24H Change: +72.37%
🔺 24H High: $0.06013
🔻 24H Low: $0.02721
📊 Market Cap: $169.6M
💹 24H Volume: $52.3M
Market data snapshot from Binance, November 3, 2026.
📰 2. LATEST MARKET DEVELOPMENTS
🔹 AGT has experienced significant price appreciation and increased trading activity.
🔹 Market attention around AI-related crypto projects has contributed to growing interest in the sector.
🔹 AGT is featured on Binance Alpha, but is not currently listed for regular Binance spot trading.
🔹 No independently verified official announcement has established a specific catalyst for the entire recent rally.
🧠 3. FUNDAMENTAL ANALYSIS
Alaya AI focuses on decentralized AI data infrastructure.
Its ecosystem combines:
• AI data contributions
• Governance participation
• Staking utility
• Data marketplace development
• NFT-based ecosystem incentives
📊 4. TOKENOMICS WATCH
Maximum Supply: 5 Billion AGT
Upcoming Unlock:
📅 November 13, 2026
🔓 26.67 Million AGT
💵 Estimated Value: $950K
This represents approximately 0.53% of maximum supply and deserves attention when evaluating future supply dynamics.
⚠️ 5. KEY MARKET RISKS
• Extreme short-term volatility
• Potential profit-taking after a rapid rally
• Upcoming token unlock
• Liquidity and market-depth uncertainty
• Dependence on actual AI ecosystem adoption
🎯 6. PROFESSIONAL ANALYST'S VIEW
AGT is attracting attention through its strong market momentum and AI-focused ecosystem.
However, sustainable growth requires more than price appreciation. Real platform adoption, token utility, transparent supply management and consistent development will be essential.
FINAL VERDICT
{future}(AGTUSDT)
AGT is an interesting AI-sector asset worth monitoring from a research perspective. Its recent momentum is significant, but volatility and upcoming token-supply changes deserve equal attention.
$AGT 🚨 AGT TOKEN — MASTER MARKET ANALYSIS
📊 NOVEMBER 3, 2026 | MARKET & FUNDAMENTAL UPDATE
🔥 1. MARKET OVERVIEW
💰 Price: $0.05204
📈 24H Change: +72.37%
🔺 24H High: $0.06013
🔻 24H Low: $0.02721
📊 Market Cap: $169.6M
💹 24H Volume: $52.3M
Market data snapshot from Binance, November 3, 2026.
📰 2. LATEST MARKET DEVELOPMENTS
🔹 AGT has experienced significant price appreciation and increased trading activity.
🔹 Market attention around AI-related crypto projects has contributed to growing interest in the sector.
🔹 AGT is featured on Binance Alpha, but is not currently listed for regular Binance spot trading.
🔹 No independently verified official announcement has established a specific catalyst for the entire recent rally.
🧠 3. FUNDAMENTAL ANALYSIS
Alaya AI focuses on decentralized AI data infrastructure.
Its ecosystem combines:
• AI data contributions
• Governance participation
• Staking utility
• Data marketplace development
• NFT-based ecosystem incentives
📊 4. TOKENOMICS WATCH
Maximum Supply: 5 Billion AGT
Upcoming Unlock:
📅 November 13, 2026
🔓 26.67 Million AGT
💵 Estimated Value: $950K
This represents approximately 0.53% of maximum supply and deserves attention when evaluating future supply dynamics.
⚠️ 5. KEY MARKET RISKS
• Extreme short-term volatility
• Potential profit-taking after a rapid rally
• Upcoming token unlock
• Liquidity and market-depth uncertainty
• Dependence on actual AI ecosystem adoption
🎯 6. PROFESSIONAL ANALYST'S VIEW
AGT is attracting attention through its strong market momentum and AI-focused ecosystem.
However, sustainable growth requires more than price appreciation. Real platform adoption, token utility, transparent supply management and consistent development will be essential.
FINAL VERDICT
AGT is an interesting AI-sector asset worth monitoring from a research perspective. Its recent momentum is significant, but volatility and upcoming token-supply changes deserve equal attention.
📊 NOVEMBER 3, 2026 | MARKET & FUNDAMENTAL UPDATE
🔥 1. MARKET OVERVIEW
💰 Price: $0.05204
📈 24H Change: +72.37%
🔺 24H High: $0.06013
🔻 24H Low: $0.02721
📊 Market Cap: $169.6M
💹 24H Volume: $52.3M
Market data snapshot from Binance, November 3, 2026.
📰 2. LATEST MARKET DEVELOPMENTS
🔹 AGT has experienced significant price appreciation and increased trading activity.
🔹 Market attention around AI-related crypto projects has contributed to growing interest in the sector.
🔹 AGT is featured on Binance Alpha, but is not currently listed for regular Binance spot trading.
🔹 No independently verified official announcement has established a specific catalyst for the entire recent rally.
🧠 3. FUNDAMENTAL ANALYSIS
Alaya AI focuses on decentralized AI data infrastructure.
Its ecosystem combines:
• AI data contributions
• Governance participation
• Staking utility
• Data marketplace development
• NFT-based ecosystem incentives
📊 4. TOKENOMICS WATCH
Maximum Supply: 5 Billion AGT
Upcoming Unlock:
📅 November 13, 2026
🔓 26.67 Million AGT
💵 Estimated Value: $950K
This represents approximately 0.53% of maximum supply and deserves attention when evaluating future supply dynamics.
⚠️ 5. KEY MARKET RISKS
• Extreme short-term volatility
• Potential profit-taking after a rapid rally
• Upcoming token unlock
• Liquidity and market-depth uncertainty
• Dependence on actual AI ecosystem adoption
🎯 6. PROFESSIONAL ANALYST'S VIEW
AGT is attracting attention through its strong market momentum and AI-focused ecosystem.
However, sustainable growth requires more than price appreciation. Real platform adoption, token utility, transparent supply management and consistent development will be essential.
FINAL VERDICT
AGT is an interesting AI-sector asset worth monitoring from a research perspective. Its recent momentum is significant, but volatility and upcoming token-supply changes deserve equal attention.
237
Übersetzung ansehen
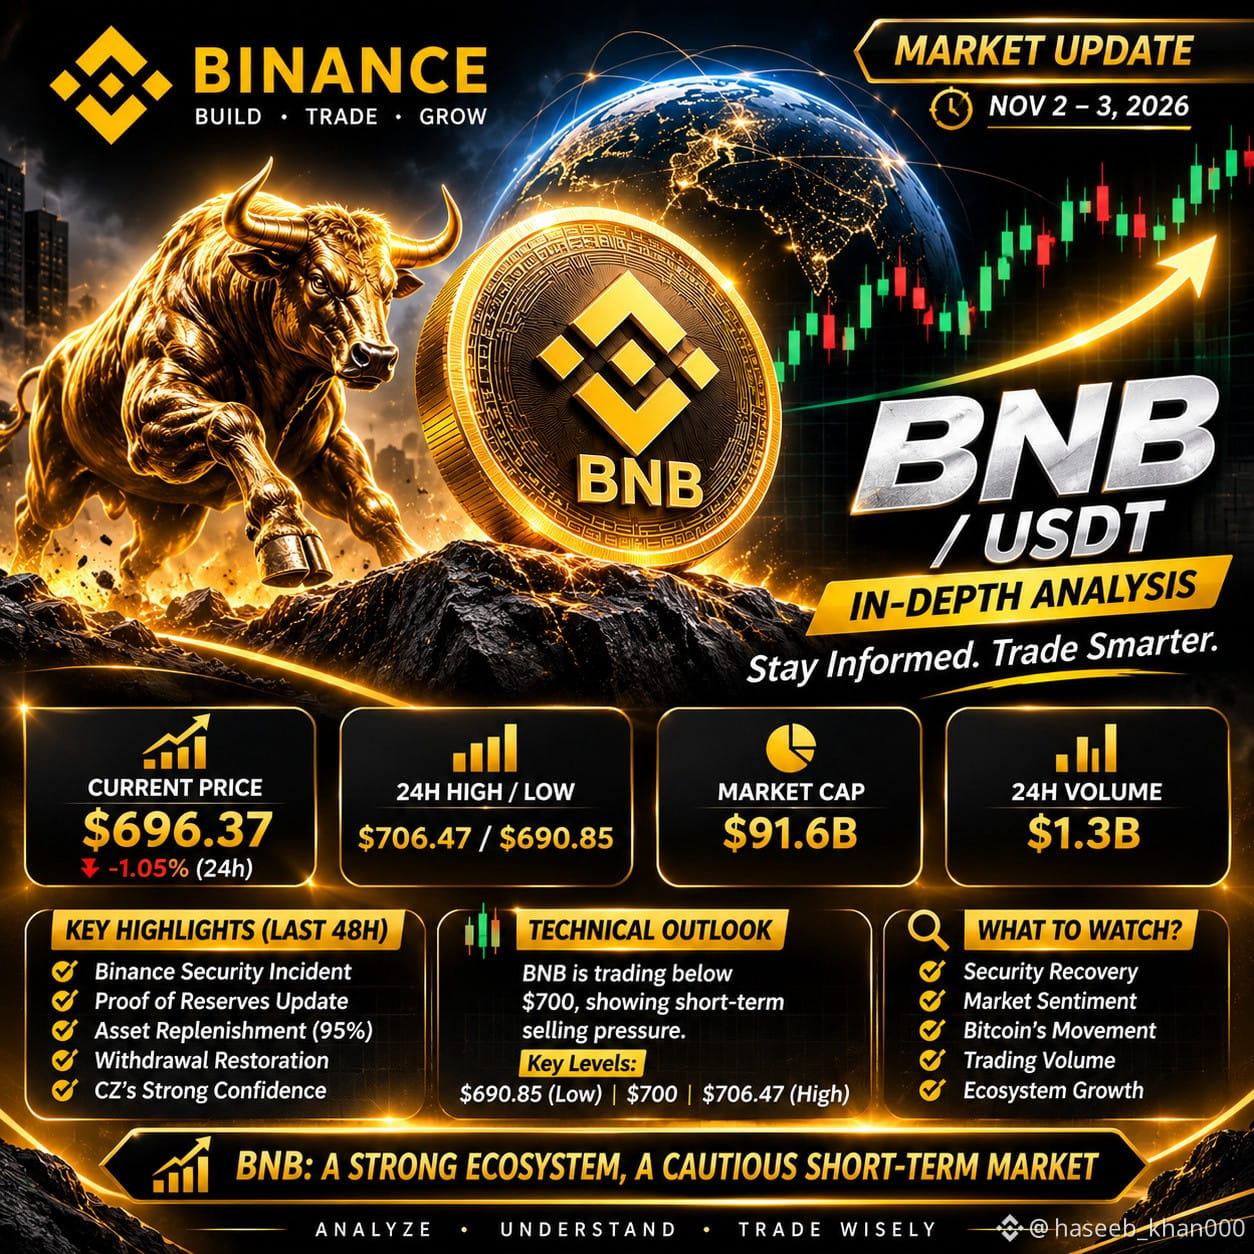
🚨 BNB/USDT | PROFESSIONAL MARKET UPDATE
📊 November 3, 2026 | Last 48 Hours
📍 MARKET OVERVIEW
💰 Price: $696.37
📉 24H Change: -1.05%
🔺 24H High: $706.47
🔻 24H Low: $690.85
📊 Market Cap: $91.6B
💹 24H Volume: $1.3B
📰 KEY MARKET DEVELOPMENTS
🔹 Binance security incident and recovery efforts remain in focus.
🔹 Updated Zero-Knowledge Proof of Reserves verification covering 10 major assets.
🔹 Management reported approximately 95% asset replenishment.
🔹 Withdrawal services are progressively being restored.
🔹 Binance leadership reported normalized customer flows and strong financial health.
📈 TECHNICAL MARKET OUTLOOK
BNB is trading below the psychological $700 level, indicating short-term selling pressure.
Key price references:
• $690.85 — 24H Low
• $700 — Psychological Level
• $706.47 — 24H High
🔍 WHAT'S NEXT?
Monitor Binance recovery updates, Bitcoin's direction, trading volume, market sentiment and ecosystem developments.
💡 ANALYST'S INSIGHT
BNB's long-term ecosystem relevance remains important, but short-term market sentiment, liquidity and exchange confidence deserve close attention.
🎯 FINAL VERDICT
The current outlook remains cautious. Market participants should prioritize research, risk awareness and independent analysis rather than emotional decisions.
{future}(BNBUSDT)
🚨 BNB/USDT | PROFESSIONAL MARKET UPDATE
📊 November 3, 2026 | Last 48 Hours
📍 MARKET OVERVIEW
💰 Price: $696.37
📉 24H Change: -1.05%
🔺 24H High: $706.47
🔻 24H Low: $690.85
📊 Market Cap: $91.6B
💹 24H Volume: $1.3B
📰 KEY MARKET DEVELOPMENTS
🔹 Binance security incident and recovery efforts remain in focus.
🔹 Updated Zero-Knowledge Proof of Reserves verification covering 10 major assets.
🔹 Management reported approximately 95% asset replenishment.
🔹 Withdrawal services are progressively being restored.
🔹 Binance leadership reported normalized customer flows and strong financial health.
📈 TECHNICAL MARKET OUTLOOK
BNB is trading below the psychological $700 level, indicating short-term selling pressure.
Key price references:
• $690.85 — 24H Low
• $700 — Psychological Level
• $706.47 — 24H High
🔍 WHAT'S NEXT?
Monitor Binance recovery updates, Bitcoin's direction, trading volume, market sentiment and ecosystem developments.
💡 ANALYST'S INSIGHT
BNB's long-term ecosystem relevance remains important, but short-term market sentiment, liquidity and exchange confidence deserve close attention.
🎯 FINAL VERDICT
The current outlook remains cautious. Market participants should prioritize research, risk awareness and independent analysis rather than emotional decisions.
📊 November 3, 2026 | Last 48 Hours
📍 MARKET OVERVIEW
💰 Price: $696.37
📉 24H Change: -1.05%
🔺 24H High: $706.47
🔻 24H Low: $690.85
📊 Market Cap: $91.6B
💹 24H Volume: $1.3B
📰 KEY MARKET DEVELOPMENTS
🔹 Binance security incident and recovery efforts remain in focus.
🔹 Updated Zero-Knowledge Proof of Reserves verification covering 10 major assets.
🔹 Management reported approximately 95% asset replenishment.
🔹 Withdrawal services are progressively being restored.
🔹 Binance leadership reported normalized customer flows and strong financial health.
📈 TECHNICAL MARKET OUTLOOK
BNB is trading below the psychological $700 level, indicating short-term selling pressure.
Key price references:
• $690.85 — 24H Low
• $700 — Psychological Level
• $706.47 — 24H High
🔍 WHAT'S NEXT?
Monitor Binance recovery updates, Bitcoin's direction, trading volume, market sentiment and ecosystem developments.
💡 ANALYST'S INSIGHT
BNB's long-term ecosystem relevance remains important, but short-term market sentiment, liquidity and exchange confidence deserve close attention.
🎯 FINAL VERDICT
The current outlook remains cautious. Market participants should prioritize research, risk awareness and independent analysis rather than emotional decisions.
63
Übersetzung ansehen
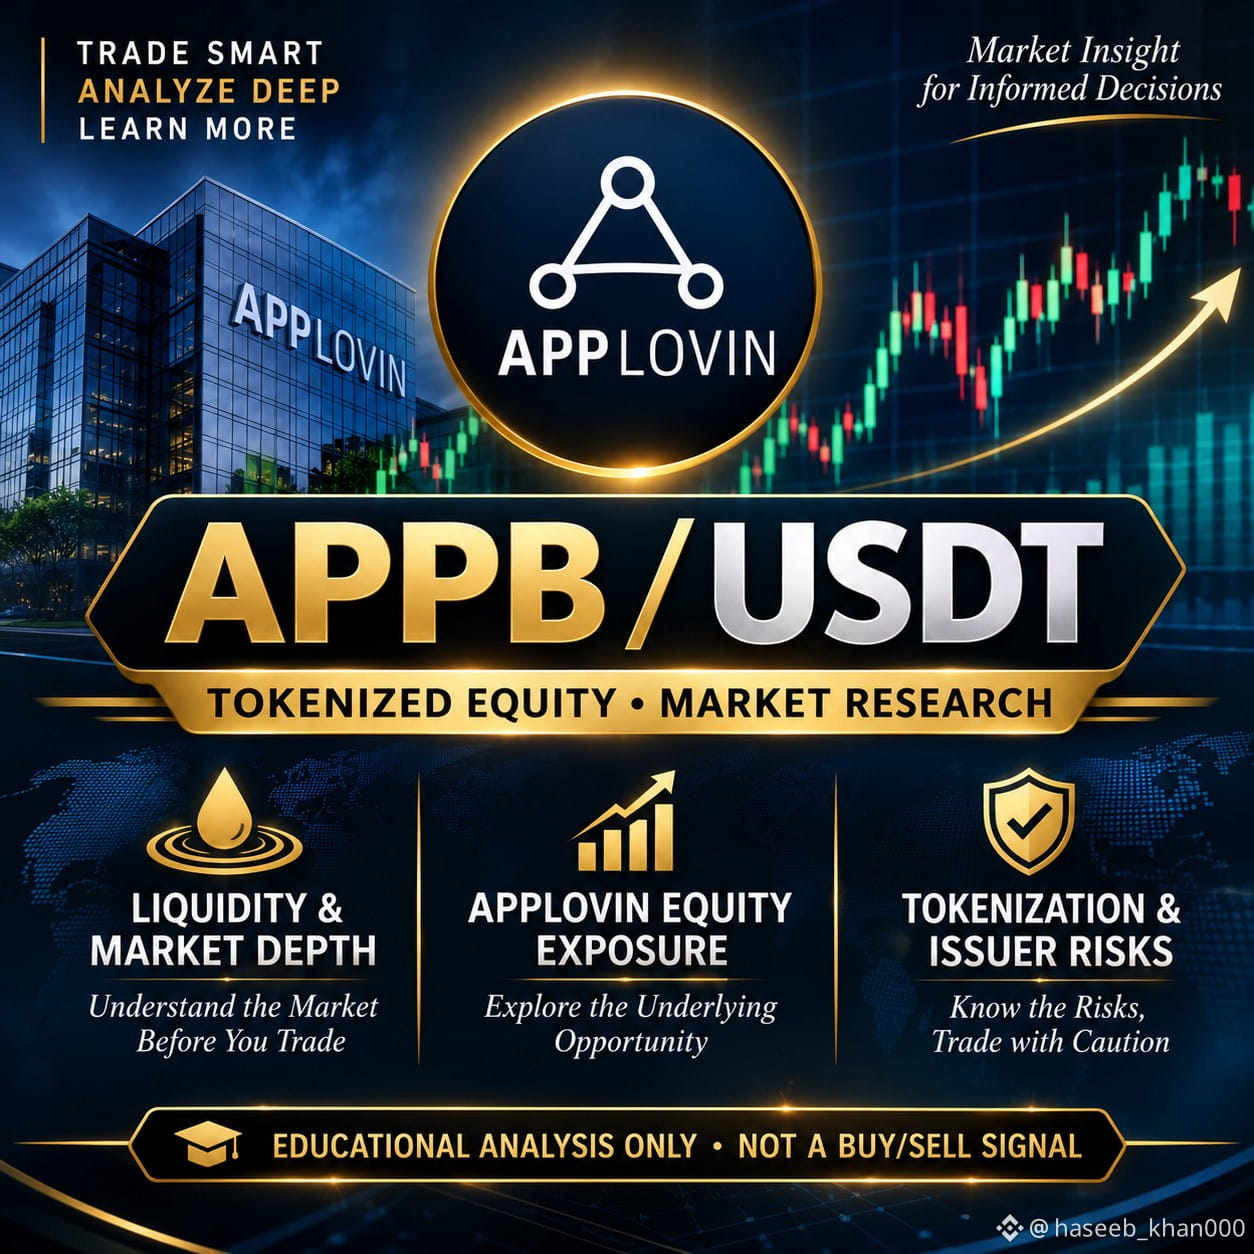
$APPB 📊 APPB/USDT — THE MARKET INSIGHT
Understanding an asset requires more than watching green and red candles.
APPB represents tokenized exposure to AppLovin Corp. Its market deserves attention across three important dimensions:
🔹 Liquidity: Understand market depth and trading activity.
🔹 Underlying Asset: Monitor AppLovin's equity performance.
🔹 Risk Factors: Consider tokenization, issuer, platform and regulatory risks.
💡 A professional analyst studies the asset, understands the risks, and avoids emotional decisions.
Remember: Market research comes before market participation.
📈 Trade Smart. Analyze Deep. Learn More.
#APPB #USDT
$APPB 📊 APPB/USDT — THE MARKET INSIGHT
Understanding an asset requires more than watching green and red candles.
APPB represents tokenized exposure to AppLovin Corp. Its market deserves attention across three important dimensions:
🔹 Liquidity: Understand market depth and trading activity.
🔹 Underlying Asset: Monitor AppLovin's equity performance.
🔹 Risk Factors: Consider tokenization, issuer, platform and regulatory risks.
💡 A professional analyst studies the asset, understands the risks, and avoids emotional decisions.
Remember: Market research comes before market participation.
📈 Trade Smart. Analyze Deep. Learn More.
#APPB #USDT
Understanding an asset requires more than watching green and red candles.
APPB represents tokenized exposure to AppLovin Corp. Its market deserves attention across three important dimensions:
🔹 Liquidity: Understand market depth and trading activity.
🔹 Underlying Asset: Monitor AppLovin's equity performance.
🔹 Risk Factors: Consider tokenization, issuer, platform and regulatory risks.
💡 A professional analyst studies the asset, understands the risks, and avoids emotional decisions.
Remember: Market research comes before market participation.
📈 Trade Smart. Analyze Deep. Learn More.
#APPB #USDT
151
Anmelden und weiter Inhalte entdecken
Krypto-Nutzer weltweit auf Binance Square kennenlernen
⚡️ Bleib in Sachen Krypto stets am Puls.
💬 Die weltgrößte Kryptobörse vertraut darauf.
👍 Erhalte verlässliche Einblicke von verifizierten Creators.
E-Mail-Adresse/Telefonnummer
Trendthemen
BTCRebounds80K
66,806 Aufrufe
714 Kommentare
BITCOIN-UPDATE: ICH BIN IMMER NOCH BEARISH – UND HIER IST DER GRUND! 🚨⚠️
Wie ihr alle gesehen habt, erholte sich BTC vom Bereich um 75.700 $ und erreichte 81.000 $. Zuerst tappte der Markt Long-Trader in die Falle und anschließend Short-Trader.
Ich bin immer noch bearish. Zunächst einmal: Wie jeder weiß, haben die Demokraten heute die US-Zwischenwahlen gewonnen, und meiner Ansicht nach ist dieses Ergebnis bearish für den Markt.
Kurzfristig kann der Markt volatil bleiben und so viele Trader in die Falle locken, wie er will – das ändert jedoch nichts am allgemeinen Marktausblick.
Es stehen mehrere wichtige Ereignisse an, darunter die US-Beschäftigungszahlen außerhalb der Landwirtschaft (6. November), die US-CPI-Inflation (10. November), der US-PPI (13. November), die US-Einzelhandelsumsätze (17. November), das Protokoll der FOMC-Sitzung (18. November), die US-PCE-Inflation (25. November), die Zinserwartungen der Federal Reserve, der US-Dollar-Index (DXY), die Renditen von US-Staatsanleihen, die Entwicklung des Nasdaq, die Zu- und Abflüsse bei Bitcoin-ETFs sowie die anhaltenden geopolitischen Entwicklungen zwischen (Iran) und Israel. All dies könnte erhebliche Auswirkungen auf Bitcoin und den gesamten Kryptomarkt haben.
Lasst euch aber nicht zu sehr von Bitcoins jüngster Kursbewegung mitreißen. Technisch gesehen gab es noch keine größere bullishe Bewegung. Gestern wurde BTC zwischen 80.000 $ und 82.000 $ gehandelt, und auch heute bewegt sich der Kurs noch ungefähr in derselben Spanne.
Wenn ihr bullish werden wollt, ist das ganz allein eure Entscheidung.
In meinem vorherigen Beitrag habe ich klar erklärt, dass BTC im Bereich von 75.000 $ / 76.000 $ technische Unterstützung hatte. Der Kurs prallte von dieser Unterstützung ab und bewegte sich wieder in Richtung 80.000 $. Das war aber nichts, was ich zuvor unerwähnt gelassen hätte. Tatsächlich habe ich in meinen Beiträgen wiederholt darauf hingewiesen, dass BTC in Richtung 80.000 $, 81.000 $ oder sogar 82.000 $ steigen könnte.
Trotzdem bin ich weiterhin bearish.
Und ich habe nicht nur einen Grund für meinen bearishen Ausblick. Es gibt mehrere Gründe, die ich bereits in meinen vorherigen Beiträgen erläutert habe.
Vorerst werde ich weiter darauf warten, dass BTC unter 74.000 $ fällt – meiner Meinung nach könnte das sehr bald passieren. Meiner Ansicht nach ist eine solche Korrektur für den Markt auch notwendig.
Wenn jemand Hilfe oder Orientierung rund um Kryptowährungen sucht, kann er sich einfach bei mir melden.
#BTCRebounds80K
Strategic Adviser
·30 Likes
·32.4k Aufrufe
Binance98PercentReplenished
40,464 Aufrufe
561 Kommentare
USMidterms-WhatAreMarketsExpecting?
346,859 Aufrufe
2,075 Kommentare