

Ace_V
2.1k Beiträge

Ace_V
Melden
Nutzer blockieren
Read the tape, not the noise. Clear support/resistance maps on BTC, ETH & today's movers - real data, zero hype. New reads daily.
14 Following
56 Follower
221 Like gegeben
Beiträge
Alle
Videos
·
--
Artikel
Die Regierung bewegt 297 Mio. $ an beschlagnahmter Krypto – das bedeutet es für BTCDie Schlagzeile, die heute am wichtigsten ist, geht nicht um Personalwechsel oder regulatorische Selbstdarstellung. Es geht darum, dass die US-Regierung 297 Millionen US-Dollar in beschlagnahmtem Bitcoin und Ether an Coinbase Prime verlagert hat. Das ist ein kaltes, mechanisches Signal – souveräne Liquidität trifft eine Verwahrstelle, die direkt an institutionelle Liquidität weiterleitet. Wenn eine Regierungsadresse Vermögenswerte an ein Prime-Brokerage sendet, liest der Markt genau ein Wort: Ausschüttung.
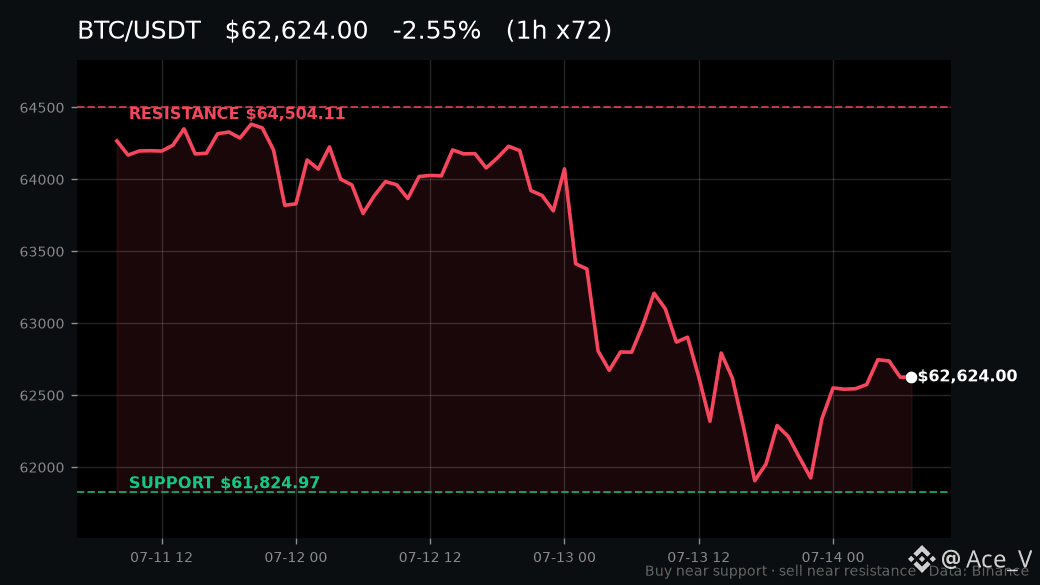
Für $BTC speziell fällt dieser Angebotsdruck in einen Markt, der ohnehin schon in der unteren Hälfte seiner kurzfristigen Spanne sitzt. CoinMarketCap-Daten zeigen, dass Bitcoin heute Morgen bei 62.697,08 US-Dollar notiert – ein marginaler Rückgang von 0,17 % über 24 Stunden bei 1,24 Milliarden US-Dollar Handelsvolumen auf Binance. Die Zahl selbst ist nicht bemerkenswert. Die Position im Chart ist es.
Die Regierung bewegt 297 Mio. $ an beschlagnahmter Krypto – das bedeutet es für BTC
Die Schlagzeile, die heute am wichtigsten ist, geht nicht um Personalwechsel oder regulatorische Selbstdarstellung. Es geht darum, dass die US-Regierung 297 Millionen US-Dollar in beschlagnahmtem Bitcoin und Ether an Coinbase Prime verlagert hat. Das ist ein kaltes, mechanisches Signal – souveräne Liquidität trifft eine Verwahrstelle, die direkt an institutionelle Liquidität weiterleitet. Wenn eine Regierungsadresse Vermögenswerte an ein Prime-Brokerage sendet, liest der Markt genau ein Wort: Ausschüttung.
Für $BTC speziell fällt dieser Angebotsdruck in einen Markt, der ohnehin schon in der unteren Hälfte seiner kurzfristigen Spanne sitzt. CoinMarketCap-Daten zeigen, dass Bitcoin heute Morgen bei 62.697,08 US-Dollar notiert – ein marginaler Rückgang von 0,17 % über 24 Stunden bei 1,24 Milliarden US-Dollar Handelsvolumen auf Binance. Die Zahl selbst ist nicht bemerkenswert. Die Position im Chart ist es.
Für $BTC speziell fällt dieser Angebotsdruck in einen Markt, der ohnehin schon in der unteren Hälfte seiner kurzfristigen Spanne sitzt. CoinMarketCap-Daten zeigen, dass Bitcoin heute Morgen bei 62.697,08 US-Dollar notiert – ein marginaler Rückgang von 0,17 % über 24 Stunden bei 1,24 Milliarden US-Dollar Handelsvolumen auf Binance. Die Zahl selbst ist nicht bemerkenswert. Die Position im Chart ist es.
19
·
--
Ethereum ist grün, während Solana rot blutet — aber die eigentliche Frage ist, welche Layer-1 wirklich an Stärke aufbaut.
Stell es dir wie ein Rennen vor. Nicht darum, wer heute mehr in Bewegung ist, sondern welche Kette standhält und welche gerade an Schwung verliert.
Laut CoinMarketCap sitzt $ETH bei 1.786,48 US-Dollar, ein Plus von 0,53 % bei einem Volumen von 379,24 Mio. US-Dollar. Es geht in Richtung des 72h-Widerstands bei 1.846 US-Dollar, während Käufer die Unterstützung bei 1.750,20 US-Dollar verteidigen. Wenn ETH über diesem Boden bleibt, bleibt der Weg in Richtung Widerstand offen. Verliere 1.750 und der Momentum-Wechsel wird real.
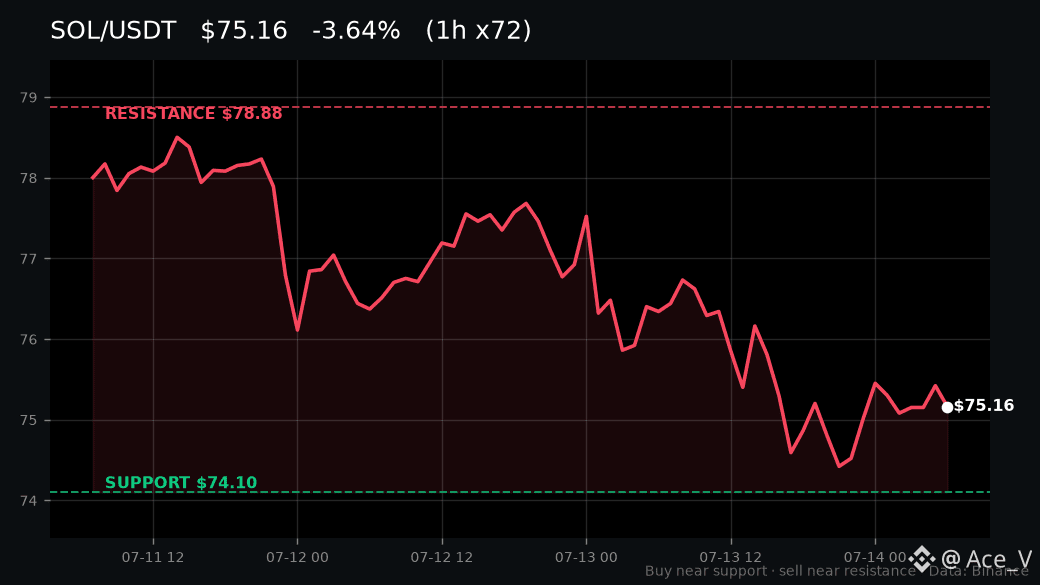
$SOL erzählt eine andere Geschichte. Bei 75,29 US-Dollar, ein Minus von 1,40 % bei einem geringeren Volumen von 97,41 Mio. US-Dollar, schwebt es knapp über der 72h-Unterstützung von 74,10 US-Dollar. Fällt das, übernehmen die Verkäufer die Kontrolle. Der Widerstand liegt ganz oben bei 78,88 US-Dollar.
Das Volumen bestätigt die Rangfolge — Geld fließt in $ETH, nicht in $SOL. Das heutige Orderbuch zeichnet einen klaren Sieger.
ETH hier in Richtung Widerstand folgen oder auf einen Rücksetzer auf 1.750 warten? Keine Finanzberatung.
Das $ETH -Paar ist nur einen Tip entfernt, und die 1.846er-Marke ist der Punkt, an dem es entschieden wird.
Verstehen, dann entscheiden.
#Solana #SOL #Ethereum #ETH
Ethereum ist grün, während Solana rot blutet — aber die eigentliche Frage ist, welche Layer-1 wirklich an Stärke aufbaut.
Stell es dir wie ein Rennen vor. Nicht darum, wer heute mehr in Bewegung ist, sondern welche Kette standhält und welche gerade an Schwung verliert.
Laut CoinMarketCap sitzt $ETH bei 1.786,48 US-Dollar, ein Plus von 0,53 % bei einem Volumen von 379,24 Mio. US-Dollar. Es geht in Richtung des 72h-Widerstands bei 1.846 US-Dollar, während Käufer die Unterstützung bei 1.750,20 US-Dollar verteidigen. Wenn ETH über diesem Boden bleibt, bleibt der Weg in Richtung Widerstand offen. Verliere 1.750 und der Momentum-Wechsel wird real.
$SOL erzählt eine andere Geschichte. Bei 75,29 US-Dollar, ein Minus von 1,40 % bei einem geringeren Volumen von 97,41 Mio. US-Dollar, schwebt es knapp über der 72h-Unterstützung von 74,10 US-Dollar. Fällt das, übernehmen die Verkäufer die Kontrolle. Der Widerstand liegt ganz oben bei 78,88 US-Dollar.
Das Volumen bestätigt die Rangfolge — Geld fließt in $ETH , nicht in $SOL . Das heutige Orderbuch zeichnet einen klaren Sieger.
ETH hier in Richtung Widerstand folgen oder auf einen Rücksetzer auf 1.750 warten? Keine Finanzberatung.
Das $ETH -Paar ist nur einen Tip entfernt, und die 1.846er-Marke ist der Punkt, an dem es entschieden wird.
Verstehen, dann entscheiden.
#Solana #SOL #Ethereum #ETH
Stell es dir wie ein Rennen vor. Nicht darum, wer heute mehr in Bewegung ist, sondern welche Kette standhält und welche gerade an Schwung verliert.
Laut CoinMarketCap sitzt $ETH bei 1.786,48 US-Dollar, ein Plus von 0,53 % bei einem Volumen von 379,24 Mio. US-Dollar. Es geht in Richtung des 72h-Widerstands bei 1.846 US-Dollar, während Käufer die Unterstützung bei 1.750,20 US-Dollar verteidigen. Wenn ETH über diesem Boden bleibt, bleibt der Weg in Richtung Widerstand offen. Verliere 1.750 und der Momentum-Wechsel wird real.
$SOL erzählt eine andere Geschichte. Bei 75,29 US-Dollar, ein Minus von 1,40 % bei einem geringeren Volumen von 97,41 Mio. US-Dollar, schwebt es knapp über der 72h-Unterstützung von 74,10 US-Dollar. Fällt das, übernehmen die Verkäufer die Kontrolle. Der Widerstand liegt ganz oben bei 78,88 US-Dollar.
Das Volumen bestätigt die Rangfolge — Geld fließt in $ETH , nicht in $SOL . Das heutige Orderbuch zeichnet einen klaren Sieger.
ETH hier in Richtung Widerstand folgen oder auf einen Rücksetzer auf 1.750 warten? Keine Finanzberatung.
Das $ETH -Paar ist nur einen Tip entfernt, und die 1.846er-Marke ist der Punkt, an dem es entschieden wird.
Verstehen, dann entscheiden.
#Solana #SOL #Ethereum #ETH
34
·
--
Alle reden über die Binance-Square-Kampagne von GRVT, als wäre sie ein garantiertes Katalysator-Event. Engagement-Farming, Belohnungspunkte, Social-Buzz — das übliche Vorgehen.
Aber das sagt uns der Kursverlauf tatsächlich: Die US-Regierung hat soeben 297 Millionen US-Dollar in beschlagnahmtem Bitcoin und Ether an Coinbase Prime überweisen, und ein Krypto-Berater des Weißen Hauses schickt sich gerade für ein militärisches Training. Das regulatorische und institutionelle Umfeld verschiebt sich im Moment unter den Füßen jedes neuen Exchange-Tokens.
Kampagnen erzeugen Klicks, nicht Liquidität. Der hybride DEX-Ansatz von GRVT ist tatsächlich interessant — aber Social Volume ohne Tiefe im Orderbuch ist nur Rauschen. Das entscheidende Signal ist, ob die Hype-Welle in einen tatsächlichen, nachhaltigen Zufluss im jeweiligen Handelspaar umschlägt.
Frag dich: Wenn die Kampagne endet und die Engagement-Belohnungen versiegen — hat $GRVT dann noch einen Grund, gehalten zu werden? Das ist die einzige Frage, die für alle zählt, die über eine Position nachdenken.
Wenn du dabei sein willst, wenn diese Antwort klar wird, ist das $GRVT-Paar auf dem Chart nur einen Klick entfernt. Keine finanzielle Beratung.
Wenn alle einer Meinung sind, prüfe die andere Seite.
#GRVT #Markets
Alle reden über die Binance-Square-Kampagne von GRVT, als wäre sie ein garantiertes Katalysator-Event. Engagement-Farming, Belohnungspunkte, Social-Buzz — das übliche Vorgehen.
Aber das sagt uns der Kursverlauf tatsächlich: Die US-Regierung hat soeben 297 Millionen US-Dollar in beschlagnahmtem Bitcoin und Ether an Coinbase Prime überweisen, und ein Krypto-Berater des Weißen Hauses schickt sich gerade für ein militärisches Training. Das regulatorische und institutionelle Umfeld verschiebt sich im Moment unter den Füßen jedes neuen Exchange-Tokens.
Kampagnen erzeugen Klicks, nicht Liquidität. Der hybride DEX-Ansatz von GRVT ist tatsächlich interessant — aber Social Volume ohne Tiefe im Orderbuch ist nur Rauschen. Das entscheidende Signal ist, ob die Hype-Welle in einen tatsächlichen, nachhaltigen Zufluss im jeweiligen Handelspaar umschlägt.
Frag dich: Wenn die Kampagne endet und die Engagement-Belohnungen versiegen — hat $GRVT dann noch einen Grund, gehalten zu werden? Das ist die einzige Frage, die für alle zählt, die über eine Position nachdenken.
Wenn du dabei sein willst, wenn diese Antwort klar wird, ist das $GRVT-Paar auf dem Chart nur einen Klick entfernt. Keine finanzielle Beratung.
Wenn alle einer Meinung sind, prüfe die andere Seite.
#GRVT #Markets
Aber das sagt uns der Kursverlauf tatsächlich: Die US-Regierung hat soeben 297 Millionen US-Dollar in beschlagnahmtem Bitcoin und Ether an Coinbase Prime überweisen, und ein Krypto-Berater des Weißen Hauses schickt sich gerade für ein militärisches Training. Das regulatorische und institutionelle Umfeld verschiebt sich im Moment unter den Füßen jedes neuen Exchange-Tokens.
Kampagnen erzeugen Klicks, nicht Liquidität. Der hybride DEX-Ansatz von GRVT ist tatsächlich interessant — aber Social Volume ohne Tiefe im Orderbuch ist nur Rauschen. Das entscheidende Signal ist, ob die Hype-Welle in einen tatsächlichen, nachhaltigen Zufluss im jeweiligen Handelspaar umschlägt.
Frag dich: Wenn die Kampagne endet und die Engagement-Belohnungen versiegen — hat $GRVT dann noch einen Grund, gehalten zu werden? Das ist die einzige Frage, die für alle zählt, die über eine Position nachdenken.
Wenn du dabei sein willst, wenn diese Antwort klar wird, ist das $GRVT-Paar auf dem Chart nur einen Klick entfernt. Keine finanzielle Beratung.
Wenn alle einer Meinung sind, prüfe die andere Seite.
#GRVT #Markets
2
15
·
--
Artikel
Funding-Rates flüstern, was Kurscharts nicht verratenBitcoin liegt bei 62.803,42 $ auf Binance und ist in den letzten 24 Stunden unverändert, bei einem Volumen von 1,21 Milliarden $. Ethereum ist einen Hauch höher bei 1.789,53 $, plus 0,36 Prozent bei 381,87 Millionen $ im täglichen Handel. Auf den ersten Blick wirkt beides ruhig. Doch Derivatemärkte sind nie wirklich ruhig — sie sprechen nur eine andere Sprache als der Spot-Markt, und gerade diese Sprache sagt etwas, das es zu entschlüsseln gilt.
Funding-Rates gibt es, weil Perpetual Futures kein Verfallsdatum haben. Damit der Kontraktpreis an das tatsächliche Asset gekoppelt bleibt, berechnen die Börsen einer Seite der Transaktion die andere. Wenn viele Longs im Markt sind, wird das Funding positiv und Longs zahlen Shorts. Wenn Shorts dominieren, dreht es ins Negative. Die Rate selbst ist ein per Crowdsourcing erstelltes Thermometer für die Positionierung, das sich auf den meisten großen Handelsplätzen alle paar Stunden aktualisiert. Eine leicht positive Rate ist normal — sie spiegelt die natürlichen Kosten einer gehebelt positiven Kursentwicklung wider. Eine stark positive Rate ist eine Warnung. Sie bedeutet, dass die Menge so einseitig positioniert ist, dass der Markt eine Prämie verlangt, nur um die Wette aufrechtzuerhalten.
Funding-Rates flüstern, was Kurscharts nicht verraten
Bitcoin liegt bei 62.803,42 $ auf Binance und ist in den letzten 24 Stunden unverändert, bei einem Volumen von 1,21 Milliarden $. Ethereum ist einen Hauch höher bei 1.789,53 $, plus 0,36 Prozent bei 381,87 Millionen $ im täglichen Handel. Auf den ersten Blick wirkt beides ruhig. Doch Derivatemärkte sind nie wirklich ruhig — sie sprechen nur eine andere Sprache als der Spot-Markt, und gerade diese Sprache sagt etwas, das es zu entschlüsseln gilt.
Funding-Rates gibt es, weil Perpetual Futures kein Verfallsdatum haben. Damit der Kontraktpreis an das tatsächliche Asset gekoppelt bleibt, berechnen die Börsen einer Seite der Transaktion die andere. Wenn viele Longs im Markt sind, wird das Funding positiv und Longs zahlen Shorts. Wenn Shorts dominieren, dreht es ins Negative. Die Rate selbst ist ein per Crowdsourcing erstelltes Thermometer für die Positionierung, das sich auf den meisten großen Handelsplätzen alle paar Stunden aktualisiert. Eine leicht positive Rate ist normal — sie spiegelt die natürlichen Kosten einer gehebelt positiven Kursentwicklung wider. Eine stark positive Rate ist eine Warnung. Sie bedeutet, dass die Menge so einseitig positioniert ist, dass der Markt eine Prämie verlangt, nur um die Wette aufrechtzuerhalten.
Funding-Rates gibt es, weil Perpetual Futures kein Verfallsdatum haben. Damit der Kontraktpreis an das tatsächliche Asset gekoppelt bleibt, berechnen die Börsen einer Seite der Transaktion die andere. Wenn viele Longs im Markt sind, wird das Funding positiv und Longs zahlen Shorts. Wenn Shorts dominieren, dreht es ins Negative. Die Rate selbst ist ein per Crowdsourcing erstelltes Thermometer für die Positionierung, das sich auf den meisten großen Handelsplätzen alle paar Stunden aktualisiert. Eine leicht positive Rate ist normal — sie spiegelt die natürlichen Kosten einer gehebelt positiven Kursentwicklung wider. Eine stark positive Rate ist eine Warnung. Sie bedeutet, dass die Menge so einseitig positioniert ist, dass der Markt eine Prämie verlangt, nur um die Wette aufrechtzuerhalten.
26
·
--
TRX ist heute um 1,72% gefallen, während die US-Regierung 297 Millionen US-Dollar an beschlagnahmter Krypto zu Coinbase Prime transferiert. Wenigstens scheinen die Coins irgendwohin zu gehen.
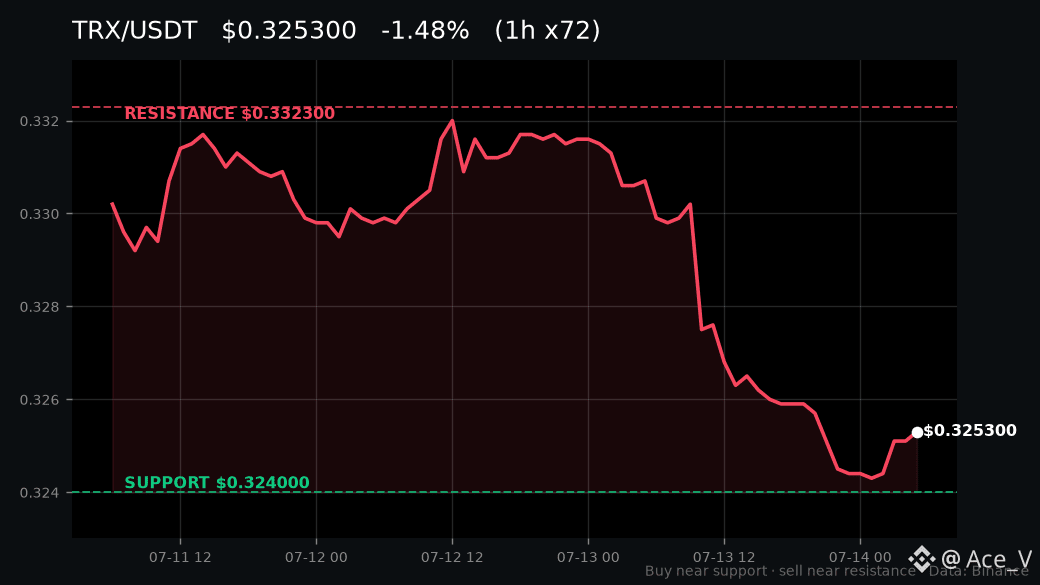
Gerade laufen $TRX Trades zu $0,325100 pro CoinMarketCap und zwar direkt auf dem 72-Stunden-Support bei $0,324000. Dieser Boden ist das ganze Spiel — wenn er hält, haben Dip-Käufer eine klare Linie, die sie verteidigen können. Wenn er bricht, rollt der Schwung schnell den Berg hinunter.
Der Widerstand liegt bei $0,332300. Ein sauberer Ausbruch darüber mit Volumen dreht das kurzfristige Bild um. Eine Abweisung dort? Dann bleiben die Verkäufer in Kontrolle und die Spanne besteht weiter.
Stablecoin-Flüsse auf Tron laufen unabhängig von der Kursbewegung weiter — das Netzwerk funktioniert, die Chart-Analyse hat es nur noch nicht mitbekommen.
Support hier verteidigen oder auf den Break warten?
Das $TRX Paar ist nur einen Fingertipp entfernt, solange das Setup noch aktiv ist. Lachen, dann den Chart ansehen.
#TRON #TRX #Märkte
TRX ist heute um 1,72% gefallen, während die US-Regierung 297 Millionen US-Dollar an beschlagnahmter Krypto zu Coinbase Prime transferiert. Wenigstens scheinen die Coins irgendwohin zu gehen.
Gerade laufen $TRX Trades zu $0,325100 pro CoinMarketCap und zwar direkt auf dem 72-Stunden-Support bei $0,324000. Dieser Boden ist das ganze Spiel — wenn er hält, haben Dip-Käufer eine klare Linie, die sie verteidigen können. Wenn er bricht, rollt der Schwung schnell den Berg hinunter.
Der Widerstand liegt bei $0,332300. Ein sauberer Ausbruch darüber mit Volumen dreht das kurzfristige Bild um. Eine Abweisung dort? Dann bleiben die Verkäufer in Kontrolle und die Spanne besteht weiter.
Stablecoin-Flüsse auf Tron laufen unabhängig von der Kursbewegung weiter — das Netzwerk funktioniert, die Chart-Analyse hat es nur noch nicht mitbekommen.
Support hier verteidigen oder auf den Break warten?
Das $TRX Paar ist nur einen Fingertipp entfernt, solange das Setup noch aktiv ist. Lachen, dann den Chart ansehen.
#TRON #TRX #Märkte
Gerade laufen $TRX Trades zu $0,325100 pro CoinMarketCap und zwar direkt auf dem 72-Stunden-Support bei $0,324000. Dieser Boden ist das ganze Spiel — wenn er hält, haben Dip-Käufer eine klare Linie, die sie verteidigen können. Wenn er bricht, rollt der Schwung schnell den Berg hinunter.
Der Widerstand liegt bei $0,332300. Ein sauberer Ausbruch darüber mit Volumen dreht das kurzfristige Bild um. Eine Abweisung dort? Dann bleiben die Verkäufer in Kontrolle und die Spanne besteht weiter.
Stablecoin-Flüsse auf Tron laufen unabhängig von der Kursbewegung weiter — das Netzwerk funktioniert, die Chart-Analyse hat es nur noch nicht mitbekommen.
Support hier verteidigen oder auf den Break warten?
Das $TRX Paar ist nur einen Fingertipp entfernt, solange das Setup noch aktiv ist. Lachen, dann den Chart ansehen.
#TRON #TRX #Märkte
14
·
--
Artikel
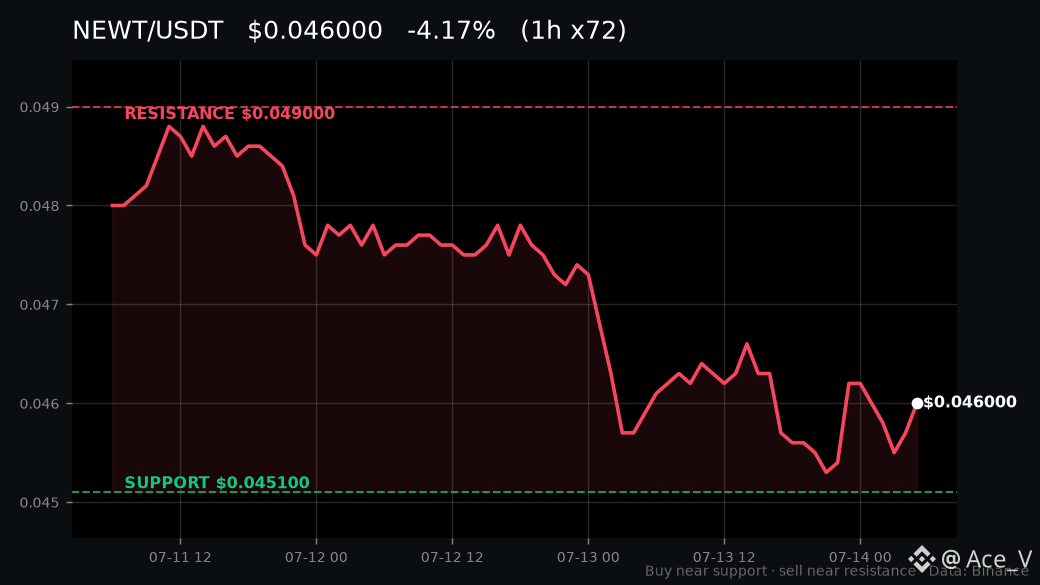
NEWT schwebt nur 1,3% über der Unterstützung — Hier ist die KarteNewtown wird derzeit an der Binance für 0,045700 US-Dollar gehandelt, und wenn du dir das Chart ansiehst, fällt dir etwas Wichtiges auf: Der Preis liegt nur knapp über der 72-Stunden-Unterstützung bei 0,045100 US-Dollar, während das 24-Stunden-Volumen bei ungefähr 348.846 US-Dollar liegt. Das ist ein sehr dünnes Polster zwischen dem aktuellen Preis und der Schwelle, die die gesamte kurzfristige Struktur stützt. Gleichzeitig stellt der Widerstand oberhalb bei 0,049000 US-Dollar die Decke dar, die die Bullen seit drei Sitzungen in Folge nicht durchbrechen konnten. Laut CoinMarketCap ist NEWT heute um 0,44% gefallen, was dir zeigt, dass der Trend eher seitwärts bis abwärts geht und nicht in Richtung einer Kapitulation — aber es sagt auch, dass Käufer bislang noch nicht hart genug drücken, um die Stimmung zu drehen.
NEWT schwebt nur 1,3% über der Unterstützung — Hier ist die Karte
Newtown wird derzeit an der Binance für 0,045700 US-Dollar gehandelt, und wenn du dir das Chart ansiehst, fällt dir etwas Wichtiges auf: Der Preis liegt nur knapp über der 72-Stunden-Unterstützung bei 0,045100 US-Dollar, während das 24-Stunden-Volumen bei ungefähr 348.846 US-Dollar liegt. Das ist ein sehr dünnes Polster zwischen dem aktuellen Preis und der Schwelle, die die gesamte kurzfristige Struktur stützt. Gleichzeitig stellt der Widerstand oberhalb bei 0,049000 US-Dollar die Decke dar, die die Bullen seit drei Sitzungen in Folge nicht durchbrechen konnten. Laut CoinMarketCap ist NEWT heute um 0,44% gefallen, was dir zeigt, dass der Trend eher seitwärts bis abwärts geht und nicht in Richtung einer Kapitulation — aber es sagt auch, dass Käufer bislang noch nicht hart genug drücken, um die Stimmung zu drehen.
16
·
--
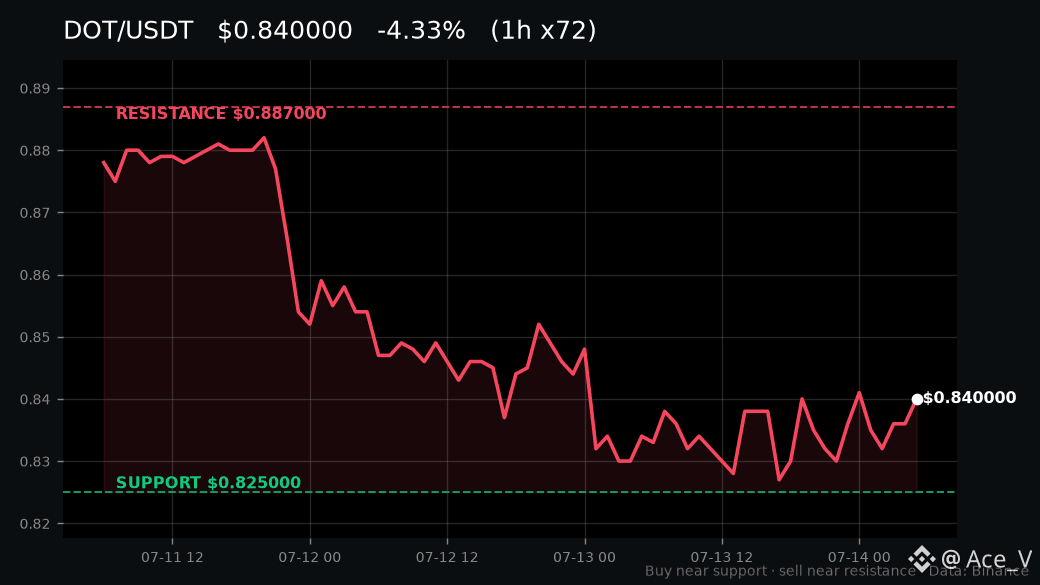
DOT wickelt direkt oberhalb der $0.825-Unterstützung bei $0.839 auf, laut CoinMarketCap – ein Niveau, auf dem Dip-Käufer still und heimlich eingesprungen sind. In den letzten 24 Stunden um 0.96% gestiegen bei $4.66M Volumen, zeichnet es seine eigene Bahn, während Schlagzeilen über regulatorische Fortschritte und Scam-Razzien kursieren.
Das Orderbuch zeigt eine klare Spanne: $0.825 als Boden für Käufer, $0.887 als Widerstand für Verkäufer. Wenn die Unterstützung hält, ist das eine Zone zum Verteidigen und Akkumulieren; ein sauberer Ausbruch über den Widerstand könnte Momentum auslösen. Verliert $0.825, dann könnten Verkäufer den Kurs in Richtung tieferer Bereiche drücken.
Die $DOT pair ist nur einen Tip entfernt, um genau diese Levels zu handeln, solange das Setup aktiv ist. Unterstützung hier verteidigen oder auf den Break warten? Lies das Tape, nicht das Rauschen.
#Polkadot #DOT #Trading
DOT wickelt direkt oberhalb der $0.825-Unterstützung bei $0.839 auf, laut CoinMarketCap – ein Niveau, auf dem Dip-Käufer still und heimlich eingesprungen sind. In den letzten 24 Stunden um 0.96% gestiegen bei $4.66M Volumen, zeichnet es seine eigene Bahn, während Schlagzeilen über regulatorische Fortschritte und Scam-Razzien kursieren.
Das Orderbuch zeigt eine klare Spanne: $0.825 als Boden für Käufer, $0.887 als Widerstand für Verkäufer. Wenn die Unterstützung hält, ist das eine Zone zum Verteidigen und Akkumulieren; ein sauberer Ausbruch über den Widerstand könnte Momentum auslösen. Verliert $0.825, dann könnten Verkäufer den Kurs in Richtung tieferer Bereiche drücken.
Die $DOT pair ist nur einen Tip entfernt, um genau diese Levels zu handeln, solange das Setup aktiv ist. Unterstützung hier verteidigen oder auf den Break warten? Lies das Tape, nicht das Rauschen.
#Polkadot #DOT #Trading
Das Orderbuch zeigt eine klare Spanne: $0.825 als Boden für Käufer, $0.887 als Widerstand für Verkäufer. Wenn die Unterstützung hält, ist das eine Zone zum Verteidigen und Akkumulieren; ein sauberer Ausbruch über den Widerstand könnte Momentum auslösen. Verliert $0.825, dann könnten Verkäufer den Kurs in Richtung tieferer Bereiche drücken.
Die $DOT pair ist nur einen Tip entfernt, um genau diese Levels zu handeln, solange das Setup aktiv ist. Unterstützung hier verteidigen oder auf den Break warten? Lies das Tape, nicht das Rauschen.
#Polkadot #DOT #Trading
27
·
--
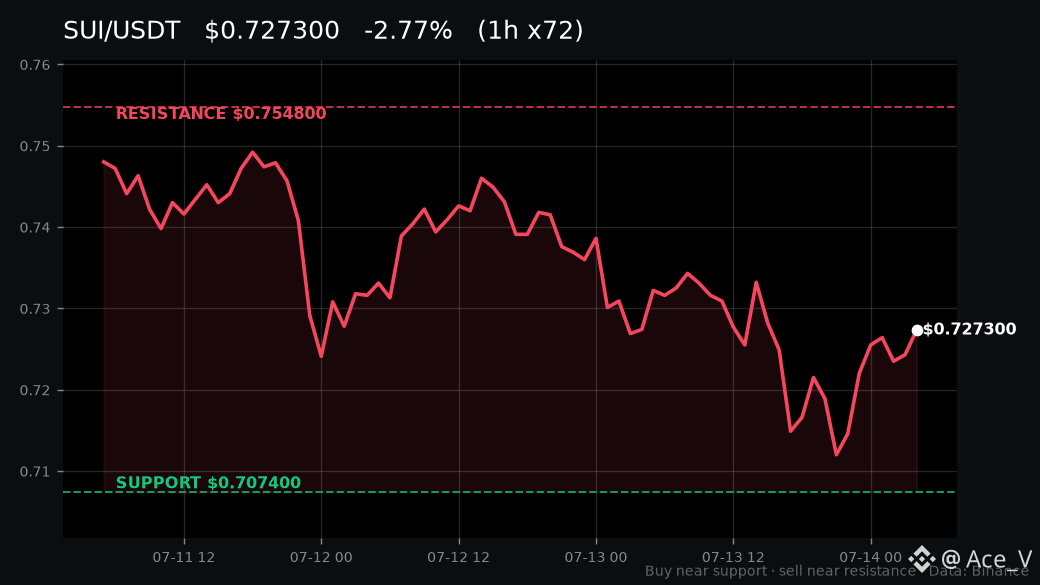
$SUI bei $0.7247 auf Binance, runter 0,66% bei einem täglichen Volumen von $9,13M. Kein Ausbruch, kein Zusammenbruch — eine Spanne, und Spannen belohnen Disziplin mehr als Überzeugung.
Unterstützung liegt bei $0.7074. Widerstand liegt bei $0.7548. Wenn der Preis an diesem Boden festhält, haben Käufer eine klar definierte Zone, die sie verteidigen können. Wenn $0.7074 fällt, dreht sich das Setup — und Geduld wird zur Position. Ein Ausbruch über $0.7548 verändert das Bild hin zu Momentum.
Das makroökonomische Umfeld ist leise konstruktiv — der CLARITY Act gewinnt Unterstützung bei der Durchsetzung, MiCA-Compliance-Tools gehen live, beschlagnahmte Krypto-Bestände wandern zu Coinbase Prime. Keine SUI-spezifischen Katalysatoren, aber die strukturelle Basis unter dem Markt wird um sie herum zunehmend dicker.
Hält man die Unterstützung bei $0.7074 oder wartet man auf den Bruch bei $0.7548? Das $SUI -Paar ist nur einen Klick entfernt, wenn dein Level gesetzt ist.
Schütze das Abwärtsrisiko; der Aufwärtsimpuls regelt sich von selbst. Keine Finanzberatung.
#SUI #BinanceSquare
$SUI bei $0.7247 auf Binance, runter 0,66% bei einem täglichen Volumen von $9,13M. Kein Ausbruch, kein Zusammenbruch — eine Spanne, und Spannen belohnen Disziplin mehr als Überzeugung.
Unterstützung liegt bei $0.7074. Widerstand liegt bei $0.7548. Wenn der Preis an diesem Boden festhält, haben Käufer eine klar definierte Zone, die sie verteidigen können. Wenn $0.7074 fällt, dreht sich das Setup — und Geduld wird zur Position. Ein Ausbruch über $0.7548 verändert das Bild hin zu Momentum.
Das makroökonomische Umfeld ist leise konstruktiv — der CLARITY Act gewinnt Unterstützung bei der Durchsetzung, MiCA-Compliance-Tools gehen live, beschlagnahmte Krypto-Bestände wandern zu Coinbase Prime. Keine SUI-spezifischen Katalysatoren, aber die strukturelle Basis unter dem Markt wird um sie herum zunehmend dicker.
Hält man die Unterstützung bei $0.7074 oder wartet man auf den Bruch bei $0.7548? Das $SUI -Paar ist nur einen Klick entfernt, wenn dein Level gesetzt ist.
Schütze das Abwärtsrisiko; der Aufwärtsimpuls regelt sich von selbst. Keine Finanzberatung.
#SUI #BinanceSquare
Unterstützung liegt bei $0.7074. Widerstand liegt bei $0.7548. Wenn der Preis an diesem Boden festhält, haben Käufer eine klar definierte Zone, die sie verteidigen können. Wenn $0.7074 fällt, dreht sich das Setup — und Geduld wird zur Position. Ein Ausbruch über $0.7548 verändert das Bild hin zu Momentum.
Das makroökonomische Umfeld ist leise konstruktiv — der CLARITY Act gewinnt Unterstützung bei der Durchsetzung, MiCA-Compliance-Tools gehen live, beschlagnahmte Krypto-Bestände wandern zu Coinbase Prime. Keine SUI-spezifischen Katalysatoren, aber die strukturelle Basis unter dem Markt wird um sie herum zunehmend dicker.
Hält man die Unterstützung bei $0.7074 oder wartet man auf den Bruch bei $0.7548? Das $SUI -Paar ist nur einen Klick entfernt, wenn dein Level gesetzt ist.
Schütze das Abwärtsrisiko; der Aufwärtsimpuls regelt sich von selbst. Keine Finanzberatung.
#SUI #BinanceSquare
35
·
--
Artikel
Toncoin Hält Eine Enge Spanne, Während Sich Das Breitere Marktbild Darunter Verändert$1.60 liegt derzeit direkt im Binance-Orderbuch für Toncoin. In den letzten 24 Stunden ist es um 0,95 Prozent gestiegen; das Handelsvolumen liegt bei 7,72 Millionen US-Dollar. Auf den ersten Blick nichts Dramatisches. Doch unter der Oberfläche erzählt die Struktur eine konkretere Geschichte — eine, die das Entscheidungsfenster für alle, die diese Woche den $TON-Chart beobachten, enger macht.
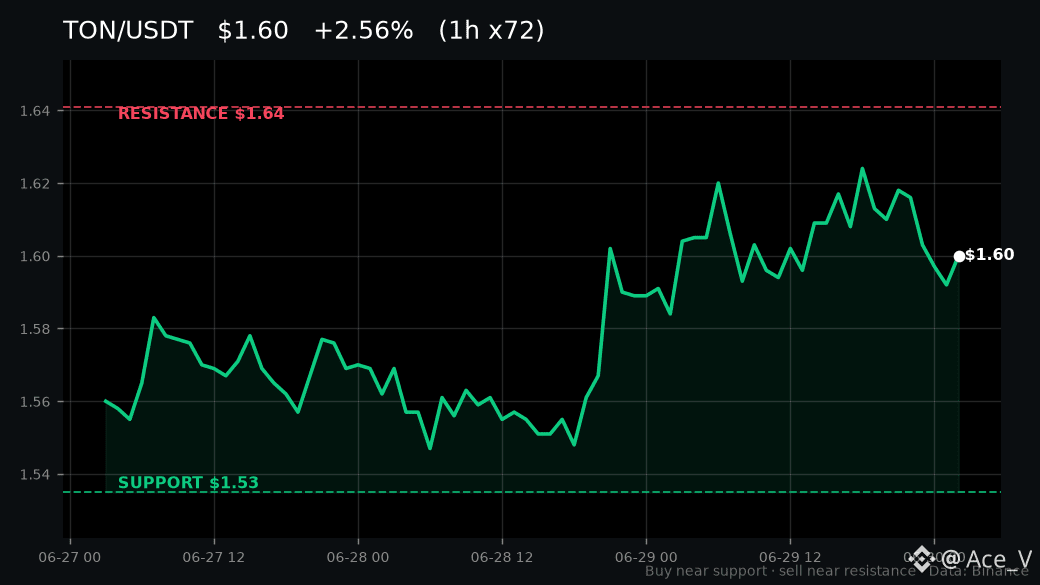
Lass uns bei den Kursmarken ansetzen, die wirklich zählen. In den vergangenen 72 Stunden hat $TON eine klar umrissene Spanne gebildet: Unterstützung bei $1.53 und Widerstand bei $1.64. Der aktuelle Kurs bei $1.60 bringt den Token nahezu exakt in die Mitte dieses Korridors — etwa 4,3 Prozent über dem Boden und 2,5 Prozent unter der Decke. Diese Asymmetrie ist entscheidend. Der Kurs ist näher am Widerstand als an der Unterstützung, was bedeutet: Der Weg des geringsten Widerstands — im wörtlichen technischen Sinn — führt nach oben, aber nur dann, wenn Käufer die $1.64-Obergrenze durchbrechen können, ohne ins Stocken zu geraten.
Toncoin Hält Eine Enge Spanne, Während Sich Das Breitere Marktbild Darunter Verändert
$1.60 liegt derzeit direkt im Binance-Orderbuch für Toncoin. In den letzten 24 Stunden ist es um 0,95 Prozent gestiegen; das Handelsvolumen liegt bei 7,72 Millionen US-Dollar. Auf den ersten Blick nichts Dramatisches. Doch unter der Oberfläche erzählt die Struktur eine konkretere Geschichte — eine, die das Entscheidungsfenster für alle, die diese Woche den $TON-Chart beobachten, enger macht.
Lass uns bei den Kursmarken ansetzen, die wirklich zählen. In den vergangenen 72 Stunden hat $TON eine klar umrissene Spanne gebildet: Unterstützung bei $1.53 und Widerstand bei $1.64. Der aktuelle Kurs bei $1.60 bringt den Token nahezu exakt in die Mitte dieses Korridors — etwa 4,3 Prozent über dem Boden und 2,5 Prozent unter der Decke. Diese Asymmetrie ist entscheidend. Der Kurs ist näher am Widerstand als an der Unterstützung, was bedeutet: Der Weg des geringsten Widerstands — im wörtlichen technischen Sinn — führt nach oben, aber nur dann, wenn Käufer die $1.64-Obergrenze durchbrechen können, ohne ins Stocken zu geraten.
Lass uns bei den Kursmarken ansetzen, die wirklich zählen. In den vergangenen 72 Stunden hat $TON eine klar umrissene Spanne gebildet: Unterstützung bei $1.53 und Widerstand bei $1.64. Der aktuelle Kurs bei $1.60 bringt den Token nahezu exakt in die Mitte dieses Korridors — etwa 4,3 Prozent über dem Boden und 2,5 Prozent unter der Decke. Diese Asymmetrie ist entscheidend. Der Kurs ist näher am Widerstand als an der Unterstützung, was bedeutet: Der Weg des geringsten Widerstands — im wörtlichen technischen Sinn — führt nach oben, aber nur dann, wenn Käufer die $1.64-Obergrenze durchbrechen können, ohne ins Stocken zu geraten.
48
·
--
Die regulatorische Klarheit nimmt rasant zu. Der CLARITY Act hat gerade eine zweite behördliche Zustimmung erhalten, bevor er seinen Vorstoß im Senat startet, und in derselben Woche hat ein globales Unternehmen ein MiCA-Compliance-Tool auf den Markt gebracht, während sich die EU-Regeln verschärfen – laut Cointelegraph.
Genau dieses Umfeld liefert den Hintergrund für die Binance-Square-Kampagne von GRVT. Die These der hybriden Börse basiert auf Compliance-Infrastruktur auf institutionellem Niveau, und Trader beobachten $GRVT, während sich die regulatorische Lage hin zu strukturierten Handelsplätzen verschiebt.
Auch die US-Regierung hat heute $297 Mio. in beschlagnahmtem BTC und ETH an Coinbase Prime überwiesen – institutionelle Verwahr-„Rails“ sind jetzt Standard, kein Alleinstellungsmerkmal.
Für $GRVT werden derzeit keine konkreten Unterstützungs- oder Widerstandsniveaus ausgegeben, daher ist die Handelskarte noch in der Entstehung. Wenn ein Range bestätigt wird, legt die Ausbruchrichtung die nächste Etappe fest.
Keine Finanzberatung. Ich beobachte den nächsten Kursprint.
#GRVT #Altcoins
Die regulatorische Klarheit nimmt rasant zu. Der CLARITY Act hat gerade eine zweite behördliche Zustimmung erhalten, bevor er seinen Vorstoß im Senat startet, und in derselben Woche hat ein globales Unternehmen ein MiCA-Compliance-Tool auf den Markt gebracht, während sich die EU-Regeln verschärfen – laut Cointelegraph.
Genau dieses Umfeld liefert den Hintergrund für die Binance-Square-Kampagne von GRVT. Die These der hybriden Börse basiert auf Compliance-Infrastruktur auf institutionellem Niveau, und Trader beobachten $GRVT, während sich die regulatorische Lage hin zu strukturierten Handelsplätzen verschiebt.
Auch die US-Regierung hat heute $297 Mio. in beschlagnahmtem BTC und ETH an Coinbase Prime überwiesen – institutionelle Verwahr-„Rails“ sind jetzt Standard, kein Alleinstellungsmerkmal.
Für $GRVT werden derzeit keine konkreten Unterstützungs- oder Widerstandsniveaus ausgegeben, daher ist die Handelskarte noch in der Entstehung. Wenn ein Range bestätigt wird, legt die Ausbruchrichtung die nächste Etappe fest.
Keine Finanzberatung. Ich beobachte den nächsten Kursprint.
#GRVT #Altcoins
Genau dieses Umfeld liefert den Hintergrund für die Binance-Square-Kampagne von GRVT. Die These der hybriden Börse basiert auf Compliance-Infrastruktur auf institutionellem Niveau, und Trader beobachten $GRVT, während sich die regulatorische Lage hin zu strukturierten Handelsplätzen verschiebt.
Auch die US-Regierung hat heute $297 Mio. in beschlagnahmtem BTC und ETH an Coinbase Prime überwiesen – institutionelle Verwahr-„Rails“ sind jetzt Standard, kein Alleinstellungsmerkmal.
Für $GRVT werden derzeit keine konkreten Unterstützungs- oder Widerstandsniveaus ausgegeben, daher ist die Handelskarte noch in der Entstehung. Wenn ein Range bestätigt wird, legt die Ausbruchrichtung die nächste Etappe fest.
Keine Finanzberatung. Ich beobachte den nächsten Kursprint.
#GRVT #Altcoins
20
·
--
$6.43 ist, wo AVAX gerade steht – kaum am Atmen, nur 0,19% im Plus über 24 Stunden bei einem Volumen von $13,92 Mio. pro CoinMarketCap. Das ist Kompression, keine Überzeugung.
$AVAX
#Avalanche #AVAX #Crypto
$6.43 ist, wo AVAX gerade steht – kaum am Atmen, nur 0,19% im Plus über 24 Stunden bei einem Volumen von $13,92 Mio. pro CoinMarketCap. Das ist Kompression, keine Überzeugung.
$AVAX
#Avalanche #AVAX #Crypto
$AVAX
#Avalanche #AVAX #Crypto
21
·
--
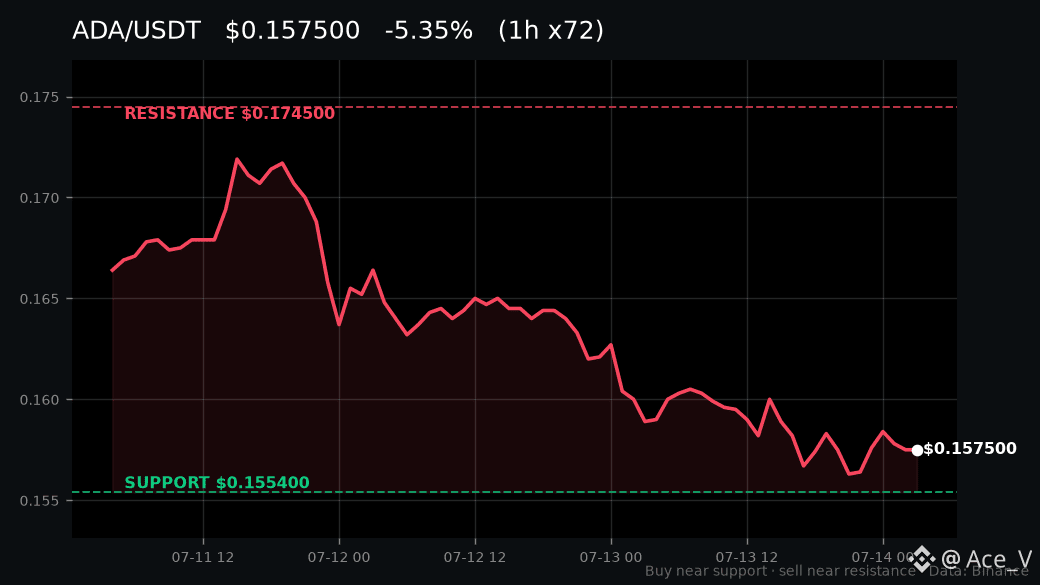
ADA wird an der Binance bei 0,1564 $ gehandelt, nur 0,001 $ über seinem 72-Stunden-Support bei 0,1554 $. Das ist ein hauchdünnes Polster – und genau das ist es, das man im Blick behalten sollte.
So liest du das. Support ist die Preiszone, in die Käufer wiederholt eingegriffen haben, um sich zu verteidigen. Der Widerstand bei 0,1745 $ ist der Bereich, an dem Verkäufer den Schwung immer wieder abwürgen. Der aktuelle Preis sitzt direkt am unteren Ende dieser Spanne.
Wenn ADA bei 0,1554 $ bleibt, bleibt die Spanne intakt und Käufer kontrollieren weiterhin den Boden. Wenn dieser Level jedoch mit echtem Volumen durchbrochen wird, bricht die Struktur und die Bewegung beschleunigt sich nach unten.
Ein Push über 0,1745 $ würde das Bild komplett drehen – aus Widerstand wird eine neue Basis, und der Momentum schaltet nach oben.
Das Volumen liegt bei 11,83 Mio. $ über 24 Stunden, mit einem moderaten Rücksetzer von 0,95 % laut CoinMarketCap. Keine Panik – eher ein Markt, der seine Grenzen testet, während Schlagzeilen zur Regulierung wie der CLARITY Act und neue MiCA-Compliance-Tools die Stimmung insgesamt vorsichtig halten.
Support verteidigen oder den Break abwarten? Das $ADA paar auf Binance ist nur einen Klick entfernt, wenn du bereit bist, diese Levels zu handeln – solange das Setup noch aktiv ist.
Verstehe es, dann entscheide.
#Cardano #ADA #Crypto
ADA wird an der Binance bei 0,1564 $ gehandelt, nur 0,001 $ über seinem 72-Stunden-Support bei 0,1554 $. Das ist ein hauchdünnes Polster – und genau das ist es, das man im Blick behalten sollte.
So liest du das. Support ist die Preiszone, in die Käufer wiederholt eingegriffen haben, um sich zu verteidigen. Der Widerstand bei 0,1745 $ ist der Bereich, an dem Verkäufer den Schwung immer wieder abwürgen. Der aktuelle Preis sitzt direkt am unteren Ende dieser Spanne.
Wenn ADA bei 0,1554 $ bleibt, bleibt die Spanne intakt und Käufer kontrollieren weiterhin den Boden. Wenn dieser Level jedoch mit echtem Volumen durchbrochen wird, bricht die Struktur und die Bewegung beschleunigt sich nach unten.
Ein Push über 0,1745 $ würde das Bild komplett drehen – aus Widerstand wird eine neue Basis, und der Momentum schaltet nach oben.
Das Volumen liegt bei 11,83 Mio. $ über 24 Stunden, mit einem moderaten Rücksetzer von 0,95 % laut CoinMarketCap. Keine Panik – eher ein Markt, der seine Grenzen testet, während Schlagzeilen zur Regulierung wie der CLARITY Act und neue MiCA-Compliance-Tools die Stimmung insgesamt vorsichtig halten.
Support verteidigen oder den Break abwarten? Das $ADA paar auf Binance ist nur einen Klick entfernt, wenn du bereit bist, diese Levels zu handeln – solange das Setup noch aktiv ist.
Verstehe es, dann entscheide.
#Cardano #ADA #Crypto
So liest du das. Support ist die Preiszone, in die Käufer wiederholt eingegriffen haben, um sich zu verteidigen. Der Widerstand bei 0,1745 $ ist der Bereich, an dem Verkäufer den Schwung immer wieder abwürgen. Der aktuelle Preis sitzt direkt am unteren Ende dieser Spanne.
Wenn ADA bei 0,1554 $ bleibt, bleibt die Spanne intakt und Käufer kontrollieren weiterhin den Boden. Wenn dieser Level jedoch mit echtem Volumen durchbrochen wird, bricht die Struktur und die Bewegung beschleunigt sich nach unten.
Ein Push über 0,1745 $ würde das Bild komplett drehen – aus Widerstand wird eine neue Basis, und der Momentum schaltet nach oben.
Das Volumen liegt bei 11,83 Mio. $ über 24 Stunden, mit einem moderaten Rücksetzer von 0,95 % laut CoinMarketCap. Keine Panik – eher ein Markt, der seine Grenzen testet, während Schlagzeilen zur Regulierung wie der CLARITY Act und neue MiCA-Compliance-Tools die Stimmung insgesamt vorsichtig halten.
Support verteidigen oder den Break abwarten? Das $ADA paar auf Binance ist nur einen Klick entfernt, wenn du bereit bist, diese Levels zu handeln – solange das Setup noch aktiv ist.
Verstehe es, dann entscheide.
#Cardano #ADA #Crypto
11
·
--
Artikel
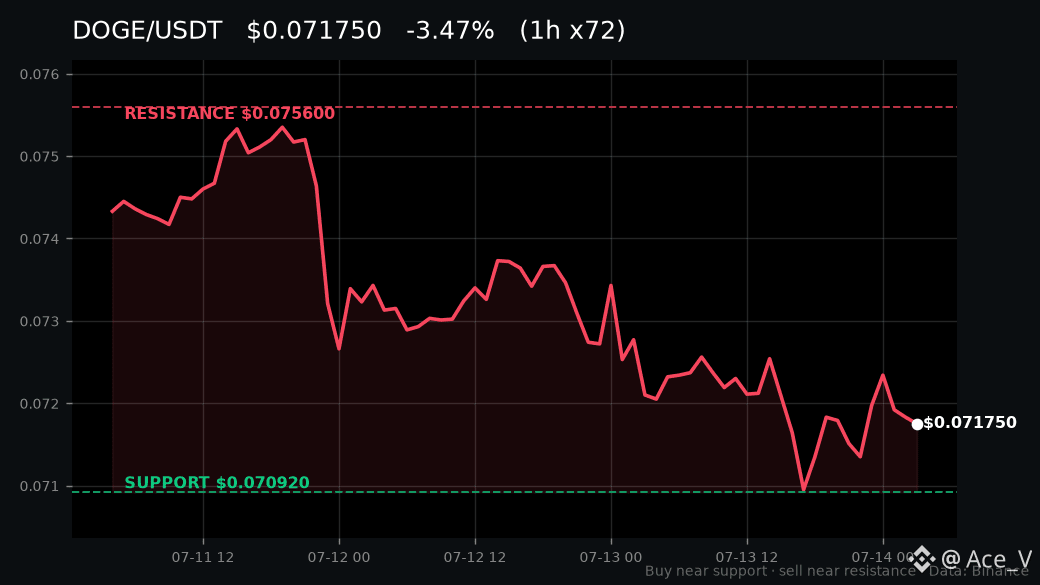
Dogecoin bei 0,071850 $ — Der Meme-Coin-Indikator, den jeder Trader im Blick haben sollteJeder Krypto-Zyklus hat einen Kanarienvogel im Kohlenschacht. Für den breiteren Meme-Coin-Sektor — und ehrlich gesagt für die spekulative Risikobereitschaft im gesamten Markt — ist dieser Kanarienvogel Dogecoin. Aktuell notiert er bei 0,071850 $ auf Binance, ist in den letzten 24 Stunden um 1,06 % gefallen und hat ein tägliches Handelsvolumen von 21,12 Millionen $. Kein Crash. Kein Ausbruch. Nur ein Markt, der an genau einer wichtigen Stelle die Luft anhält.
Lass mich dir erklären, warum genau dieser Kurs mehr bedeutet, als du vielleicht denkst.
Zwei Ebenen definieren die Dogecoin-Kampfzone in den nächsten 72 Stunden. Unterstützung liegt bei 0,070920 $. Der Widerstand setzt dem Ganzen bei 0,075600 $ ein Ende. Das bedeutet: DOGE liegt ungefähr 1,3 % über seinem Boden und etwa 5,2 % unter seiner Decke — eng genug, dass jeder bedeutendere Volumenimpuls in die eine oder andere Richtung diese Spanne schnell auflöst.
Dogecoin bei 0,071850 $ — Der Meme-Coin-Indikator, den jeder Trader im Blick haben sollte
Jeder Krypto-Zyklus hat einen Kanarienvogel im Kohlenschacht. Für den breiteren Meme-Coin-Sektor — und ehrlich gesagt für die spekulative Risikobereitschaft im gesamten Markt — ist dieser Kanarienvogel Dogecoin. Aktuell notiert er bei 0,071850 $ auf Binance, ist in den letzten 24 Stunden um 1,06 % gefallen und hat ein tägliches Handelsvolumen von 21,12 Millionen $. Kein Crash. Kein Ausbruch. Nur ein Markt, der an genau einer wichtigen Stelle die Luft anhält.
Lass mich dir erklären, warum genau dieser Kurs mehr bedeutet, als du vielleicht denkst.
Zwei Ebenen definieren die Dogecoin-Kampfzone in den nächsten 72 Stunden. Unterstützung liegt bei 0,070920 $. Der Widerstand setzt dem Ganzen bei 0,075600 $ ein Ende. Das bedeutet: DOGE liegt ungefähr 1,3 % über seinem Boden und etwa 5,2 % unter seiner Decke — eng genug, dass jeder bedeutendere Volumenimpuls in die eine oder andere Richtung diese Spanne schnell auflöst.
Lass mich dir erklären, warum genau dieser Kurs mehr bedeutet, als du vielleicht denkst.
Zwei Ebenen definieren die Dogecoin-Kampfzone in den nächsten 72 Stunden. Unterstützung liegt bei 0,070920 $. Der Widerstand setzt dem Ganzen bei 0,075600 $ ein Ende. Das bedeutet: DOGE liegt ungefähr 1,3 % über seinem Boden und etwa 5,2 % unter seiner Decke — eng genug, dass jeder bedeutendere Volumenimpuls in die eine oder andere Richtung diese Spanne schnell auflöst.
23
·
--
Alle sind begeistert von NEYT's Binance Square-Kampagne und der frischen regulatorischen Klarheit durch den CLARITY Act sowie das EU-Tool MiCA. Es wirkt, als würde gerade Momentum aufgebaut, oder?
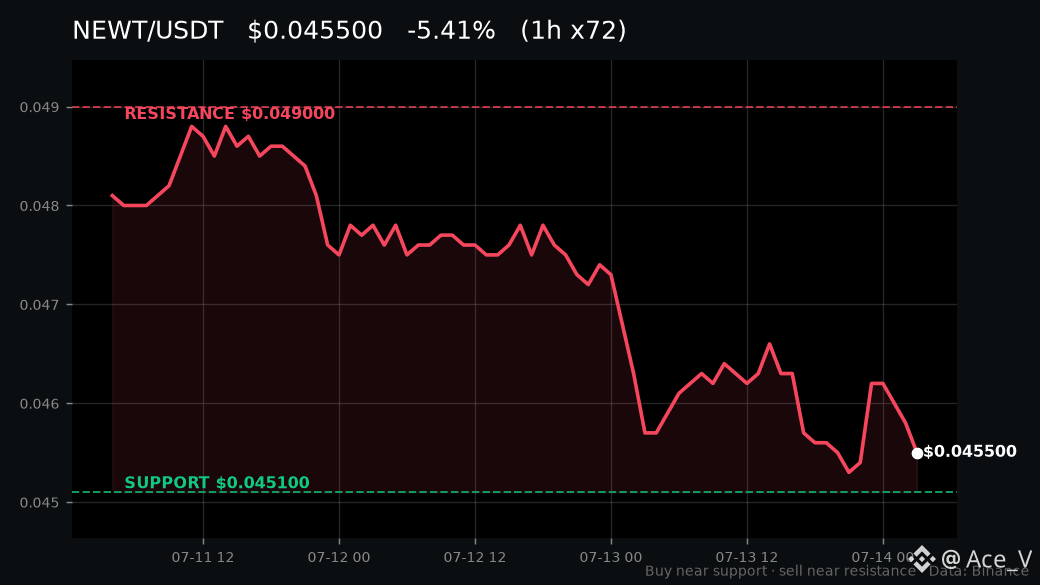
Aber so zeigt es das Kursband tatsächlich: NEYT liegt bei 0,0458 $, ist in 24 Stunden um 1,5 % gefallen – bei nur 339K Umsatz. Das ist dünn. Der Support ist bei 0,0451 $ festgenagelt – gerade einmal ca. 1,5 % darunter – und der Widerstand liegt bei 0,049 $ als Deckel.
Wenn 0,0451 $ hält, ist das die Dip-Buy-Zone, in der Käufer eingreifen. Wenn es bricht, beschleunigt sich der Abwärtsmove, ohne dass darunter eine klare Unterstützung erkennbar ist. Ein sauberer Ausbruch über 0,049 $ würde die Struktur dagegen bullisch drehen.
Die $NEWT pair ist nur einen Klick entfernt, während diese Marke noch unentschieden ist. Support hier verteidigen oder auf den Break warten?
Keine finanzielle Beratung. Wenn alle einer Meinung sind, schau dir die andere Seite an.
#NEWT #Märkte
Alle sind begeistert von NEYT's Binance Square-Kampagne und der frischen regulatorischen Klarheit durch den CLARITY Act sowie das EU-Tool MiCA. Es wirkt, als würde gerade Momentum aufgebaut, oder?
Aber so zeigt es das Kursband tatsächlich: NEYT liegt bei 0,0458 $, ist in 24 Stunden um 1,5 % gefallen – bei nur 339K Umsatz. Das ist dünn. Der Support ist bei 0,0451 $ festgenagelt – gerade einmal ca. 1,5 % darunter – und der Widerstand liegt bei 0,049 $ als Deckel.
Wenn 0,0451 $ hält, ist das die Dip-Buy-Zone, in der Käufer eingreifen. Wenn es bricht, beschleunigt sich der Abwärtsmove, ohne dass darunter eine klare Unterstützung erkennbar ist. Ein sauberer Ausbruch über 0,049 $ würde die Struktur dagegen bullisch drehen.
Die $NEWT pair ist nur einen Klick entfernt, während diese Marke noch unentschieden ist. Support hier verteidigen oder auf den Break warten?
Keine finanzielle Beratung. Wenn alle einer Meinung sind, schau dir die andere Seite an.
#NEWT #Märkte
Aber so zeigt es das Kursband tatsächlich: NEYT liegt bei 0,0458 $, ist in 24 Stunden um 1,5 % gefallen – bei nur 339K Umsatz. Das ist dünn. Der Support ist bei 0,0451 $ festgenagelt – gerade einmal ca. 1,5 % darunter – und der Widerstand liegt bei 0,049 $ als Deckel.
Wenn 0,0451 $ hält, ist das die Dip-Buy-Zone, in der Käufer eingreifen. Wenn es bricht, beschleunigt sich der Abwärtsmove, ohne dass darunter eine klare Unterstützung erkennbar ist. Ein sauberer Ausbruch über 0,049 $ würde die Struktur dagegen bullisch drehen.
Die $NEWT pair ist nur einen Klick entfernt, während diese Marke noch unentschieden ist. Support hier verteidigen oder auf den Break warten?
Keine finanzielle Beratung. Wenn alle einer Meinung sind, schau dir die andere Seite an.
#NEWT #Märkte
16
·
--
Artikel
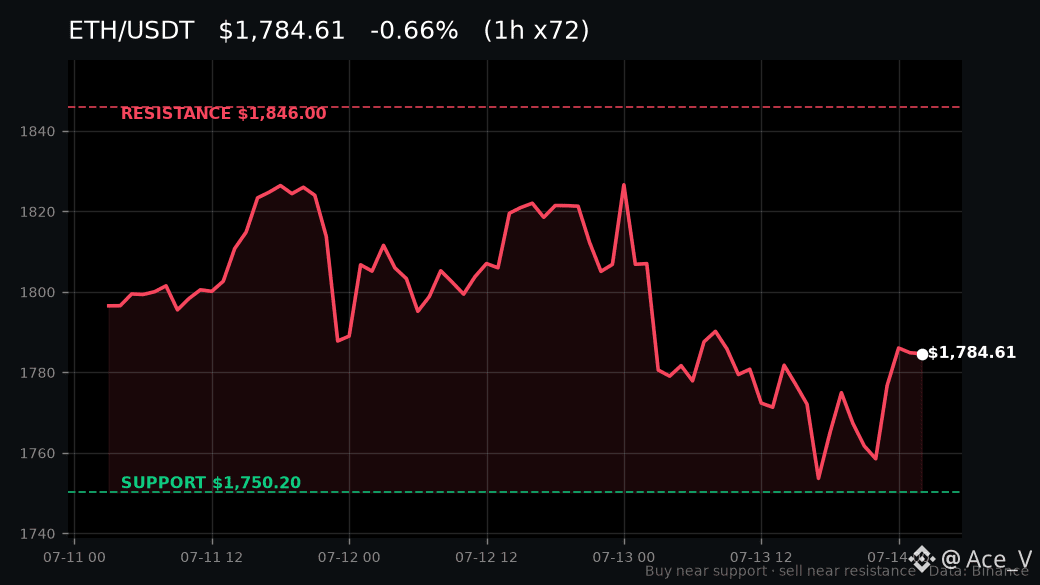
ETH bei 1.783 US-Dollar ist langweilig. Genau deshalb ist es wichtig.Jemand hat gerade 122 Millionen US-Dollar über ein thailändisches Scam-„Wallet“ geschleust, während du geschlafen hast, und in der Zwischenzeit liegt ETH bei 1.783,71 US-Dollar und macht absolut nichts Spektakuläres. Im letztenundzwanzig?—nein—im letztenundvierzig? (Sorry) Im letztenundzwanzig? (Korrekt) Abwärts um 1,32 % in den letzten vierundzwanzig Stunden. Volumen bei 440,76 Millionen US-Dollar auf Binance. Die zweitgrößte Kryptowährung der Welt verhält sich wie ein mittelmäßiger Buchhalter an einem Dienstag – keine Dramen, keine Überraschungen, nur stilles Dasein zwischen zwei ganz bestimmten Zahlen. Und ehrlich gesagt? Dieses ruhige Verhalten könnte gerade das lauteste Signal auf deinem Bildschirm sein.
ETH bei 1.783 US-Dollar ist langweilig. Genau deshalb ist es wichtig.
Jemand hat gerade 122 Millionen US-Dollar über ein thailändisches Scam-„Wallet“ geschleust, während du geschlafen hast, und in der Zwischenzeit liegt ETH bei 1.783,71 US-Dollar und macht absolut nichts Spektakuläres. Im letztenundzwanzig?—nein—im letztenundvierzig? (Sorry) Im letztenundzwanzig? (Korrekt) Abwärts um 1,32 % in den letzten vierundzwanzig Stunden. Volumen bei 440,76 Millionen US-Dollar auf Binance. Die zweitgrößte Kryptowährung der Welt verhält sich wie ein mittelmäßiger Buchhalter an einem Dienstag – keine Dramen, keine Überraschungen, nur stilles Dasein zwischen zwei ganz bestimmten Zahlen. Und ehrlich gesagt? Dieses ruhige Verhalten könnte gerade das lauteste Signal auf deinem Bildschirm sein.
17
·
--
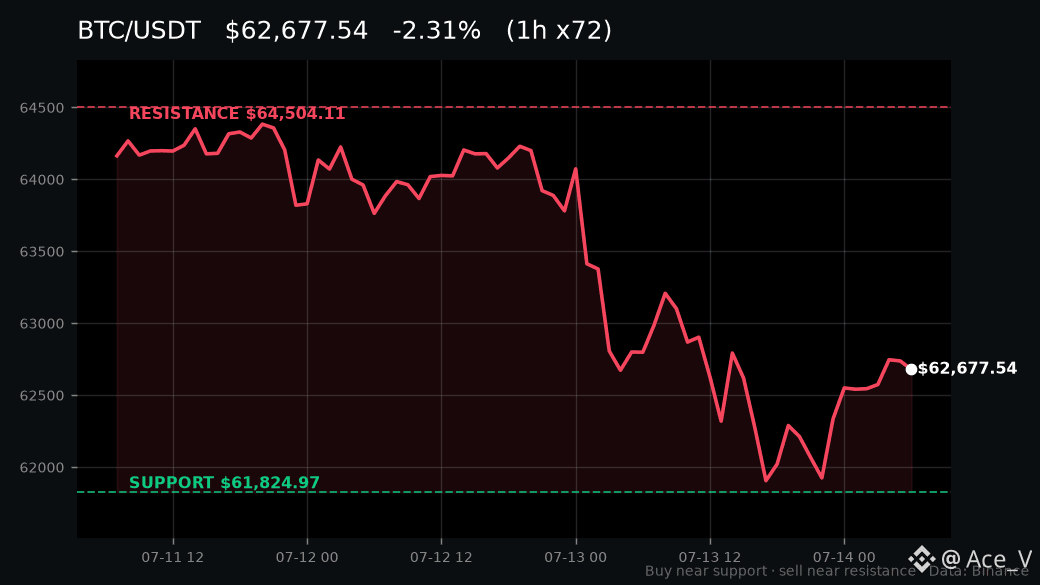
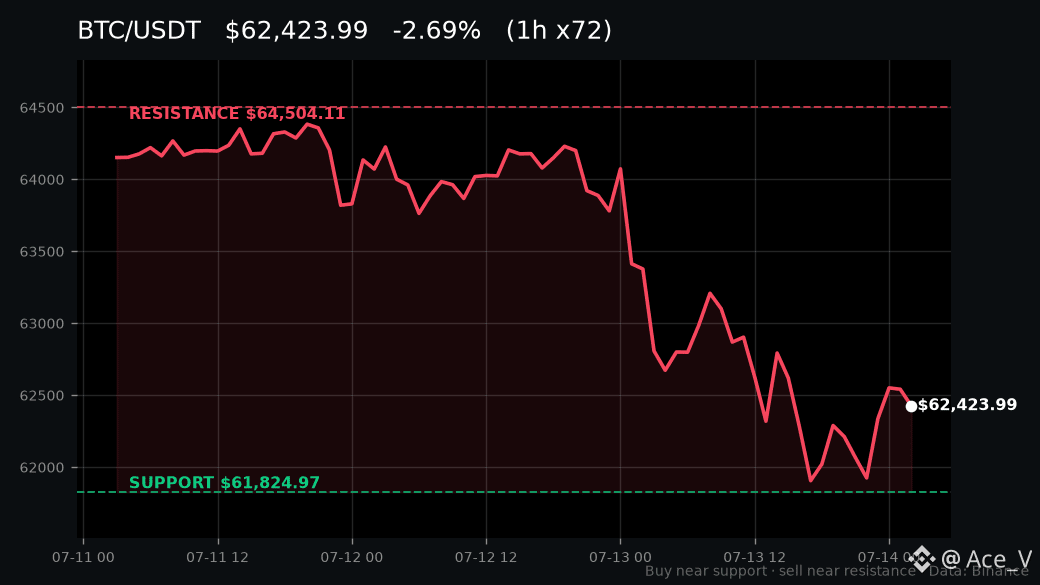
$62.511 ist der Stand, an dem Bitcoin gerade sitzt — knapp über der 72-Stunden-Unterstützung bei 61.824 $ pro CoinMarketCap — einer Marke, die diese Woche still und leise als Fundament gehalten hat.
Diese 61.824-$-Linie ist der Sand. Wenn Käufer sie hier verteidigen, deutet das Setup wieder auf Widerstand bei 64.504 $ hin. Wenn diese Marke fällt, übergibt das Dynamik an die Verkäufer und öffnet die Tür zu einem tieferen Rücksetzer.
Auf der Oberseite ist 64.504 $ die Decke. Ein sauberer Ausbruch darüber würde signalisieren, dass Käufer wieder die Kontrolle übernehmen — dort verschiebt sich das Chartbild.
Regulatorischer Rückenwind baut sich leise unter der Oberfläche auf. Das CLARITY Act hat vor seinem Vorstoß im Senat eine weitere polizeiliche/Strafverfolgungs-Unterstützung erhalten, und große Firmen bringen MiCA-Compliance-Tools an den Start — die Infrastruktur holt beim Asset auf.
Unterstützung hier verteidigen oder auf den Break warten? Die $BTC pair ist nur einen Fingertipp entfernt, wenn du auf diesen Ebenen handeln willst, solange das Setup noch aktiv ist.
Denk in Zyklen, nicht in Kerzen.
#Bitcoin #BTC #Crypto
$62.511 ist der Stand, an dem Bitcoin gerade sitzt — knapp über der 72-Stunden-Unterstützung bei 61.824 $ pro CoinMarketCap — einer Marke, die diese Woche still und leise als Fundament gehalten hat.
Diese 61.824-$-Linie ist der Sand. Wenn Käufer sie hier verteidigen, deutet das Setup wieder auf Widerstand bei 64.504 $ hin. Wenn diese Marke fällt, übergibt das Dynamik an die Verkäufer und öffnet die Tür zu einem tieferen Rücksetzer.
Auf der Oberseite ist 64.504 $ die Decke. Ein sauberer Ausbruch darüber würde signalisieren, dass Käufer wieder die Kontrolle übernehmen — dort verschiebt sich das Chartbild.
Regulatorischer Rückenwind baut sich leise unter der Oberfläche auf. Das CLARITY Act hat vor seinem Vorstoß im Senat eine weitere polizeiliche/Strafverfolgungs-Unterstützung erhalten, und große Firmen bringen MiCA-Compliance-Tools an den Start — die Infrastruktur holt beim Asset auf.
Unterstützung hier verteidigen oder auf den Break warten? Die $BTC pair ist nur einen Fingertipp entfernt, wenn du auf diesen Ebenen handeln willst, solange das Setup noch aktiv ist.
Denk in Zyklen, nicht in Kerzen.
#Bitcoin #BTC #Crypto
Diese 61.824-$-Linie ist der Sand. Wenn Käufer sie hier verteidigen, deutet das Setup wieder auf Widerstand bei 64.504 $ hin. Wenn diese Marke fällt, übergibt das Dynamik an die Verkäufer und öffnet die Tür zu einem tieferen Rücksetzer.
Auf der Oberseite ist 64.504 $ die Decke. Ein sauberer Ausbruch darüber würde signalisieren, dass Käufer wieder die Kontrolle übernehmen — dort verschiebt sich das Chartbild.
Regulatorischer Rückenwind baut sich leise unter der Oberfläche auf. Das CLARITY Act hat vor seinem Vorstoß im Senat eine weitere polizeiliche/Strafverfolgungs-Unterstützung erhalten, und große Firmen bringen MiCA-Compliance-Tools an den Start — die Infrastruktur holt beim Asset auf.
Unterstützung hier verteidigen oder auf den Break warten? Die $BTC pair ist nur einen Fingertipp entfernt, wenn du auf diesen Ebenen handeln willst, solange das Setup noch aktiv ist.
Denk in Zyklen, nicht in Kerzen.
#Bitcoin #BTC #Crypto
16
·
--
Regulatorische Klarheit trifft diese Woche hart auf die Schlagzeilen. Das CLARITY Act hat vor seinem Vorstoß im Senat gerade eine zweite behördliche Strafverfolgungs-Befürwortung erhalten, und eine globale Anwaltskanzlei hat ein dediziertes MiCA-Compliance-Tool für EU-Krypto-Firmen gestartet.
Das ist die Art von institutioneller Infrastruktur, die verändert, wohin kluges Kapital fließt.
GRVT steht genau im Zentrum dieses Wandels. Als compliance-first dezentr. Börse mit Optionen und strukturierten Produkten ist jedes neue regulatorische Rahmenwerk, das live geht, ein Rückenwind für seine These. Wenn Japan den Zugang zu Krypto-Krediten ausweitet, wird nur noch der adressierbare Markt vergrößert.
Entscheidend ist jetzt, ob $GRVT auf diesen makroökonomischen Auslöser mit Handelsvolumen reagiert. Die Nachrichtenlage ist unbestreitbar unterstützend — das CLARITY Act und die MiCA-Tools senken beide die Hürden dafür, dass institutionelle Desks auf regulierte DeFi-Handelsplätze wechseln können.
In dieser Umgebung werden compliant aufgestellte Infrastrukturbörsen neu bewertet. Beobachte, wie $GRVT auf diese Welle an Schlagzeilen in den nächsten Sitzungen reagiert.
Keine Finanzberatung.
Das $GRVT-Paar ist nur einen Fingertipp entfernt, wenn du auf die Set-up-Idee reagieren willst.
Level statt Gefühle.
#GRVT #Crypto
Regulatorische Klarheit trifft diese Woche hart auf die Schlagzeilen. Das CLARITY Act hat vor seinem Vorstoß im Senat gerade eine zweite behördliche Strafverfolgungs-Befürwortung erhalten, und eine globale Anwaltskanzlei hat ein dediziertes MiCA-Compliance-Tool für EU-Krypto-Firmen gestartet.
Das ist die Art von institutioneller Infrastruktur, die verändert, wohin kluges Kapital fließt.
GRVT steht genau im Zentrum dieses Wandels. Als compliance-first dezentr. Börse mit Optionen und strukturierten Produkten ist jedes neue regulatorische Rahmenwerk, das live geht, ein Rückenwind für seine These. Wenn Japan den Zugang zu Krypto-Krediten ausweitet, wird nur noch der adressierbare Markt vergrößert.
Entscheidend ist jetzt, ob $GRVT auf diesen makroökonomischen Auslöser mit Handelsvolumen reagiert. Die Nachrichtenlage ist unbestreitbar unterstützend — das CLARITY Act und die MiCA-Tools senken beide die Hürden dafür, dass institutionelle Desks auf regulierte DeFi-Handelsplätze wechseln können.
In dieser Umgebung werden compliant aufgestellte Infrastrukturbörsen neu bewertet. Beobachte, wie $GRVT auf diese Welle an Schlagzeilen in den nächsten Sitzungen reagiert.
Keine Finanzberatung.
Das $GRVT-Paar ist nur einen Fingertipp entfernt, wenn du auf die Set-up-Idee reagieren willst.
Level statt Gefühle.
#GRVT #Crypto
Das ist die Art von institutioneller Infrastruktur, die verändert, wohin kluges Kapital fließt.
GRVT steht genau im Zentrum dieses Wandels. Als compliance-first dezentr. Börse mit Optionen und strukturierten Produkten ist jedes neue regulatorische Rahmenwerk, das live geht, ein Rückenwind für seine These. Wenn Japan den Zugang zu Krypto-Krediten ausweitet, wird nur noch der adressierbare Markt vergrößert.
Entscheidend ist jetzt, ob $GRVT auf diesen makroökonomischen Auslöser mit Handelsvolumen reagiert. Die Nachrichtenlage ist unbestreitbar unterstützend — das CLARITY Act und die MiCA-Tools senken beide die Hürden dafür, dass institutionelle Desks auf regulierte DeFi-Handelsplätze wechseln können.
In dieser Umgebung werden compliant aufgestellte Infrastrukturbörsen neu bewertet. Beobachte, wie $GRVT auf diese Welle an Schlagzeilen in den nächsten Sitzungen reagiert.
Keine Finanzberatung.
Das $GRVT-Paar ist nur einen Fingertipp entfernt, wenn du auf die Set-up-Idee reagieren willst.
Level statt Gefühle.
#GRVT #Crypto
8
Anmelden und weiter Inhalte entdecken
Krypto-Nutzer weltweit auf Binance Square kennenlernen
⚡️ Bleib in Sachen Krypto stets am Puls.
💬 Die weltgrößte Kryptobörse vertraut darauf.
👍 Erhalte verlässliche Einblicke von verifizierten Creators.
E-Mail-Adresse/Telefonnummer
Trendthemen
FedMinutesFocusOnOctoberPause
140,465 Aufrufe
1,218 Kommentare
🚨 HOHE ALARMSTUFE ‼️ BITTE HANDELT IN DER NÄCHSTEN STUNDE NICHT BLIND 🚨
Leute, in weniger als einer Stunde werden die FOMC-Protokolle veröffentlicht.
Nach der Volatilität, die wir heute bereits erlebt haben, möchte ich wirklich nicht, dass jemand kurz vor der Veröffentlichung irgendwelche zufälligen Positionen mit hohem Hebel eröffnet.
Die stärkste Reaktion erwarte ich bei Gold (XAU), Silber (XAG), BTC und ETH. Coins wie SOL und andere stark gehebelte Altcoins mit mittlerer oder niedriger Marktkapitalisierung können jede Bewegung von BTC noch verstärken.
Gold und Silber reagieren heute Abend besonders empfindlich, weil der Markt bereits auf den US-Dollar und die Renditen von US-Staatsanleihen reagiert und beide Metalle vor der Veröffentlichung der Fed-Protokolle stark unter Druck standen.
Kurz gesagt:
📉 FOMC-Protokolle mit falkenhaftem Ton → Dollar und Renditen können steigen → Druck auf BTC, Krypto, Gold und Silber
📈 FOMC-Protokolle mit taubenhaftem Ton → Dollar und Renditen können nachgeben → BTC, Gold, Silber und andere Risikoanlagen können kräftig steigen.
Und bitte denkt daran: Die erste Kerze kann eine Falle sein. Es kann zunächst zu einem Pump kommen, dann zu einem sofortigen Dump, Liquidationen auf beiden Seiten und erst danach zur tatsächlichen Richtungsbewegung.
Schützt also vorerst eure Positionen, reduziert unnötigen Hebel und springt nicht aus FOMO auf die erste Bewegung auf.
Heute Abend beobachte ich zuerst $XAU , $XAG und $BTC . An ihnen werden wir sehr schnell erkennen, wie der Markt die Fed einschätzt.
Ich halte euch rechtzeitig auf dem Laufenden.
Folgt @Panda Traders und aktiviert jetzt eure Benachrichtigungen.
#FedMinutesFocusOnOctoberPause
Panda Traders
·18 Likes
·3.6k Aufrufe
BinanceLaunchesBinanceIntelligence
1.1M Aufrufe
6,415 Kommentare
EvernorthDelaysNasdaqDebutToOct12
10,622 Aufrufe
270 Kommentare