

DOODHI
88 Beiträge

DOODHI
Melden
Nutzer blockieren
chart analysis and breakout expert spot trading and future trading
Trade eröffnen
Regelmäßiger Trader
4.9 Jahre
49 Following
38 Follower
59 Like gegeben
Beiträge
Portfolio
Alle
Zitierungen
Live
·
--
Artikel
Übersetzung ansehen
$STX USDT 8H chart analysisSTXUSDT 8H chart analysis
Short-term bullish recovery Major resistance overhead
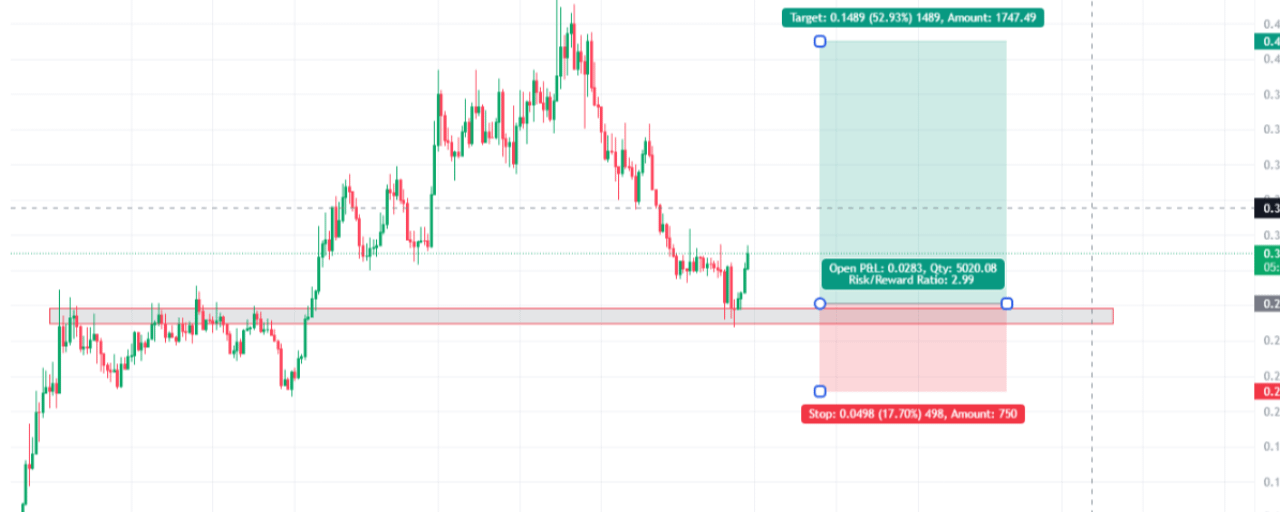
Based on your TradingView screenshot, STX is showing a potential bullish reversal from an important support zone. However, confirmation is still needed.
1. Market structure
Previous trend: Strong bullish rally from approximately $0.13 to $0.45.After the top: Clear bearish structure with lower highs and lower lows.Current situation: Price has reached the previous accumulation/support zone around $0.26–$0.27 and bounced.Current price: Approximately $0.3097.
The recent bounce is encouraging, but the 8H trend has not yet fully reversed.
2. Important price levels
Level
Price
Significance
Major resistance
$0.33–0.34
Breakout confirmation
Resistance 2
$0.36–0.37
Previous supply
Major target
$0.42–0.43
Your chart target
Current price
$0.3097
Current trading area
Support 1
$0.28–0.29
Short-term support
Strong support
$0.26–0.27
Demand zone
Stop-loss area
$0.23
Trade invalidation
3. Analysis of your long position
Your TradingView long-position tool shows:
Entry: approximately $0.281Target: approximately $0.430Stop-loss: approximately $0.231Risk/reward: 1:2.99Potential upside: 52.93%Potential downside: 17.70%
Risk/reward is attractive
Your entry is strategically positioned near the historical demand zone.
However, the main concern is that price is still below the $0.33–$0.34 resistance.
4. What I expect next
Scenario A — Bullish continuation
Preferred confirmation
Price holds above $0.28–$0.29.An 8H candle closes above $0.33–$0.34.Price retests that level successfully.Potential upside targets: $0.36, $0.39 and $0.42–$0.43.Scenario B — Bearish rejectionRisk scenarioPrice gets rejected around $0.33.Falls below $0.28.Retests $0.26–$0.27.Losing that demand zone could expose lower prices.
5. My trading opinion
I like the location of your entry because it is close to historical support. But I would not consider the bullish reversal confirmed yet.
My preferred confirmation would be an 8H candle close above $0.33–$0.34, followed by a successful retest.
One important point: Your stop at $0.231 is below the support zone, which gives the trade room to fluctuate, but the position size should be calculated according to your maximum acceptable account loss.
One question
Are you already holding this STX long position, or are you planning to enter around $0.28?
That changes whether I would focus on managing the existing trade or finding a better entry.
$BTC
$STX
{spot}(STXUSDT)
#STX #STX/USDT #STXBTC #BinanceReports80%Recoveryof$6.3BillioninLossesfromHackIncident
$STX USDT 8H chart analysis
STXUSDT 8H chart analysis
Short-term bullish recovery Major resistance overhead
Based on your TradingView screenshot, STX is showing a potential bullish reversal from an important support zone. However, confirmation is still needed.
1. Market structure
Previous trend: Strong bullish rally from approximately $0.13 to $0.45.After the top: Clear bearish structure with lower highs and lower lows.Current situation: Price has reached the previous accumulation/support zone around $0.26–$0.27 and bounced.Current price: Approximately $0.3097.
The recent bounce is encouraging, but the 8H trend has not yet fully reversed.
2. Important price levels
Level
Price
Significance
Major resistance
$0.33–0.34
Breakout confirmation
Resistance 2
$0.36–0.37
Previous supply
Major target
$0.42–0.43
Your chart target
Current price
$0.3097
Current trading area
Support 1
$0.28–0.29
Short-term support
Strong support
$0.26–0.27
Demand zone
Stop-loss area
$0.23
Trade invalidation
3. Analysis of your long position
Your TradingView long-position tool shows:
Entry: approximately $0.281Target: approximately $0.430Stop-loss: approximately $0.231Risk/reward: 1:2.99Potential upside: 52.93%Potential downside: 17.70%
Risk/reward is attractive
Your entry is strategically positioned near the historical demand zone.
However, the main concern is that price is still below the $0.33–$0.34 resistance.
4. What I expect next
Scenario A — Bullish continuation
Preferred confirmation
Price holds above $0.28–$0.29.An 8H candle closes above $0.33–$0.34.Price retests that level successfully.Potential upside targets: $0.36, $0.39 and $0.42–$0.43.Scenario B — Bearish rejectionRisk scenarioPrice gets rejected around $0.33.Falls below $0.28.Retests $0.26–$0.27.Losing that demand zone could expose lower prices.
5. My trading opinion
I like the location of your entry because it is close to historical support. But I would not consider the bullish reversal confirmed yet.
My preferred confirmation would be an 8H candle close above $0.33–$0.34, followed by a successful retest.
One important point: Your stop at $0.231 is below the support zone, which gives the trade room to fluctuate, but the position size should be calculated according to your maximum acceptable account loss.
One question
Are you already holding this STX long position, or are you planning to enter around $0.28?
That changes whether I would focus on managing the existing trade or finding a better entry.
$BTC
$STX
#STX #STX/USDT #STXBTC #BinanceReports80%Recoveryof$6.3BillioninLossesfromHackIncident
115
·
--
Bärisch
Übersetzung ansehen
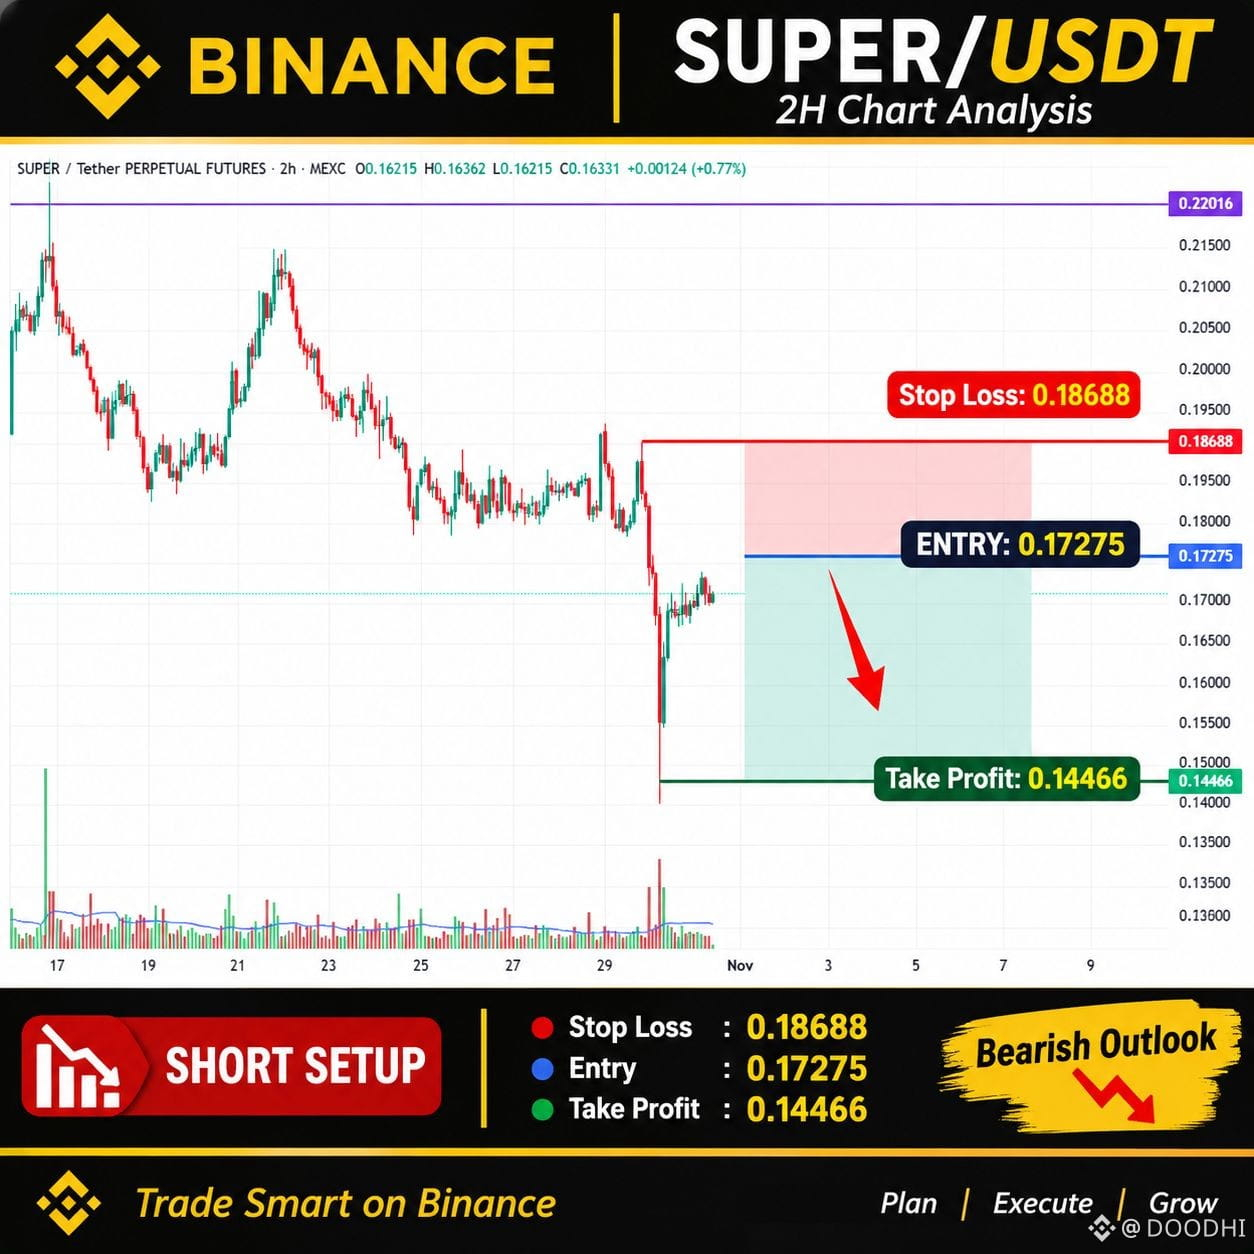
📉 SUPER/USDT – Bearish Setup | 2H Chart Analysis
SUPER/USDT is showing strong bearish momentum on the 2-hour chart after a sharp decline from the 0.1800–0.1900 resistance area.
The price is currently trading around 0.16331 USDT. A potential short setup is being considered, with a risk/reward ratio of approximately 1:2.
🔑 Trade Setup – SHORT
🔵 Entry: 0.17275 USDT
🔴 Stop Loss: 0.18688 USDT
🟢 Take Profit: 0.14466 USDT
📊 Risk/Reward Ratio: 1:1.99
Technical Analysis:
SUPER has experienced a significant sell-off, followed by a small recovery. The current price is below the planned entry level, making a potential pullback toward 0.17275 an area to watch for a short opportunity.
Bearish Scenario:
If the price reaches the entry zone and shows rejection, sellers may push it toward the 0.15500 support area and potentially the 0.14466 target.
Invalidation:
A move above 0.18688 would invalidate this short setup. A strong recovery above the 0.1800–0.1869 area could weaken the bearish outlook.
⚠️ Risk Management:
Wait for confirmation before entering. Do not risk more than you can afford to lose, and always use a stop loss.
$BTC
{future}(SUPERUSDT)
$SUPER
#SuperVerse
#SUPER/USDT
#SUPER
#BinanceReports80%Recoveryof$6.3BillioninLossesfromHackIncident #TRMCambodianCasinosReceived$1.07BInCrypto
📉 SUPER/USDT – Bearish Setup | 2H Chart Analysis
SUPER/USDT is showing strong bearish momentum on the 2-hour chart after a sharp decline from the 0.1800–0.1900 resistance area.
The price is currently trading around 0.16331 USDT. A potential short setup is being considered, with a risk/reward ratio of approximately 1:2.
🔑 Trade Setup – SHORT
🔵 Entry: 0.17275 USDT
🔴 Stop Loss: 0.18688 USDT
🟢 Take Profit: 0.14466 USDT
📊 Risk/Reward Ratio: 1:1.99
Technical Analysis:
SUPER has experienced a significant sell-off, followed by a small recovery. The current price is below the planned entry level, making a potential pullback toward 0.17275 an area to watch for a short opportunity.
Bearish Scenario:
If the price reaches the entry zone and shows rejection, sellers may push it toward the 0.15500 support area and potentially the 0.14466 target.
Invalidation:
A move above 0.18688 would invalidate this short setup. A strong recovery above the 0.1800–0.1869 area could weaken the bearish outlook.
⚠️ Risk Management:
Wait for confirmation before entering. Do not risk more than you can afford to lose, and always use a stop loss.
$BTC
$SUPER
#SuperVerse
#SUPER/USDT
#SUPER
#BinanceReports80%Recoveryof$6.3BillioninLossesfromHackIncident #TRMCambodianCasinosReceived$1.07BInCrypto
62
·
--
Bärisch
$BIRB
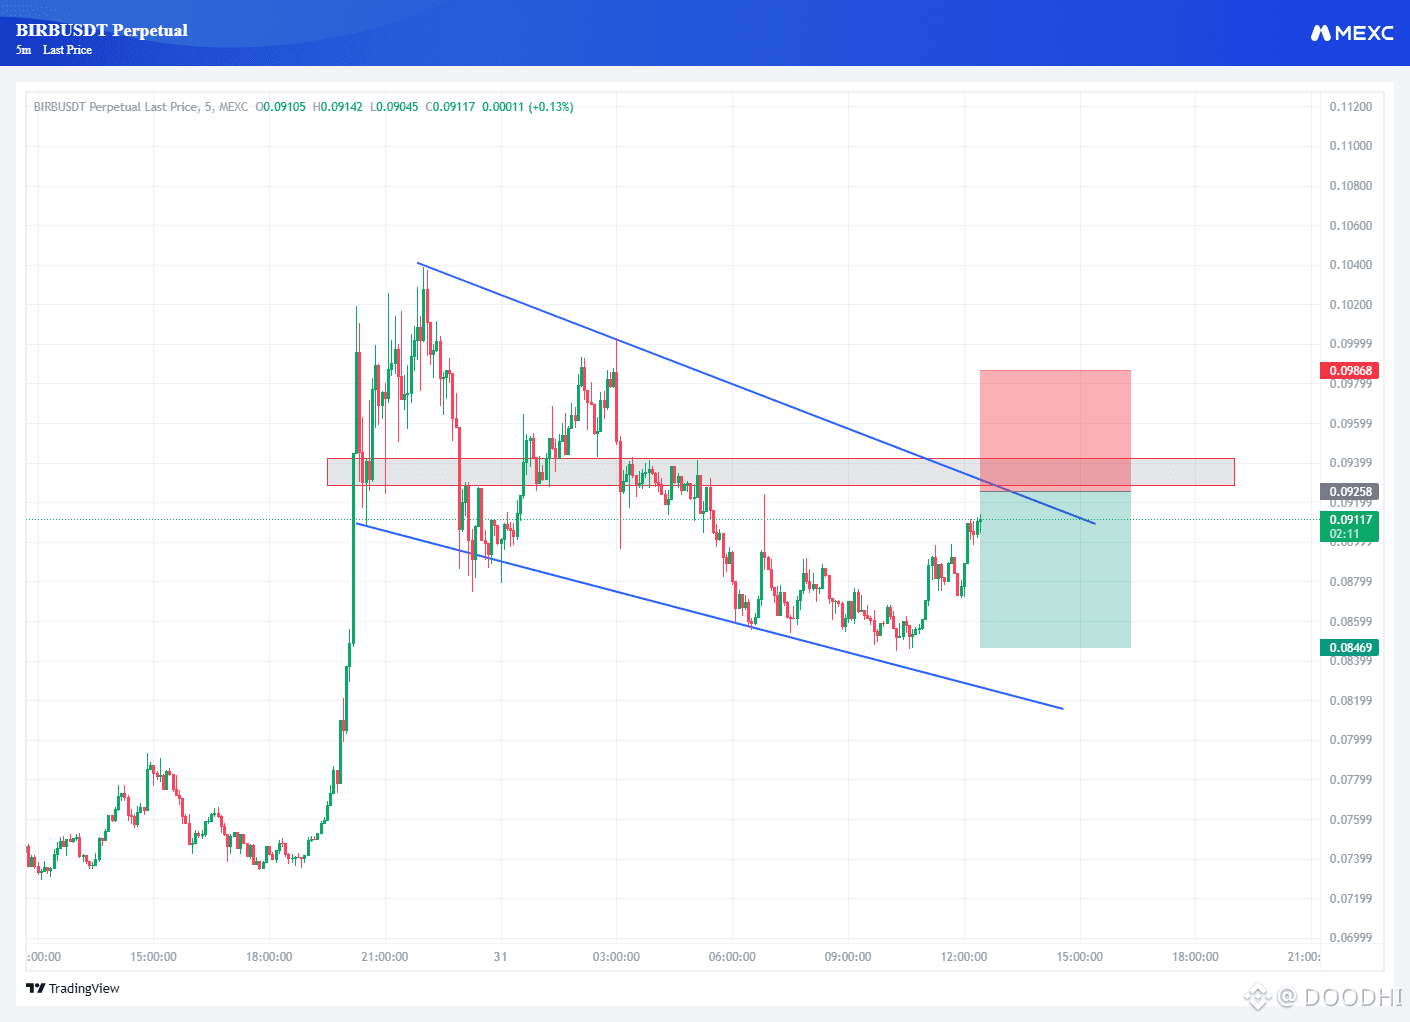
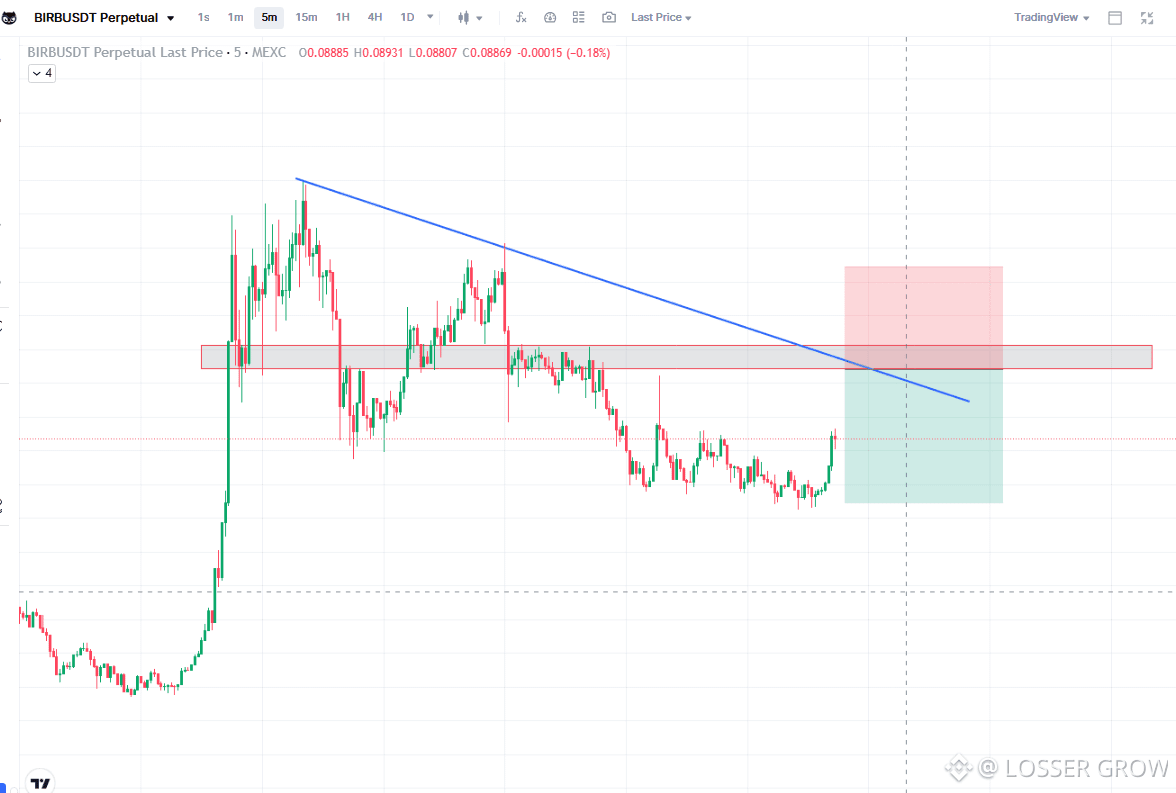
📉 BIRBUSDT – SHORT-SETUP
🔴 Einstieg: 0.09258 USDT
🎯 Gewinnmitnahme (TP): 0.08469 USDT
🛑 Stop-Loss (SL): 0.09868 USDT
📊 Risiko-Ertrags-Verhältnis: 1:1.29
Handelsrichtung: SHORT
Warte vor dem Einstieg auf eine Bestätigung in der Widerstandszone.
$BTC
$BIRB
{future}(BIRBUSDT)
#BIRB #BIRBUSDT #SuspectedNorthKoreaAttacksAccountForNearly89%OfCryptoHackLosses
$BIRB
📉 BIRBUSDT – SHORT-SETUP
🔴 Einstieg: 0.09258 USDT
🎯 Gewinnmitnahme (TP): 0.08469 USDT
🛑 Stop-Loss (SL): 0.09868 USDT
📊 Risiko-Ertrags-Verhältnis: 1:1.29
Handelsrichtung: SHORT
Warte vor dem Einstieg auf eine Bestätigung in der Widerstandszone.
$BTC
$BIRB
#BIRB #BIRBUSDT #SuspectedNorthKoreaAttacksAccountForNearly89%OfCryptoHackLosses
1
269
·
--
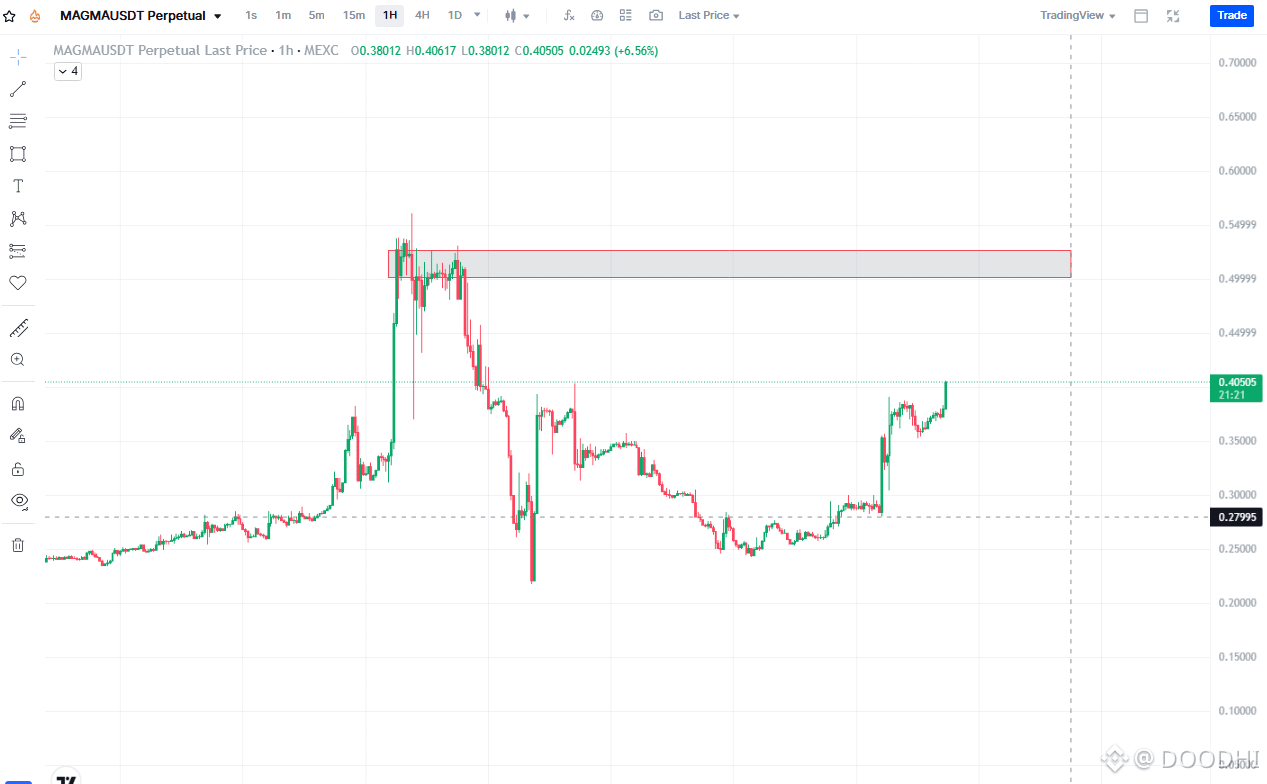
🚀 MAGMAUSDT – Bullisches Momentum | 1-Stunden-Chartanalyse
MAGMAUSDT zeigt im 1-Stunden-Chart ein starkes bullisches Momentum. Der Kurs liegt derzeit bei etwa 0.40505 USDT.
📊 Technische Analyse:
Der Kurs hat sich deutlich vom Unterstützungsbereich bei 0.25–0.28 erholt und nähert sich nun einer wichtigen Widerstandszone. Die Käufer zeigen Stärke, doch bevor ein größerer Ausbruch erwartet werden kann, ist eine Bestätigung erforderlich.
🔑 Wichtige Kursmarken im Blick:
🟢 Aktueller Kurs: 0.40505 USDT
🎯 Ziel 1: 0.4500 USDT
🎯 Ziel 2: 0.5000 USDT
🔴 Bedeutende Widerstandszone: 0.4990–0.5500 USDT
⚠️ Wichtige Unterstützung: 0.3500 USDT
Bullisches Szenario:
Wenn MAGMAUSDT sein Momentum beibehält und über 0.4500 ausbricht, könnte die nächste mögliche Bewegung in Richtung 0.5000 gehen. Ein starker Ausbruch über die Widerstandszone könnte den Weg für weitere Kursgewinne ebnen.
Bärisches Szenario:
Wird der Kurs abgewiesen und fällt unter 0.3500, könnte das bullische Momentum nachlassen und die Wahrscheinlichkeit einer stärkeren Korrektur zunehmen.
📌 Meine Einschätzung: MAGMAUSDT zeigt eine interessante Erholung, doch die bevorstehende Widerstandszone wird entscheidend sein. Warte immer auf eine Bestätigung und manage dein Risiko sorgfältig.
💬 Was denkst du? Wird MAGMAUSDT über 0.5000 ausbrechen oder übernehmen die Verkäufer die Kontrolle?
DYOR – Dies ist eine technische Analyse und keine Finanzberatung. Handle immer mit einem angemessenen Risikomanagement.
$MAGMA
{future}(MAGMAUSDT)
#BinanceReports80%Recoveryof$6.3BillioninLossesfromHackIncident #TRMCambodianCasinosReceived$1.07BInCrypto #IolePlansToSellAll151.21Bitcoin #SuspectedNorthKoreaAttacksAccountForNearly89%OfCryptoHackLosses #MAGMAUSTD
🚀 MAGMAUSDT – Bullisches Momentum | 1-Stunden-Chartanalyse
MAGMAUSDT zeigt im 1-Stunden-Chart ein starkes bullisches Momentum. Der Kurs liegt derzeit bei etwa 0.40505 USDT.
📊 Technische Analyse:
Der Kurs hat sich deutlich vom Unterstützungsbereich bei 0.25–0.28 erholt und nähert sich nun einer wichtigen Widerstandszone. Die Käufer zeigen Stärke, doch bevor ein größerer Ausbruch erwartet werden kann, ist eine Bestätigung erforderlich.
🔑 Wichtige Kursmarken im Blick:
🟢 Aktueller Kurs: 0.40505 USDT
🎯 Ziel 1: 0.4500 USDT
🎯 Ziel 2: 0.5000 USDT
🔴 Bedeutende Widerstandszone: 0.4990–0.5500 USDT
⚠️ Wichtige Unterstützung: 0.3500 USDT
Bullisches Szenario:
Wenn MAGMAUSDT sein Momentum beibehält und über 0.4500 ausbricht, könnte die nächste mögliche Bewegung in Richtung 0.5000 gehen. Ein starker Ausbruch über die Widerstandszone könnte den Weg für weitere Kursgewinne ebnen.
Bärisches Szenario:
Wird der Kurs abgewiesen und fällt unter 0.3500, könnte das bullische Momentum nachlassen und die Wahrscheinlichkeit einer stärkeren Korrektur zunehmen.
📌 Meine Einschätzung: MAGMAUSDT zeigt eine interessante Erholung, doch die bevorstehende Widerstandszone wird entscheidend sein. Warte immer auf eine Bestätigung und manage dein Risiko sorgfältig.
💬 Was denkst du? Wird MAGMAUSDT über 0.5000 ausbrechen oder übernehmen die Verkäufer die Kontrolle?
DYOR – Dies ist eine technische Analyse und keine Finanzberatung. Handle immer mit einem angemessenen Risikomanagement.
$MAGMA
#BinanceReports80%Recoveryof$6.3BillioninLossesfromHackIncident #TRMCambodianCasinosReceived$1.07BInCrypto #IolePlansToSellAll151.21Bitcoin #SuspectedNorthKoreaAttacksAccountForNearly89%OfCryptoHackLosses #MAGMAUSTD
1
1
204
·
--
$BIRB
kurzes Scalping
Einstieg 0.0925
Einstieg 0.0940
Take-Profit 0.0885
Take-Profit 0.0855
Stop-Loss 0.0980
$BTC
$BIRB
{future}(BIRBUSDT)
#BinanceReports80%Recoveryof$6.3BillioninLossesfromHackIncident #BIRB #TRMCambodianCasinosReceived$1.07BInCrypto #IolePlansToSellAll151.21Bitcoin #SuspectedNorthKoreaAttacksAccountForNearly89%OfCryptoHackLosses
$BIRB
kurzes Scalping
Einstieg 0.0925
Einstieg 0.0940
Take-Profit 0.0885
Take-Profit 0.0855
Stop-Loss 0.0980
$BTC
$BIRB
#BinanceReports80%Recoveryof$6.3BillioninLossesfromHackIncident #BIRB #TRMCambodianCasinosReceived$1.07BInCrypto #IolePlansToSellAll151.21Bitcoin #SuspectedNorthKoreaAttacksAccountForNearly89%OfCryptoHackLosses
3
339
·
--
Bullisch
$IDOL
Long-Scalping
EINSTIEG 0.024
EINSTIEG 0.0235
KURSZIEL 0.0255
KURSZIEL 0.0265
STOP-LOSS 0.022
$BTC $IDOL
#ASICHasReceivedNoPredictionMarketApplications #IDOL #HKDollarStablecoinHKDAPToLaunchOnSolana
$IDOL
Long-Scalping
EINSTIEG 0.024
EINSTIEG 0.0235
KURSZIEL 0.0255
KURSZIEL 0.0265
STOP-LOSS 0.022
$BTC $IDOL
#ASICHasReceivedNoPredictionMarketApplications #IDOL #HKDollarStablecoinHKDAPToLaunchOnSolana
Long-Scalping
EINSTIEG 0.024
EINSTIEG 0.0235
KURSZIEL 0.0255
KURSZIEL 0.0265
STOP-LOSS 0.022
$BTC $IDOL
#ASICHasReceivedNoPredictionMarketApplications #IDOL #HKDollarStablecoinHKDAPToLaunchOnSolana
1
131
·
--
Bärisch
$AIN
Short-Scalping
EINSTIEG 0.285
EINSTIEG 0.293
TP 0.280
TP 0.270
TP 0.260
TP 0.250
SL 0.315$
$BTC $AIN
{future}(AINUSDT)
#AIN #AiNarratives #IolePlansToSellAll151.21Bitcoin
$AIN
Short-Scalping
EINSTIEG 0.285
EINSTIEG 0.293
TP 0.280
TP 0.270
TP 0.260
TP 0.250
SL 0.315$
$BTC $AIN
#AIN #AiNarratives #IolePlansToSellAll151.21Bitcoin
Short-Scalping
EINSTIEG 0.285
EINSTIEG 0.293
TP 0.280
TP 0.270
TP 0.260
TP 0.250
SL 0.315$
$BTC $AIN
#AIN #AiNarratives #IolePlansToSellAll151.21Bitcoin
1
366
·
--
Bärisch
$IDOL
Hier shorten
entry 0.0253
TP 0.024
0.0235
SL 0.026$
#IolePlansToSellAll151.21Bitcoin #ASICHasReceivedNoPredictionMarketApplications #IDOL
$IDOL
Hier shorten
entry 0.0253
TP 0.024
0.0235
SL 0.026$
#IolePlansToSellAll151.21Bitcoin #ASICHasReceivedNoPredictionMarketApplications #IDOL
Hier shorten
entry 0.0253
TP 0.024
0.0235
SL 0.026$
#IolePlansToSellAll151.21Bitcoin #ASICHasReceivedNoPredictionMarketApplications #IDOL
5
2
204
·
--
Bärisch
$MAGMA Shorts, auf die Plätze, fertig, los!
$MAGMA Shorts, auf die Plätze, fertig, los!
1
351
·
--
$ARIA Ich denke, wir sind bullisch, ich bin bärisch.
$ARIA Ich denke, wir sind bullisch, ich bin bärisch.
1
1
1
193
·
--
Bullisch
BNB-Chain: der am meisten unterbewertete Meme-Token mit weniger als 1M Marktkapitalisierung – BUILDER, den du vermisst: $BTC $ETH #memecoin🚀🚀🚀 #meme板块关注热点 #meme2027
BNB-Chain: der am meisten unterbewertete Meme-Token mit weniger als 1M Marktkapitalisierung – BUILDER, den du vermisst: $BTC $ETH #memecoin🚀🚀🚀 #meme板块关注热点 #meme2027
20
·
--
$BUILDER Viele Menschen haben die Gelegenheit verpasst 😞
$BUILDER Viele Menschen haben die Gelegenheit verpasst 😞
85
·
--
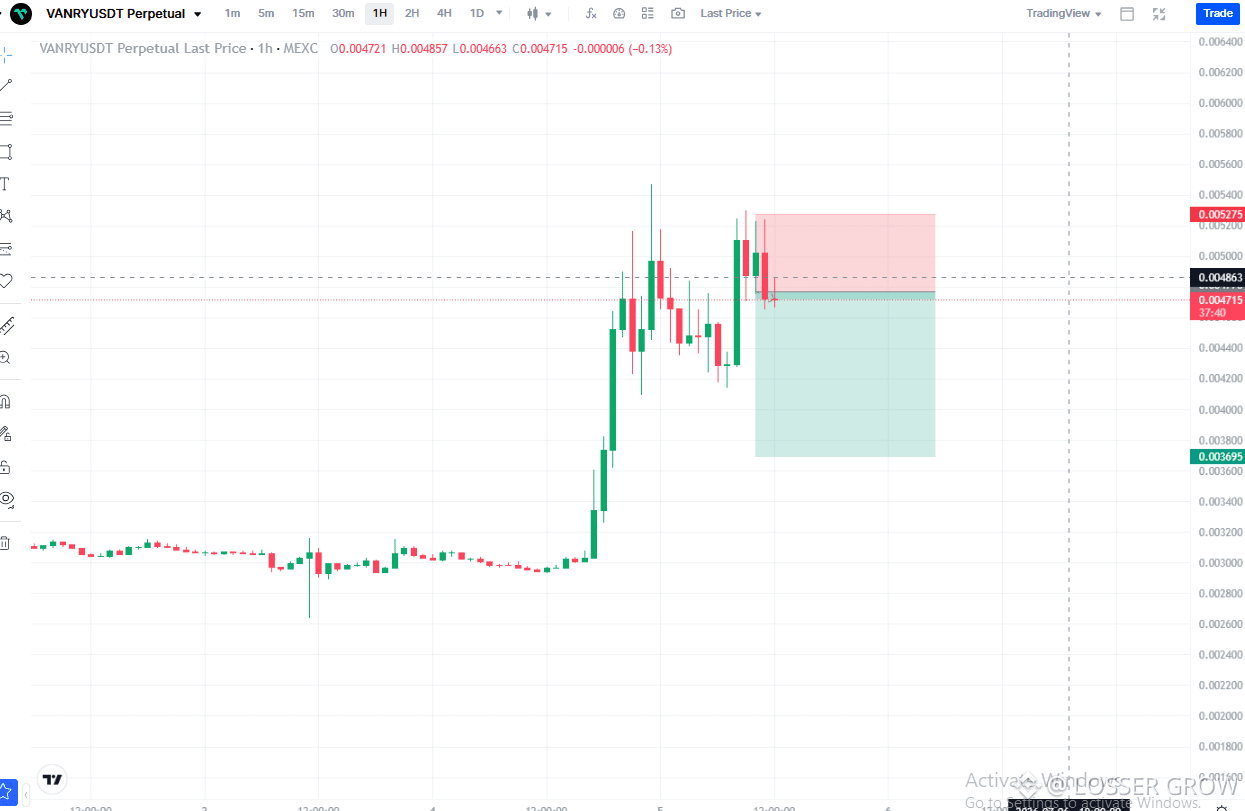
VANRYUSDT 1H-Chart:
$VANRY Update 📉
Der Preis testet nach einer starken impulsiven Rallye eine wichtige Widerstandszone um 0.0048–0.0050.
🔹 Eine Abweisung vom Widerstand könnte einen Rücksetzer in Richtung 0.0037–0.0038 auslösen.
🔹 Solange der Preis unter 0.0050 bleibt, haben die Verkäufer den Vorteil im kurzfristigen Bereich.
🔹 Ein sauberer Ausbruch und ein Schlusskurs über 0.0050 würden das bärische Setup ungültig machen und könnten den Weg für eine weitere Aufwärtswelle öffnen.
Trade-Idee:
✅ Short unterhalb des Widerstands
🎯 Ziel: 0.0037
❌ Stop Loss: Oberhalb von 0.00525
Geduld ist entscheidend—lass den Markt die Bewegung bestätigen, bevor du einsteigst.
#VANRY #Crypto #Altcoins #Trading #TechnischeAnalyse #MEXC #KryptoTrading
Oder, wenn du eine kürzere, ansprechendere Version willst:
$VANRY hier wirkt es interessant. 👀
Abgewiesen nahe 0.0050 nach einem massiven Pump.
📍 Widerstand: 0.0049–0.0050
🎯 Bärisches Ziel: 0.0037
🛑 Ungültigmachung: Oberhalb von 0.00525
Wenn Käufer den Widerstand nicht zurückerobern, könnte dies ein solides Short-Setup sein.
Warte immer auf Bestätigung. 📊
$VANRY $BTC
{future}(VANRYUSDT)
#VANRY #crypto #Trading #Altcoins
VANRYUSDT 1H-Chart:
$VANRY Update 📉
Der Preis testet nach einer starken impulsiven Rallye eine wichtige Widerstandszone um 0.0048–0.0050.
🔹 Eine Abweisung vom Widerstand könnte einen Rücksetzer in Richtung 0.0037–0.0038 auslösen.
🔹 Solange der Preis unter 0.0050 bleibt, haben die Verkäufer den Vorteil im kurzfristigen Bereich.
🔹 Ein sauberer Ausbruch und ein Schlusskurs über 0.0050 würden das bärische Setup ungültig machen und könnten den Weg für eine weitere Aufwärtswelle öffnen.
Trade-Idee:
✅ Short unterhalb des Widerstands
🎯 Ziel: 0.0037
❌ Stop Loss: Oberhalb von 0.00525
Geduld ist entscheidend—lass den Markt die Bewegung bestätigen, bevor du einsteigst.
#VANRY #Crypto #Altcoins #Trading #TechnischeAnalyse #MEXC #KryptoTrading
Oder, wenn du eine kürzere, ansprechendere Version willst:
$VANRY hier wirkt es interessant. 👀
Abgewiesen nahe 0.0050 nach einem massiven Pump.
📍 Widerstand: 0.0049–0.0050
🎯 Bärisches Ziel: 0.0037
🛑 Ungültigmachung: Oberhalb von 0.00525
Wenn Käufer den Widerstand nicht zurückerobern, könnte dies ein solides Short-Setup sein.
Warte immer auf Bestätigung. 📊
$VANRY $BTC
#VANRY #crypto #Trading #Altcoins
122
·
--
Bullisch
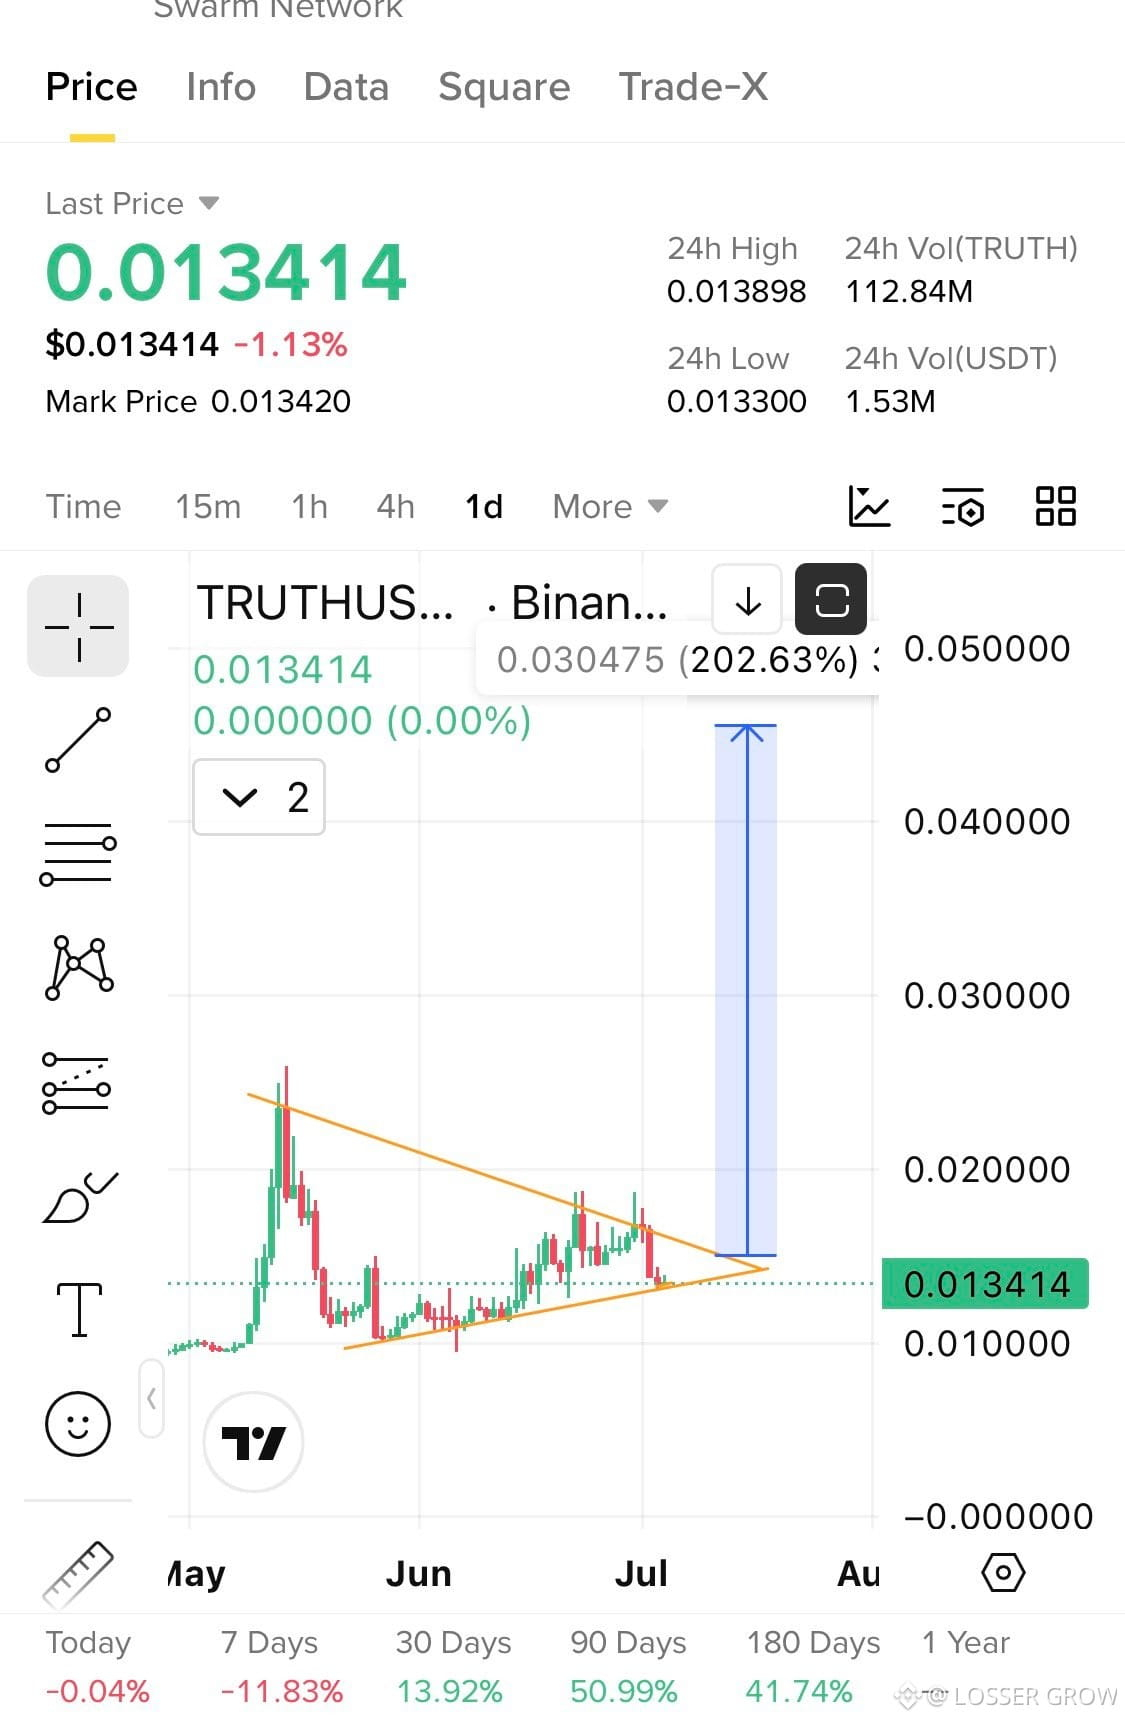
$TRUTH Dieser Monat wird dir diese Münze zeigen
Mehr als 100% nach oben
Komme zu diesem Tweet zurück, wie ich es immer tue
$BTC
{future}(BTCUSDT)
$TRUTH
{future}(TRUTHUSDT)
#TruthSocial #BTC #VitalikOutlinesLeanEthereumRoadmap #BitcoinFallsOver50%FromOctoberHigh
$TRUTH Dieser Monat wird dir diese Münze zeigen
Mehr als 100% nach oben
Komme zu diesem Tweet zurück, wie ich es immer tue
$BTC
$TRUTH
#TruthSocial #BTC #VitalikOutlinesLeanEthereumRoadmap #BitcoinFallsOver50%FromOctoberHigh
Mehr als 100% nach oben
Komme zu diesem Tweet zurück, wie ich es immer tue
$BTC
$TRUTH
#TruthSocial #BTC #VitalikOutlinesLeanEthereumRoadmap #BitcoinFallsOver50%FromOctoberHigh
72

·
--
Bullisch
$EVAA
Ich denke 🤔 50$ diesen Monat einfach Experte bitte 🥺 führe mich #BinanceHODLerBREV #ETHWhaleWatch #BTCVSGOLD
$EVAA
Ich denke 🤔 50$ diesen Monat einfach Experte bitte 🥺 führe mich #BinanceHODLerBREV #ETHWhaleWatch #BTCVSGOLD
Ich denke 🤔 50$ diesen Monat einfach Experte bitte 🥺 führe mich #BinanceHODLerBREV #ETHWhaleWatch #BTCVSGOLD

4
397
·
--
💎Entdecke $B25M26 - Unser verstecktes Juwel 🔍✨ x1000 Potenzial! 💰
Ich habe so intensiv in $B25M26 investiert, dass selbst mein Ledger nervös wurde 👈
$B25M26 wird zum MOND gehen 🚀🚀🚀!
🔥 Das Ziel ist einfach, halte einfach für $B25M26
Nutze diese Gelegenheit, und wir sind gut 🔥
Bereite deine Tasche ab jetzt vor
✅ JETZT KAUFEN
✅ X : @B25M26
$BTC $EVAA
{future}(EVAAUSDT)
#BTC90kChristmas #StrategyBTCPurchase #WriteToEarnUpgrade #CPIWatch
💎Entdecke $B25M26 - Unser verstecktes Juwel 🔍✨ x1000 Potenzial! 💰
Ich habe so intensiv in $B25M26 investiert, dass selbst mein Ledger nervös wurde 👈
$B25M26 wird zum MOND gehen 🚀🚀🚀!
🔥 Das Ziel ist einfach, halte einfach für $B25M26
Nutze diese Gelegenheit, und wir sind gut 🔥
Bereite deine Tasche ab jetzt vor
✅ JETZT KAUFEN
✅ X : @B25M26
$BTC $EVAA
#BTC90kChristmas #StrategyBTCPurchase #WriteToEarnUpgrade #CPIWatch

23
Anmelden und weiter Inhalte entdecken
Krypto-Nutzer weltweit auf Binance Square kennenlernen
⚡️ Bleib in Sachen Krypto stets am Puls.
💬 Die weltgrößte Kryptobörse vertraut darauf.
👍 Erhalte verlässliche Einblicke von verifizierten Creators.
E-Mail-Adresse/Telefonnummer
Trendthemen
BinanceSAFUFundTransferCompleted7499BTC
19,043 Aufrufe
532 Kommentare
Binance meldet Abschluss der SAFU-Fondsübertragung über 7.499 BTC
Binance News
·21 Likes
·8.3k Aufrufe
BinanceRecovery90% of stolen assets
79,652 Aufrufe
141 Kommentare
YiHe:ProofOfReserves:10TokensAt100%Backing
99,617 Aufrufe
603 Kommentare