

Chart-Sniper
642 Beiträge

Chart-Sniper
Melden
Nutzer blockieren
🎯 ChartSniper is your go-to spot for spotting top crypto gainers and breakout setups in real time. I focus on clean chart analysis, key support and resistance.
Trade eröffnen
Gelegenheitstrader
5.4 Monate
5 Following
49 Follower
142 Like gegeben
Beiträge
Portfolio
·
--
Bullisch
$PROM USDT-Longposition (Dreiecksausbruch)
Der Preis liegt bei ~5.625, prallt von der steigenden Unterstützungslinie (~5.30) ab und bewegt sich auf den fallenden Widerstand bei ~5.80–5.85 zu.
Einstieg: 1-Stunden-Schlusskurs über 5.85 (durchbricht die Trendlinie und das Niveau 5.833) oder sicherer Einstieg bei einem Rücksetzer auf 5.80–5.85, der sich hält
Stop-Loss: 5.55 (wieder innerhalb des Dreiecks)
TP1: 6.00 TP2: 6.25 TP3: 6.50 (0%-Niveau / HH, nur wenn 6.25 mit Volumen durchbrochen wird)
Anmerkungen:
Höhere Tiefs innerhalb des Dreiecks und eine starke Abprallkerze sprechen für die Longposition. Der übergeordnete Trend ist nach dem Rückgang von 6.516 jedoch weiterhin bearish. Steige daher nicht ein, bevor der Ausbruch durch einen Schlusskurs bestätigt wurde. Lass den Trade aus, wenn eine 1-Stunden-Kerze unter 5.25 schließt; damit wäre die Dreiecksunterstützung durchbrochen. Das Volumen hat seit dem Rückgang abgenommen. Vertraue dem Ausbruch daher nur, wenn er mit einem Volumenanstieg einhergeht. Riskiere 1–2 % und halte den Hebel niedrig (3–5x).
Keine Finanzberatung.
@Binance_Square_Official #FedMinutesFocusOnOctoberPause #BinanceLaunchesBinanceIntelligence #EvernorthDelaysNasdaqDebutToOct12 #Binance #ChartSniper
{future}(PROMUSDT)
$PROM USDT-Longposition (Dreiecksausbruch)
Der Preis liegt bei ~5.625, prallt von der steigenden Unterstützungslinie (~5.30) ab und bewegt sich auf den fallenden Widerstand bei ~5.80–5.85 zu.
Einstieg: 1-Stunden-Schlusskurs über 5.85 (durchbricht die Trendlinie und das Niveau 5.833) oder sicherer Einstieg bei einem Rücksetzer auf 5.80–5.85, der sich hält
Stop-Loss: 5.55 (wieder innerhalb des Dreiecks)
TP1: 6.00 TP2: 6.25 TP3: 6.50 (0%-Niveau / HH, nur wenn 6.25 mit Volumen durchbrochen wird)
Anmerkungen:
Höhere Tiefs innerhalb des Dreiecks und eine starke Abprallkerze sprechen für die Longposition. Der übergeordnete Trend ist nach dem Rückgang von 6.516 jedoch weiterhin bearish. Steige daher nicht ein, bevor der Ausbruch durch einen Schlusskurs bestätigt wurde. Lass den Trade aus, wenn eine 1-Stunden-Kerze unter 5.25 schließt; damit wäre die Dreiecksunterstützung durchbrochen. Das Volumen hat seit dem Rückgang abgenommen. Vertraue dem Ausbruch daher nur, wenn er mit einem Volumenanstieg einhergeht. Riskiere 1–2 % und halte den Hebel niedrig (3–5x).
Keine Finanzberatung.
@Binance Square Official #FedMinutesFocusOnOctoberPause #BinanceLaunchesBinanceIntelligence #EvernorthDelaysNasdaqDebutToOct12 #Binance #ChartSniper
Der Preis liegt bei ~5.625, prallt von der steigenden Unterstützungslinie (~5.30) ab und bewegt sich auf den fallenden Widerstand bei ~5.80–5.85 zu.
Einstieg: 1-Stunden-Schlusskurs über 5.85 (durchbricht die Trendlinie und das Niveau 5.833) oder sicherer Einstieg bei einem Rücksetzer auf 5.80–5.85, der sich hält
Stop-Loss: 5.55 (wieder innerhalb des Dreiecks)
TP1: 6.00 TP2: 6.25 TP3: 6.50 (0%-Niveau / HH, nur wenn 6.25 mit Volumen durchbrochen wird)
Anmerkungen:
Höhere Tiefs innerhalb des Dreiecks und eine starke Abprallkerze sprechen für die Longposition. Der übergeordnete Trend ist nach dem Rückgang von 6.516 jedoch weiterhin bearish. Steige daher nicht ein, bevor der Ausbruch durch einen Schlusskurs bestätigt wurde. Lass den Trade aus, wenn eine 1-Stunden-Kerze unter 5.25 schließt; damit wäre die Dreiecksunterstützung durchbrochen. Das Volumen hat seit dem Rückgang abgenommen. Vertraue dem Ausbruch daher nur, wenn er mit einem Volumenanstieg einhergeht. Riskiere 1–2 % und halte den Hebel niedrig (3–5x).
Keine Finanzberatung.
@Binance Square Official #FedMinutesFocusOnOctoberPause #BinanceLaunchesBinanceIntelligence #EvernorthDelaysNasdaqDebutToOct12 #Binance #ChartSniper
79
·
--
Bärisch
Übersetzung ansehen
$ENJ USDT Short (triangle breakdown)
Price is ~0.03021 on the 15m chart, squeezing inside a triangle between the falling resistance line (LH at ~0.0316) and the rising support line, with the key level at 0.02970 (38.2%) just below.
Entry: 15m candle close below 0.02960 (breaks the support line and the 0.02970 level), or a rejection at 0.03040-0.03060 (50% level)
Stop loss: 0.03130 (above the 61.8% level and the falling trendline)
TP1: 0.02900 (LL area) TP2: 0.02800 TP3: 0.02720 (0% level / HL, only if 0.02800 breaks with volume)
Notes:
Bias is bearish: lower high and lower low after the sharp drop from the HH, with price below the 50% level. But the triangle is unbroken, so wait for a confirmed close below support instead of shorting inside it. Skip the short if a 15m candle closes above 0.03130; that flips the structure. The 15m timeframe is noisy, and the volume spike was a one-off. Risk 1% or less and keep leverage low (3-5x).
Not financial advice.
@Binance_Square_Official #FedMinutesFocusOnOctoberPause #BinanceLaunchesBinanceIntelligence #EvernorthDelaysNasdaqDebutToOct12 #Binance #ChartSniper
{future}(ENJUSDT)
$ENJ USDT Short (triangle breakdown)
Price is ~0.03021 on the 15m chart, squeezing inside a triangle between the falling resistance line (LH at ~0.0316) and the rising support line, with the key level at 0.02970 (38.2%) just below.
Entry: 15m candle close below 0.02960 (breaks the support line and the 0.02970 level), or a rejection at 0.03040-0.03060 (50% level)
Stop loss: 0.03130 (above the 61.8% level and the falling trendline)
TP1: 0.02900 (LL area) TP2: 0.02800 TP3: 0.02720 (0% level / HL, only if 0.02800 breaks with volume)
Notes:
Bias is bearish: lower high and lower low after the sharp drop from the HH, with price below the 50% level. But the triangle is unbroken, so wait for a confirmed close below support instead of shorting inside it. Skip the short if a 15m candle closes above 0.03130; that flips the structure. The 15m timeframe is noisy, and the volume spike was a one-off. Risk 1% or less and keep leverage low (3-5x).
Not financial advice.
@Binance Square Official #FedMinutesFocusOnOctoberPause #BinanceLaunchesBinanceIntelligence #EvernorthDelaysNasdaqDebutToOct12 #Binance #ChartSniper
Price is ~0.03021 on the 15m chart, squeezing inside a triangle between the falling resistance line (LH at ~0.0316) and the rising support line, with the key level at 0.02970 (38.2%) just below.
Entry: 15m candle close below 0.02960 (breaks the support line and the 0.02970 level), or a rejection at 0.03040-0.03060 (50% level)
Stop loss: 0.03130 (above the 61.8% level and the falling trendline)
TP1: 0.02900 (LL area) TP2: 0.02800 TP3: 0.02720 (0% level / HL, only if 0.02800 breaks with volume)
Notes:
Bias is bearish: lower high and lower low after the sharp drop from the HH, with price below the 50% level. But the triangle is unbroken, so wait for a confirmed close below support instead of shorting inside it. Skip the short if a 15m candle closes above 0.03130; that flips the structure. The 15m timeframe is noisy, and the volume spike was a one-off. Risk 1% or less and keep leverage low (3-5x).
Not financial advice.
@Binance Square Official #FedMinutesFocusOnOctoberPause #BinanceLaunchesBinanceIntelligence #EvernorthDelaysNasdaqDebutToOct12 #Binance #ChartSniper
67
·
--
Bullisch
$RENDER USDT Long (Kanal-Ausbruch)
Der Preis liegt im 15-Minuten-Chart bei etwa 2.039 und bewegt sich innerhalb eines steigenden Kanals mit höheren Tiefs, ausgehend vom HL nahe 1.97. Der wichtige Widerstand liegt bei 2.064, die bullische Zielzone bei 2.09–2.13.
Einstieg: 2.030–2.040 bei einem Abprall an der Kanalunterstützung (bullische 15-Minuten-Kerze) oder als sichererer Einstieg nach einem 15-Minuten-Schlusskurs über 2.064.
Stop-Loss: 2.005 (unter dem 61,8-%-Niveau bei etwa 2.025 und dem Kanaltief).
TP1: 2.064 TP2: 2.095 TP3: 2.125 (0-%-Niveau / obere Kanalbegrenzung)
Hinweise:
Die Struktur hat sich aufgehellt (HL, danach höhere Tiefs innerhalb des Kanals), aber der Preis liegt weiterhin unter dem LH und dem Widerstand bei 2.064. Ein bestätigter Schlusskurs über 2.064 ist daher das stärkere Signal. Das Volumen ist bei diesem Abprall gering, also erhöhe die Positionsgröße erst, wenn ein Ausbruch von Volumen begleitet wird. Lass den Trade aus, falls eine 15-Minuten-Kerze unter 2.005 schließt; dadurch wäre der Kanal gebrochen. Der 15-Minuten-Zeitrahmen ist schnell und unruhig. Riskiere höchstens 1 % und halte den Hebel niedrig (3–5x).
Keine Finanzberatung.
@Binance_Square_Official #FedMinutesFocusOnOctoberPause #BinanceLaunchesBinanceIntelligence #EvernorthDelaysNasdaqDebutToOct12 #Binance #ChartSniper
{future}(RENDERUSDT)
$RENDER USDT Long (Kanal-Ausbruch)
Der Preis liegt im 15-Minuten-Chart bei etwa 2.039 und bewegt sich innerhalb eines steigenden Kanals mit höheren Tiefs, ausgehend vom HL nahe 1.97. Der wichtige Widerstand liegt bei 2.064, die bullische Zielzone bei 2.09–2.13.
Einstieg: 2.030–2.040 bei einem Abprall an der Kanalunterstützung (bullische 15-Minuten-Kerze) oder als sichererer Einstieg nach einem 15-Minuten-Schlusskurs über 2.064.
Stop-Loss: 2.005 (unter dem 61,8-%-Niveau bei etwa 2.025 und dem Kanaltief).
TP1: 2.064 TP2: 2.095 TP3: 2.125 (0-%-Niveau / obere Kanalbegrenzung)
Hinweise:
Die Struktur hat sich aufgehellt (HL, danach höhere Tiefs innerhalb des Kanals), aber der Preis liegt weiterhin unter dem LH und dem Widerstand bei 2.064. Ein bestätigter Schlusskurs über 2.064 ist daher das stärkere Signal. Das Volumen ist bei diesem Abprall gering, also erhöhe die Positionsgröße erst, wenn ein Ausbruch von Volumen begleitet wird. Lass den Trade aus, falls eine 15-Minuten-Kerze unter 2.005 schließt; dadurch wäre der Kanal gebrochen. Der 15-Minuten-Zeitrahmen ist schnell und unruhig. Riskiere höchstens 1 % und halte den Hebel niedrig (3–5x).
Keine Finanzberatung.
@Binance Square Official #FedMinutesFocusOnOctoberPause #BinanceLaunchesBinanceIntelligence #EvernorthDelaysNasdaqDebutToOct12 #Binance #ChartSniper
Der Preis liegt im 15-Minuten-Chart bei etwa 2.039 und bewegt sich innerhalb eines steigenden Kanals mit höheren Tiefs, ausgehend vom HL nahe 1.97. Der wichtige Widerstand liegt bei 2.064, die bullische Zielzone bei 2.09–2.13.
Einstieg: 2.030–2.040 bei einem Abprall an der Kanalunterstützung (bullische 15-Minuten-Kerze) oder als sichererer Einstieg nach einem 15-Minuten-Schlusskurs über 2.064.
Stop-Loss: 2.005 (unter dem 61,8-%-Niveau bei etwa 2.025 und dem Kanaltief).
TP1: 2.064 TP2: 2.095 TP3: 2.125 (0-%-Niveau / obere Kanalbegrenzung)
Hinweise:
Die Struktur hat sich aufgehellt (HL, danach höhere Tiefs innerhalb des Kanals), aber der Preis liegt weiterhin unter dem LH und dem Widerstand bei 2.064. Ein bestätigter Schlusskurs über 2.064 ist daher das stärkere Signal. Das Volumen ist bei diesem Abprall gering, also erhöhe die Positionsgröße erst, wenn ein Ausbruch von Volumen begleitet wird. Lass den Trade aus, falls eine 15-Minuten-Kerze unter 2.005 schließt; dadurch wäre der Kanal gebrochen. Der 15-Minuten-Zeitrahmen ist schnell und unruhig. Riskiere höchstens 1 % und halte den Hebel niedrig (3–5x).
Keine Finanzberatung.
@Binance Square Official #FedMinutesFocusOnOctoberPause #BinanceLaunchesBinanceIntelligence #EvernorthDelaysNasdaqDebutToOct12 #Binance #ChartSniper
64
·
--
Bullisch
$NEAR USDT Long-Position (Ausbruch und Retest)
Der Kurs liegt bei ~5.370 und durchbricht die Widerstandszone (5.328–5.41), nachdem er von der steigenden Trendlinie und dem höheren Tief (HL) nahe 4.90 abgeprallt ist. Dein eingezeichneter Kursverlauf zeigt einen Retest von 5.328 vor der Fortsetzung.
Einstieg: 5.33–5.36 bei einem Retest des durchbrochenen Niveaus von 5.328, das hält (bullische 1h-Kerze), oder ein sichererer Einstieg nach einem 1h-Schlusskurs über 5.41.
Stop-Loss: 5.18 (unter dem Retest und der steigenden Trendlinie)
TP1: 5.60 TP2: 5.80 TP3: 6.00 (nur, wenn 5.80 mit Volumen durchbrochen wird)
Hinweise:
Die Struktur ist bullisch: höhere Tiefs entlang der Trendlinie, ein neues höheres Hoch (HH) und zunehmendes Volumen bei der Ausbruchskerze. Die aktuelle Kerze ist bereits weit gelaufen – also nicht hinterherjagen. Warte auf den Retest oder einen bestätigten Schlusskurs über 5.41. Lass den Trade aus, wenn eine 1h-Kerze wieder unter 5.28 schließt; dann wäre der Ausbruch ein Fehlausbruch. Riskiere 1–2 % deines Kontos und verwende bei diesem Perpetual-Kontrakt einen niedrigen Hebel (3–5x).
Keine Finanzberatung.
@Binance_Square_Official #FedMinutesFocusOnOctoberPause #BinanceLaunchesBinanceIntelligence #EvernorthDelaysNasdaqDebutToOct12 #Binance #ChartSniper
{future}(NEARUSDT)
$NEAR USDT Long-Position (Ausbruch und Retest)
Der Kurs liegt bei ~5.370 und durchbricht die Widerstandszone (5.328–5.41), nachdem er von der steigenden Trendlinie und dem höheren Tief (HL) nahe 4.90 abgeprallt ist. Dein eingezeichneter Kursverlauf zeigt einen Retest von 5.328 vor der Fortsetzung.
Einstieg: 5.33–5.36 bei einem Retest des durchbrochenen Niveaus von 5.328, das hält (bullische 1h-Kerze), oder ein sichererer Einstieg nach einem 1h-Schlusskurs über 5.41.
Stop-Loss: 5.18 (unter dem Retest und der steigenden Trendlinie)
TP1: 5.60 TP2: 5.80 TP3: 6.00 (nur, wenn 5.80 mit Volumen durchbrochen wird)
Hinweise:
Die Struktur ist bullisch: höhere Tiefs entlang der Trendlinie, ein neues höheres Hoch (HH) und zunehmendes Volumen bei der Ausbruchskerze. Die aktuelle Kerze ist bereits weit gelaufen – also nicht hinterherjagen. Warte auf den Retest oder einen bestätigten Schlusskurs über 5.41. Lass den Trade aus, wenn eine 1h-Kerze wieder unter 5.28 schließt; dann wäre der Ausbruch ein Fehlausbruch. Riskiere 1–2 % deines Kontos und verwende bei diesem Perpetual-Kontrakt einen niedrigen Hebel (3–5x).
Keine Finanzberatung.
@Binance Square Official #FedMinutesFocusOnOctoberPause #BinanceLaunchesBinanceIntelligence #EvernorthDelaysNasdaqDebutToOct12 #Binance #ChartSniper
Der Kurs liegt bei ~5.370 und durchbricht die Widerstandszone (5.328–5.41), nachdem er von der steigenden Trendlinie und dem höheren Tief (HL) nahe 4.90 abgeprallt ist. Dein eingezeichneter Kursverlauf zeigt einen Retest von 5.328 vor der Fortsetzung.
Einstieg: 5.33–5.36 bei einem Retest des durchbrochenen Niveaus von 5.328, das hält (bullische 1h-Kerze), oder ein sichererer Einstieg nach einem 1h-Schlusskurs über 5.41.
Stop-Loss: 5.18 (unter dem Retest und der steigenden Trendlinie)
TP1: 5.60 TP2: 5.80 TP3: 6.00 (nur, wenn 5.80 mit Volumen durchbrochen wird)
Hinweise:
Die Struktur ist bullisch: höhere Tiefs entlang der Trendlinie, ein neues höheres Hoch (HH) und zunehmendes Volumen bei der Ausbruchskerze. Die aktuelle Kerze ist bereits weit gelaufen – also nicht hinterherjagen. Warte auf den Retest oder einen bestätigten Schlusskurs über 5.41. Lass den Trade aus, wenn eine 1h-Kerze wieder unter 5.28 schließt; dann wäre der Ausbruch ein Fehlausbruch. Riskiere 1–2 % deines Kontos und verwende bei diesem Perpetual-Kontrakt einen niedrigen Hebel (3–5x).
Keine Finanzberatung.
@Binance Square Official #FedMinutesFocusOnOctoberPause #BinanceLaunchesBinanceIntelligence #EvernorthDelaysNasdaqDebutToOct12 #Binance #ChartSniper
8
·
--
Bärisch
$HOME USDT Short (Ablehnung am Doppeltop)
Der Preis liegt im 15-Minuten-Chart bei etwa 0.00564 und testet die Doppeltop-/LH-Zone bei etwa 0.00567-0.00568, nachdem er stark vom HL bei etwa 0.00537 abgeprallt ist. Dies ist ein Spot-Chart, daher kommt kein Hebel zum Einsatz.
Einstieg: 0.00562-0.00567 bei einer Ablehnung (bearishe 15-Minuten-Kerze am Doppeltop) oder ein sichererer Einstieg bei einem 15-Minuten-Schlusskurs unterhalb der steigenden Trendlinie (~0.00555)
Stop-Loss: 0.00574 (über dem Doppeltop) TP1: 0.00555 TP2: 0.00549 (wichtige Unterstützung / weiße Linie)
TP3: 0.00537 (HL / unteres Ende der Handelsspanne)
Hinweise:
Die Struktur besteht aus einem Doppeltop und einem LH unterhalb des vorherigen Rückgangs, was für einen Short spricht. Der Anstieg war jedoch stark und ging mit steigendem Volumen einher. Warte daher auf eine bestätigte Ablehnung, statt blind zu shorten. Lass den Trade aus, wenn eine 15-Minuten-Kerze über 0.00570 schließt; das würde das Doppeltop ungültig machen. Auf dem 15-Minuten-Zeitrahmen sind die Bewegungen schnell und unruhig. Riskiere pro Trade höchstens 1 %.
Keine Finanzberatung.
@Binance_Square_Official #FedMinutesFocusOnOctoberPause #BinanceLaunchesBinanceIntelligence #EvernorthDelaysNasdaqDebutToOct12 #Binance #ChartSniper
{future}(HOMEUSDT)
$HOME USDT Short (Ablehnung am Doppeltop)
Der Preis liegt im 15-Minuten-Chart bei etwa 0.00564 und testet die Doppeltop-/LH-Zone bei etwa 0.00567-0.00568, nachdem er stark vom HL bei etwa 0.00537 abgeprallt ist. Dies ist ein Spot-Chart, daher kommt kein Hebel zum Einsatz.
Einstieg: 0.00562-0.00567 bei einer Ablehnung (bearishe 15-Minuten-Kerze am Doppeltop) oder ein sichererer Einstieg bei einem 15-Minuten-Schlusskurs unterhalb der steigenden Trendlinie (~0.00555)
Stop-Loss: 0.00574 (über dem Doppeltop) TP1: 0.00555 TP2: 0.00549 (wichtige Unterstützung / weiße Linie)
TP3: 0.00537 (HL / unteres Ende der Handelsspanne)
Hinweise:
Die Struktur besteht aus einem Doppeltop und einem LH unterhalb des vorherigen Rückgangs, was für einen Short spricht. Der Anstieg war jedoch stark und ging mit steigendem Volumen einher. Warte daher auf eine bestätigte Ablehnung, statt blind zu shorten. Lass den Trade aus, wenn eine 15-Minuten-Kerze über 0.00570 schließt; das würde das Doppeltop ungültig machen. Auf dem 15-Minuten-Zeitrahmen sind die Bewegungen schnell und unruhig. Riskiere pro Trade höchstens 1 %.
Keine Finanzberatung.
@Binance Square Official #FedMinutesFocusOnOctoberPause #BinanceLaunchesBinanceIntelligence #EvernorthDelaysNasdaqDebutToOct12 #Binance #ChartSniper
Der Preis liegt im 15-Minuten-Chart bei etwa 0.00564 und testet die Doppeltop-/LH-Zone bei etwa 0.00567-0.00568, nachdem er stark vom HL bei etwa 0.00537 abgeprallt ist. Dies ist ein Spot-Chart, daher kommt kein Hebel zum Einsatz.
Einstieg: 0.00562-0.00567 bei einer Ablehnung (bearishe 15-Minuten-Kerze am Doppeltop) oder ein sichererer Einstieg bei einem 15-Minuten-Schlusskurs unterhalb der steigenden Trendlinie (~0.00555)
Stop-Loss: 0.00574 (über dem Doppeltop) TP1: 0.00555 TP2: 0.00549 (wichtige Unterstützung / weiße Linie)
TP3: 0.00537 (HL / unteres Ende der Handelsspanne)
Hinweise:
Die Struktur besteht aus einem Doppeltop und einem LH unterhalb des vorherigen Rückgangs, was für einen Short spricht. Der Anstieg war jedoch stark und ging mit steigendem Volumen einher. Warte daher auf eine bestätigte Ablehnung, statt blind zu shorten. Lass den Trade aus, wenn eine 15-Minuten-Kerze über 0.00570 schließt; das würde das Doppeltop ungültig machen. Auf dem 15-Minuten-Zeitrahmen sind die Bewegungen schnell und unruhig. Riskiere pro Trade höchstens 1 %.
Keine Finanzberatung.
@Binance Square Official #FedMinutesFocusOnOctoberPause #BinanceLaunchesBinanceIntelligence #EvernorthDelaysNasdaqDebutToOct12 #Binance #ChartSniper
388
·
--
Bullisch
$TREE USDT Long (Fortsetzung nach Ausbruch)
Der Preis liegt bei etwa 0.0470 und stößt nach der Rückeroberung des Niveaus bei 0.0459 auf den Widerstand der LH-/oberen Trendlinie bei etwa 0.0471. Beachte, dass dies ein Spot-Chart (TREE/USDT) ist, daher kommt kein Hebel zum Einsatz.
Einstieg: 0.0459–0.0465 bei einem Rücksetzer und erneutem Test des Niveaus bei 0.0459 oder als sichererer Einstieg nach einem 1‑Std.-Schlusskurs über 0.0472
Stop-Loss: 0.0450 (unter dem 50-%-Niveau bei etwa 0.0455 und der steigenden Trendlinie)
TP1: 0.0480 TP2: 0.0485 (Widerstand am oberen Kanalrand) TP3: 0.0495–0.0500 (nur, wenn 0.0485 mit Volumen durchbrochen wird)
Hinweise:
Die Struktur bildet einen steigenden Kanal mit höheren Tiefs, und das Volumen nimmt beim Anstieg zu, was die Long-Position unterstützt. Der Preis liegt derzeit an einem Widerstand, also nicht hinterherjagen. Eine Zurückweisung an dieser Stelle dürfte zu einem erneuten Test von 0.0459 führen. Lass den Trade aus, wenn eine 1‑Std.-Kerze unter 0.0450 schließt; dadurch wäre die Kanalunterstützung gebrochen. Riskiere 1–2 % deines Kontos.
Keine Finanzberatung.
@Binance_Square_Official #FedMinutesFocusOnOctoberPause #BinanceLaunchesBinanceIntelligence #EvernorthDelaysNasdaqDebutToOct12 #Binance #ChartSniper
{future}(TREEUSDT)
$TREE USDT Long (Fortsetzung nach Ausbruch)
Der Preis liegt bei etwa 0.0470 und stößt nach der Rückeroberung des Niveaus bei 0.0459 auf den Widerstand der LH-/oberen Trendlinie bei etwa 0.0471. Beachte, dass dies ein Spot-Chart (TREE/USDT) ist, daher kommt kein Hebel zum Einsatz.
Einstieg: 0.0459–0.0465 bei einem Rücksetzer und erneutem Test des Niveaus bei 0.0459 oder als sichererer Einstieg nach einem 1‑Std.-Schlusskurs über 0.0472
Stop-Loss: 0.0450 (unter dem 50-%-Niveau bei etwa 0.0455 und der steigenden Trendlinie)
TP1: 0.0480 TP2: 0.0485 (Widerstand am oberen Kanalrand) TP3: 0.0495–0.0500 (nur, wenn 0.0485 mit Volumen durchbrochen wird)
Hinweise:
Die Struktur bildet einen steigenden Kanal mit höheren Tiefs, und das Volumen nimmt beim Anstieg zu, was die Long-Position unterstützt. Der Preis liegt derzeit an einem Widerstand, also nicht hinterherjagen. Eine Zurückweisung an dieser Stelle dürfte zu einem erneuten Test von 0.0459 führen. Lass den Trade aus, wenn eine 1‑Std.-Kerze unter 0.0450 schließt; dadurch wäre die Kanalunterstützung gebrochen. Riskiere 1–2 % deines Kontos.
Keine Finanzberatung.
@Binance Square Official #FedMinutesFocusOnOctoberPause #BinanceLaunchesBinanceIntelligence #EvernorthDelaysNasdaqDebutToOct12 #Binance #ChartSniper
Der Preis liegt bei etwa 0.0470 und stößt nach der Rückeroberung des Niveaus bei 0.0459 auf den Widerstand der LH-/oberen Trendlinie bei etwa 0.0471. Beachte, dass dies ein Spot-Chart (TREE/USDT) ist, daher kommt kein Hebel zum Einsatz.
Einstieg: 0.0459–0.0465 bei einem Rücksetzer und erneutem Test des Niveaus bei 0.0459 oder als sichererer Einstieg nach einem 1‑Std.-Schlusskurs über 0.0472
Stop-Loss: 0.0450 (unter dem 50-%-Niveau bei etwa 0.0455 und der steigenden Trendlinie)
TP1: 0.0480 TP2: 0.0485 (Widerstand am oberen Kanalrand) TP3: 0.0495–0.0500 (nur, wenn 0.0485 mit Volumen durchbrochen wird)
Hinweise:
Die Struktur bildet einen steigenden Kanal mit höheren Tiefs, und das Volumen nimmt beim Anstieg zu, was die Long-Position unterstützt. Der Preis liegt derzeit an einem Widerstand, also nicht hinterherjagen. Eine Zurückweisung an dieser Stelle dürfte zu einem erneuten Test von 0.0459 führen. Lass den Trade aus, wenn eine 1‑Std.-Kerze unter 0.0450 schließt; dadurch wäre die Kanalunterstützung gebrochen. Riskiere 1–2 % deines Kontos.
Keine Finanzberatung.
@Binance Square Official #FedMinutesFocusOnOctoberPause #BinanceLaunchesBinanceIntelligence #EvernorthDelaysNasdaqDebutToOct12 #Binance #ChartSniper
162
·
--
Bärisch
Übersetzung ansehen
$MOVR USDT Short (triangle breakdown)
Price is ~1.854, coiling inside a symmetrical triangle between the descending resistance line (LH at ~2.40) and the rising support line (HL at ~1.66).
Entry: 1h candle close below the rising trendline, around 1.80, or a rejection near 1.95-2.00 (50% level / falling trendline)
Stop loss: 2.05 (above the trendline and 61.8% level at ~2.10)
TP1: 1.70 TP2: 1.66 (HL / 0% level)
TP3: 1.55 (only if 1.66 breaks with volume)
Notes:
Bias is bearish: lower high, price below the 38.2% level, and RSI under 50. But the triangle isn't broken yet, so wait for a confirmed close below support rather than shorting inside it. Skip the short if a 1h candle closes above 2.10; that flips the structure bullish. Triangles can fake out both ways. Risk 1-2% and keep leverage low.
Not financial advice.
@Binance_Square_Official #FedMinutesFocusOnOctoberPause #BinanceLaunchesBinanceIntelligence #EvernorthDelaysNasdaqDebutToOct12 #Binance #ChartSniper
{future}(MOVRUSDT)
$MOVR USDT Short (triangle breakdown)
Price is ~1.854, coiling inside a symmetrical triangle between the descending resistance line (LH at ~2.40) and the rising support line (HL at ~1.66).
Entry: 1h candle close below the rising trendline, around 1.80, or a rejection near 1.95-2.00 (50% level / falling trendline)
Stop loss: 2.05 (above the trendline and 61.8% level at ~2.10)
TP1: 1.70 TP2: 1.66 (HL / 0% level)
TP3: 1.55 (only if 1.66 breaks with volume)
Notes:
Bias is bearish: lower high, price below the 38.2% level, and RSI under 50. But the triangle isn't broken yet, so wait for a confirmed close below support rather than shorting inside it. Skip the short if a 1h candle closes above 2.10; that flips the structure bullish. Triangles can fake out both ways. Risk 1-2% and keep leverage low.
Not financial advice.
@Binance Square Official #FedMinutesFocusOnOctoberPause #BinanceLaunchesBinanceIntelligence #EvernorthDelaysNasdaqDebutToOct12 #Binance #ChartSniper
Price is ~1.854, coiling inside a symmetrical triangle between the descending resistance line (LH at ~2.40) and the rising support line (HL at ~1.66).
Entry: 1h candle close below the rising trendline, around 1.80, or a rejection near 1.95-2.00 (50% level / falling trendline)
Stop loss: 2.05 (above the trendline and 61.8% level at ~2.10)
TP1: 1.70 TP2: 1.66 (HL / 0% level)
TP3: 1.55 (only if 1.66 breaks with volume)
Notes:
Bias is bearish: lower high, price below the 38.2% level, and RSI under 50. But the triangle isn't broken yet, so wait for a confirmed close below support rather than shorting inside it. Skip the short if a 1h candle closes above 2.10; that flips the structure bullish. Triangles can fake out both ways. Risk 1-2% and keep leverage low.
Not financial advice.
@Binance Square Official #FedMinutesFocusOnOctoberPause #BinanceLaunchesBinanceIntelligence #EvernorthDelaysNasdaqDebutToOct12 #Binance #ChartSniper
429
·
--
Bullisch
$SAND USDT Long (Pullback-Einstieg)
Der Preis liegt nach einem starken Ausbruch bei etwa 0.0798 und zieht sich nun vom Hoch bei 0.0875 in Richtung der Fib-Zone zurück.
Einstieg: 0.0780–0.0795 (aktueller Bereich) oder ein besserer Einstieg bei 0.0765 (50%-Niveau) nach einem bullischen 1h-Schlusskurs
Stop-Loss: 0.0735 (unter dem 61.8%-Niveau bei etwa 0.0744)
TP1: 0.0840
TP2: 0.0875 (jüngstes Hoch / Widerstand an der Trendlinie)
TP3: 0.0920 (nur, wenn 0.0875 mit Volumen durchbrochen wird)
Hinweise:
Die Struktur ist bullisch (HL, gefolgt von einem Ausbruch über die Abwärtstrendlinie), aber der Kurs hat die obere Trendlinie erreicht und wird dort zurückgewiesen – also nicht hinterherjagen. Lass den Trade aus, wenn eine 1h-Kerze unter 0.0744 schließt. Der RSI bei etwa 65 ist stark, aber nicht überkauft. Riskiere 1–2 % und halte den Hebel niedrig.
Keine Finanzberatung.
@Binance_Square_Official #FedMinutesFocusOnOctoberPause #BinanceLaunchesBinanceIntelligence #EvernorthDelaysNasdaqDebutToOct12 #Binance #ChartSniper
{future}(SANDUSDT)
$SAND USDT Long (Pullback-Einstieg)
Der Preis liegt nach einem starken Ausbruch bei etwa 0.0798 und zieht sich nun vom Hoch bei 0.0875 in Richtung der Fib-Zone zurück.
Einstieg: 0.0780–0.0795 (aktueller Bereich) oder ein besserer Einstieg bei 0.0765 (50%-Niveau) nach einem bullischen 1h-Schlusskurs
Stop-Loss: 0.0735 (unter dem 61.8%-Niveau bei etwa 0.0744)
TP1: 0.0840
TP2: 0.0875 (jüngstes Hoch / Widerstand an der Trendlinie)
TP3: 0.0920 (nur, wenn 0.0875 mit Volumen durchbrochen wird)
Hinweise:
Die Struktur ist bullisch (HL, gefolgt von einem Ausbruch über die Abwärtstrendlinie), aber der Kurs hat die obere Trendlinie erreicht und wird dort zurückgewiesen – also nicht hinterherjagen. Lass den Trade aus, wenn eine 1h-Kerze unter 0.0744 schließt. Der RSI bei etwa 65 ist stark, aber nicht überkauft. Riskiere 1–2 % und halte den Hebel niedrig.
Keine Finanzberatung.
@Binance Square Official #FedMinutesFocusOnOctoberPause #BinanceLaunchesBinanceIntelligence #EvernorthDelaysNasdaqDebutToOct12 #Binance #ChartSniper
Der Preis liegt nach einem starken Ausbruch bei etwa 0.0798 und zieht sich nun vom Hoch bei 0.0875 in Richtung der Fib-Zone zurück.
Einstieg: 0.0780–0.0795 (aktueller Bereich) oder ein besserer Einstieg bei 0.0765 (50%-Niveau) nach einem bullischen 1h-Schlusskurs
Stop-Loss: 0.0735 (unter dem 61.8%-Niveau bei etwa 0.0744)
TP1: 0.0840
TP2: 0.0875 (jüngstes Hoch / Widerstand an der Trendlinie)
TP3: 0.0920 (nur, wenn 0.0875 mit Volumen durchbrochen wird)
Hinweise:
Die Struktur ist bullisch (HL, gefolgt von einem Ausbruch über die Abwärtstrendlinie), aber der Kurs hat die obere Trendlinie erreicht und wird dort zurückgewiesen – also nicht hinterherjagen. Lass den Trade aus, wenn eine 1h-Kerze unter 0.0744 schließt. Der RSI bei etwa 65 ist stark, aber nicht überkauft. Riskiere 1–2 % und halte den Hebel niedrig.
Keine Finanzberatung.
@Binance Square Official #FedMinutesFocusOnOctoberPause #BinanceLaunchesBinanceIntelligence #EvernorthDelaysNasdaqDebutToOct12 #Binance #ChartSniper
166
·
--
Bullisch
Übersetzung ansehen
$PUMP USDT Long (counter-trend bounce)
Entry: 0.00600-0.00610 after a bullish 1h close, or a safer entry on a close above 0.00640
Stop loss: 0.00570 (below the 61.8% level)
TP1: 0.00640
TP2: 0.00681 (range high)
TP3: 0.00720 (only if 0.00681 breaks with volume)
Notes:
Structure is still bearish (LH, LL), so this is a bounce trade, not a trend trade. Skip it if price closes below 0.00597 before you enter. Risk 1-2% of your account and keep leverage low.
Not financial advice.
@Binance_Square_Official #FedMinutesFocusOnOctoberPause #BinanceLaunchesBinanceIntelligence #Bianance #ChartSniper
{future}(PUMPUSDT)
$PUMP USDT Long (counter-trend bounce)
Entry: 0.00600-0.00610 after a bullish 1h close, or a safer entry on a close above 0.00640
Stop loss: 0.00570 (below the 61.8% level)
TP1: 0.00640
TP2: 0.00681 (range high)
TP3: 0.00720 (only if 0.00681 breaks with volume)
Notes:
Structure is still bearish (LH, LL), so this is a bounce trade, not a trend trade. Skip it if price closes below 0.00597 before you enter. Risk 1-2% of your account and keep leverage low.
Not financial advice.
@Binance Square Official #FedMinutesFocusOnOctoberPause #BinanceLaunchesBinanceIntelligence #Bianance #ChartSniper
Entry: 0.00600-0.00610 after a bullish 1h close, or a safer entry on a close above 0.00640
Stop loss: 0.00570 (below the 61.8% level)
TP1: 0.00640
TP2: 0.00681 (range high)
TP3: 0.00720 (only if 0.00681 breaks with volume)
Notes:
Structure is still bearish (LH, LL), so this is a bounce trade, not a trend trade. Skip it if price closes below 0.00597 before you enter. Risk 1-2% of your account and keep leverage low.
Not financial advice.
@Binance Square Official #FedMinutesFocusOnOctoberPause #BinanceLaunchesBinanceIntelligence #Bianance #ChartSniper
252
·
--
📉 $HYPE USDT — SHORT SETUP
HYPE wird in der Nähe von 87,44 US-Dollar gehandelt und zeigt kurzfristigen bärischen Druck. Negatives Funding und Verkaufsaktivität deuten auf ein Abwärtsrisiko hin. Der Kurs liegt nahe dem 87,90er-Mittelpunkt, mit Widerstand bei etwa 90,95–91,10 US-Dollar. <Cite refs={["turn847426search0","turn847426search1"]}/>
🔴 SHORT ENTRY: 87,44 US-Dollar (Market)
🛑 SL: 91,20 US-Dollar
🎯 TP1: 85,00 US-Dollar
🎯 TP2: 82,50 US-Dollar
🎯 TP3: 79,00 US-Dollar
⚠️ Eine anhaltende Bewegung über 91,20 US-Dollar macht dieses Setup ungültig.
Keine finanzielle Beratung. Risiko sorgfältig managen.
@Binance_Square_Official #EtherGains70.9%InQ3 #US10YearYieldNears5.3% #DollarIndexHitsHighestSinceMay2025 #Binance #ChartSniper
{future}(HYPEUSDT)
📉 $HYPE USDT — SHORT SETUP
HYPE wird in der Nähe von 87,44 US-Dollar gehandelt und zeigt kurzfristigen bärischen Druck. Negatives Funding und Verkaufsaktivität deuten auf ein Abwärtsrisiko hin. Der Kurs liegt nahe dem 87,90er-Mittelpunkt, mit Widerstand bei etwa 90,95–91,10 US-Dollar. <Cite refs={["turn847426search0","turn847426search1"]}/>
🔴 SHORT ENTRY: 87,44 US-Dollar (Market)
🛑 SL: 91,20 US-Dollar
🎯 TP1: 85,00 US-Dollar
🎯 TP2: 82,50 US-Dollar
🎯 TP3: 79,00 US-Dollar
⚠️ Eine anhaltende Bewegung über 91,20 US-Dollar macht dieses Setup ungültig.
Keine finanzielle Beratung. Risiko sorgfältig managen.
@Binance Square Official #EtherGains70.9%InQ3 #US10YearYieldNears5.3% #DollarIndexHitsHighestSinceMay2025 #Binance #ChartSniper
HYPE wird in der Nähe von 87,44 US-Dollar gehandelt und zeigt kurzfristigen bärischen Druck. Negatives Funding und Verkaufsaktivität deuten auf ein Abwärtsrisiko hin. Der Kurs liegt nahe dem 87,90er-Mittelpunkt, mit Widerstand bei etwa 90,95–91,10 US-Dollar. <Cite refs={["turn847426search0","turn847426search1"]}/>
🔴 SHORT ENTRY: 87,44 US-Dollar (Market)
🛑 SL: 91,20 US-Dollar
🎯 TP1: 85,00 US-Dollar
🎯 TP2: 82,50 US-Dollar
🎯 TP3: 79,00 US-Dollar
⚠️ Eine anhaltende Bewegung über 91,20 US-Dollar macht dieses Setup ungültig.
Keine finanzielle Beratung. Risiko sorgfältig managen.
@Binance Square Official #EtherGains70.9%InQ3 #US10YearYieldNears5.3% #DollarIndexHitsHighestSinceMay2025 #Binance #ChartSniper
123
·
--
📉 $QNT USDT — KURZES TECHNISCHES SETUP
QNT handelt nahe $292.45, mit einem Anstieg von 2.13% über 24H, bei einer gemeldeten Spanne von $273.72–$329.00. Kurzfristige Erholung ist im Gange, aber technische Indikatoren zeigen in einigen Zeitrahmen Verkaufsdruck. Eine Zurückweisung nahe dem Widerstand kann eine bärische Gelegenheit schaffen. <Cite refs={["turn291781search8","turn291781search7"]}/>
🔴 SHORT-EINSTIEG: $292.45 (Markt)
🛑 SL: $305.00
🎯 TP1: $285.00
🎯 TP2: $274.00
🎯 TP3: $260.00
⚠️ Ungültig, wenn der Preis oberhalb von $305 stabil bleibt.
Keine Finanzberatung. Risiko sorgfältig managen.
@Binance_Square_Official #EtherGains70.9%InQ3 #US10YearYieldNears5.3% #DollarIndexHitsHighestSinceMay2025 #Binance #ChartSniper
{future}(QNTUSDT)
📉 $QNT USDT — KURZES TECHNISCHES SETUP
QNT handelt nahe $292.45, mit einem Anstieg von 2.13% über 24H, bei einer gemeldeten Spanne von $273.72–$329.00. Kurzfristige Erholung ist im Gange, aber technische Indikatoren zeigen in einigen Zeitrahmen Verkaufsdruck. Eine Zurückweisung nahe dem Widerstand kann eine bärische Gelegenheit schaffen. <Cite refs={["turn291781search8","turn291781search7"]}/>
🔴 SHORT-EINSTIEG: $292.45 (Markt)
🛑 SL: $305.00
🎯 TP1: $285.00
🎯 TP2: $274.00
🎯 TP3: $260.00
⚠️ Ungültig, wenn der Preis oberhalb von $305 stabil bleibt.
Keine Finanzberatung. Risiko sorgfältig managen.
@Binance Square Official #EtherGains70.9%InQ3 #US10YearYieldNears5.3% #DollarIndexHitsHighestSinceMay2025 #Binance #ChartSniper
QNT handelt nahe $292.45, mit einem Anstieg von 2.13% über 24H, bei einer gemeldeten Spanne von $273.72–$329.00. Kurzfristige Erholung ist im Gange, aber technische Indikatoren zeigen in einigen Zeitrahmen Verkaufsdruck. Eine Zurückweisung nahe dem Widerstand kann eine bärische Gelegenheit schaffen. <Cite refs={["turn291781search8","turn291781search7"]}/>
🔴 SHORT-EINSTIEG: $292.45 (Markt)
🛑 SL: $305.00
🎯 TP1: $285.00
🎯 TP2: $274.00
🎯 TP3: $260.00
⚠️ Ungültig, wenn der Preis oberhalb von $305 stabil bleibt.
Keine Finanzberatung. Risiko sorgfältig managen.
@Binance Square Official #EtherGains70.9%InQ3 #US10YearYieldNears5.3% #DollarIndexHitsHighestSinceMay2025 #Binance #ChartSniper
786
·
--
$ZEC USDT — KURZE TECHNISCHE ANALYSE
ZEC handelt nahe $1,335.47 im 1H-Chart. Der Kurs hat die $1,356-Unterstützung nach unten durchbrochen und fungiert nun als Widerstand. Die bärische Dynamik bleibt bestehen, während der RSI sich dem überverkauften Bereich nähert, sodass ein Erholungs-„Bounce“ möglich ist.
🔴 SHORT-EINSTIEG: $1,335.47 (Market)
🛑 SL: $1,365
🎯 TP1: $1,320
🎯 TP2: $1,300
🎯 TP3: $1,219
⚠️ Eine Rückkehr über $1,356 könnte das bärische Setup schwächen.
Keine finanzielle Beratung. Risiko sorgfältig managen.
@Binance_Square_Official #EtherGains70.9%InQ3 #US10YearYieldNears5.3% #DollarIndexHitsHighestSinceMay2025 #DollarIndexHitsHighestSinceMay2025 #USWeeklyJoblessClaimsFallTo197000
{future}(ZECUSDT)
$ZEC USDT — KURZE TECHNISCHE ANALYSE
ZEC handelt nahe $1,335.47 im 1H-Chart. Der Kurs hat die $1,356-Unterstützung nach unten durchbrochen und fungiert nun als Widerstand. Die bärische Dynamik bleibt bestehen, während der RSI sich dem überverkauften Bereich nähert, sodass ein Erholungs-„Bounce“ möglich ist.
🔴 SHORT-EINSTIEG: $1,335.47 (Market)
🛑 SL: $1,365
🎯 TP1: $1,320
🎯 TP2: $1,300
🎯 TP3: $1,219
⚠️ Eine Rückkehr über $1,356 könnte das bärische Setup schwächen.
Keine finanzielle Beratung. Risiko sorgfältig managen.
@Binance Square Official #EtherGains70.9%InQ3 #US10YearYieldNears5.3% #DollarIndexHitsHighestSinceMay2025 #DollarIndexHitsHighestSinceMay2025 #USWeeklyJoblessClaimsFallTo197000
ZEC handelt nahe $1,335.47 im 1H-Chart. Der Kurs hat die $1,356-Unterstützung nach unten durchbrochen und fungiert nun als Widerstand. Die bärische Dynamik bleibt bestehen, während der RSI sich dem überverkauften Bereich nähert, sodass ein Erholungs-„Bounce“ möglich ist.
🔴 SHORT-EINSTIEG: $1,335.47 (Market)
🛑 SL: $1,365
🎯 TP1: $1,320
🎯 TP2: $1,300
🎯 TP3: $1,219
⚠️ Eine Rückkehr über $1,356 könnte das bärische Setup schwächen.
Keine finanzielle Beratung. Risiko sorgfältig managen.
@Binance Square Official #EtherGains70.9%InQ3 #US10YearYieldNears5.3% #DollarIndexHitsHighestSinceMay2025 #DollarIndexHitsHighestSinceMay2025 #USWeeklyJoblessClaimsFallTo197000
605
·
--
Bullisch
Titel: $CC Double Bottom Bounce 📈
$CC/USDT (Perp) – Bullisches Reversal-Setup
Einstieg: 0.1250–0.1256 (61,8%–50%-Zone)
TP: 0.1273 / 0.1290
SL: 0.1230
⚠️ Keine Finanzberatung. DYOR.
Notizen zu den Levels (aus deinem Chart):
Es bildete sich ein doppelter Boden nahe dem LL (0.123), gefolgt von einem scharfen Move zu einem frischen HH (0.129). Der Kurs retraced nun in die 50%–61,8% Fib-Zone (0.1250–0.1256).
Einstieg: 0.1250–0.1256, wo die Fib-Unterstützung mit dem Retest der Double-Bottom-Halslinie zusammenfällt — eine gängige Bounce-Zone. TP1 (0.1273): das 38,2% Fib / vorheriger Konsolidierungswiderstand.
TP2 (0.1290): das HH-Swinghigh — vollständiges Kursziel, wenn der Momentum wieder einsetzt. SL (0.1230): unterhalb der 100%-Fib / LL — ein Close darunter macht die Double-Bottom-Struktur ungültig.
RSI liegt nahe 49–50 und zeigt neutrales Momentum. Warte daher auf eine bullische Reaktionskerze in der Zone, statt beim Abdriften nach unten einzusteigen.
@Binance_Square_Official #BitcoinClears$85200 #AltcoinSeasonIndexHoldsAbove60For5Days #USADPAdds90000JobsInSeptember #Binance #ChartSniper
{future}(CCUSDT)
Titel: $CC Double Bottom Bounce 📈
$CC /USDT (Perp) – Bullisches Reversal-Setup
Einstieg: 0.1250–0.1256 (61,8%–50%-Zone)
TP: 0.1273 / 0.1290
SL: 0.1230
⚠️ Keine Finanzberatung. DYOR.
Notizen zu den Levels (aus deinem Chart):
Es bildete sich ein doppelter Boden nahe dem LL (0.123), gefolgt von einem scharfen Move zu einem frischen HH (0.129). Der Kurs retraced nun in die 50%–61,8% Fib-Zone (0.1250–0.1256).
Einstieg: 0.1250–0.1256, wo die Fib-Unterstützung mit dem Retest der Double-Bottom-Halslinie zusammenfällt — eine gängige Bounce-Zone. TP1 (0.1273): das 38,2% Fib / vorheriger Konsolidierungswiderstand.
TP2 (0.1290): das HH-Swinghigh — vollständiges Kursziel, wenn der Momentum wieder einsetzt. SL (0.1230): unterhalb der 100%-Fib / LL — ein Close darunter macht die Double-Bottom-Struktur ungültig.
RSI liegt nahe 49–50 und zeigt neutrales Momentum. Warte daher auf eine bullische Reaktionskerze in der Zone, statt beim Abdriften nach unten einzusteigen.
@Binance Square Official #BitcoinClears$85200 #AltcoinSeasonIndexHoldsAbove60For5Days #USADPAdds90000JobsInSeptember #Binance #ChartSniper
$CC /USDT (Perp) – Bullisches Reversal-Setup
Einstieg: 0.1250–0.1256 (61,8%–50%-Zone)
TP: 0.1273 / 0.1290
SL: 0.1230
⚠️ Keine Finanzberatung. DYOR.
Notizen zu den Levels (aus deinem Chart):
Es bildete sich ein doppelter Boden nahe dem LL (0.123), gefolgt von einem scharfen Move zu einem frischen HH (0.129). Der Kurs retraced nun in die 50%–61,8% Fib-Zone (0.1250–0.1256).
Einstieg: 0.1250–0.1256, wo die Fib-Unterstützung mit dem Retest der Double-Bottom-Halslinie zusammenfällt — eine gängige Bounce-Zone. TP1 (0.1273): das 38,2% Fib / vorheriger Konsolidierungswiderstand.
TP2 (0.1290): das HH-Swinghigh — vollständiges Kursziel, wenn der Momentum wieder einsetzt. SL (0.1230): unterhalb der 100%-Fib / LL — ein Close darunter macht die Double-Bottom-Struktur ungültig.
RSI liegt nahe 49–50 und zeigt neutrales Momentum. Warte daher auf eine bullische Reaktionskerze in der Zone, statt beim Abdriften nach unten einzusteigen.
@Binance Square Official #BitcoinClears$85200 #AltcoinSeasonIndexHoldsAbove60For5Days #USADPAdds90000JobsInSeptember #Binance #ChartSniper
249
·
--
Bullisch
Titel: $KITE Rising Channel Play 📊
KITE/USDT (Perp) – Bullischer Kanal
Einstieg: 0.1385–0.1390 (Fib-Support)
TP: 0.1414 / 0.1470
SL: 0.1330
⚠️ Keine finanzielle Beratung. DYOR.
Hinweise zu den Levels (aus deinem Chart):
Der Preis ist aus dem Kanal ausgebrochen und zwar vom HL (0.133) aus, hat dann ein LH-Hoch bei 0.147 gebildet und zieht sich jetzt durch den steigenden Kanal zurück Richtung der 50%- bis 61.8%-Fib-Zone (0.1385–0.1390).
Einstieg: die Zone 0.1385–0.1390, in der Trendlinie der Kanalmitte und der Fib-Support zusammenfallen — ein typischer Bereich, in den Käufer wieder einsteigen.
TP1 (0.1414): das 38.2%-Fib / jüngster Konsolidierungs-Widerstand.
TP2 (0.1470): das LH-Swing-High — vollständiges Retracement-Ziel, falls der Momentum wieder einsetzt.
SL (0.1330): unterhalb der unteren Trendlinie des Kanals und des HL — ein Schlusskurs darunter macht die bullische Struktur ungültig.
RSI ist nach dem vorherigen Push auf 41–49 abgekühlt. Daher warte, bis der Preis die Zone hält und eine Umkehrkerze zeigt, bevor du einsteigst — statt das fallende Messer zu fangen.
@Binance_Square_Official #BitcoinClears$85200 #AltcoinSeasonIndexHoldsAbove60For5Days #USADPAdds90000JobsInSeptember #BINANCE #ChartSniper
{future}(KITEUSDT)
Titel: $KITE Rising Channel Play 📊
KITE/USDT (Perp) – Bullischer Kanal
Einstieg: 0.1385–0.1390 (Fib-Support)
TP: 0.1414 / 0.1470
SL: 0.1330
⚠️ Keine finanzielle Beratung. DYOR.
Hinweise zu den Levels (aus deinem Chart):
Der Preis ist aus dem Kanal ausgebrochen und zwar vom HL (0.133) aus, hat dann ein LH-Hoch bei 0.147 gebildet und zieht sich jetzt durch den steigenden Kanal zurück Richtung der 50%- bis 61.8%-Fib-Zone (0.1385–0.1390).
Einstieg: die Zone 0.1385–0.1390, in der Trendlinie der Kanalmitte und der Fib-Support zusammenfallen — ein typischer Bereich, in den Käufer wieder einsteigen.
TP1 (0.1414): das 38.2%-Fib / jüngster Konsolidierungs-Widerstand.
TP2 (0.1470): das LH-Swing-High — vollständiges Retracement-Ziel, falls der Momentum wieder einsetzt.
SL (0.1330): unterhalb der unteren Trendlinie des Kanals und des HL — ein Schlusskurs darunter macht die bullische Struktur ungültig.
RSI ist nach dem vorherigen Push auf 41–49 abgekühlt. Daher warte, bis der Preis die Zone hält und eine Umkehrkerze zeigt, bevor du einsteigst — statt das fallende Messer zu fangen.
@Binance Square Official #BitcoinClears$85200 #AltcoinSeasonIndexHoldsAbove60For5Days #USADPAdds90000JobsInSeptember #BINANCE #ChartSniper
KITE/USDT (Perp) – Bullischer Kanal
Einstieg: 0.1385–0.1390 (Fib-Support)
TP: 0.1414 / 0.1470
SL: 0.1330
⚠️ Keine finanzielle Beratung. DYOR.
Hinweise zu den Levels (aus deinem Chart):
Der Preis ist aus dem Kanal ausgebrochen und zwar vom HL (0.133) aus, hat dann ein LH-Hoch bei 0.147 gebildet und zieht sich jetzt durch den steigenden Kanal zurück Richtung der 50%- bis 61.8%-Fib-Zone (0.1385–0.1390).
Einstieg: die Zone 0.1385–0.1390, in der Trendlinie der Kanalmitte und der Fib-Support zusammenfallen — ein typischer Bereich, in den Käufer wieder einsteigen.
TP1 (0.1414): das 38.2%-Fib / jüngster Konsolidierungs-Widerstand.
TP2 (0.1470): das LH-Swing-High — vollständiges Retracement-Ziel, falls der Momentum wieder einsetzt.
SL (0.1330): unterhalb der unteren Trendlinie des Kanals und des HL — ein Schlusskurs darunter macht die bullische Struktur ungültig.
RSI ist nach dem vorherigen Push auf 41–49 abgekühlt. Daher warte, bis der Preis die Zone hält und eine Umkehrkerze zeigt, bevor du einsteigst — statt das fallende Messer zu fangen.
@Binance Square Official #BitcoinClears$85200 #AltcoinSeasonIndexHoldsAbove60For5Days #USADPAdds90000JobsInSeptember #BINANCE #ChartSniper
195
·
--
Bullisch
Titel: $PROM Channel Continuation 🚀
PROM/USDT (Perp) – Bullisher Channel
Einstieg: 6.20–6.30 (Retest)
TP: 6.60 / 7.00
SL: 5.91
⚠️ Keine finanzielle Beratung. MACH DEIN EIGENES RESEARCH (DYOR).
Hinweise zu den Levels (basierend auf deinem Chart):
Der Preis ist aus einem aufsteigenden Channel ab HL (5.45) ausgebrochen, hat so ein frisches HH (~6.62) gebildet und schwebt nun knapp über der 6.20-Marke (38.2% Fib / vorherige Struktur).
Einstieg: Ein Retest der Zone 6.20–6.30 (ehemaliger Widerstand, jetzt Unterstützung) innerhalb des aufsteigenden Channels bietet ein besseres Chance/Risiko-Verhältnis als dem aktuellen Kurs hinterherzulaufen.
TP1 (6.60): das jüngste HH / der Channel-Widerstand. TP2 (7.00): Erweiterung der Channel-Spitze, falls der Ausbruch weitergeht.
SL (5.91): unterhalb der 61.8% Fib und der unteren Begrenzung des Channels — ein Schlusskurs darunter würde die bullische Struktur brechen.
RSI bei 63 zeigt solide, aber nicht extreme Dynamik, also ist noch Raum nach oben — trotzdem: Warte auf den Retest, der hält, bevor du einsteigst, statt die Stärke zu kaufen.
{future}(PROMUSDT)
@Binance_Square_Official #BitcoinClears$85200 #AltcoinSeasonIndexHoldsAbove60For5Days #USADPAdds90000JobsInSeptember #Binance #ChartSniper
Titel: $PROM Channel Continuation 🚀
PROM/USDT (Perp) – Bullisher Channel
Einstieg: 6.20–6.30 (Retest)
TP: 6.60 / 7.00
SL: 5.91
⚠️ Keine finanzielle Beratung. MACH DEIN EIGENES RESEARCH (DYOR).
Hinweise zu den Levels (basierend auf deinem Chart):
Der Preis ist aus einem aufsteigenden Channel ab HL (5.45) ausgebrochen, hat so ein frisches HH (~6.62) gebildet und schwebt nun knapp über der 6.20-Marke (38.2% Fib / vorherige Struktur).
Einstieg: Ein Retest der Zone 6.20–6.30 (ehemaliger Widerstand, jetzt Unterstützung) innerhalb des aufsteigenden Channels bietet ein besseres Chance/Risiko-Verhältnis als dem aktuellen Kurs hinterherzulaufen.
TP1 (6.60): das jüngste HH / der Channel-Widerstand. TP2 (7.00): Erweiterung der Channel-Spitze, falls der Ausbruch weitergeht.
SL (5.91): unterhalb der 61.8% Fib und der unteren Begrenzung des Channels — ein Schlusskurs darunter würde die bullische Struktur brechen.
RSI bei 63 zeigt solide, aber nicht extreme Dynamik, also ist noch Raum nach oben — trotzdem: Warte auf den Retest, der hält, bevor du einsteigst, statt die Stärke zu kaufen.
@Binance Square Official #BitcoinClears$85200 #AltcoinSeasonIndexHoldsAbove60For5Days #USADPAdds90000JobsInSeptember #Binance #ChartSniper
PROM/USDT (Perp) – Bullisher Channel
Einstieg: 6.20–6.30 (Retest)
TP: 6.60 / 7.00
SL: 5.91
⚠️ Keine finanzielle Beratung. MACH DEIN EIGENES RESEARCH (DYOR).
Hinweise zu den Levels (basierend auf deinem Chart):
Der Preis ist aus einem aufsteigenden Channel ab HL (5.45) ausgebrochen, hat so ein frisches HH (~6.62) gebildet und schwebt nun knapp über der 6.20-Marke (38.2% Fib / vorherige Struktur).
Einstieg: Ein Retest der Zone 6.20–6.30 (ehemaliger Widerstand, jetzt Unterstützung) innerhalb des aufsteigenden Channels bietet ein besseres Chance/Risiko-Verhältnis als dem aktuellen Kurs hinterherzulaufen.
TP1 (6.60): das jüngste HH / der Channel-Widerstand. TP2 (7.00): Erweiterung der Channel-Spitze, falls der Ausbruch weitergeht.
SL (5.91): unterhalb der 61.8% Fib und der unteren Begrenzung des Channels — ein Schlusskurs darunter würde die bullische Struktur brechen.
RSI bei 63 zeigt solide, aber nicht extreme Dynamik, also ist noch Raum nach oben — trotzdem: Warte auf den Retest, der hält, bevor du einsteigst, statt die Stärke zu kaufen.
@Binance Square Official #BitcoinClears$85200 #AltcoinSeasonIndexHoldsAbove60For5Days #USADPAdds90000JobsInSeptember #Binance #ChartSniper
373
·
--
Bullisch
Titel: $GALA Uptrend-Retest 📊
$GALA/USDT (Perp) – Bullish, HL-Struktur
Einstieg: 0.00220–0.00225 (Retest der Trendlinie)
TP: 0.00234 / 0.00240
SL: 0.00218
⚠️ Keine Finanzberatung. DYOR.
Hinweise zu den Levels (aus deinem Chart):
Der Preis bildet höhere Tiefs (HL, LL) entlang der ansteigenden Trendlinie; Widerstand häuft sich nahe 0.00234 (HH-Zone), und Unterstützung liegt beim aktuellen Test der Trendlinie bei ca. 0.00220–0.00225.
Einstieg: die Zone 0.00220–0.00225, in der der Preis aktuell auf der Trendlinie sitzt und auf vorheriger horizontaler Unterstützung (grüne Linien) — ein typischer Bereich, den Bullen verteidigen.
TP1 (0.00234): der HH-Widerstand / vorherige Ablehnungszone. TP2 (0.00240): Trendlinien-Erweiterung / nächster Widerstand, falls 0.00234 bricht. SL (0.00218): knapp unter der Trendlinie und der jüngsten LL-Zone — ein Close darunter würde die Trendstruktur brechen.
RSI liegt nahe der Mittellinie (45–54), daher ist der Impuls neutral statt stark — bestätige, dass die Trendlinie hält, mit einer bullischen Kerze, bevor du einsteigst, statt den Bounce vorherzusehen.
@Binance_Square_Official #BitcoinClears$85200 #AltcoinSeasonIndexHoldsAbove60For5Days #USADPAdds90000JobsInSeptember #Binance #ChartSniper
{future}(GALAUSDT)
Titel: $GALA Uptrend-Retest 📊
$GALA /USDT (Perp) – Bullish, HL-Struktur
Einstieg: 0.00220–0.00225 (Retest der Trendlinie)
TP: 0.00234 / 0.00240
SL: 0.00218
⚠️ Keine Finanzberatung. DYOR.
Hinweise zu den Levels (aus deinem Chart):
Der Preis bildet höhere Tiefs (HL, LL) entlang der ansteigenden Trendlinie; Widerstand häuft sich nahe 0.00234 (HH-Zone), und Unterstützung liegt beim aktuellen Test der Trendlinie bei ca. 0.00220–0.00225.
Einstieg: die Zone 0.00220–0.00225, in der der Preis aktuell auf der Trendlinie sitzt und auf vorheriger horizontaler Unterstützung (grüne Linien) — ein typischer Bereich, den Bullen verteidigen.
TP1 (0.00234): der HH-Widerstand / vorherige Ablehnungszone. TP2 (0.00240): Trendlinien-Erweiterung / nächster Widerstand, falls 0.00234 bricht. SL (0.00218): knapp unter der Trendlinie und der jüngsten LL-Zone — ein Close darunter würde die Trendstruktur brechen.
RSI liegt nahe der Mittellinie (45–54), daher ist der Impuls neutral statt stark — bestätige, dass die Trendlinie hält, mit einer bullischen Kerze, bevor du einsteigst, statt den Bounce vorherzusehen.
@Binance Square Official #BitcoinClears$85200 #AltcoinSeasonIndexHoldsAbove60For5Days #USADPAdds90000JobsInSeptember #Binance #ChartSniper
$GALA /USDT (Perp) – Bullish, HL-Struktur
Einstieg: 0.00220–0.00225 (Retest der Trendlinie)
TP: 0.00234 / 0.00240
SL: 0.00218
⚠️ Keine Finanzberatung. DYOR.
Hinweise zu den Levels (aus deinem Chart):
Der Preis bildet höhere Tiefs (HL, LL) entlang der ansteigenden Trendlinie; Widerstand häuft sich nahe 0.00234 (HH-Zone), und Unterstützung liegt beim aktuellen Test der Trendlinie bei ca. 0.00220–0.00225.
Einstieg: die Zone 0.00220–0.00225, in der der Preis aktuell auf der Trendlinie sitzt und auf vorheriger horizontaler Unterstützung (grüne Linien) — ein typischer Bereich, den Bullen verteidigen.
TP1 (0.00234): der HH-Widerstand / vorherige Ablehnungszone. TP2 (0.00240): Trendlinien-Erweiterung / nächster Widerstand, falls 0.00234 bricht. SL (0.00218): knapp unter der Trendlinie und der jüngsten LL-Zone — ein Close darunter würde die Trendstruktur brechen.
RSI liegt nahe der Mittellinie (45–54), daher ist der Impuls neutral statt stark — bestätige, dass die Trendlinie hält, mit einer bullischen Kerze, bevor du einsteigst, statt den Bounce vorherzusehen.
@Binance Square Official #BitcoinClears$85200 #AltcoinSeasonIndexHoldsAbove60For5Days #USADPAdds90000JobsInSeptember #Binance #ChartSniper
457
·
--
Bullisch
Titel: $KSM Support-Test ⚖️
$KSM/USDT (Perp) – Range/Breakdown-Watch
Long-Einstieg: 5.05–5.06 (Support)
TP: 5.15 / 5.30
SL: 4.98
Short-Einstieg: Bruch unter 5.05
TP: 4.90
⚠️ Keine Finanzberatung. DYOR.
Notizen zu den Levels (aus deinem Chart):
Der Kurs ist unter die ansteigende Trendlinie gefallen, die den Move von LL (4.62) zu HH (5.35) stützte, und testet nun den horizontalen Support bei 5.05–5.06, nahe dem unteren Bereich der aktuellen Konsolidierungsrange.
Bullisches Szenario: Wenn 5.05–5.06 hält, zielt der Einstieg dort auf 5.15 (Range-Widerstand) und danach auf 5.30 (LH/HH-Zone).
SL bei 4.98, knapp unter dem Support. Bärisches Szenario: Ein bestätigter Schluss unter 5.05 begünstigt einen Rücksetzer Richtung 4.90 (teal Support-Linie), da der Trendlinienbruch plus das Abrollen des RSI von 50 Richtung 41 nachlassendes Momentum zeigt.
Das ist ein Entscheidungspunkt, kein klarer Trend — warte auf Bestätigung (ein Reclaim oder eine saubere Breakdown-Candle), statt mitten in der Range einzusteigen.
@Binance_Square_Official #BitcoinClears$85200 #AltcoinSeasonIndexHoldsAbove60For5Days #USADPAdds90000JobsInSeptember #Binance #ChartSniper
{future}(KSMUSDT)
Titel: $KSM Support-Test ⚖️
$KSM /USDT (Perp) – Range/Breakdown-Watch
Long-Einstieg: 5.05–5.06 (Support)
TP: 5.15 / 5.30
SL: 4.98
Short-Einstieg: Bruch unter 5.05
TP: 4.90
⚠️ Keine Finanzberatung. DYOR.
Notizen zu den Levels (aus deinem Chart):
Der Kurs ist unter die ansteigende Trendlinie gefallen, die den Move von LL (4.62) zu HH (5.35) stützte, und testet nun den horizontalen Support bei 5.05–5.06, nahe dem unteren Bereich der aktuellen Konsolidierungsrange.
Bullisches Szenario: Wenn 5.05–5.06 hält, zielt der Einstieg dort auf 5.15 (Range-Widerstand) und danach auf 5.30 (LH/HH-Zone).
SL bei 4.98, knapp unter dem Support. Bärisches Szenario: Ein bestätigter Schluss unter 5.05 begünstigt einen Rücksetzer Richtung 4.90 (teal Support-Linie), da der Trendlinienbruch plus das Abrollen des RSI von 50 Richtung 41 nachlassendes Momentum zeigt.
Das ist ein Entscheidungspunkt, kein klarer Trend — warte auf Bestätigung (ein Reclaim oder eine saubere Breakdown-Candle), statt mitten in der Range einzusteigen.
@Binance Square Official #BitcoinClears$85200 #AltcoinSeasonIndexHoldsAbove60For5Days #USADPAdds90000JobsInSeptember #Binance #ChartSniper
$KSM /USDT (Perp) – Range/Breakdown-Watch
Long-Einstieg: 5.05–5.06 (Support)
TP: 5.15 / 5.30
SL: 4.98
Short-Einstieg: Bruch unter 5.05
TP: 4.90
⚠️ Keine Finanzberatung. DYOR.
Notizen zu den Levels (aus deinem Chart):
Der Kurs ist unter die ansteigende Trendlinie gefallen, die den Move von LL (4.62) zu HH (5.35) stützte, und testet nun den horizontalen Support bei 5.05–5.06, nahe dem unteren Bereich der aktuellen Konsolidierungsrange.
Bullisches Szenario: Wenn 5.05–5.06 hält, zielt der Einstieg dort auf 5.15 (Range-Widerstand) und danach auf 5.30 (LH/HH-Zone).
SL bei 4.98, knapp unter dem Support. Bärisches Szenario: Ein bestätigter Schluss unter 5.05 begünstigt einen Rücksetzer Richtung 4.90 (teal Support-Linie), da der Trendlinienbruch plus das Abrollen des RSI von 50 Richtung 41 nachlassendes Momentum zeigt.
Das ist ein Entscheidungspunkt, kein klarer Trend — warte auf Bestätigung (ein Reclaim oder eine saubere Breakdown-Candle), statt mitten in der Range einzusteigen.
@Binance Square Official #BitcoinClears$85200 #AltcoinSeasonIndexHoldsAbove60For5Days #USADPAdds90000JobsInSeptember #Binance #ChartSniper
1
358
·
--
Bullisch
Titel: $GLMR Bounce Play 📈
$GLMR/USDT – Bullish Retracement
Einstieg: 0.00885–0.00895 (50–61,8%-Zone)
TP: 0.0093 / 0.0101
SL: 0.0078
⚠️ Keine Finanzberatung. Informiere dich selbst (DYOR).
Hinweise zu den Levels (aus deinem Chart):
Einstieg: 0.00885–0.00895, die 50%- bis 61,8%-Fib-Retracement-Zone, in der der Preis aktuell sitzt — ein typischer Bereich, in dem Bullen nach dem Impuls-Move vom LL zurück einsteigen.
TP1 (0.0093): das 28,2%-Fib / vorheriger Konsolidierungs-Widerstand. TP2 (0.0101): das HH-Swing-High — vollständiges Retracement-Ziel, falls der Momentum weiter anhält.
SL (0.0078): knapp unter dem 100%-Fib / LL — wenn der Preis unterhalb davon schließt, wird die bullische Struktur ungültig und der Move schlägt wahrscheinlich fehl.
RSI bei 68 ist bereits stark, also bestätige, dass der Preis die Zone hält (nicht nur kurz „durchsticht“) bevor du einsteigst, statt blind zu kaufen.
@Binance_Square_Official #BitcoinClears$85200 #AltcoinSeasonIndexHoldsAbove60For5Days
#USADPAdds90000JobsInSeptember #Binance #ChartSniper
{spot}(GLMRUSDT)
Titel: $GLMR Bounce Play 📈
$GLMR /USDT – Bullish Retracement
Einstieg: 0.00885–0.00895 (50–61,8%-Zone)
TP: 0.0093 / 0.0101
SL: 0.0078
⚠️ Keine Finanzberatung. Informiere dich selbst (DYOR).
Hinweise zu den Levels (aus deinem Chart):
Einstieg: 0.00885–0.00895, die 50%- bis 61,8%-Fib-Retracement-Zone, in der der Preis aktuell sitzt — ein typischer Bereich, in dem Bullen nach dem Impuls-Move vom LL zurück einsteigen.
TP1 (0.0093): das 28,2%-Fib / vorheriger Konsolidierungs-Widerstand. TP2 (0.0101): das HH-Swing-High — vollständiges Retracement-Ziel, falls der Momentum weiter anhält.
SL (0.0078): knapp unter dem 100%-Fib / LL — wenn der Preis unterhalb davon schließt, wird die bullische Struktur ungültig und der Move schlägt wahrscheinlich fehl.
RSI bei 68 ist bereits stark, also bestätige, dass der Preis die Zone hält (nicht nur kurz „durchsticht“) bevor du einsteigst, statt blind zu kaufen.
@Binance Square Official #BitcoinClears$85200 #AltcoinSeasonIndexHoldsAbove60For5Days
#USADPAdds90000JobsInSeptember #Binance #ChartSniper
$GLMR /USDT – Bullish Retracement
Einstieg: 0.00885–0.00895 (50–61,8%-Zone)
TP: 0.0093 / 0.0101
SL: 0.0078
⚠️ Keine Finanzberatung. Informiere dich selbst (DYOR).
Hinweise zu den Levels (aus deinem Chart):
Einstieg: 0.00885–0.00895, die 50%- bis 61,8%-Fib-Retracement-Zone, in der der Preis aktuell sitzt — ein typischer Bereich, in dem Bullen nach dem Impuls-Move vom LL zurück einsteigen.
TP1 (0.0093): das 28,2%-Fib / vorheriger Konsolidierungs-Widerstand. TP2 (0.0101): das HH-Swing-High — vollständiges Retracement-Ziel, falls der Momentum weiter anhält.
SL (0.0078): knapp unter dem 100%-Fib / LL — wenn der Preis unterhalb davon schließt, wird die bullische Struktur ungültig und der Move schlägt wahrscheinlich fehl.
RSI bei 68 ist bereits stark, also bestätige, dass der Preis die Zone hält (nicht nur kurz „durchsticht“) bevor du einsteigst, statt blind zu kaufen.
@Binance Square Official #BitcoinClears$85200 #AltcoinSeasonIndexHoldsAbove60For5Days
#USADPAdds90000JobsInSeptember #Binance #ChartSniper
209
·
--
Bullisch
Titel: $PROM Aufwärtstrend-Fortsetzung 🚀
$PROM USDT (Perp) – Bullischer Kanal
Einstieg: 5.90–6.00 (Retest)
TP: 6.25 / 6.70
SL: 5.50
Steigender Kanal, HH/LL-Struktur intakt.
⚠️ Keine Finanzberatung. Informiere dich selbst (DYOR).
Hinweise zu den Levels (aus deinem Chart):
Der Kurs brach zu einem neuen Hoch (HH) bei 6.247 aus, nachdem er vom höheren-Low-Support des Kanals nahe 5.50 abgeprallt ist.
Einstieg: ein Rücksetzer in die Zone 5.90–6.00 (früherer Widerstand wurde zum Support) bietet ein besseres Chance/Risiko-Verhältnis als dem aktuellen Kurs bei 6.04 hinterherzulaufen.
TP1 (6.25): jüngstes Hoch/Widerstand.
TP2 (6.70): Projektion der oberen Kanallinie.
SL (5.50): unterhalb des letzten Swing-Lows (LL) und der Kanalunterkante – invalidiert die Aufwärtstrend-Struktur, wenn er getroffen wird.
@Binance_Square_Official #QNTRises39% #EthereumBreaksAbove$2700 #BitgetBreachForgedRequestsNotStolenKeys #Binance #ChartSniper
{future}(PROMUSDT)
Titel: $PROM Aufwärtstrend-Fortsetzung 🚀
$PROM USDT (Perp) – Bullischer Kanal
Einstieg: 5.90–6.00 (Retest)
TP: 6.25 / 6.70
SL: 5.50
Steigender Kanal, HH/LL-Struktur intakt.
⚠️ Keine Finanzberatung. Informiere dich selbst (DYOR).
Hinweise zu den Levels (aus deinem Chart):
Der Kurs brach zu einem neuen Hoch (HH) bei 6.247 aus, nachdem er vom höheren-Low-Support des Kanals nahe 5.50 abgeprallt ist.
Einstieg: ein Rücksetzer in die Zone 5.90–6.00 (früherer Widerstand wurde zum Support) bietet ein besseres Chance/Risiko-Verhältnis als dem aktuellen Kurs bei 6.04 hinterherzulaufen.
TP1 (6.25): jüngstes Hoch/Widerstand.
TP2 (6.70): Projektion der oberen Kanallinie.
SL (5.50): unterhalb des letzten Swing-Lows (LL) und der Kanalunterkante – invalidiert die Aufwärtstrend-Struktur, wenn er getroffen wird.
@Binance Square Official #QNTRises39% #EthereumBreaksAbove$2700 #BitgetBreachForgedRequestsNotStolenKeys #Binance #ChartSniper
$PROM USDT (Perp) – Bullischer Kanal
Einstieg: 5.90–6.00 (Retest)
TP: 6.25 / 6.70
SL: 5.50
Steigender Kanal, HH/LL-Struktur intakt.
⚠️ Keine Finanzberatung. Informiere dich selbst (DYOR).
Hinweise zu den Levels (aus deinem Chart):
Der Kurs brach zu einem neuen Hoch (HH) bei 6.247 aus, nachdem er vom höheren-Low-Support des Kanals nahe 5.50 abgeprallt ist.
Einstieg: ein Rücksetzer in die Zone 5.90–6.00 (früherer Widerstand wurde zum Support) bietet ein besseres Chance/Risiko-Verhältnis als dem aktuellen Kurs bei 6.04 hinterherzulaufen.
TP1 (6.25): jüngstes Hoch/Widerstand.
TP2 (6.70): Projektion der oberen Kanallinie.
SL (5.50): unterhalb des letzten Swing-Lows (LL) und der Kanalunterkante – invalidiert die Aufwärtstrend-Struktur, wenn er getroffen wird.
@Binance Square Official #QNTRises39% #EthereumBreaksAbove$2700 #BitgetBreachForgedRequestsNotStolenKeys #Binance #ChartSniper
250
·
--
Artikel
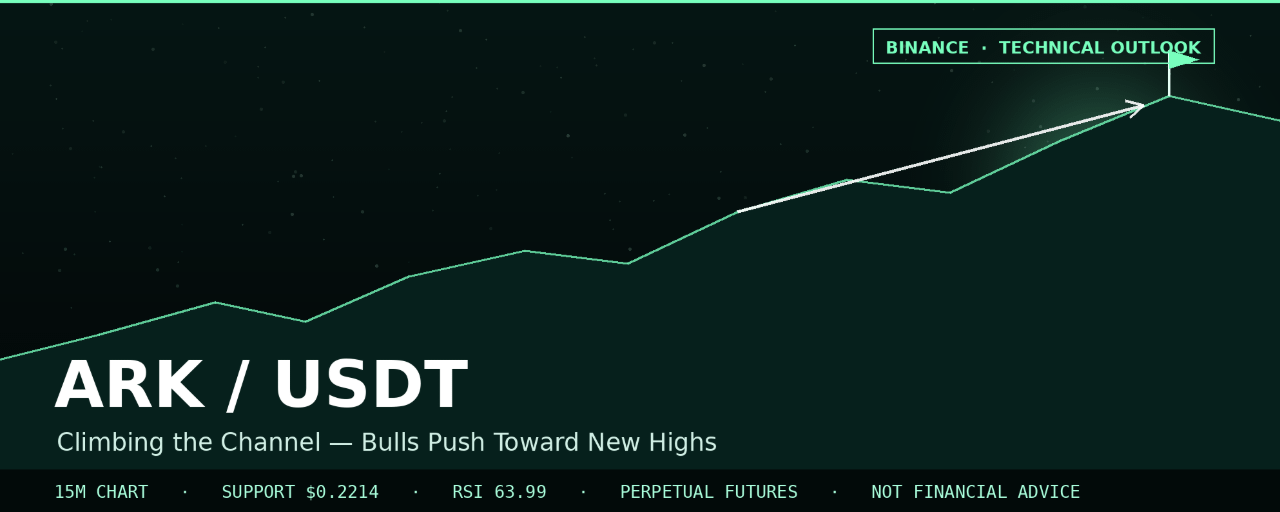
ARK/USDT steigt im Kanal: Bullen drängen auf neue Hochs$ARK
ARK gehörte zu den stärksten, gleichmäßig kletternden Assets auf der Liste und stieg Schritt für Schritt nach oben — innerhalb eines sauberen, aufsteigenden Kanals, mit einer Lehrbuch-Struktur aus höherem Hoch / höherem Tief. Nach einer gesunden Korrektur und einem anschließenden Rebound drückt der Kurs erneut gegen sein jüngstes Hoch — und das Setup spricht für eine Fortsetzung, solange der Kanal hält.
Überblick über die Marktstruktur
ARK/USDT (Perpetual Futures, Binance, Zeitrahmen 15 Min) befindet sich in einem anhaltenden, gut strukturierten Aufwärtstrend:
Der Preis ist stetig gestiegen: von ungefähr 0,155 US-Dollar ausgehend. Dabei bildete er eine Abfolge aus niedrigeren Hochs, die später in höhere Hochs überging, als sich der Trend weiterentwickelte — ein frühes LH nahe 0,165 US-Dollar, gefolgt von einem weiteren LH um etwa 0,195 US-Dollar, bevor die Struktur schließlich klar bullisch drehte.
ARK/USDT steigt im Kanal: Bullen drängen auf neue Hochs
$ARK
ARK gehörte zu den stärksten, gleichmäßig kletternden Assets auf der Liste und stieg Schritt für Schritt nach oben — innerhalb eines sauberen, aufsteigenden Kanals, mit einer Lehrbuch-Struktur aus höherem Hoch / höherem Tief. Nach einer gesunden Korrektur und einem anschließenden Rebound drückt der Kurs erneut gegen sein jüngstes Hoch — und das Setup spricht für eine Fortsetzung, solange der Kanal hält.
Überblick über die Marktstruktur
ARK/USDT (Perpetual Futures, Binance, Zeitrahmen 15 Min) befindet sich in einem anhaltenden, gut strukturierten Aufwärtstrend:
Der Preis ist stetig gestiegen: von ungefähr 0,155 US-Dollar ausgehend. Dabei bildete er eine Abfolge aus niedrigeren Hochs, die später in höhere Hochs überging, als sich der Trend weiterentwickelte — ein frühes LH nahe 0,165 US-Dollar, gefolgt von einem weiteren LH um etwa 0,195 US-Dollar, bevor die Struktur schließlich klar bullisch drehte.
ARK gehörte zu den stärksten, gleichmäßig kletternden Assets auf der Liste und stieg Schritt für Schritt nach oben — innerhalb eines sauberen, aufsteigenden Kanals, mit einer Lehrbuch-Struktur aus höherem Hoch / höherem Tief. Nach einer gesunden Korrektur und einem anschließenden Rebound drückt der Kurs erneut gegen sein jüngstes Hoch — und das Setup spricht für eine Fortsetzung, solange der Kanal hält.
Überblick über die Marktstruktur
ARK/USDT (Perpetual Futures, Binance, Zeitrahmen 15 Min) befindet sich in einem anhaltenden, gut strukturierten Aufwärtstrend:
Der Preis ist stetig gestiegen: von ungefähr 0,155 US-Dollar ausgehend. Dabei bildete er eine Abfolge aus niedrigeren Hochs, die später in höhere Hochs überging, als sich der Trend weiterentwickelte — ein frühes LH nahe 0,165 US-Dollar, gefolgt von einem weiteren LH um etwa 0,195 US-Dollar, bevor die Struktur schließlich klar bullisch drehte.
134
Anmelden und weiter Inhalte entdecken
Krypto-Nutzer weltweit auf Binance Square kennenlernen
⚡️ Bleib in Sachen Krypto stets am Puls.
💬 Die weltgrößte Kryptobörse vertraut darauf.
👍 Erhalte verlässliche Einblicke von verifizierten Creators.
E-Mail-Adresse/Telefonnummer
Trendthemen
FedMinutesFocusOnOctoberPause
396,445 Aufrufe
2,492 Kommentare
🚨 DIE FED HAT GERADE EINEN WICHTIGEN HINWEIS GEGEBEN: STEHT IM OKTOBER EINE PAUSE BEVOR?
Die Wall Street setzt darauf, dass die Fed im Oktober auf die Bremse tritt. Und die Krypto-Trader haben das genau im Blick. 👀
Das jüngste FOMC-Protokoll hat die Aufmerksamkeit auf eine mögliche Pause bei der Sitzung am 27. und 28. Oktober gelenkt.
📊 Die Marktlage:
🔥 Zinsen im Oktober unverändert lassen: laut den zuletzt veröffentlichten Wahrscheinlichkeiten etwa 82,8 %.
🔥 Wahrscheinlichkeit einer Zinserhöhung: etwa 17,2 %.
🔥 Der schwächelnde Arbeitsmarkt macht es schwieriger, eine sofortige Zinserhöhung zu rechtfertigen.
Doch jetzt kommt die Wendung.
EINE PAUSE IST KEINE ZINSSENKUNG.
Die Fed könnte die Zinsen im Oktober unverändert lassen und sich die Möglichkeit offenhalten, die Geldpolitik später wieder zu straffen.
Für $BTC, $ ETH und $XAU macht dieser Unterschied etwas aus.
Eine Pause könnte den unmittelbaren Druck auf Risikoanlagen mindern. Doch anhaltende Inflation und hohe Renditen von US-Staatsanleihen könnten die Aufwärtsdynamik weiterhin bremsen.
⚠️ DIE GROSSE FRAGE:
Positioniert sich die Wall Street für einen Ausbruch der Kryptowährungen nach oben oder bereitet sie vor der nächsten Fed-Entscheidung eine weitere massive Bullenfalle vor?
$BTC $ETH $BNB $SOL $XAU
#fedminutesfocusonoctoberpause #BinanceLaunchesBinanceIntelligence #EvernorthDelaysNasdaqDebutToOct12 #RobinhoodAdds25MInBitcoinToBalanceSheet $25MInBitcoinToBalanceSh #SP500AndNasdaqHitRecordHighs
Carmelita Gilliland zXSW
·10 Likes
·14k Aufrufe
VitalikWarnsAICouldWeakenCryptographySecurity
3,945 Aufrufe
195 Kommentare
XRPSpotETFsHold$1.7BWeeklyInflowsSlow
651 Aufrufe
28 Kommentare