

ForgeX
42 Beiträge

ForgeX
Melden
Nutzer blockieren
SHUTDOWN
Gelegenheitstrader
3 Jahre
50 Following
4.8K+ Follower
14 Like gegeben
Beiträge
Alle
Live
·
--
Übersetzung ansehen
South Korea's crypto gains tax faces a fourth delay since 2020, with officials now targeting a 2029 start instead of January 2027.
The 22% tax on gains above 2.5M won remains law until parliament amends it, leaving traders in limbo on cost-basis rules for pre-tax holdings.
Will the National Assembly actually pass the delay this time?
#SouthKorea #CryptoTax $BTC
The 22% tax on gains above 2.5M won remains law until parliament amends it, leaving traders in limbo on cost-basis rules for pre-tax holdings.
Will the National Assembly actually pass the delay this time?
#SouthKorea #CryptoTax $BTC

13
·
--
Übersetzung ansehen
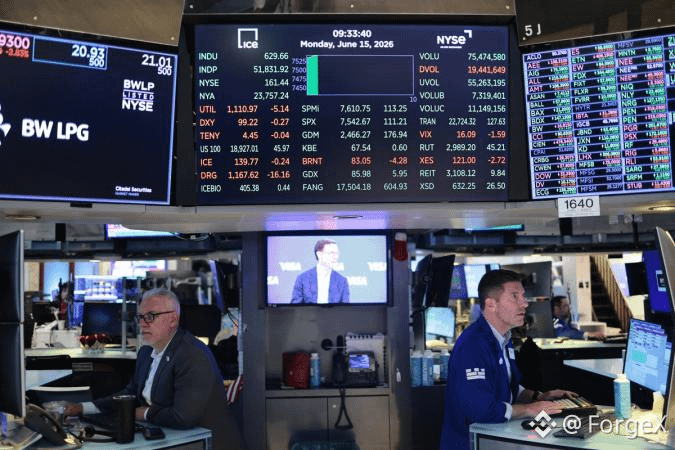
CF Benchmarks — whose indices underpin BlackRock's Bitcoin ETF and CME crypto futures — launches CFB Oracle to bring Wall Street pricing data onchain.
DeFi developers can now access the same institutional-grade benchmarks for crypto, stocks, bonds, and commodities to power tokenized funds, lending platforms, and derivatives.
Will this accelerate institutional adoption of onchain finance?
#DeFi #BlackRock $BTC
DeFi developers can now access the same institutional-grade benchmarks for crypto, stocks, bonds, and commodities to power tokenized funds, lending platforms, and derivatives.
Will this accelerate institutional adoption of onchain finance?
#DeFi #BlackRock $BTC
15
·
--
Übersetzung ansehen
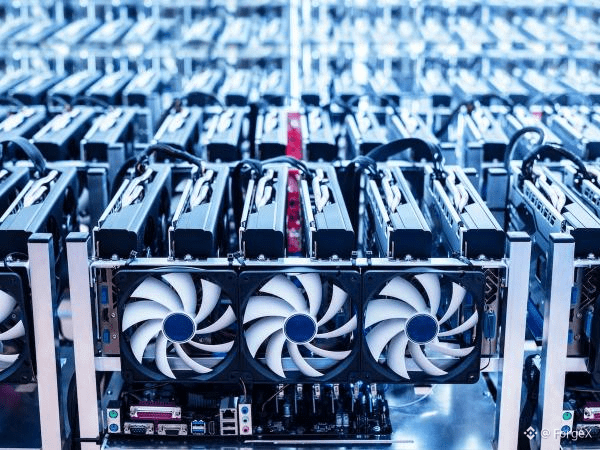
Luxor Technology raises 6M to expand AI hardware brokerage and compute trading.
Bitcoin miners are pivoting to AI, converting facilities into data centers. Luxor's software already works with miners representing ~2GW capacity.
As mining and AI converge, compute is becoming a tradable asset class.
#Bitcoin $BTC #AI #Compute
Bitcoin miners are pivoting to AI, converting facilities into data centers. Luxor's software already works with miners representing ~2GW capacity.
As mining and AI converge, compute is becoming a tradable asset class.
#Bitcoin $BTC #AI #Compute
11
·
--
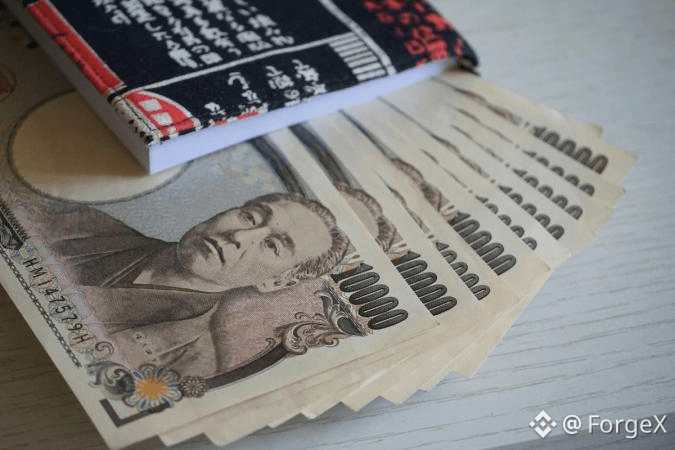
Japans führender Yen-Stablecoin JPYC erreichte nur 25 % seines Umlaufziels für das erste Jahr: 3,2 Mrd. Yen sind im Umlauf, gegenüber 12,1 Mrd. Yen an ausgegebenen Token.
Eine Obergrenze von 1 Mio. Yen pro Transaktion für Anbieter von Geldtransferdiensten des Typs II hat die Akzeptanz in Unternehmen trotz Partnerschaften mit AZ-COM Maruwa, SBJ Bank und LINE NEXT gebremst.
Kann eine Reform der Regulierung das Potenzial des Stablecoins im zweiten Jahr freisetzen?
#Japan #Stablecoins
35
·
--
Übersetzung ansehen
Japan's top yen stablecoin falls short of its target in a disappointing first year.\n\nAdoption lags as regulatory clarity and user trust remain hurdles.\n\n#Stablecoin #JPY #Crypto
Japan's top yen stablecoin falls short of its target in a disappointing first year.\n\nAdoption lags as regulatory clarity and user trust remain hurdles.\n\n#Stablecoin #JPY #Crypto
34
·
--
Übersetzung ansehen
Payward (Kraken's parent) plans to offer US clients access to Hyperliquid's onchain perpetual futures
The hybrid structure combines DeFi trading infrastructure with regulated US clearing and brokerage, pending regulatory approval
Will this DeFi-TradFi bridge unlock perpetual futures for US retail?
#Kraken #Hyperliquid
The hybrid structure combines DeFi trading infrastructure with regulated US clearing and brokerage, pending regulatory approval
Will this DeFi-TradFi bridge unlock perpetual futures for US retail?
#Kraken #Hyperliquid

57
·
--
🚨 Binance hat einen Antrag auf eine brasilianische Kryptolizenz gestellt – wenige Stunden vor Ablauf der Frist am 30. Oktober.
Warum das wichtig ist: Brasilien ist die größte Volkswirtschaft Lateinamerikas. Binance strebt nicht einfach nur eine Genehmigung an – das Unternehmen strukturiert sich in zwei Einheiten um (BBrasil für Kryptowährungen, Binance Brasil für Fiat und Zahlungen), um zu einer umfassenden Finanzdienstleistungsplattform zu werden, die direkt mit traditionellen Banken konkurriert. Rechnungen bezahlen, Devisenhandel, internationale Überweisungen, Zugang zu US-Aktien – all das kommt noch.
Unterdessen wurden 8 Dienste eingeschränkt und 22 Token für Nutzer in Brasilien delistet. Margin-Handel, Kredite, Launchpool, Megadrop – alles weg. Die Aufsichtsbehörde räumte Börsen 270 Tage ein, Zahlungsdienstleistern dagegen 5 Jahre. Es wird erwartet, dass sich nicht einmal <10 % der bestehenden Anbieter überhaupt bewerben.
OKX, Bybit, Transfero und Brasil Bitcoin haben bereits Anträge gestellt. Coinbase, Foxbit und Mercado Bitcoin dürften folgen.
Wird Binances bankähnlicher Kurswechsel in Brasilien zum Vorbild für die Regulierung von Kryptobörsen weltweit?
#Binance #Brazil #CryptoRegulation #LatAm #ExchangeNews

57
·
--
Übersetzung ansehen
Keystone is destroying 18,835 unsold hardware wallets after a breach exposed a production key that lets counterfeit devices pass authenticity checks.
The stolen key cannot be rotated, so any fake wallet with it would appear genuine — putting users' funds at risk.
What does this mean for hardware wallet supply-chain trust?
#Keystone #HardwareWallet
The stolen key cannot be rotated, so any fake wallet with it would appear genuine — putting users' funds at risk.
What does this mean for hardware wallet supply-chain trust?
#Keystone #HardwareWallet

86
·
--
Übersetzung ansehen
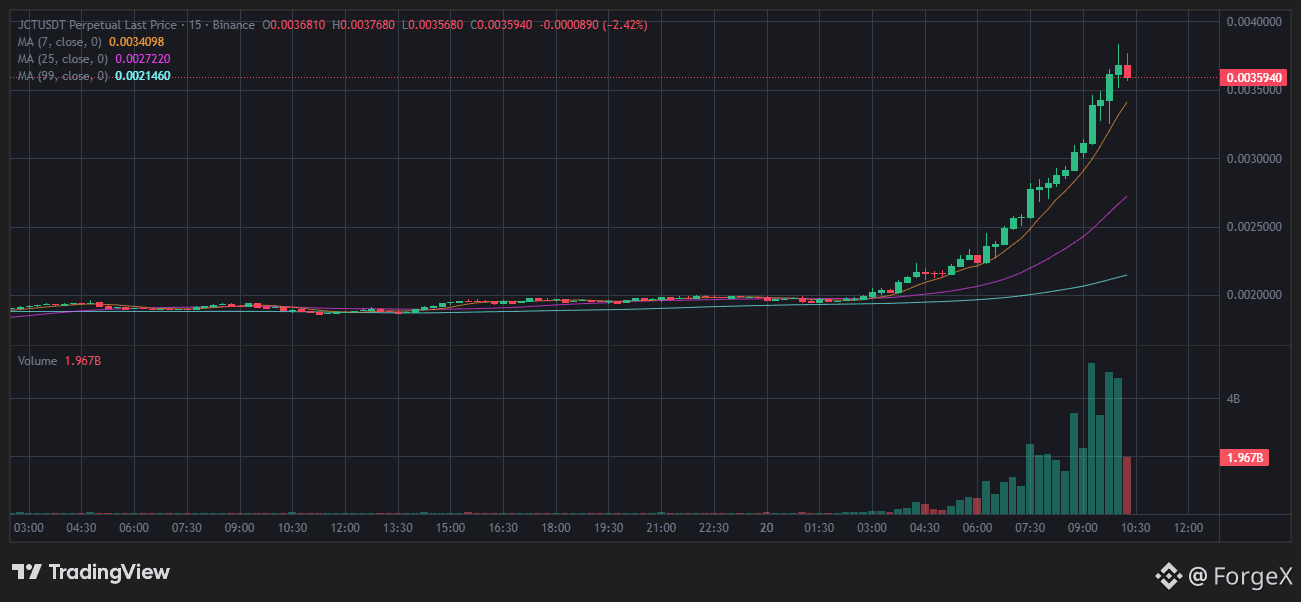
The JCTUSDT market is currently showing significant activity on the futures board! If you are following this asset, here are the key highlights based on the latest
{future}(JCTUSDT)
Price Movement: The current last price for JCTUSDT is sitting at 0.003655 USDT. The asset has seen a notable 24-hour change of +92.36%, highlighting high volatility.
Trading Volume: There is substantial market participation with a 24-hour volume of 136,143,982.03 USDT.Key Levels: Over the last 24 hours, the price has fluctuated between a low of 0.001856 USDT and a high of 0.003839 USDT
.Market Sentiment: With an Open Interest of roughly 19.84 million USDT, traders are actively positioning themselves around this asset.
The JCTUSDT market is currently showing significant activity on the futures board! If you are following this asset, here are the key highlights based on the latest
Price Movement: The current last price for JCTUSDT is sitting at 0.003655 USDT. The asset has seen a notable 24-hour change of +92.36%, highlighting high volatility.
Trading Volume: There is substantial market participation with a 24-hour volume of 136,143,982.03 USDT.Key Levels: Over the last 24 hours, the price has fluctuated between a low of 0.001856 USDT and a high of 0.003839 USDT
.Market Sentiment: With an Open Interest of roughly 19.84 million USDT, traders are actively positioning themselves around this asset.
324
·
--
Übersetzung ansehen
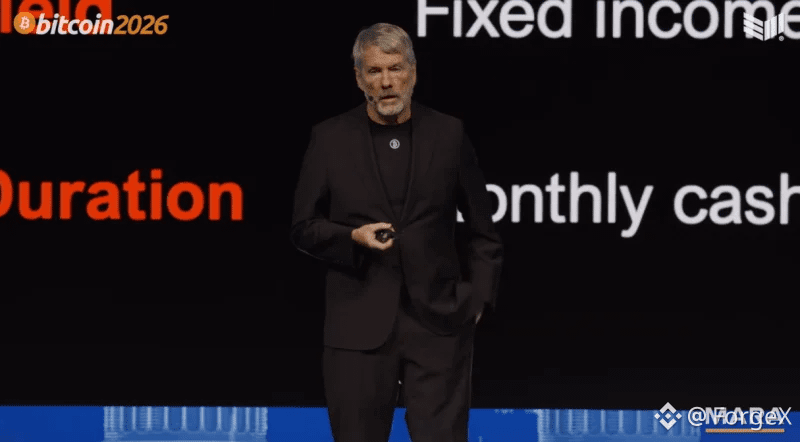
Strategy acquires 267 Bitcoin, repurchases $193 million in STRC shares
{future}(STRCUSDT)
Strategy acquires 267 Bitcoin, repurchases $193 million in STRC shares
78
·
--
Übersetzung ansehen
Strive adds $335 million in Bitcoin ahead of SATS IPO proceeds settlementStrive's aggressive Bitcoin acquisition strategy highlights the growing trend of corporations hedging against monetary debasement, impacting market dynamics.
Strive adds $335 million in Bitcoin ahead of SATS IPO proceeds settlement
Strive's aggressive Bitcoin acquisition strategy highlights the growing trend of corporations hedging against monetary debasement, impacting market dynamics.
71
·
--
Übersetzung ansehen
#nil $NIL @nillionnetwork 🚀 What if AI could unlock the power of data without exposing sensitive information?
That’s one of the ideas that makes @nillionnetwork worth watching. 🔐
As AI continues to evolve, privacy-preserving technology could become increasingly important for protecting data while enabling smarter applications. The combination of AI, privacy, and Web3 has huge potential, and I’m excited to see what the Nillion ecosystem builds next.
Do you think privacy will become one of the biggest challenges in the AI era? 👀
#NIL $NIL @nillionnetwork
#nil $NIL @Nillion 🚀 What if AI could unlock the power of data without exposing sensitive information?
That’s one of the ideas that makes @Nillion worth watching. 🔐
As AI continues to evolve, privacy-preserving technology could become increasingly important for protecting data while enabling smarter applications. The combination of AI, privacy, and Web3 has huge potential, and I’m excited to see what the Nillion ecosystem builds next.
Do you think privacy will become one of the biggest challenges in the AI era? 👀
#NIL $NIL @Nillion
89
·
--
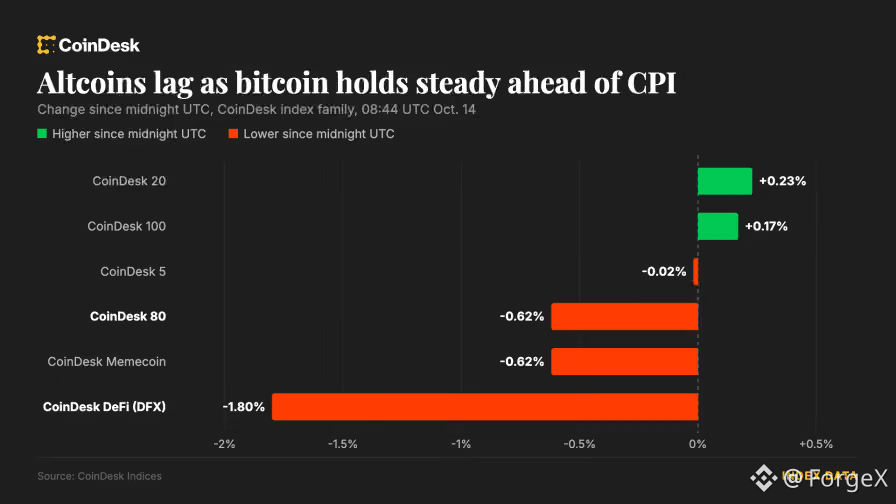
Bitcoin behauptet sich oberhalb von 83.000 USD, während der Markt den bevorstehenden US-Inflationsbericht erwartet. Bitcoin zeigt sich widerstandsfähig, während Altcoins Verluste verzeichnen – ein Zeichen für die vorsichtige Stimmung der Anleger. Die Handelsvolumina bei Krypto-Futures sind zurückgegangen und unterstreichen die Zurückhaltung des Marktes vor wichtigen Wirtschaftsdaten und Entscheidungen der Federal Reserve.
{spot}(BTCUSDT)
Bitcoin behauptet sich oberhalb von 83.000 USD, während der Markt den bevorstehenden US-Inflationsbericht erwartet. Bitcoin zeigt sich widerstandsfähig, während Altcoins Verluste verzeichnen – ein Zeichen für die vorsichtige Stimmung der Anleger. Die Handelsvolumina bei Krypto-Futures sind zurückgegangen und unterstreichen die Zurückhaltung des Marktes vor wichtigen Wirtschaftsdaten und Entscheidungen der Federal Reserve.
80
·
--
Übersetzung ansehen
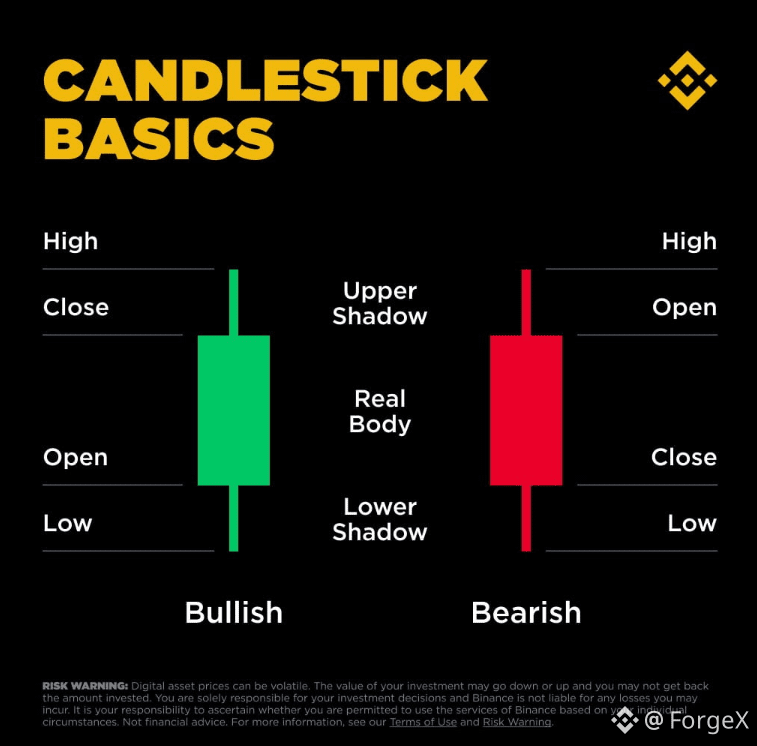
Candlestick charts are essential tools in trading that visually represent price movements using four key data points: Open, High, Low, and Close (OHLC). Each candlestick has a body showing the price difference between open and close, and wicks indicating the highest and lowest prices during a period. Typically, green candles mean prices closed higher (bullish), while red means they closed lower (bearish). These charts help traders identify market trends and potential reversals. However, they work best combined with other indicators like volume or support and resistance for more accurate analysis. $BNB
Candlestick charts are essential tools in trading that visually represent price movements using four key data points: Open, High, Low, and Close (OHLC). Each candlestick has a body showing the price difference between open and close, and wicks indicating the highest and lowest prices during a period. Typically, green candles mean prices closed higher (bullish), while red means they closed lower (bearish). These charts help traders identify market trends and potential reversals. However, they work best combined with other indicators like volume or support and resistance for more accurate analysis. $BNB
71

·
--
🎙️ Dieser Markt frisst eine Abführmedizin – geht es noch weiter bergab?
Beenden
03 h 34 m 20 s
20.8k
21
32
Anmelden und weiter Inhalte entdecken
Krypto-Nutzer weltweit auf Binance Square kennenlernen
⚡️ Bleib in Sachen Krypto stets am Puls.
💬 Die weltgrößte Kryptobörse vertraut darauf.
👍 Erhalte verlässliche Einblicke von verifizierten Creators.
E-Mail-Adresse/Telefonnummer