
asiftahsin
2.3k Beiträge

asiftahsin
Melden
Nutzer blockieren
Share Crypto Related Market Analysis, Share Crypto Related knowledge for my follower(brother and Sister)
32 Following
335 Follower
1.3K+ Like gegeben
Beiträge
Alle
Zitierungen
·
--
Artikel
Übersetzung ansehen
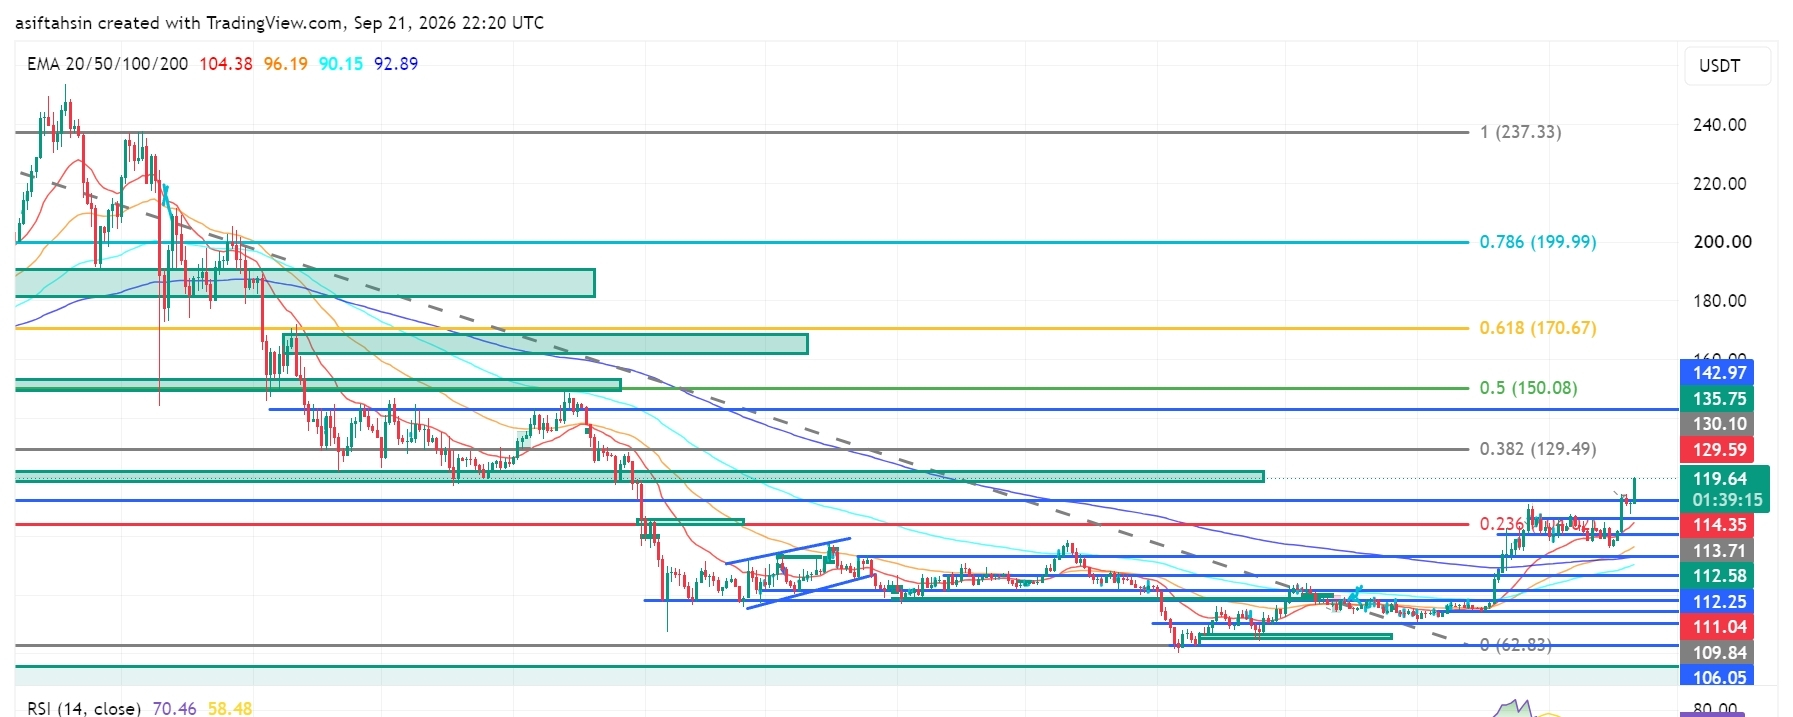
SOL Technical Outlook: Solana Pushes Toward $120 as Breakout Structure StrengthensSOL is currently trading around $119.61, holding well above the $112–$114 region after a strong recovery from the $104–$110 support zone.
The broader structure has improved significantly, with SOL reclaiming the $110–$114 area and now testing the $119–$120 resistance zone. A sustained breakout above this region would bring the higher Fibonacci levels back into focus.
📈 EMA Structure
20 EMA: $104.38
50 EMA: $96.19
100 EMA: $90.15
200 EMA: $92.89
SOL is trading significantly above all four major EMAs.
The 20 EMA remains above the 50 EMA, while the 50 EMA is also above the 200 EMA. This alignment reflects a strong recovery structure and improving medium-term trend.
The $104–$106 region is now an important deeper support zone, while the $110–$114 area has developed into a key structural support region after the recent breakout.
📐 Fibonacci Levels
0.236: $114.35
0.382: $129.49
0.5: $150.08
0.618: $170.67
0.786: $199.99
1.0: $237.33
SOL has reclaimed the 0.236 Fibonacci level around $114.35 and is now trading above it.
The next major Fibonacci resistance is $129.49, followed by $150.08.
🟢 Bullish Scenario
Immediate resistance is around:
$119.61 → $120
A clean breakout and sustained close above the $119–$120 zone could open the path toward:
$129.49 → $135.75 → $142.97 → $150.08
The $129.49 level is the next major Fibonacci resistance. A successful breakout and retest above $129.49 would strengthen the continuation structure and put the $150.08 level into focus.
Above $150.08, the higher Fibonacci references are:
$170.67 → $199.99 → $237.33
🔴 Pullback Scenario
Key support levels:
$114.35
$113.71
$112.58
$112.25
$111.04
$109.84
$106.05
$104.38
$96.19
$92.89
$90.15
The $111–$114 zone is particularly important.
A pullback into this area followed by a successful hold would keep the breakout structure constructive. Losing $109.84–$106.05 would indicate deeper consolidation, while a sustained move below the $104.38 20 EMA would significantly weaken the current recovery structure.
🧠 Market Structure & Liquidity
Liquidity Sweep → Accumulation → Higher Lows → Breakout → Expansion → Retest → Consolidation → Continuation
SOL has moved through several important structural phases, recovering from the June low around $62.83, building higher lows, reclaiming the $100 area, and then breaking above the previous $110–$114 resistance region.
The current move toward $120 represents another expansion phase, with $119–$120 acting as the immediate decision zone.
📊 RSI Momentum
RSI: 70.46
RSI MA: 58.48
RSI has moved above 70, showing strong bullish momentum but also entering an overbought region.
This does not automatically mean a reversal. However, after the recent expansion, SOL could experience short-term consolidation or a pullback before attempting another leg higher.
The key will be whether RSI can remain elevated while price holds the $114–$119 structure.
🎯 Key Levels
Resistance:
$119.61 → $120 → $129.49 → $135.75 → $142.97 → $150.08 → $170.67 → $199.99
Support:
$114.35 → $113.71 → $112.58 → $112.25 → $111.04 → $109.84 → $106.05 → $104.38
Major EMA Support:
$104.38 / $96.19 / $92.89 / $90.15
📌 Final Outlook
SOL has strengthened considerably after reclaiming the $110–$114 region and pushing toward $120.
The key battle now is $119–$120.
A sustained breakout above this zone could open the path toward $129.49, followed by $135.75–$142.97 and the major $150.08 Fibonacci level.
On the downside, $111–$114 is the first major retest zone. Holding this area would keep the breakout structure intact, while a deeper move below $106.05–$104.38 would weaken the current setup.
Bias: Recovery structure remains strong above $104.38. A sustained breakout above $119–$120 could open the path toward $129.49, with $150.08 as the next major Fibonacci objective.
$SOL
{future}(SOLUSDT)
SOL Technical Outlook: Solana Pushes Toward $120 as Breakout Structure Strengthens
SOL is currently trading around $119.61, holding well above the $112–$114 region after a strong recovery from the $104–$110 support zone.
The broader structure has improved significantly, with SOL reclaiming the $110–$114 area and now testing the $119–$120 resistance zone. A sustained breakout above this region would bring the higher Fibonacci levels back into focus.
📈 EMA Structure
20 EMA: $104.38
50 EMA: $96.19
100 EMA: $90.15
200 EMA: $92.89
SOL is trading significantly above all four major EMAs.
The 20 EMA remains above the 50 EMA, while the 50 EMA is also above the 200 EMA. This alignment reflects a strong recovery structure and improving medium-term trend.
The $104–$106 region is now an important deeper support zone, while the $110–$114 area has developed into a key structural support region after the recent breakout.
📐 Fibonacci Levels
0.236: $114.35
0.382: $129.49
0.5: $150.08
0.618: $170.67
0.786: $199.99
1.0: $237.33
SOL has reclaimed the 0.236 Fibonacci level around $114.35 and is now trading above it.
The next major Fibonacci resistance is $129.49, followed by $150.08.
🟢 Bullish Scenario
Immediate resistance is around:
$119.61 → $120
A clean breakout and sustained close above the $119–$120 zone could open the path toward:
$129.49 → $135.75 → $142.97 → $150.08
The $129.49 level is the next major Fibonacci resistance. A successful breakout and retest above $129.49 would strengthen the continuation structure and put the $150.08 level into focus.
Above $150.08, the higher Fibonacci references are:
$170.67 → $199.99 → $237.33
🔴 Pullback Scenario
Key support levels:
$114.35
$113.71
$112.58
$112.25
$111.04
$109.84
$106.05
$104.38
$96.19
$92.89
$90.15
The $111–$114 zone is particularly important.
A pullback into this area followed by a successful hold would keep the breakout structure constructive. Losing $109.84–$106.05 would indicate deeper consolidation, while a sustained move below the $104.38 20 EMA would significantly weaken the current recovery structure.
🧠 Market Structure & Liquidity
Liquidity Sweep → Accumulation → Higher Lows → Breakout → Expansion → Retest → Consolidation → Continuation
SOL has moved through several important structural phases, recovering from the June low around $62.83, building higher lows, reclaiming the $100 area, and then breaking above the previous $110–$114 resistance region.
The current move toward $120 represents another expansion phase, with $119–$120 acting as the immediate decision zone.
📊 RSI Momentum
RSI: 70.46
RSI MA: 58.48
RSI has moved above 70, showing strong bullish momentum but also entering an overbought region.
This does not automatically mean a reversal. However, after the recent expansion, SOL could experience short-term consolidation or a pullback before attempting another leg higher.
The key will be whether RSI can remain elevated while price holds the $114–$119 structure.
🎯 Key Levels
Resistance:
$119.61 → $120 → $129.49 → $135.75 → $142.97 → $150.08 → $170.67 → $199.99
Support:
$114.35 → $113.71 → $112.58 → $112.25 → $111.04 → $109.84 → $106.05 → $104.38
Major EMA Support:
$104.38 / $96.19 / $92.89 / $90.15
📌 Final Outlook
SOL has strengthened considerably after reclaiming the $110–$114 region and pushing toward $120.
The key battle now is $119–$120.
A sustained breakout above this zone could open the path toward $129.49, followed by $135.75–$142.97 and the major $150.08 Fibonacci level.
On the downside, $111–$114 is the first major retest zone. Holding this area would keep the breakout structure intact, while a deeper move below $106.05–$104.38 would weaken the current setup.
Bias: Recovery structure remains strong above $104.38. A sustained breakout above $119–$120 could open the path toward $129.49, with $150.08 as the next major Fibonacci objective.
$SOL
The broader structure has improved significantly, with SOL reclaiming the $110–$114 area and now testing the $119–$120 resistance zone. A sustained breakout above this region would bring the higher Fibonacci levels back into focus.
📈 EMA Structure
20 EMA: $104.38
50 EMA: $96.19
100 EMA: $90.15
200 EMA: $92.89
SOL is trading significantly above all four major EMAs.
The 20 EMA remains above the 50 EMA, while the 50 EMA is also above the 200 EMA. This alignment reflects a strong recovery structure and improving medium-term trend.
The $104–$106 region is now an important deeper support zone, while the $110–$114 area has developed into a key structural support region after the recent breakout.
📐 Fibonacci Levels
0.236: $114.35
0.382: $129.49
0.5: $150.08
0.618: $170.67
0.786: $199.99
1.0: $237.33
SOL has reclaimed the 0.236 Fibonacci level around $114.35 and is now trading above it.
The next major Fibonacci resistance is $129.49, followed by $150.08.
🟢 Bullish Scenario
Immediate resistance is around:
$119.61 → $120
A clean breakout and sustained close above the $119–$120 zone could open the path toward:
$129.49 → $135.75 → $142.97 → $150.08
The $129.49 level is the next major Fibonacci resistance. A successful breakout and retest above $129.49 would strengthen the continuation structure and put the $150.08 level into focus.
Above $150.08, the higher Fibonacci references are:
$170.67 → $199.99 → $237.33
🔴 Pullback Scenario
Key support levels:
$114.35
$113.71
$112.58
$112.25
$111.04
$109.84
$106.05
$104.38
$96.19
$92.89
$90.15
The $111–$114 zone is particularly important.
A pullback into this area followed by a successful hold would keep the breakout structure constructive. Losing $109.84–$106.05 would indicate deeper consolidation, while a sustained move below the $104.38 20 EMA would significantly weaken the current recovery structure.
🧠 Market Structure & Liquidity
Liquidity Sweep → Accumulation → Higher Lows → Breakout → Expansion → Retest → Consolidation → Continuation
SOL has moved through several important structural phases, recovering from the June low around $62.83, building higher lows, reclaiming the $100 area, and then breaking above the previous $110–$114 resistance region.
The current move toward $120 represents another expansion phase, with $119–$120 acting as the immediate decision zone.
📊 RSI Momentum
RSI: 70.46
RSI MA: 58.48
RSI has moved above 70, showing strong bullish momentum but also entering an overbought region.
This does not automatically mean a reversal. However, after the recent expansion, SOL could experience short-term consolidation or a pullback before attempting another leg higher.
The key will be whether RSI can remain elevated while price holds the $114–$119 structure.
🎯 Key Levels
Resistance:
$119.61 → $120 → $129.49 → $135.75 → $142.97 → $150.08 → $170.67 → $199.99
Support:
$114.35 → $113.71 → $112.58 → $112.25 → $111.04 → $109.84 → $106.05 → $104.38
Major EMA Support:
$104.38 / $96.19 / $92.89 / $90.15
📌 Final Outlook
SOL has strengthened considerably after reclaiming the $110–$114 region and pushing toward $120.
The key battle now is $119–$120.
A sustained breakout above this zone could open the path toward $129.49, followed by $135.75–$142.97 and the major $150.08 Fibonacci level.
On the downside, $111–$114 is the first major retest zone. Holding this area would keep the breakout structure intact, while a deeper move below $106.05–$104.38 would weaken the current setup.
Bias: Recovery structure remains strong above $104.38. A sustained breakout above $119–$120 could open the path toward $129.49, with $150.08 as the next major Fibonacci objective.
$SOL
35
·
--
Artikel
Übersetzung ansehen
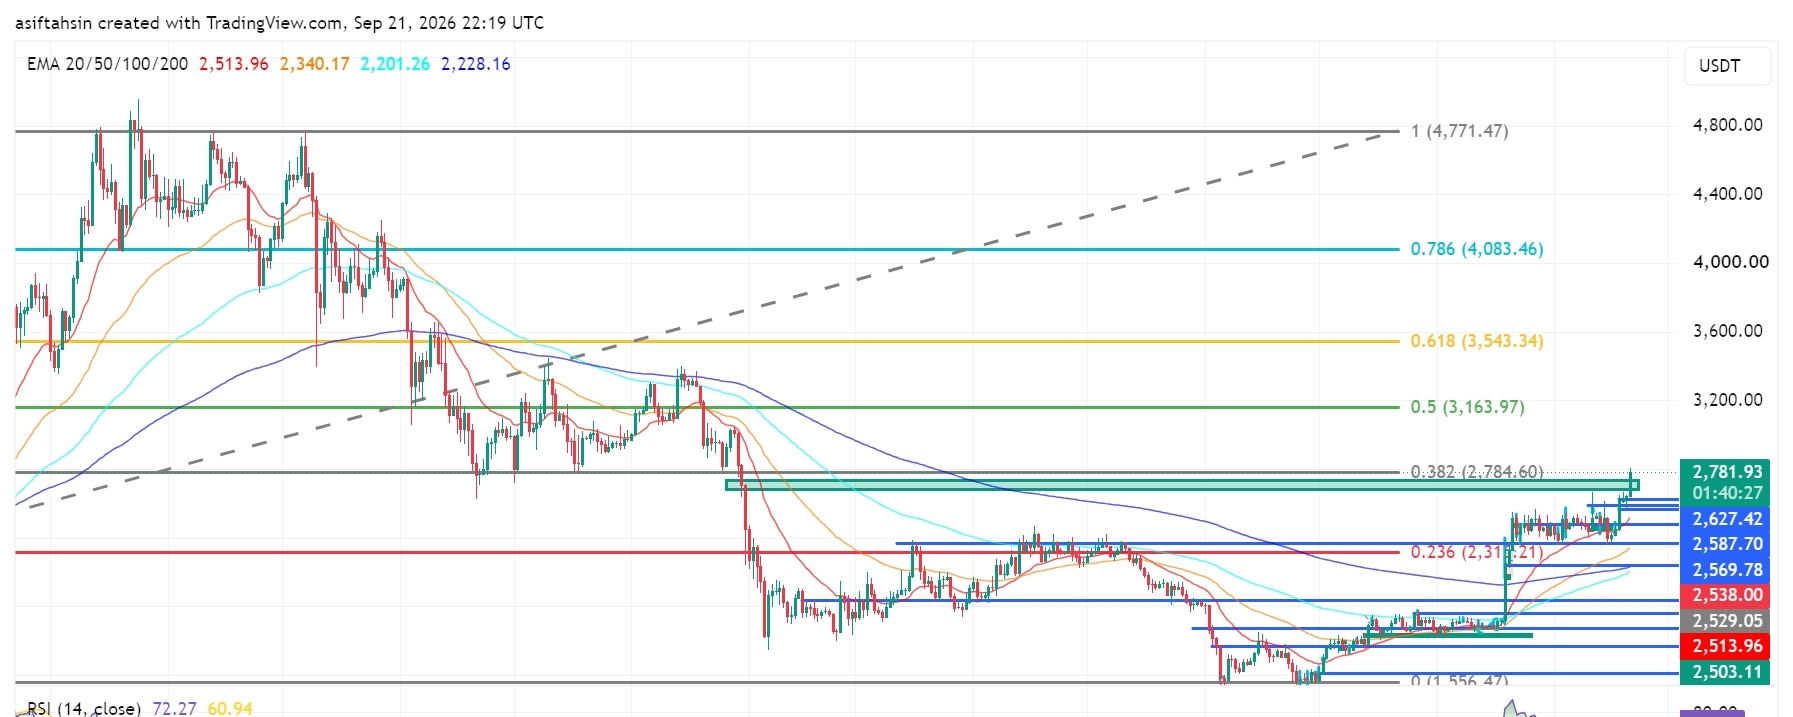
ETH Technical Outlook: Ethereum Reclaims $2.78K as Breakout Structure StrengthensETH is currently trading around $2,781.93, pushing into the major $2,784.60 Fibonacci resistance after a strong recovery from the $2,475–$2,500 area.
The broader structure has improved significantly, with ETH reclaiming the $2,500–$2,600 region and breaking above the previous consolidation range. A sustained breakout above $2,784.60 would bring the higher Fibonacci levels into focus.
📈 EMA Structure
20 EMA: $2,513.96
50 EMA: $2,340.17
100 EMA: $2,201.26
200 EMA: $2,228.16
ETH is trading well above all four major EMAs.
The 20 EMA remains above the 50 EMA, while the 100 EMA and 200 EMA are positioned significantly lower. This alignment reflects a strong recovery structure and improving medium-term momentum.
The $2,500–$2,540 region is now an important EMA/support zone.
📐 Fibonacci Levels
0.236: $2,315.21
0.382: $2,784.60
0.5: $3,163.97
0.618: $3,543.34
0.786: $4,083.46
1.0: $4,771.47
ETH is currently testing the 0.382 Fibonacci level at $2,784.60.
A clean breakout and sustained close above this level would shift attention toward $3,163.97, followed by the higher Fibonacci extensions.
🟢 Bullish Scenario
Immediate resistance sits around:
$2,784.60 → $2,800
A confirmed breakout above this area could open the path toward:
$3,163.97 → $3,543.34 → $4,083.46 → $4,771.47
The first major objective is the 0.5 Fibonacci level at $3,163.97. If ETH can establish support above $2,784.60 after the breakout, the recovery structure would become substantially stronger.
🔴 Pullback Scenario
Key support levels:
$2,672.47
$2,627.42
$2,587.70
$2,569.78
$2,538.00
$2,529.05
$2,513.96
$2,503.11
$2,479.06
$2,475.84
The $2,570–$2,630 zone is particularly important for a healthy retest.
Holding this area after a breakout would allow ETH to consolidate before another attempt higher. A deeper move below $2,500 would weaken the current breakout structure and bring the lower support zone back into focus.
🧠 Market Structure & Liquidity
Liquidity Sweep → Accumulation → Higher Lows → Breakout → Expansion → Retest → Consolidation → Continuation
ETH has transitioned from the prolonged decline into a clear recovery structure. The recent move above the $2,600–$2,670 region represents an important expansion phase, while the current move toward $2,784.60 is testing the next major structural resistance.
📊 RSI Momentum
RSI: 72.27
RSI MA: 60.94
RSI has moved above 70, showing strong momentum but also indicating that ETH is entering an overbought zone on this chart.
That does not automatically mean a reversal; however, after such a strong expansion, a short-term consolidation or pullback would be technically normal before another continuation attempt.
🎯 Key Levels
Resistance:
$2,784.60 → $2,800 → $3,163.97 → $3,543.34 → $4,083.46 → $4,771.47
Support:
$2,672.47 → $2,627.42 → $2,587.70 → $2,569.78 → $2,538 → $2,513.96 → $2,503.11 → $2,479.06
Major EMA Support:
$2,513.96 / $2,340.17 / $2,228.16 / $2,201.26
📌 Final Outlook
ETH has strengthened considerably after reclaiming the $2,500–$2,600 region and pushing toward the $2,784.60 Fibonacci resistance.
The key battle now is $2,784.60–$2,800.
A sustained breakout above this zone could open the path toward $3,163.97, followed by $3,543.34 and potentially $4,083.46.
On the downside, $2,570–$2,630 is the first major retest zone, while $2,500–$2,514 remains critical structural support.
Bias: Recovery structure remains strong above $2,500. A sustained breakout above $2,784.60 could open the path toward $3,163.97, with $3,543.34 as the next major Fibonacci level.
$ETH
{future}(ETHUSDT)
ETH Technical Outlook: Ethereum Reclaims $2.78K as Breakout Structure Strengthens
ETH is currently trading around $2,781.93, pushing into the major $2,784.60 Fibonacci resistance after a strong recovery from the $2,475–$2,500 area.
The broader structure has improved significantly, with ETH reclaiming the $2,500–$2,600 region and breaking above the previous consolidation range. A sustained breakout above $2,784.60 would bring the higher Fibonacci levels into focus.
📈 EMA Structure
20 EMA: $2,513.96
50 EMA: $2,340.17
100 EMA: $2,201.26
200 EMA: $2,228.16
ETH is trading well above all four major EMAs.
The 20 EMA remains above the 50 EMA, while the 100 EMA and 200 EMA are positioned significantly lower. This alignment reflects a strong recovery structure and improving medium-term momentum.
The $2,500–$2,540 region is now an important EMA/support zone.
📐 Fibonacci Levels
0.236: $2,315.21
0.382: $2,784.60
0.5: $3,163.97
0.618: $3,543.34
0.786: $4,083.46
1.0: $4,771.47
ETH is currently testing the 0.382 Fibonacci level at $2,784.60.
A clean breakout and sustained close above this level would shift attention toward $3,163.97, followed by the higher Fibonacci extensions.
🟢 Bullish Scenario
Immediate resistance sits around:
$2,784.60 → $2,800
A confirmed breakout above this area could open the path toward:
$3,163.97 → $3,543.34 → $4,083.46 → $4,771.47
The first major objective is the 0.5 Fibonacci level at $3,163.97. If ETH can establish support above $2,784.60 after the breakout, the recovery structure would become substantially stronger.
🔴 Pullback Scenario
Key support levels:
$2,672.47
$2,627.42
$2,587.70
$2,569.78
$2,538.00
$2,529.05
$2,513.96
$2,503.11
$2,479.06
$2,475.84
The $2,570–$2,630 zone is particularly important for a healthy retest.
Holding this area after a breakout would allow ETH to consolidate before another attempt higher. A deeper move below $2,500 would weaken the current breakout structure and bring the lower support zone back into focus.
🧠 Market Structure & Liquidity
Liquidity Sweep → Accumulation → Higher Lows → Breakout → Expansion → Retest → Consolidation → Continuation
ETH has transitioned from the prolonged decline into a clear recovery structure. The recent move above the $2,600–$2,670 region represents an important expansion phase, while the current move toward $2,784.60 is testing the next major structural resistance.
📊 RSI Momentum
RSI: 72.27
RSI MA: 60.94
RSI has moved above 70, showing strong momentum but also indicating that ETH is entering an overbought zone on this chart.
That does not automatically mean a reversal; however, after such a strong expansion, a short-term consolidation or pullback would be technically normal before another continuation attempt.
🎯 Key Levels
Resistance:
$2,784.60 → $2,800 → $3,163.97 → $3,543.34 → $4,083.46 → $4,771.47
Support:
$2,672.47 → $2,627.42 → $2,587.70 → $2,569.78 → $2,538 → $2,513.96 → $2,503.11 → $2,479.06
Major EMA Support:
$2,513.96 / $2,340.17 / $2,228.16 / $2,201.26
📌 Final Outlook
ETH has strengthened considerably after reclaiming the $2,500–$2,600 region and pushing toward the $2,784.60 Fibonacci resistance.
The key battle now is $2,784.60–$2,800.
A sustained breakout above this zone could open the path toward $3,163.97, followed by $3,543.34 and potentially $4,083.46.
On the downside, $2,570–$2,630 is the first major retest zone, while $2,500–$2,514 remains critical structural support.
Bias: Recovery structure remains strong above $2,500. A sustained breakout above $2,784.60 could open the path toward $3,163.97, with $3,543.34 as the next major Fibonacci level.
$ETH
The broader structure has improved significantly, with ETH reclaiming the $2,500–$2,600 region and breaking above the previous consolidation range. A sustained breakout above $2,784.60 would bring the higher Fibonacci levels into focus.
📈 EMA Structure
20 EMA: $2,513.96
50 EMA: $2,340.17
100 EMA: $2,201.26
200 EMA: $2,228.16
ETH is trading well above all four major EMAs.
The 20 EMA remains above the 50 EMA, while the 100 EMA and 200 EMA are positioned significantly lower. This alignment reflects a strong recovery structure and improving medium-term momentum.
The $2,500–$2,540 region is now an important EMA/support zone.
📐 Fibonacci Levels
0.236: $2,315.21
0.382: $2,784.60
0.5: $3,163.97
0.618: $3,543.34
0.786: $4,083.46
1.0: $4,771.47
ETH is currently testing the 0.382 Fibonacci level at $2,784.60.
A clean breakout and sustained close above this level would shift attention toward $3,163.97, followed by the higher Fibonacci extensions.
🟢 Bullish Scenario
Immediate resistance sits around:
$2,784.60 → $2,800
A confirmed breakout above this area could open the path toward:
$3,163.97 → $3,543.34 → $4,083.46 → $4,771.47
The first major objective is the 0.5 Fibonacci level at $3,163.97. If ETH can establish support above $2,784.60 after the breakout, the recovery structure would become substantially stronger.
🔴 Pullback Scenario
Key support levels:
$2,672.47
$2,627.42
$2,587.70
$2,569.78
$2,538.00
$2,529.05
$2,513.96
$2,503.11
$2,479.06
$2,475.84
The $2,570–$2,630 zone is particularly important for a healthy retest.
Holding this area after a breakout would allow ETH to consolidate before another attempt higher. A deeper move below $2,500 would weaken the current breakout structure and bring the lower support zone back into focus.
🧠 Market Structure & Liquidity
Liquidity Sweep → Accumulation → Higher Lows → Breakout → Expansion → Retest → Consolidation → Continuation
ETH has transitioned from the prolonged decline into a clear recovery structure. The recent move above the $2,600–$2,670 region represents an important expansion phase, while the current move toward $2,784.60 is testing the next major structural resistance.
📊 RSI Momentum
RSI: 72.27
RSI MA: 60.94
RSI has moved above 70, showing strong momentum but also indicating that ETH is entering an overbought zone on this chart.
That does not automatically mean a reversal; however, after such a strong expansion, a short-term consolidation or pullback would be technically normal before another continuation attempt.
🎯 Key Levels
Resistance:
$2,784.60 → $2,800 → $3,163.97 → $3,543.34 → $4,083.46 → $4,771.47
Support:
$2,672.47 → $2,627.42 → $2,587.70 → $2,569.78 → $2,538 → $2,513.96 → $2,503.11 → $2,479.06
Major EMA Support:
$2,513.96 / $2,340.17 / $2,228.16 / $2,201.26
📌 Final Outlook
ETH has strengthened considerably after reclaiming the $2,500–$2,600 region and pushing toward the $2,784.60 Fibonacci resistance.
The key battle now is $2,784.60–$2,800.
A sustained breakout above this zone could open the path toward $3,163.97, followed by $3,543.34 and potentially $4,083.46.
On the downside, $2,570–$2,630 is the first major retest zone, while $2,500–$2,514 remains critical structural support.
Bias: Recovery structure remains strong above $2,500. A sustained breakout above $2,784.60 could open the path toward $3,163.97, with $3,543.34 as the next major Fibonacci level.
$ETH
58
·
--
Artikel
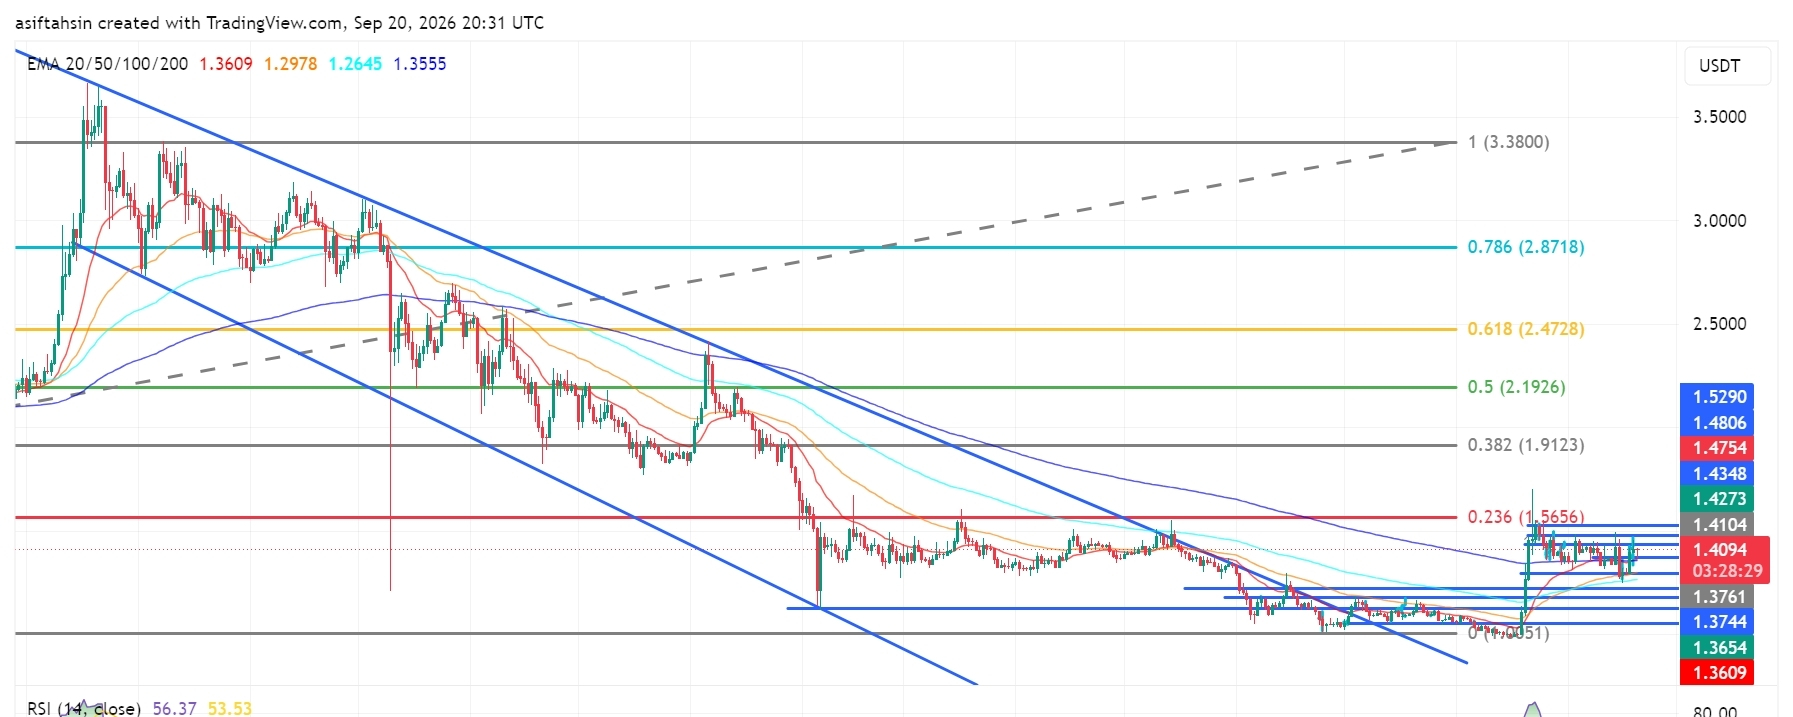
XRP-Technical-Outlook: XRP bleibt über 1,40 $, während die Erholungsstruktur gestärkt wirdXRP-Technical-Outlook: XRP bleibt über 1,40 $ und die Erholungsstruktur wird stärker
XRP wird derzeit bei etwa 1,41 $ gehandelt und hält sich nach der jüngsten Erholung vom Unterstützungsbereich 1,25–1,30 $ über der Zone 1,37–1,40 $.
Die übergeordnete Struktur hat sich verbessert: Der Kurs hat den Bereich um 1,40 $ zurückerobert und bewegt sich wieder in Richtung der wichtigen Widerstandszone bei 1,41–1,48 $. Ein nachhaltiger Anstieg durch diesen Bereich würde die höheren Fibonacci-Niveaus wieder in den Fokus rücken.
Auch aktuelle Marktkommentare haben den Bereich um 1,40 $ als wichtiges Widerstands-/Rückeroberungsniveau identifiziert, obwohl das kurzfristige Momentum in diesem Bereich weiterhin empfindlich bleibt.
XRP-Technical-Outlook: XRP bleibt über 1,40 $, während die Erholungsstruktur gestärkt wird
XRP-Technical-Outlook: XRP bleibt über 1,40 $ und die Erholungsstruktur wird stärker
XRP wird derzeit bei etwa 1,41 $ gehandelt und hält sich nach der jüngsten Erholung vom Unterstützungsbereich 1,25–1,30 $ über der Zone 1,37–1,40 $.
Die übergeordnete Struktur hat sich verbessert: Der Kurs hat den Bereich um 1,40 $ zurückerobert und bewegt sich wieder in Richtung der wichtigen Widerstandszone bei 1,41–1,48 $. Ein nachhaltiger Anstieg durch diesen Bereich würde die höheren Fibonacci-Niveaus wieder in den Fokus rücken.
Auch aktuelle Marktkommentare haben den Bereich um 1,40 $ als wichtiges Widerstands-/Rückeroberungsniveau identifiziert, obwohl das kurzfristige Momentum in diesem Bereich weiterhin empfindlich bleibt.
XRP wird derzeit bei etwa 1,41 $ gehandelt und hält sich nach der jüngsten Erholung vom Unterstützungsbereich 1,25–1,30 $ über der Zone 1,37–1,40 $.
Die übergeordnete Struktur hat sich verbessert: Der Kurs hat den Bereich um 1,40 $ zurückerobert und bewegt sich wieder in Richtung der wichtigen Widerstandszone bei 1,41–1,48 $. Ein nachhaltiger Anstieg durch diesen Bereich würde die höheren Fibonacci-Niveaus wieder in den Fokus rücken.
Auch aktuelle Marktkommentare haben den Bereich um 1,40 $ als wichtiges Widerstands-/Rückeroberungsniveau identifiziert, obwohl das kurzfristige Momentum in diesem Bereich weiterhin empfindlich bleibt.
2
1.2k
·
--
Artikel
Übersetzung ansehen
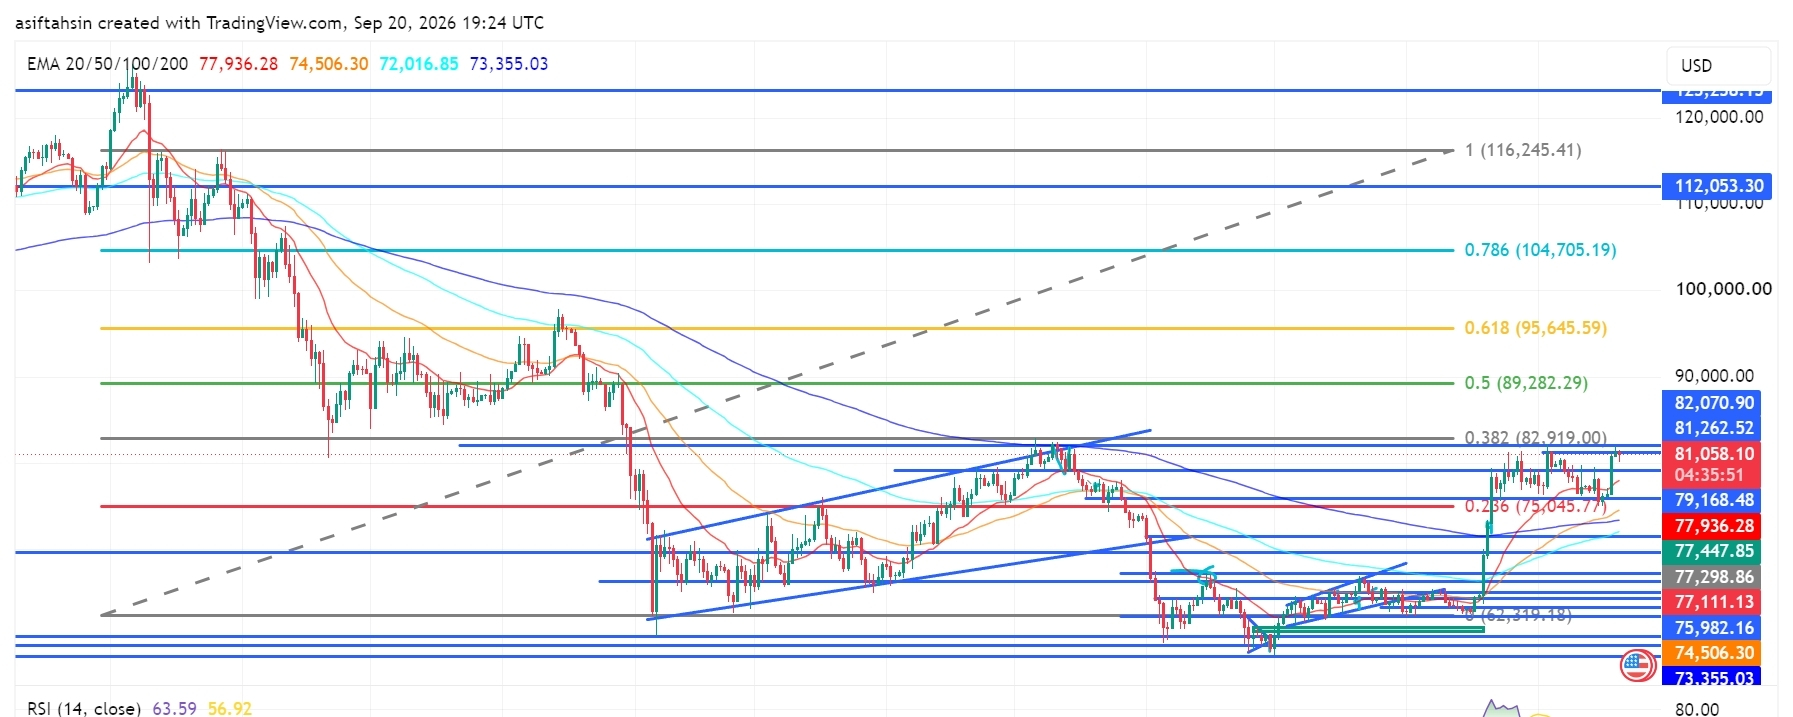
BTC Technical Outlook: Bitcoin Reclaims $81K as Recovery Structure StrengthensBTC is currently trading around $81,058, holding above the $79K–$80K region after the recent recovery from the $72K–$75K support area.
The broader structure has improved, with price reclaiming the $80K area and moving back toward the major $81.26K–$82.92K resistance zone. A sustained move through this area would put the higher Fibonacci levels back into focus.
📈 EMA Structure
20 EMA: $77,936.12
50 EMA: $74,506.24
100 EMA: $72,016.82
200 EMA: $73,355.02
BTC is currently trading well above the 20 EMA at $77,936.
The recovery above the 50 EMA at $74,506, 100 EMA at $72,016, and 200 EMA at $73,355 keeps the broader recovery structure constructive.
The 20 EMA remains above the longer-term EMA levels, showing improving short-term structure.
The $77.9K area remains an important dynamic support during any short-term pullback.
📐 Fibonacci Levels
Key Fibonacci levels:
0.236: $75,045.77
0.382: $82,919.00
0.5: $89,282.29
0.618: $95,645.59
0.786: $104,705.19
1.0: $116,245.41
BTC is currently trading above the 0.236 Fibonacci level at $75,045.77.
The next major Fibonacci reference is $82,919 — 0.382 Fib.
A sustained move above the $81K–$82.9K resistance area could bring $89,282 into focus, followed by $95,645.
🟢 Bullish Scenario
BTC has recovered strongly from the lower support structure and is now consolidating around $80K–$81K.
Immediate resistance:
$81,262.52
$82,070.90
$82,919.00 — 0.382 Fibonacci
$89,282.29 — 0.5 Fibonacci
$95,645.59 — 0.618 Fibonacci
A clean breakout and sustained close above $82K–$82.92K would provide stronger confirmation of continued recovery.
🎯 Target 1: $82,070.90
🎯 Target 2: $82,919.00 — 0.382 Fibonacci
🎯 Target 3: $89,282.29 — 0.5 Fibonacci
🎯 Target 4: $95,645.59 — 0.618 Fibonacci
🎯 Target 5: $104,705.19 — 0.786 Fibonacci
🎯 Target 6: $112,053.30
🎯 Target 7: $116,245.41 — 1.0 Fibonacci
A confirmed move through the $82.92K zone could strengthen the medium-term recovery structure and bring the $89K–$95K region into focus.
🔴 Pullback Scenario
After the recent expansion from the $75K region toward $81K, a retest of the breakout area would be normal.
Key supports:
$79,168.48
$77,936.12 — 20 EMA
$77,447.85
$77,298.86
$77,111.13
$75,982.16
$75,045.77 — 0.236 Fibonacci
$74,506.24 — 50 EMA
$73,355.02 — 200 EMA
$72,016.82 — 100 EMA
The $77K–$79K zone is particularly important.
If BTC continues to hold this area during a pullback, the current recovery structure remains active.
A sustained loss of $75,045 would weaken the current structure and bring the lower EMA support region back into focus.
🧠 Market Structure & Liquidity
BTC has formed a recovery structure after sweeping liquidity around the $72K–$75K region.
The recent move produced a strong recovery through $75K, followed by a breakout toward $80K–$81K.
BTC is now moving through an important:
Liquidity Sweep → Accumulation → Higher Lows → Breakout → Expansion → Retest → Consolidation → Continuation
structure.
The major upside liquidity and resistance are concentrated around the $81.26K–$82.92K region.
A decisive move through this area would place $89,282 as the next major Fibonacci reference.
📊 RSI Momentum
RSI (14): 63.59
RSI MA: 56.92
RSI has moved above the neutral 50 level and remains firmly in positive territory after the recent expansion.
The current reading around 63.59 shows stronger short-term momentum while remaining below the traditional 70 overbought threshold.
A sustained RSI above 60 would keep momentum supportive, while a move back below 50 would indicate increasing short-term weakness.
🎯 Key Levels
🔴 Major Resistance:
$81,262.52 → $82,070.90 → $82,919.00 → $89,282.29 → $95,645.59
🟢 Major Support:
$79,168.48 → $77,936.12 → $77,447.85 → $77,298.86 → $77,111.13 → $75,982.16 → $75,045.77
📉 Dynamic EMA Support:
$77,936.12 — 20 EMA | $74,506.24 — 50 EMA | $73,355.02 — 200 EMA | $72,016.82 — 100 EMA
🚀 Upside References:
$82,919 → $89,282 → $95,645 → $104,705 → $112,053 → $116,245
📌 Final Outlook
BTC's broader structure has strengthened after the recent recovery, with price now holding around $81K and above the major $75K–$79K support structure.
The $77K–$79K area is now an important short-term support region, while $81.26K–$82.92K remains the immediate major resistance zone.
A confirmed move above $82,919 could open the path toward $89,282, followed by $95,645 and $104,705.
However, rejection from the upper resistance area followed by a sustained loss of $75,045 would weaken the current recovery structure and bring the lower support zones back into focus.
Bias: 🟢 Recovery structure intact above $75,045. A sustained move above $82,919 could open the path toward $89,282, with $95,645 as the next major Fibonacci reference.
$BTC
{future}(BTCUSDT)
BTC Technical Outlook: Bitcoin Reclaims $81K as Recovery Structure Strengthens
BTC is currently trading around $81,058, holding above the $79K–$80K region after the recent recovery from the $72K–$75K support area.
The broader structure has improved, with price reclaiming the $80K area and moving back toward the major $81.26K–$82.92K resistance zone. A sustained move through this area would put the higher Fibonacci levels back into focus.
📈 EMA Structure
20 EMA: $77,936.12
50 EMA: $74,506.24
100 EMA: $72,016.82
200 EMA: $73,355.02
BTC is currently trading well above the 20 EMA at $77,936.
The recovery above the 50 EMA at $74,506, 100 EMA at $72,016, and 200 EMA at $73,355 keeps the broader recovery structure constructive.
The 20 EMA remains above the longer-term EMA levels, showing improving short-term structure.
The $77.9K area remains an important dynamic support during any short-term pullback.
📐 Fibonacci Levels
Key Fibonacci levels:
0.236: $75,045.77
0.382: $82,919.00
0.5: $89,282.29
0.618: $95,645.59
0.786: $104,705.19
1.0: $116,245.41
BTC is currently trading above the 0.236 Fibonacci level at $75,045.77.
The next major Fibonacci reference is $82,919 — 0.382 Fib.
A sustained move above the $81K–$82.9K resistance area could bring $89,282 into focus, followed by $95,645.
🟢 Bullish Scenario
BTC has recovered strongly from the lower support structure and is now consolidating around $80K–$81K.
Immediate resistance:
$81,262.52
$82,070.90
$82,919.00 — 0.382 Fibonacci
$89,282.29 — 0.5 Fibonacci
$95,645.59 — 0.618 Fibonacci
A clean breakout and sustained close above $82K–$82.92K would provide stronger confirmation of continued recovery.
🎯 Target 1: $82,070.90
🎯 Target 2: $82,919.00 — 0.382 Fibonacci
🎯 Target 3: $89,282.29 — 0.5 Fibonacci
🎯 Target 4: $95,645.59 — 0.618 Fibonacci
🎯 Target 5: $104,705.19 — 0.786 Fibonacci
🎯 Target 6: $112,053.30
🎯 Target 7: $116,245.41 — 1.0 Fibonacci
A confirmed move through the $82.92K zone could strengthen the medium-term recovery structure and bring the $89K–$95K region into focus.
🔴 Pullback Scenario
After the recent expansion from the $75K region toward $81K, a retest of the breakout area would be normal.
Key supports:
$79,168.48
$77,936.12 — 20 EMA
$77,447.85
$77,298.86
$77,111.13
$75,982.16
$75,045.77 — 0.236 Fibonacci
$74,506.24 — 50 EMA
$73,355.02 — 200 EMA
$72,016.82 — 100 EMA
The $77K–$79K zone is particularly important.
If BTC continues to hold this area during a pullback, the current recovery structure remains active.
A sustained loss of $75,045 would weaken the current structure and bring the lower EMA support region back into focus.
🧠 Market Structure & Liquidity
BTC has formed a recovery structure after sweeping liquidity around the $72K–$75K region.
The recent move produced a strong recovery through $75K, followed by a breakout toward $80K–$81K.
BTC is now moving through an important:
Liquidity Sweep → Accumulation → Higher Lows → Breakout → Expansion → Retest → Consolidation → Continuation
structure.
The major upside liquidity and resistance are concentrated around the $81.26K–$82.92K region.
A decisive move through this area would place $89,282 as the next major Fibonacci reference.
📊 RSI Momentum
RSI (14): 63.59
RSI MA: 56.92
RSI has moved above the neutral 50 level and remains firmly in positive territory after the recent expansion.
The current reading around 63.59 shows stronger short-term momentum while remaining below the traditional 70 overbought threshold.
A sustained RSI above 60 would keep momentum supportive, while a move back below 50 would indicate increasing short-term weakness.
🎯 Key Levels
🔴 Major Resistance:
$81,262.52 → $82,070.90 → $82,919.00 → $89,282.29 → $95,645.59
🟢 Major Support:
$79,168.48 → $77,936.12 → $77,447.85 → $77,298.86 → $77,111.13 → $75,982.16 → $75,045.77
📉 Dynamic EMA Support:
$77,936.12 — 20 EMA | $74,506.24 — 50 EMA | $73,355.02 — 200 EMA | $72,016.82 — 100 EMA
🚀 Upside References:
$82,919 → $89,282 → $95,645 → $104,705 → $112,053 → $116,245
📌 Final Outlook
BTC's broader structure has strengthened after the recent recovery, with price now holding around $81K and above the major $75K–$79K support structure.
The $77K–$79K area is now an important short-term support region, while $81.26K–$82.92K remains the immediate major resistance zone.
A confirmed move above $82,919 could open the path toward $89,282, followed by $95,645 and $104,705.
However, rejection from the upper resistance area followed by a sustained loss of $75,045 would weaken the current recovery structure and bring the lower support zones back into focus.
Bias: 🟢 Recovery structure intact above $75,045. A sustained move above $82,919 could open the path toward $89,282, with $95,645 as the next major Fibonacci reference.
$BTC
The broader structure has improved, with price reclaiming the $80K area and moving back toward the major $81.26K–$82.92K resistance zone. A sustained move through this area would put the higher Fibonacci levels back into focus.
📈 EMA Structure
20 EMA: $77,936.12
50 EMA: $74,506.24
100 EMA: $72,016.82
200 EMA: $73,355.02
BTC is currently trading well above the 20 EMA at $77,936.
The recovery above the 50 EMA at $74,506, 100 EMA at $72,016, and 200 EMA at $73,355 keeps the broader recovery structure constructive.
The 20 EMA remains above the longer-term EMA levels, showing improving short-term structure.
The $77.9K area remains an important dynamic support during any short-term pullback.
📐 Fibonacci Levels
Key Fibonacci levels:
0.236: $75,045.77
0.382: $82,919.00
0.5: $89,282.29
0.618: $95,645.59
0.786: $104,705.19
1.0: $116,245.41
BTC is currently trading above the 0.236 Fibonacci level at $75,045.77.
The next major Fibonacci reference is $82,919 — 0.382 Fib.
A sustained move above the $81K–$82.9K resistance area could bring $89,282 into focus, followed by $95,645.
🟢 Bullish Scenario
BTC has recovered strongly from the lower support structure and is now consolidating around $80K–$81K.
Immediate resistance:
$81,262.52
$82,070.90
$82,919.00 — 0.382 Fibonacci
$89,282.29 — 0.5 Fibonacci
$95,645.59 — 0.618 Fibonacci
A clean breakout and sustained close above $82K–$82.92K would provide stronger confirmation of continued recovery.
🎯 Target 1: $82,070.90
🎯 Target 2: $82,919.00 — 0.382 Fibonacci
🎯 Target 3: $89,282.29 — 0.5 Fibonacci
🎯 Target 4: $95,645.59 — 0.618 Fibonacci
🎯 Target 5: $104,705.19 — 0.786 Fibonacci
🎯 Target 6: $112,053.30
🎯 Target 7: $116,245.41 — 1.0 Fibonacci
A confirmed move through the $82.92K zone could strengthen the medium-term recovery structure and bring the $89K–$95K region into focus.
🔴 Pullback Scenario
After the recent expansion from the $75K region toward $81K, a retest of the breakout area would be normal.
Key supports:
$79,168.48
$77,936.12 — 20 EMA
$77,447.85
$77,298.86
$77,111.13
$75,982.16
$75,045.77 — 0.236 Fibonacci
$74,506.24 — 50 EMA
$73,355.02 — 200 EMA
$72,016.82 — 100 EMA
The $77K–$79K zone is particularly important.
If BTC continues to hold this area during a pullback, the current recovery structure remains active.
A sustained loss of $75,045 would weaken the current structure and bring the lower EMA support region back into focus.
🧠 Market Structure & Liquidity
BTC has formed a recovery structure after sweeping liquidity around the $72K–$75K region.
The recent move produced a strong recovery through $75K, followed by a breakout toward $80K–$81K.
BTC is now moving through an important:
Liquidity Sweep → Accumulation → Higher Lows → Breakout → Expansion → Retest → Consolidation → Continuation
structure.
The major upside liquidity and resistance are concentrated around the $81.26K–$82.92K region.
A decisive move through this area would place $89,282 as the next major Fibonacci reference.
📊 RSI Momentum
RSI (14): 63.59
RSI MA: 56.92
RSI has moved above the neutral 50 level and remains firmly in positive territory after the recent expansion.
The current reading around 63.59 shows stronger short-term momentum while remaining below the traditional 70 overbought threshold.
A sustained RSI above 60 would keep momentum supportive, while a move back below 50 would indicate increasing short-term weakness.
🎯 Key Levels
🔴 Major Resistance:
$81,262.52 → $82,070.90 → $82,919.00 → $89,282.29 → $95,645.59
🟢 Major Support:
$79,168.48 → $77,936.12 → $77,447.85 → $77,298.86 → $77,111.13 → $75,982.16 → $75,045.77
📉 Dynamic EMA Support:
$77,936.12 — 20 EMA | $74,506.24 — 50 EMA | $73,355.02 — 200 EMA | $72,016.82 — 100 EMA
🚀 Upside References:
$82,919 → $89,282 → $95,645 → $104,705 → $112,053 → $116,245
📌 Final Outlook
BTC's broader structure has strengthened after the recent recovery, with price now holding around $81K and above the major $75K–$79K support structure.
The $77K–$79K area is now an important short-term support region, while $81.26K–$82.92K remains the immediate major resistance zone.
A confirmed move above $82,919 could open the path toward $89,282, followed by $95,645 and $104,705.
However, rejection from the upper resistance area followed by a sustained loss of $75,045 would weaken the current recovery structure and bring the lower support zones back into focus.
Bias: 🟢 Recovery structure intact above $75,045. A sustained move above $82,919 could open the path toward $89,282, with $95,645 as the next major Fibonacci reference.
$BTC
43
·
--
Artikel
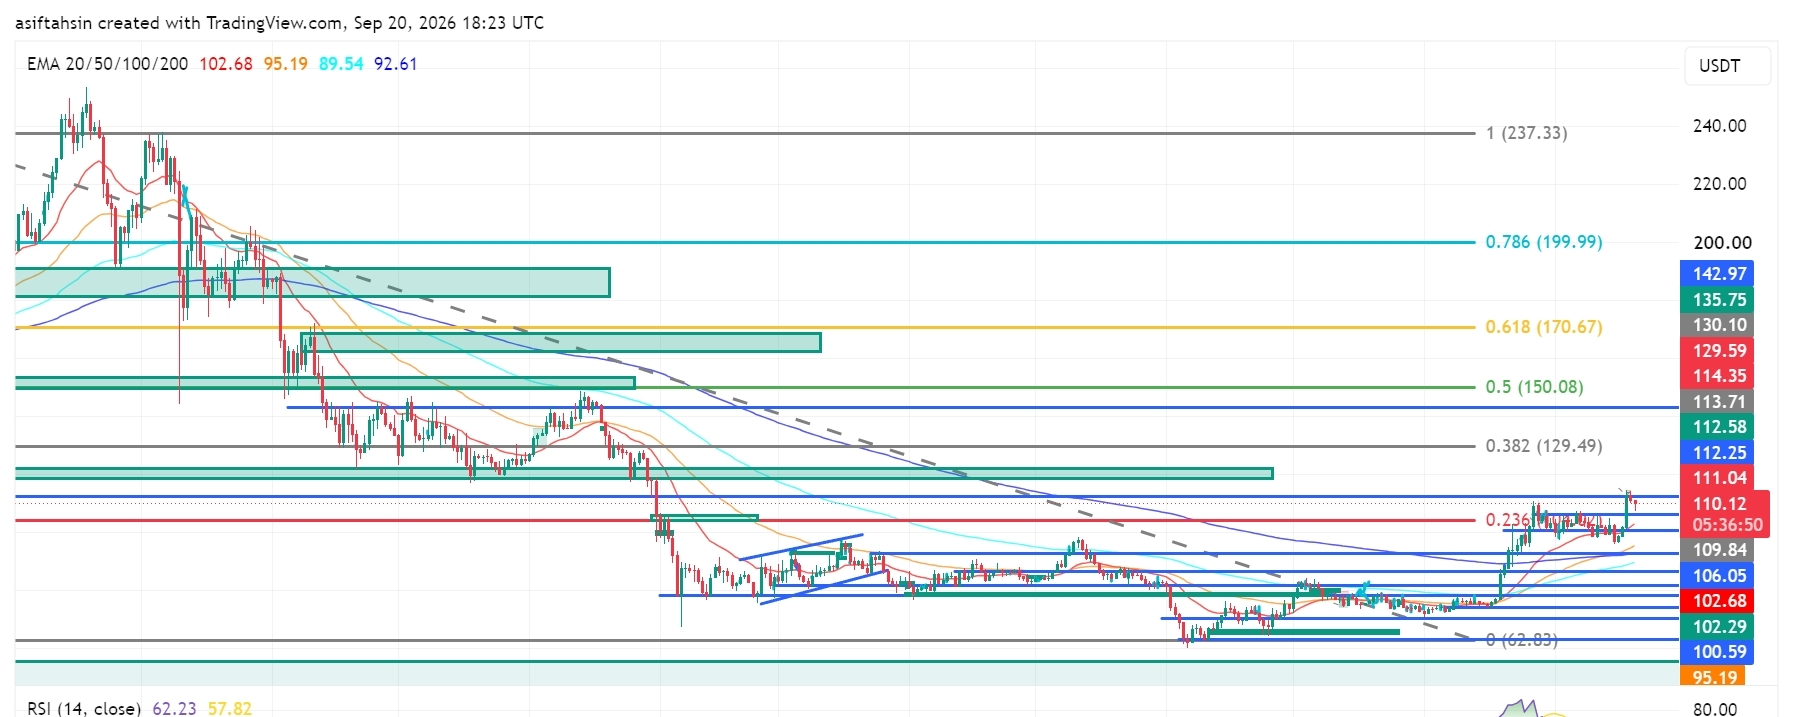
SOL Technischer Ausblick: Solana erobert $110 zurück, während die Erholungsstruktur an Stärke gewinntSOL handelt derzeit bei etwa $110, hält sich oberhalb der $106–$109-Region, nachdem es sich kürzlich von dem Unterstützungsbereich $92–$100 erholt hat.
Die übergeordnete Struktur hat sich verbessert: Der Kurs hat die $100-Marke zurückerobert und bewegt sich wieder in Richtung der wichtigen Widerstandszone bei $111–$114. Ein anhaltender Ausbruch durch diesen Bereich würde die höheren Fibonacci-Niveaus wieder in den Fokus rücken.
📈 EMA-Struktur
20 EMA: $102.68
50 EMA: $95.19
100 EMA: $89.54
200 EMA: $92.61
SOL handelt derzeit deutlich über der 20 EMA bei $102.68.
Die Erholung über der 50 EMA bei $95.19, der 100 EMA bei $89.54 und der 200 EMA bei $92.61 hält die größere Erholungsstruktur weiterhin konstruktiv.
SOL Technischer Ausblick: Solana erobert $110 zurück, während die Erholungsstruktur an Stärke gewinnt
SOL handelt derzeit bei etwa $110, hält sich oberhalb der $106–$109-Region, nachdem es sich kürzlich von dem Unterstützungsbereich $92–$100 erholt hat.
Die übergeordnete Struktur hat sich verbessert: Der Kurs hat die $100-Marke zurückerobert und bewegt sich wieder in Richtung der wichtigen Widerstandszone bei $111–$114. Ein anhaltender Ausbruch durch diesen Bereich würde die höheren Fibonacci-Niveaus wieder in den Fokus rücken.
📈 EMA-Struktur
20 EMA: $102.68
50 EMA: $95.19
100 EMA: $89.54
200 EMA: $92.61
SOL handelt derzeit deutlich über der 20 EMA bei $102.68.
Die Erholung über der 50 EMA bei $95.19, der 100 EMA bei $89.54 und der 200 EMA bei $92.61 hält die größere Erholungsstruktur weiterhin konstruktiv.
Die übergeordnete Struktur hat sich verbessert: Der Kurs hat die $100-Marke zurückerobert und bewegt sich wieder in Richtung der wichtigen Widerstandszone bei $111–$114. Ein anhaltender Ausbruch durch diesen Bereich würde die höheren Fibonacci-Niveaus wieder in den Fokus rücken.
📈 EMA-Struktur
20 EMA: $102.68
50 EMA: $95.19
100 EMA: $89.54
200 EMA: $92.61
SOL handelt derzeit deutlich über der 20 EMA bei $102.68.
Die Erholung über der 50 EMA bei $95.19, der 100 EMA bei $89.54 und der 200 EMA bei $92.61 hält die größere Erholungsstruktur weiterhin konstruktiv.
1.1k
·
--
Artikel
Übersetzung ansehen
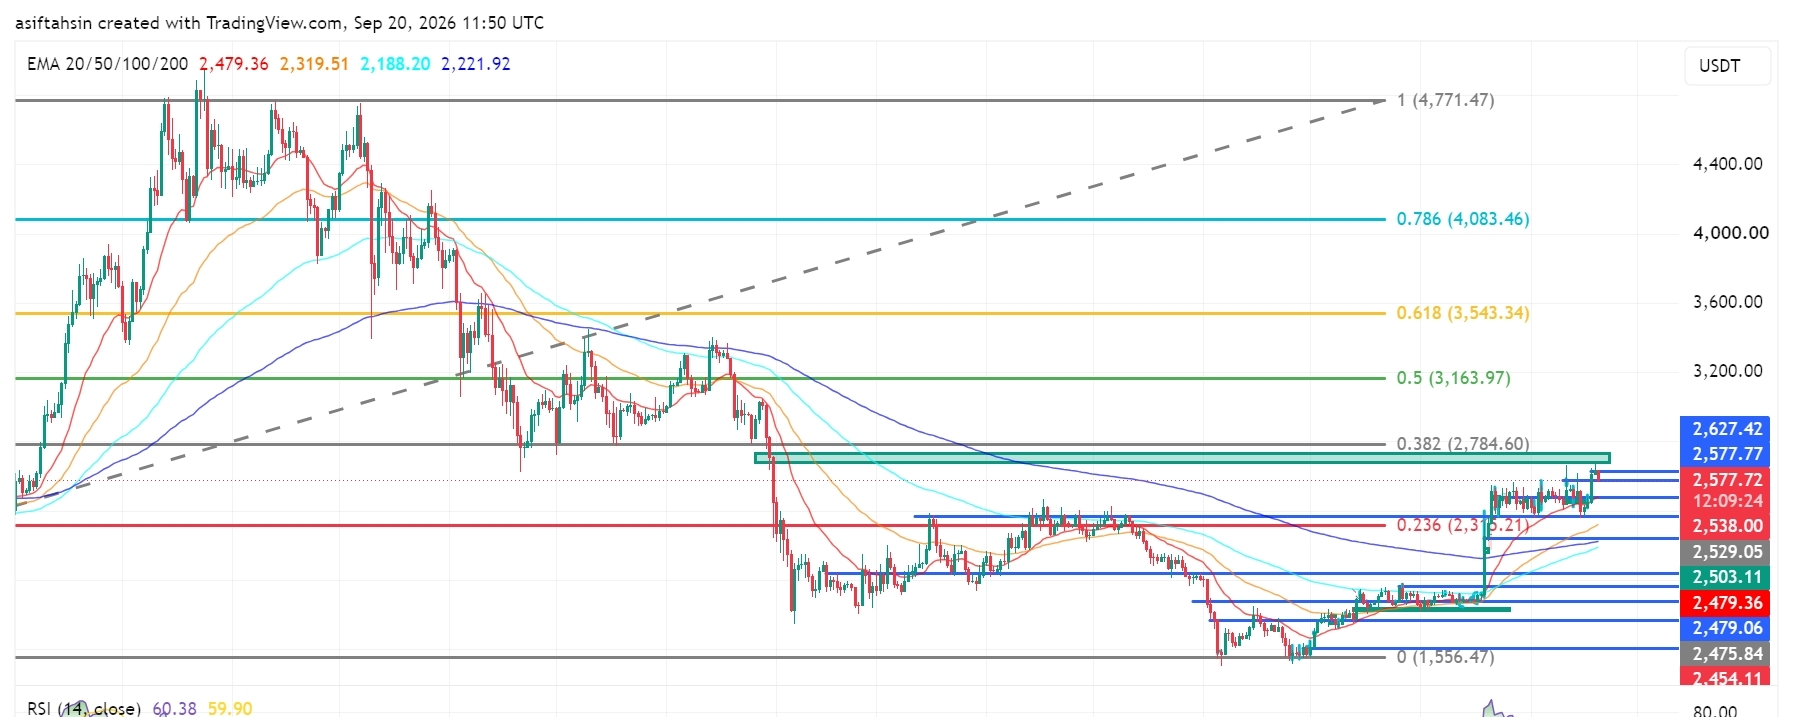
ETH Technical Outlook: Ethereum Holds Near $2.58K as Recovery ContinuesETH is currently trading around $2,577, holding above the $2,500–$2,540 support area after the recent recovery from the $2,280–$2,360 demand zone.
The broader recovery structure remains constructive, with price now approaching the important $2,627–$2,785 resistance zone. The $2,784.60 level is the major 0.382 Fibonacci reference on the chart.
📈 EMA Structure
20 EMA: $2,479.36
50 EMA: $2,319.51
100 EMA: $2,188.20
200 EMA: $2,221.92
ETH is currently trading well above the 20 EMA at $2,479.36.
The recovery above the 50 EMA at $2,319.51, 100 EMA at $2,188.20, and 200 EMA at $2,221.92 keeps the broader recovery structure constructive.
The 20 EMA is now acting as an important dynamic reference. A sustained hold above this level would keep the short-term structure supported.
📐 Fibonacci Levels
Key Fibonacci levels:
0.236: $2,315.21
0.382: $2,784.60
0.5: $3,163.97
0.618: $3,543.34
0.786: $4,083.46
1.0: $4,771.47
ETH has moved significantly above the 0.236 Fibonacci level at $2,315.21.
The next major Fibonacci resistance is $2,784.60 — 0.382 Fib.
A sustained move through the $2,627–$2,785 resistance structure would bring the higher Fibonacci levels into focus.
🟢 Upside Scenario
ETH is consolidating near $2,577 after the recent recovery and is now approaching the upper resistance structure.
Immediate resistance:
$2,577.77
$2,627.42
$2,784.60 — 0.382 Fibonacci
$3,163.97 — 0.5 Fibonacci
$3,543.34 — 0.618 Fibonacci
A clean breakout and sustained close above the $2,627–$2,785 zone would provide stronger confirmation of continued recovery.
🎯 Target 1: $2,627.42
🎯 Target 2: $2,784.60 — 0.382 Fibonacci
🎯 Target 3: $3,163.97 — 0.5 Fibonacci
🎯 Target 4: $3,543.34 — 0.618 Fibonacci
🎯 Target 5: $4,083.46 — 0.786 Fibonacci
🎯 Target 6: $4,771.47 — 1.0 Fibonacci
A sustained move above $2,784.60 could strengthen the medium-term recovery structure and bring the $3,164–$3,543 region into focus.
🔴 Pullback Scenario
After the recent expansion, a retest of the breakout area would be normal.
Key supports:
$2,538.00
$2,529.05
$2,503.11
$2,479.36 — 20 EMA
$2,479.06
$2,475.84
$2,454.11
$2,405.75
$2,319.51 — 50 EMA
The $2,475–$2,540 zone is particularly important.
If ETH continues to hold this area during a pullback, the current recovery structure remains active.
A sustained loss of the $2,475–$2,454 area would weaken the short-term structure and could expose the lower $2,405–$2,320 region.
🧠 Market Structure & Liquidity
ETH has formed a clear recovery structure after sweeping liquidity around the $2,280–$2,360 region.
The recent move produced a strong breakout from the previous consolidation and pushed price toward the $2,600 area.
ETH is now moving through an important:
Recovery → Breakout → Consolidation → Continuation
structure.
The major upside liquidity is concentrated around $2,627–$2,785. A decisive move through this zone would place $3,163.97 as the next major Fibonacci reference.
📊 RSI Momentum
RSI (14): 60.38
RSI remains above the neutral 50 level and is currently around 60, showing positive momentum.
The RSI signal line is around 59.90, keeping momentum relatively balanced near the 60 area.
A sustained RSI above 60 would support continued momentum, while a move back below 50 would indicate increasing short-term weakness.
🎯 Key Levels
🔴 Major Resistance: $2,627.42 → $2,784.60 → $3,163.97 → $3,543.34
🟢 Major Support: $2,538.00 → $2,529.05 → $2,503.11 → $2,479.36 → $2,454.11
📉 Dynamic EMA Support: $2,479.36 — 20 EMA | $2,319.51 — 50 EMA | $2,221.92 — 200 EMA | $2,188.20 — 100 EMA
🚀 Upside References: $2,784.60 → $3,163.97 → $3,543.34 → $4,083.46
📌 Final Outlook
ETH's broader structure remains constructive after the recent recovery, with price now holding around $2,577 and above the major $2,475–$2,540 support structure.
The $2,475–$2,540 area is now an important short-term support region, while $2,627–$2,785 remains the immediate major resistance zone.
A confirmed move above $2,784.60 could open the path toward $3,163.97, followed by $3,543.34 and potentially $4,083.46.
However, rejection from the upper resistance area followed by a sustained loss of $2,454.11 would weaken the current structure and bring the lower support zones back into focus.
Bias: 🟢 Recovery structure intact above $2,454.11. A sustained move above $2,784.60 could open the path toward $3,163.97, with $3,543.34 as the next major Fibonacci reference.
$ETH
{future}(ETHUSDT)
ETH Technical Outlook: Ethereum Holds Near $2.58K as Recovery Continues
ETH is currently trading around $2,577, holding above the $2,500–$2,540 support area after the recent recovery from the $2,280–$2,360 demand zone.
The broader recovery structure remains constructive, with price now approaching the important $2,627–$2,785 resistance zone. The $2,784.60 level is the major 0.382 Fibonacci reference on the chart.
📈 EMA Structure
20 EMA: $2,479.36
50 EMA: $2,319.51
100 EMA: $2,188.20
200 EMA: $2,221.92
ETH is currently trading well above the 20 EMA at $2,479.36.
The recovery above the 50 EMA at $2,319.51, 100 EMA at $2,188.20, and 200 EMA at $2,221.92 keeps the broader recovery structure constructive.
The 20 EMA is now acting as an important dynamic reference. A sustained hold above this level would keep the short-term structure supported.
📐 Fibonacci Levels
Key Fibonacci levels:
0.236: $2,315.21
0.382: $2,784.60
0.5: $3,163.97
0.618: $3,543.34
0.786: $4,083.46
1.0: $4,771.47
ETH has moved significantly above the 0.236 Fibonacci level at $2,315.21.
The next major Fibonacci resistance is $2,784.60 — 0.382 Fib.
A sustained move through the $2,627–$2,785 resistance structure would bring the higher Fibonacci levels into focus.
🟢 Upside Scenario
ETH is consolidating near $2,577 after the recent recovery and is now approaching the upper resistance structure.
Immediate resistance:
$2,577.77
$2,627.42
$2,784.60 — 0.382 Fibonacci
$3,163.97 — 0.5 Fibonacci
$3,543.34 — 0.618 Fibonacci
A clean breakout and sustained close above the $2,627–$2,785 zone would provide stronger confirmation of continued recovery.
🎯 Target 1: $2,627.42
🎯 Target 2: $2,784.60 — 0.382 Fibonacci
🎯 Target 3: $3,163.97 — 0.5 Fibonacci
🎯 Target 4: $3,543.34 — 0.618 Fibonacci
🎯 Target 5: $4,083.46 — 0.786 Fibonacci
🎯 Target 6: $4,771.47 — 1.0 Fibonacci
A sustained move above $2,784.60 could strengthen the medium-term recovery structure and bring the $3,164–$3,543 region into focus.
🔴 Pullback Scenario
After the recent expansion, a retest of the breakout area would be normal.
Key supports:
$2,538.00
$2,529.05
$2,503.11
$2,479.36 — 20 EMA
$2,479.06
$2,475.84
$2,454.11
$2,405.75
$2,319.51 — 50 EMA
The $2,475–$2,540 zone is particularly important.
If ETH continues to hold this area during a pullback, the current recovery structure remains active.
A sustained loss of the $2,475–$2,454 area would weaken the short-term structure and could expose the lower $2,405–$2,320 region.
🧠 Market Structure & Liquidity
ETH has formed a clear recovery structure after sweeping liquidity around the $2,280–$2,360 region.
The recent move produced a strong breakout from the previous consolidation and pushed price toward the $2,600 area.
ETH is now moving through an important:
Recovery → Breakout → Consolidation → Continuation
structure.
The major upside liquidity is concentrated around $2,627–$2,785. A decisive move through this zone would place $3,163.97 as the next major Fibonacci reference.
📊 RSI Momentum
RSI (14): 60.38
RSI remains above the neutral 50 level and is currently around 60, showing positive momentum.
The RSI signal line is around 59.90, keeping momentum relatively balanced near the 60 area.
A sustained RSI above 60 would support continued momentum, while a move back below 50 would indicate increasing short-term weakness.
🎯 Key Levels
🔴 Major Resistance: $2,627.42 → $2,784.60 → $3,163.97 → $3,543.34
🟢 Major Support: $2,538.00 → $2,529.05 → $2,503.11 → $2,479.36 → $2,454.11
📉 Dynamic EMA Support: $2,479.36 — 20 EMA | $2,319.51 — 50 EMA | $2,221.92 — 200 EMA | $2,188.20 — 100 EMA
🚀 Upside References: $2,784.60 → $3,163.97 → $3,543.34 → $4,083.46
📌 Final Outlook
ETH's broader structure remains constructive after the recent recovery, with price now holding around $2,577 and above the major $2,475–$2,540 support structure.
The $2,475–$2,540 area is now an important short-term support region, while $2,627–$2,785 remains the immediate major resistance zone.
A confirmed move above $2,784.60 could open the path toward $3,163.97, followed by $3,543.34 and potentially $4,083.46.
However, rejection from the upper resistance area followed by a sustained loss of $2,454.11 would weaken the current structure and bring the lower support zones back into focus.
Bias: 🟢 Recovery structure intact above $2,454.11. A sustained move above $2,784.60 could open the path toward $3,163.97, with $3,543.34 as the next major Fibonacci reference.
$ETH
The broader recovery structure remains constructive, with price now approaching the important $2,627–$2,785 resistance zone. The $2,784.60 level is the major 0.382 Fibonacci reference on the chart.
📈 EMA Structure
20 EMA: $2,479.36
50 EMA: $2,319.51
100 EMA: $2,188.20
200 EMA: $2,221.92
ETH is currently trading well above the 20 EMA at $2,479.36.
The recovery above the 50 EMA at $2,319.51, 100 EMA at $2,188.20, and 200 EMA at $2,221.92 keeps the broader recovery structure constructive.
The 20 EMA is now acting as an important dynamic reference. A sustained hold above this level would keep the short-term structure supported.
📐 Fibonacci Levels
Key Fibonacci levels:
0.236: $2,315.21
0.382: $2,784.60
0.5: $3,163.97
0.618: $3,543.34
0.786: $4,083.46
1.0: $4,771.47
ETH has moved significantly above the 0.236 Fibonacci level at $2,315.21.
The next major Fibonacci resistance is $2,784.60 — 0.382 Fib.
A sustained move through the $2,627–$2,785 resistance structure would bring the higher Fibonacci levels into focus.
🟢 Upside Scenario
ETH is consolidating near $2,577 after the recent recovery and is now approaching the upper resistance structure.
Immediate resistance:
$2,577.77
$2,627.42
$2,784.60 — 0.382 Fibonacci
$3,163.97 — 0.5 Fibonacci
$3,543.34 — 0.618 Fibonacci
A clean breakout and sustained close above the $2,627–$2,785 zone would provide stronger confirmation of continued recovery.
🎯 Target 1: $2,627.42
🎯 Target 2: $2,784.60 — 0.382 Fibonacci
🎯 Target 3: $3,163.97 — 0.5 Fibonacci
🎯 Target 4: $3,543.34 — 0.618 Fibonacci
🎯 Target 5: $4,083.46 — 0.786 Fibonacci
🎯 Target 6: $4,771.47 — 1.0 Fibonacci
A sustained move above $2,784.60 could strengthen the medium-term recovery structure and bring the $3,164–$3,543 region into focus.
🔴 Pullback Scenario
After the recent expansion, a retest of the breakout area would be normal.
Key supports:
$2,538.00
$2,529.05
$2,503.11
$2,479.36 — 20 EMA
$2,479.06
$2,475.84
$2,454.11
$2,405.75
$2,319.51 — 50 EMA
The $2,475–$2,540 zone is particularly important.
If ETH continues to hold this area during a pullback, the current recovery structure remains active.
A sustained loss of the $2,475–$2,454 area would weaken the short-term structure and could expose the lower $2,405–$2,320 region.
🧠 Market Structure & Liquidity
ETH has formed a clear recovery structure after sweeping liquidity around the $2,280–$2,360 region.
The recent move produced a strong breakout from the previous consolidation and pushed price toward the $2,600 area.
ETH is now moving through an important:
Recovery → Breakout → Consolidation → Continuation
structure.
The major upside liquidity is concentrated around $2,627–$2,785. A decisive move through this zone would place $3,163.97 as the next major Fibonacci reference.
📊 RSI Momentum
RSI (14): 60.38
RSI remains above the neutral 50 level and is currently around 60, showing positive momentum.
The RSI signal line is around 59.90, keeping momentum relatively balanced near the 60 area.
A sustained RSI above 60 would support continued momentum, while a move back below 50 would indicate increasing short-term weakness.
🎯 Key Levels
🔴 Major Resistance: $2,627.42 → $2,784.60 → $3,163.97 → $3,543.34
🟢 Major Support: $2,538.00 → $2,529.05 → $2,503.11 → $2,479.36 → $2,454.11
📉 Dynamic EMA Support: $2,479.36 — 20 EMA | $2,319.51 — 50 EMA | $2,221.92 — 200 EMA | $2,188.20 — 100 EMA
🚀 Upside References: $2,784.60 → $3,163.97 → $3,543.34 → $4,083.46
📌 Final Outlook
ETH's broader structure remains constructive after the recent recovery, with price now holding around $2,577 and above the major $2,475–$2,540 support structure.
The $2,475–$2,540 area is now an important short-term support region, while $2,627–$2,785 remains the immediate major resistance zone.
A confirmed move above $2,784.60 could open the path toward $3,163.97, followed by $3,543.34 and potentially $4,083.46.
However, rejection from the upper resistance area followed by a sustained loss of $2,454.11 would weaken the current structure and bring the lower support zones back into focus.
Bias: 🟢 Recovery structure intact above $2,454.11. A sustained move above $2,784.60 could open the path toward $3,163.97, with $3,543.34 as the next major Fibonacci reference.
$ETH
65
·
--
Artikel
Übersetzung ansehen
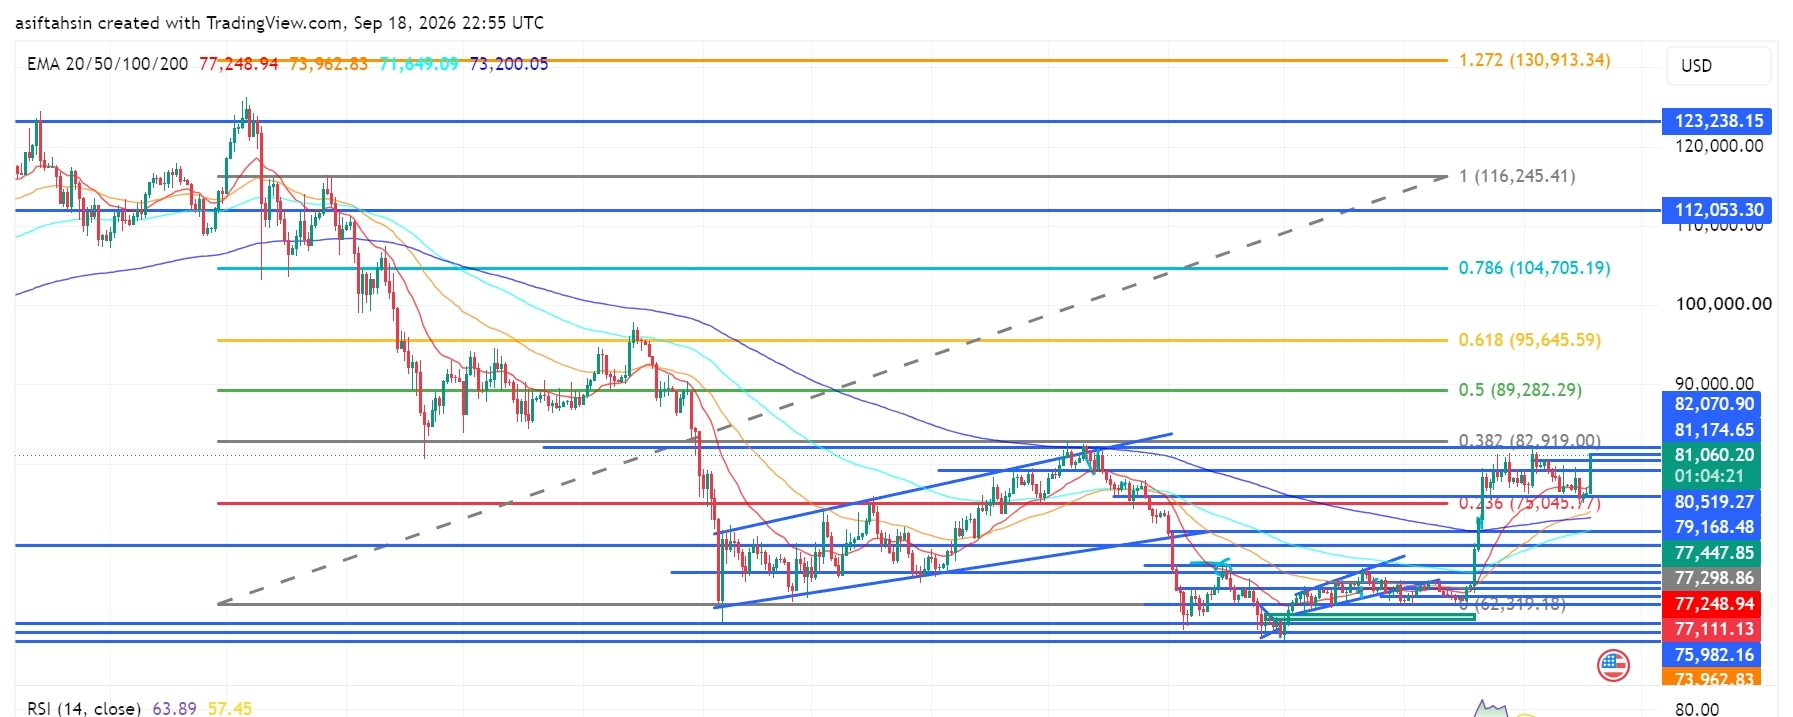
BTC Technical Outlook: Bitcoin Reclaims $81K as Recovery Structure StrengthensBTC is currently trading around $81,060, holding above the $79,000–$80,000 region after the recent recovery from the $73,000–$76,000 demand area.
The broader structure has improved, with price reclaiming the $80K area and moving back toward the major $82,070–$82,919 resistance zone. A sustained move through this area would put the higher Fibonacci levels back into focus.
📈 EMA Structure
20 EMA: $77,248.95
50 EMA: $73,962.83
100 EMA: $71,649.09
200 EMA: $73,200.05
BTC is currently trading well above the 20 EMA at $77,248.95.
The recovery above the 50 EMA at $73,962.83, 100 EMA at $71,649.09, and 200 EMA at $73,200.05 keeps the broader recovery structure constructive.
The 20 EMA has moved above the longer-term EMA levels, showing improving short-term structure.
📐 Fibonacci Levels
Key Fibonacci levels:
0.236: $75,045.77
0.382: $82,919.00
0.5: $89,282.29
0.618: $95,645.59
0.786: $104,705.19
1.0: $116,245.41
1.272: $130,913.34
BTC is currently trading between the 0.236 and 0.382 Fibonacci levels.
The next major Fibonacci reference is $82,919 — 0.382 Fib.
A sustained move above the $82,070–$82,919 zone could bring $89,282 into focus, followed by $95,645.
🟢 Bullish Scenario
BTC has recovered strongly from the lower support structure and is now consolidating around $80K–$81K.
Immediate resistance:
$81,174.65
$82,070.90
$82,919.00 — 0.382 Fibonacci
$89,282.29 — 0.5 Fibonacci
$95,645.59 — 0.618 Fibonacci
A clean breakout and sustained close above $82,070–$82,919 would provide stronger confirmation of continued recovery.
🎯 Target 1: $82,070
🎯 Target 2: $82,919 — 0.382 Fibonacci
🎯 Target 3: $89,282 — 0.5 Fibonacci
🎯 Target 4: $95,645 — 0.618 Fibonacci
🎯 Target 5: $104,705 — 0.786 Fibonacci
🎯 Target 6: $116,245 — 1.0 Fibonacci
A confirmed move through the $82K–$83K zone could strengthen the medium-term recovery structure and bring the $89K–$95K region into focus.
🔴 Pullback Scenario
After the recent expansion above $80K, a retest of the breakout area would be normal.
Key supports:
$80,519.27
$79,168.48
$77,447.85
$77,298.86
$77,248.95 — 20 EMA
$77,111.13
$75,982.16
$75,045.77 — 0.236 Fibonacci
$73,962.83 — 50 EMA
$73,200.05 — 200 EMA
The $77K–$80K zone is particularly important.
If BTC continues to hold this area during a pullback, the current recovery structure remains active.
A sustained loss of $75,045 would weaken the current recovery structure and bring the lower EMA region back into focus.
🧠 Market Structure & Liquidity
BTC has formed a recovery structure after sweeping liquidity around the $73K–$76K region.
The recent move produced a strong recovery through $77K, followed by a breakout above $80K.
BTC is now moving through an important:
Recovery → Breakout → Retest → Consolidation → Continuation
structure.
The major upside liquidity is concentrated around $81K–$83K. A decisive move through this area would place $89,282 as the next major Fibonacci reference.
📊 RSI Momentum
RSI (14): 63.89
RSI has moved above the neutral 50 level and remains in positive territory after the recent expansion.
The current reading shows stronger short-term momentum, while still remaining below the traditional 70 overbought threshold.
A sustained RSI above 60 would keep momentum supportive, while a move back below 50 would indicate increasing short-term weakness.
🎯 Key Levels
🔴 Major Resistance: $81,174.65 → $82,070.90 → $82,919 → $89,282 → $95,645
🟢 Major Support: $80,519 → $79,168 → $77,447 → $77,249 → $75,982 → $75,045
📉 Dynamic EMA Support: $77,248.95 — 20 EMA | $73,962.83 — 50 EMA | $73,200.05 — 200 EMA | $71,649.09 — 100 EMA
🚀 Upside References: $82,919 → $89,282 → $95,645 → $104,705 → $116,245
📌 Final Outlook
BTC's broader structure has strengthened after the recent recovery, with price now holding around $81K and above the major $77K–$80K support structure.
The $77K–$80K area is now an important short-term support region, while $82K–$83K remains the immediate major resistance zone.
A confirmed move above $82,919 could open the path toward $89,282, followed by $95,645 and $104,705.
However, rejection from the upper resistance area followed by a sustained loss of $75,045 would weaken the current recovery structure and bring the lower support zones back into focus.
Bias: 🟢 Recovery structure intact above $75,045. A sustained move above $82,919 could open the path toward $89,282, with $95,645 as the next major Fibonacci reference.
$BTC
{future}(BTCUSDT)
BTC Technical Outlook: Bitcoin Reclaims $81K as Recovery Structure Strengthens
BTC is currently trading around $81,060, holding above the $79,000–$80,000 region after the recent recovery from the $73,000–$76,000 demand area.
The broader structure has improved, with price reclaiming the $80K area and moving back toward the major $82,070–$82,919 resistance zone. A sustained move through this area would put the higher Fibonacci levels back into focus.
📈 EMA Structure
20 EMA: $77,248.95
50 EMA: $73,962.83
100 EMA: $71,649.09
200 EMA: $73,200.05
BTC is currently trading well above the 20 EMA at $77,248.95.
The recovery above the 50 EMA at $73,962.83, 100 EMA at $71,649.09, and 200 EMA at $73,200.05 keeps the broader recovery structure constructive.
The 20 EMA has moved above the longer-term EMA levels, showing improving short-term structure.
📐 Fibonacci Levels
Key Fibonacci levels:
0.236: $75,045.77
0.382: $82,919.00
0.5: $89,282.29
0.618: $95,645.59
0.786: $104,705.19
1.0: $116,245.41
1.272: $130,913.34
BTC is currently trading between the 0.236 and 0.382 Fibonacci levels.
The next major Fibonacci reference is $82,919 — 0.382 Fib.
A sustained move above the $82,070–$82,919 zone could bring $89,282 into focus, followed by $95,645.
🟢 Bullish Scenario
BTC has recovered strongly from the lower support structure and is now consolidating around $80K–$81K.
Immediate resistance:
$81,174.65
$82,070.90
$82,919.00 — 0.382 Fibonacci
$89,282.29 — 0.5 Fibonacci
$95,645.59 — 0.618 Fibonacci
A clean breakout and sustained close above $82,070–$82,919 would provide stronger confirmation of continued recovery.
🎯 Target 1: $82,070
🎯 Target 2: $82,919 — 0.382 Fibonacci
🎯 Target 3: $89,282 — 0.5 Fibonacci
🎯 Target 4: $95,645 — 0.618 Fibonacci
🎯 Target 5: $104,705 — 0.786 Fibonacci
🎯 Target 6: $116,245 — 1.0 Fibonacci
A confirmed move through the $82K–$83K zone could strengthen the medium-term recovery structure and bring the $89K–$95K region into focus.
🔴 Pullback Scenario
After the recent expansion above $80K, a retest of the breakout area would be normal.
Key supports:
$80,519.27
$79,168.48
$77,447.85
$77,298.86
$77,248.95 — 20 EMA
$77,111.13
$75,982.16
$75,045.77 — 0.236 Fibonacci
$73,962.83 — 50 EMA
$73,200.05 — 200 EMA
The $77K–$80K zone is particularly important.
If BTC continues to hold this area during a pullback, the current recovery structure remains active.
A sustained loss of $75,045 would weaken the current recovery structure and bring the lower EMA region back into focus.
🧠 Market Structure & Liquidity
BTC has formed a recovery structure after sweeping liquidity around the $73K–$76K region.
The recent move produced a strong recovery through $77K, followed by a breakout above $80K.
BTC is now moving through an important:
Recovery → Breakout → Retest → Consolidation → Continuation
structure.
The major upside liquidity is concentrated around $81K–$83K. A decisive move through this area would place $89,282 as the next major Fibonacci reference.
📊 RSI Momentum
RSI (14): 63.89
RSI has moved above the neutral 50 level and remains in positive territory after the recent expansion.
The current reading shows stronger short-term momentum, while still remaining below the traditional 70 overbought threshold.
A sustained RSI above 60 would keep momentum supportive, while a move back below 50 would indicate increasing short-term weakness.
🎯 Key Levels
🔴 Major Resistance: $81,174.65 → $82,070.90 → $82,919 → $89,282 → $95,645
🟢 Major Support: $80,519 → $79,168 → $77,447 → $77,249 → $75,982 → $75,045
📉 Dynamic EMA Support: $77,248.95 — 20 EMA | $73,962.83 — 50 EMA | $73,200.05 — 200 EMA | $71,649.09 — 100 EMA
🚀 Upside References: $82,919 → $89,282 → $95,645 → $104,705 → $116,245
📌 Final Outlook
BTC's broader structure has strengthened after the recent recovery, with price now holding around $81K and above the major $77K–$80K support structure.
The $77K–$80K area is now an important short-term support region, while $82K–$83K remains the immediate major resistance zone.
A confirmed move above $82,919 could open the path toward $89,282, followed by $95,645 and $104,705.
However, rejection from the upper resistance area followed by a sustained loss of $75,045 would weaken the current recovery structure and bring the lower support zones back into focus.
Bias: 🟢 Recovery structure intact above $75,045. A sustained move above $82,919 could open the path toward $89,282, with $95,645 as the next major Fibonacci reference.
$BTC
The broader structure has improved, with price reclaiming the $80K area and moving back toward the major $82,070–$82,919 resistance zone. A sustained move through this area would put the higher Fibonacci levels back into focus.
📈 EMA Structure
20 EMA: $77,248.95
50 EMA: $73,962.83
100 EMA: $71,649.09
200 EMA: $73,200.05
BTC is currently trading well above the 20 EMA at $77,248.95.
The recovery above the 50 EMA at $73,962.83, 100 EMA at $71,649.09, and 200 EMA at $73,200.05 keeps the broader recovery structure constructive.
The 20 EMA has moved above the longer-term EMA levels, showing improving short-term structure.
📐 Fibonacci Levels
Key Fibonacci levels:
0.236: $75,045.77
0.382: $82,919.00
0.5: $89,282.29
0.618: $95,645.59
0.786: $104,705.19
1.0: $116,245.41
1.272: $130,913.34
BTC is currently trading between the 0.236 and 0.382 Fibonacci levels.
The next major Fibonacci reference is $82,919 — 0.382 Fib.
A sustained move above the $82,070–$82,919 zone could bring $89,282 into focus, followed by $95,645.
🟢 Bullish Scenario
BTC has recovered strongly from the lower support structure and is now consolidating around $80K–$81K.
Immediate resistance:
$81,174.65
$82,070.90
$82,919.00 — 0.382 Fibonacci
$89,282.29 — 0.5 Fibonacci
$95,645.59 — 0.618 Fibonacci
A clean breakout and sustained close above $82,070–$82,919 would provide stronger confirmation of continued recovery.
🎯 Target 1: $82,070
🎯 Target 2: $82,919 — 0.382 Fibonacci
🎯 Target 3: $89,282 — 0.5 Fibonacci
🎯 Target 4: $95,645 — 0.618 Fibonacci
🎯 Target 5: $104,705 — 0.786 Fibonacci
🎯 Target 6: $116,245 — 1.0 Fibonacci
A confirmed move through the $82K–$83K zone could strengthen the medium-term recovery structure and bring the $89K–$95K region into focus.
🔴 Pullback Scenario
After the recent expansion above $80K, a retest of the breakout area would be normal.
Key supports:
$80,519.27
$79,168.48
$77,447.85
$77,298.86
$77,248.95 — 20 EMA
$77,111.13
$75,982.16
$75,045.77 — 0.236 Fibonacci
$73,962.83 — 50 EMA
$73,200.05 — 200 EMA
The $77K–$80K zone is particularly important.
If BTC continues to hold this area during a pullback, the current recovery structure remains active.
A sustained loss of $75,045 would weaken the current recovery structure and bring the lower EMA region back into focus.
🧠 Market Structure & Liquidity
BTC has formed a recovery structure after sweeping liquidity around the $73K–$76K region.
The recent move produced a strong recovery through $77K, followed by a breakout above $80K.
BTC is now moving through an important:
Recovery → Breakout → Retest → Consolidation → Continuation
structure.
The major upside liquidity is concentrated around $81K–$83K. A decisive move through this area would place $89,282 as the next major Fibonacci reference.
📊 RSI Momentum
RSI (14): 63.89
RSI has moved above the neutral 50 level and remains in positive territory after the recent expansion.
The current reading shows stronger short-term momentum, while still remaining below the traditional 70 overbought threshold.
A sustained RSI above 60 would keep momentum supportive, while a move back below 50 would indicate increasing short-term weakness.
🎯 Key Levels
🔴 Major Resistance: $81,174.65 → $82,070.90 → $82,919 → $89,282 → $95,645
🟢 Major Support: $80,519 → $79,168 → $77,447 → $77,249 → $75,982 → $75,045
📉 Dynamic EMA Support: $77,248.95 — 20 EMA | $73,962.83 — 50 EMA | $73,200.05 — 200 EMA | $71,649.09 — 100 EMA
🚀 Upside References: $82,919 → $89,282 → $95,645 → $104,705 → $116,245
📌 Final Outlook
BTC's broader structure has strengthened after the recent recovery, with price now holding around $81K and above the major $77K–$80K support structure.
The $77K–$80K area is now an important short-term support region, while $82K–$83K remains the immediate major resistance zone.
A confirmed move above $82,919 could open the path toward $89,282, followed by $95,645 and $104,705.
However, rejection from the upper resistance area followed by a sustained loss of $75,045 would weaken the current recovery structure and bring the lower support zones back into focus.
Bias: 🟢 Recovery structure intact above $75,045. A sustained move above $82,919 could open the path toward $89,282, with $95,645 as the next major Fibonacci reference.
$BTC
12
·
--
Artikel
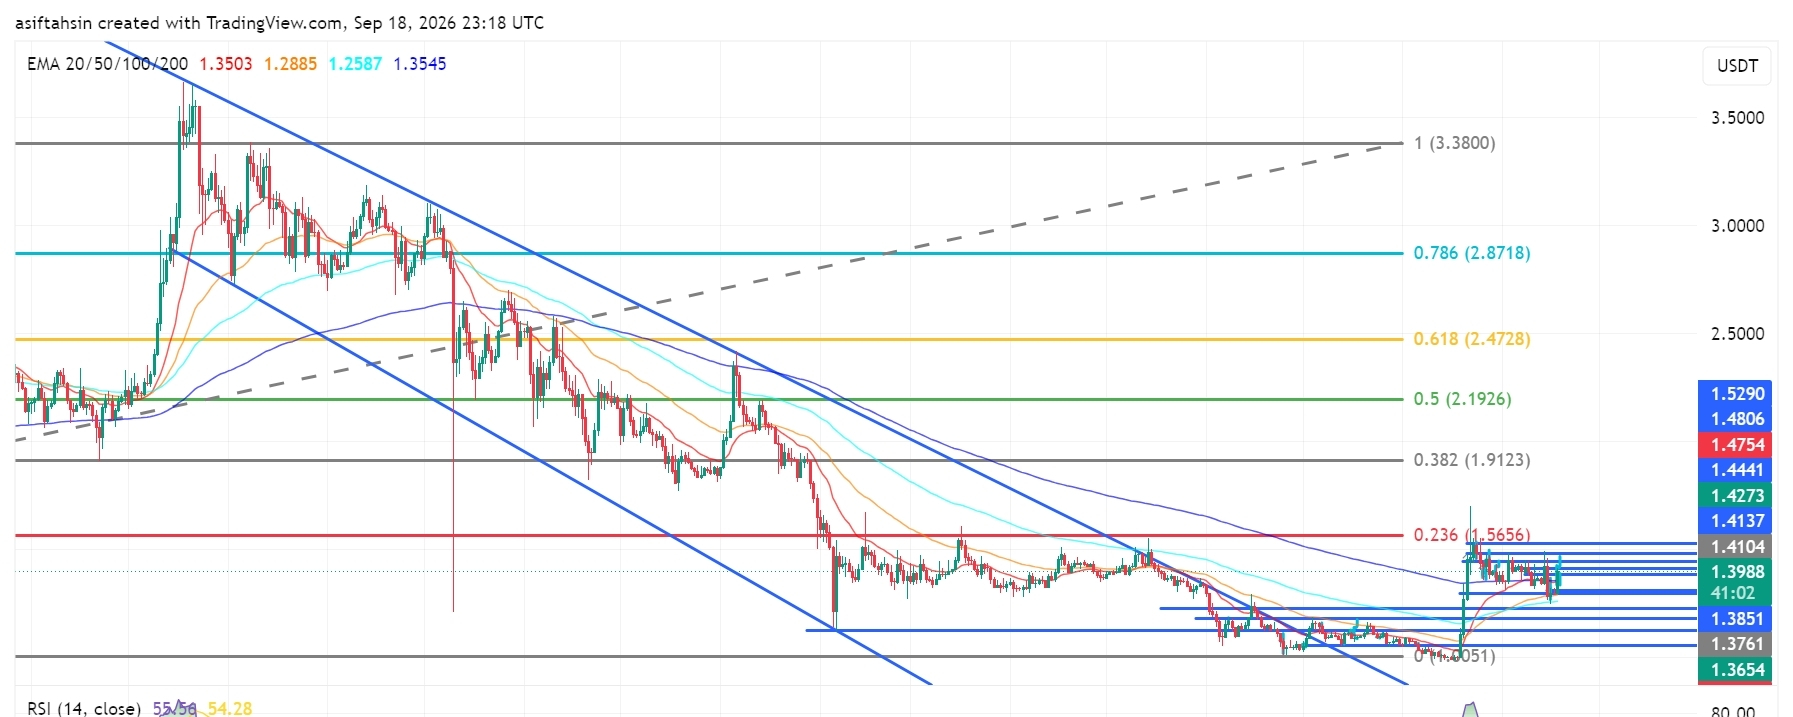
XRP-Technical-Outlook: XRP hält sich nahe $1.40, während die Bullen den Ausbruch verteidigenXRP handelt derzeit bei etwa $1.40 und konsolidiert nach einer starken Erholung von den August-Tiefs sowie nach einem deutlichen Ausbruch aus der vorherigen absteigenden Struktur.
Die übergeordnete Struktur hat sich deutlich verbessert: XRP handelt über den 20-, 50- und 100-EMAs. Allerdings trifft der Kurs nun auf einen wichtigen Widerstandsbereich um $1.41–$1.43. Die Bullen benötigen einen klaren Ausbruch über diese Zone, um eine weitere Aufwärtsausweitung zu bestätigen.
📈 EMA-Struktur
20 EMA: $1.3503
50 EMA: $1.2885
100 EMA: $1.2586
200 EMA: $1.3545
XRP handelt derzeit oberhalb aller vier wichtigen EMAs und sorgt damit für eine konstruktive Erholungstruktur.
XRP-Technical-Outlook: XRP hält sich nahe $1.40, während die Bullen den Ausbruch verteidigen
XRP handelt derzeit bei etwa $1.40 und konsolidiert nach einer starken Erholung von den August-Tiefs sowie nach einem deutlichen Ausbruch aus der vorherigen absteigenden Struktur.
Die übergeordnete Struktur hat sich deutlich verbessert: XRP handelt über den 20-, 50- und 100-EMAs. Allerdings trifft der Kurs nun auf einen wichtigen Widerstandsbereich um $1.41–$1.43. Die Bullen benötigen einen klaren Ausbruch über diese Zone, um eine weitere Aufwärtsausweitung zu bestätigen.
📈 EMA-Struktur
20 EMA: $1.3503
50 EMA: $1.2885
100 EMA: $1.2586
200 EMA: $1.3545
XRP handelt derzeit oberhalb aller vier wichtigen EMAs und sorgt damit für eine konstruktive Erholungstruktur.
Die übergeordnete Struktur hat sich deutlich verbessert: XRP handelt über den 20-, 50- und 100-EMAs. Allerdings trifft der Kurs nun auf einen wichtigen Widerstandsbereich um $1.41–$1.43. Die Bullen benötigen einen klaren Ausbruch über diese Zone, um eine weitere Aufwärtsausweitung zu bestätigen.
📈 EMA-Struktur
20 EMA: $1.3503
50 EMA: $1.2885
100 EMA: $1.2586
200 EMA: $1.3545
XRP handelt derzeit oberhalb aller vier wichtigen EMAs und sorgt damit für eine konstruktive Erholungstruktur.
276
·
--
Artikel
Übersetzung ansehen
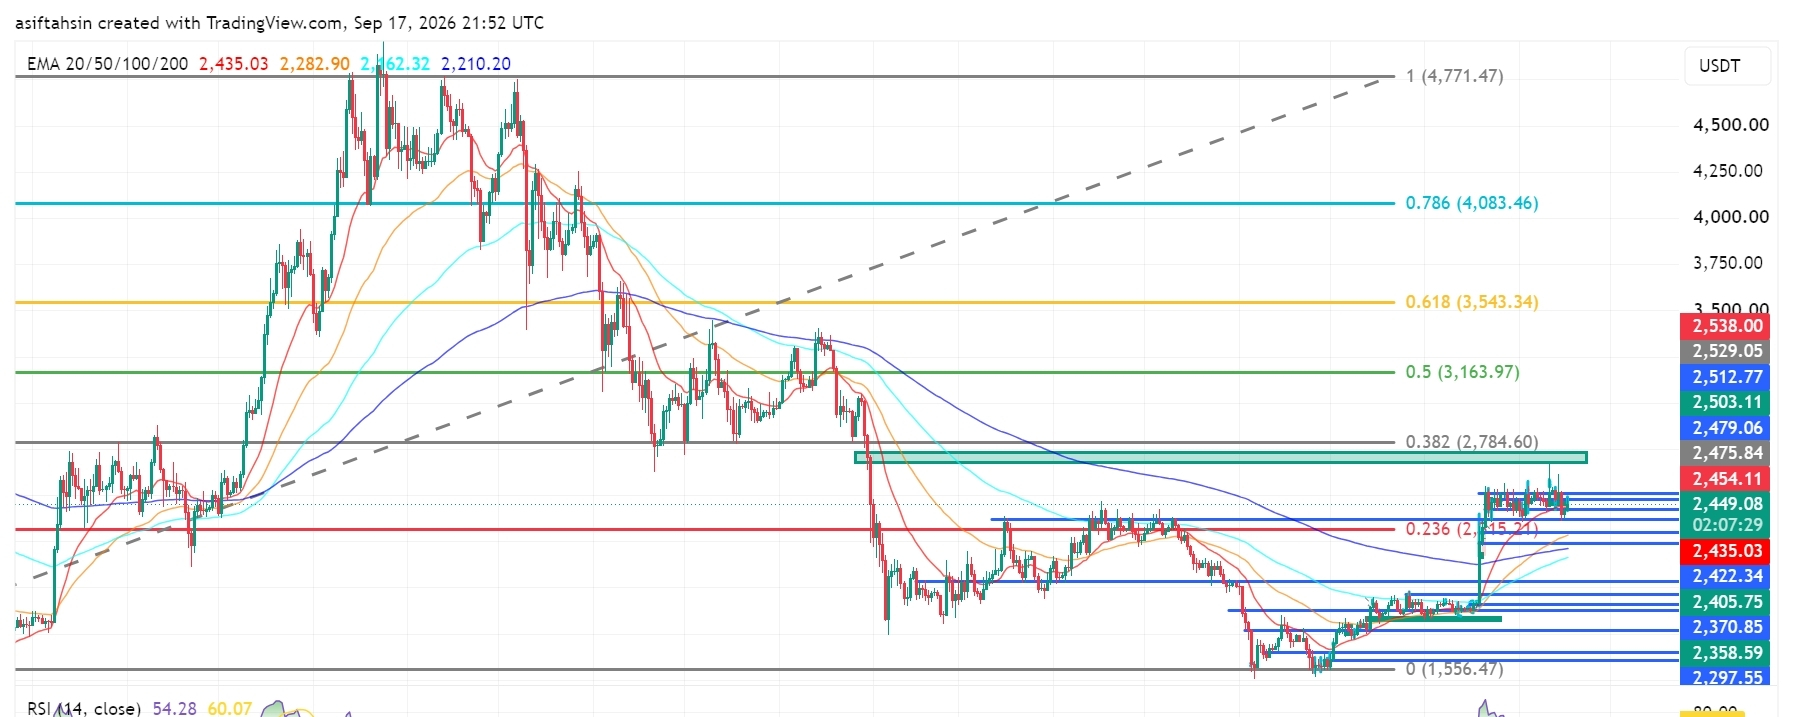
ETH Technical Outlook: Ethereum Holds Above $2.4K as Recovery Structure BuildsETH is currently trading around $2,450, holding above the $2,405–$2,435 support area after the recent recovery from the $2,300–$2,360 demand zone.
The broader structure is improving, but ETH is now consolidating below the $2,475–$2,538 resistance cluster. The next major chart area is around $2,784.60, which aligns with the 0.382 Fibonacci level.
📈 EMA Structure
20 EMA: $2,435.06
50 EMA: $2,282.92
100 EMA: $2,162.32
200 EMA: $2,210.20
ETH is currently trading above the 20 EMA at $2,435.06.
The recovery above the 50 EMA at $2,282.92, 100 EMA at $2,162.32, and 200 EMA at $2,210.20 keeps the broader recovery structure constructive.
A sustained hold above the 20 EMA would support short-term momentum, while losing the $2,210–$2,283 area would weaken the current structure.
📐 Fibonacci Levels
Key Fibonacci levels:
0.236: $2,315.21
0.382: $2,784.60
0.5: $3,163.97
0.618: $3,543.34
0.786: $4,083.46
1.0: $4,771.47
ETH is currently holding well above the 0.236 Fibonacci level at $2,315.21.
The next major Fibonacci resistance is $2,784.60 — 0.382 Fib.
A sustained move through the $2,475–$2,538 resistance structure could place the $2,784.60 region into focus.
🟢 Bullish Scenario
ETH is consolidating after the recent recovery and is currently holding above the $2,435 area.
Immediate resistance:
$2,454.11
$2,475.84
$2,479.06
$2,503.11
$2,512.77
$2,529.05
$2,538.00
$2,784.60 — 0.382 Fibonacci
A clean breakout and sustained close above the $2,529–$2,538 zone would provide stronger confirmation of continued recovery.
🎯 Target 1: $2,475.84
🎯 Target 2: $2,503.11
🎯 Target 3: $2,529.05
🎯 Target 4: $2,538.00
🎯 Target 5: $2,784.60 — 0.382 Fibonacci
🎯 Target 6: $3,163.97 — 0.5 Fibonacci
A confirmed move above $2,538 could strengthen the medium-term recovery structure and bring the $2,784–$3,164 region into focus.
🔴 Pullback Scenario
After the recent recovery, a retest of the breakout area would be normal.
Key supports:
$2,449.37
$2,435.06 — 20 EMA
$2,422.34
$2,405.75
$2,370.85
$2,358.59
$2,297.55
$2,282.92 — 50 EMA
$2,210.20 — 200 EMA
The $2,405–$2,435 zone is particularly important.
If ETH continues to hold this area during a pullback, the current recovery structure remains active.
A sustained loss of $2,282.92 would weaken the broader structure and could expose the $2,210–$2,162 area.
🧠 Market Structure & Liquidity
ETH has formed a clear recovery structure after sweeping liquidity around the $2,280–$2,360 region.
The recent move produced a strong recovery followed by a breakout above the previous consolidation area.
ETH is now moving through an important:
Recovery → Breakout → Retest → Consolidation
structure.
The major upside liquidity is concentrated around $2,475–$2,538. A decisive move through this zone would place $2,784.60 as the next major Fibonacci reference.
📊 RSI Momentum
RSI (14): 54.28
RSI remains above the neutral 50 level after the recent recovery.
The current reading shows moderately positive momentum, while the RSI signal line is around 60.07.
A sustained RSI move above 55–60 would indicate improving momentum toward the upper resistance area.
A move back below 50 would indicate increasing short-term momentum weakness.
🎯 Key Levels
🔴 Major Resistance: $2,454.11 → $2,475.84 → $2,503.11 → $2,529.05 → $2,538.00
🟢 Major Support: $2,435.06 → $2,422.34 → $2,405.75 → $2,370.85 → $2,358.59
📉 Dynamic EMA Support: $2,435.06 — 20 EMA | $2,282.92 — 50 EMA | $2,210.20 — 200 EMA | $2,162.32 — 100 EMA
🚀 Upside References: $2,538 → $2,784.60 → $3,163.97 → $3,543.34
📌 Final Outlook
ETH's broader structure remains constructive after the recent recovery, with price holding above the $2,405–$2,435 area.
The $2,405–$2,435 zone is now an important short-term support region. As long as ETH maintains this area, the current recovery structure remains active.
The immediate battle is around $2,475–$2,538. A confirmed move above $2,538 could open the path toward $2,784.60, followed by $3,163.97.
However, rejection from resistance followed by a sustained loss of $2,282.92 would weaken the broader structure and increase the possibility of a deeper retracement toward the $2,210–$2,162 area.
Bias: 🟢 Recovery structure intact above $2,282.92. A breakout above $2,538 could open the path toward $2,784.60, with $3,163.97 as the next major Fibonacci reference.
$ETH
{future}(ETHUSDT)
ETH Technical Outlook: Ethereum Holds Above $2.4K as Recovery Structure Builds
ETH is currently trading around $2,450, holding above the $2,405–$2,435 support area after the recent recovery from the $2,300–$2,360 demand zone.
The broader structure is improving, but ETH is now consolidating below the $2,475–$2,538 resistance cluster. The next major chart area is around $2,784.60, which aligns with the 0.382 Fibonacci level.
📈 EMA Structure
20 EMA: $2,435.06
50 EMA: $2,282.92
100 EMA: $2,162.32
200 EMA: $2,210.20
ETH is currently trading above the 20 EMA at $2,435.06.
The recovery above the 50 EMA at $2,282.92, 100 EMA at $2,162.32, and 200 EMA at $2,210.20 keeps the broader recovery structure constructive.
A sustained hold above the 20 EMA would support short-term momentum, while losing the $2,210–$2,283 area would weaken the current structure.
📐 Fibonacci Levels
Key Fibonacci levels:
0.236: $2,315.21
0.382: $2,784.60
0.5: $3,163.97
0.618: $3,543.34
0.786: $4,083.46
1.0: $4,771.47
ETH is currently holding well above the 0.236 Fibonacci level at $2,315.21.
The next major Fibonacci resistance is $2,784.60 — 0.382 Fib.
A sustained move through the $2,475–$2,538 resistance structure could place the $2,784.60 region into focus.
🟢 Bullish Scenario
ETH is consolidating after the recent recovery and is currently holding above the $2,435 area.
Immediate resistance:
$2,454.11
$2,475.84
$2,479.06
$2,503.11
$2,512.77
$2,529.05
$2,538.00
$2,784.60 — 0.382 Fibonacci
A clean breakout and sustained close above the $2,529–$2,538 zone would provide stronger confirmation of continued recovery.
🎯 Target 1: $2,475.84
🎯 Target 2: $2,503.11
🎯 Target 3: $2,529.05
🎯 Target 4: $2,538.00
🎯 Target 5: $2,784.60 — 0.382 Fibonacci
🎯 Target 6: $3,163.97 — 0.5 Fibonacci
A confirmed move above $2,538 could strengthen the medium-term recovery structure and bring the $2,784–$3,164 region into focus.
🔴 Pullback Scenario
After the recent recovery, a retest of the breakout area would be normal.
Key supports:
$2,449.37
$2,435.06 — 20 EMA
$2,422.34
$2,405.75
$2,370.85
$2,358.59
$2,297.55
$2,282.92 — 50 EMA
$2,210.20 — 200 EMA
The $2,405–$2,435 zone is particularly important.
If ETH continues to hold this area during a pullback, the current recovery structure remains active.
A sustained loss of $2,282.92 would weaken the broader structure and could expose the $2,210–$2,162 area.
🧠 Market Structure & Liquidity
ETH has formed a clear recovery structure after sweeping liquidity around the $2,280–$2,360 region.
The recent move produced a strong recovery followed by a breakout above the previous consolidation area.
ETH is now moving through an important:
Recovery → Breakout → Retest → Consolidation
structure.
The major upside liquidity is concentrated around $2,475–$2,538. A decisive move through this zone would place $2,784.60 as the next major Fibonacci reference.
📊 RSI Momentum
RSI (14): 54.28
RSI remains above the neutral 50 level after the recent recovery.
The current reading shows moderately positive momentum, while the RSI signal line is around 60.07.
A sustained RSI move above 55–60 would indicate improving momentum toward the upper resistance area.
A move back below 50 would indicate increasing short-term momentum weakness.
🎯 Key Levels
🔴 Major Resistance: $2,454.11 → $2,475.84 → $2,503.11 → $2,529.05 → $2,538.00
🟢 Major Support: $2,435.06 → $2,422.34 → $2,405.75 → $2,370.85 → $2,358.59
📉 Dynamic EMA Support: $2,435.06 — 20 EMA | $2,282.92 — 50 EMA | $2,210.20 — 200 EMA | $2,162.32 — 100 EMA
🚀 Upside References: $2,538 → $2,784.60 → $3,163.97 → $3,543.34
📌 Final Outlook
ETH's broader structure remains constructive after the recent recovery, with price holding above the $2,405–$2,435 area.
The $2,405–$2,435 zone is now an important short-term support region. As long as ETH maintains this area, the current recovery structure remains active.
The immediate battle is around $2,475–$2,538. A confirmed move above $2,538 could open the path toward $2,784.60, followed by $3,163.97.
However, rejection from resistance followed by a sustained loss of $2,282.92 would weaken the broader structure and increase the possibility of a deeper retracement toward the $2,210–$2,162 area.
Bias: 🟢 Recovery structure intact above $2,282.92. A breakout above $2,538 could open the path toward $2,784.60, with $3,163.97 as the next major Fibonacci reference.
$ETH
The broader structure is improving, but ETH is now consolidating below the $2,475–$2,538 resistance cluster. The next major chart area is around $2,784.60, which aligns with the 0.382 Fibonacci level.
📈 EMA Structure
20 EMA: $2,435.06
50 EMA: $2,282.92
100 EMA: $2,162.32
200 EMA: $2,210.20
ETH is currently trading above the 20 EMA at $2,435.06.
The recovery above the 50 EMA at $2,282.92, 100 EMA at $2,162.32, and 200 EMA at $2,210.20 keeps the broader recovery structure constructive.
A sustained hold above the 20 EMA would support short-term momentum, while losing the $2,210–$2,283 area would weaken the current structure.
📐 Fibonacci Levels
Key Fibonacci levels:
0.236: $2,315.21
0.382: $2,784.60
0.5: $3,163.97
0.618: $3,543.34
0.786: $4,083.46
1.0: $4,771.47
ETH is currently holding well above the 0.236 Fibonacci level at $2,315.21.
The next major Fibonacci resistance is $2,784.60 — 0.382 Fib.
A sustained move through the $2,475–$2,538 resistance structure could place the $2,784.60 region into focus.
🟢 Bullish Scenario
ETH is consolidating after the recent recovery and is currently holding above the $2,435 area.
Immediate resistance:
$2,454.11
$2,475.84
$2,479.06
$2,503.11
$2,512.77
$2,529.05
$2,538.00
$2,784.60 — 0.382 Fibonacci
A clean breakout and sustained close above the $2,529–$2,538 zone would provide stronger confirmation of continued recovery.
🎯 Target 1: $2,475.84
🎯 Target 2: $2,503.11
🎯 Target 3: $2,529.05
🎯 Target 4: $2,538.00
🎯 Target 5: $2,784.60 — 0.382 Fibonacci
🎯 Target 6: $3,163.97 — 0.5 Fibonacci
A confirmed move above $2,538 could strengthen the medium-term recovery structure and bring the $2,784–$3,164 region into focus.
🔴 Pullback Scenario
After the recent recovery, a retest of the breakout area would be normal.
Key supports:
$2,449.37
$2,435.06 — 20 EMA
$2,422.34
$2,405.75
$2,370.85
$2,358.59
$2,297.55
$2,282.92 — 50 EMA
$2,210.20 — 200 EMA
The $2,405–$2,435 zone is particularly important.
If ETH continues to hold this area during a pullback, the current recovery structure remains active.
A sustained loss of $2,282.92 would weaken the broader structure and could expose the $2,210–$2,162 area.
🧠 Market Structure & Liquidity
ETH has formed a clear recovery structure after sweeping liquidity around the $2,280–$2,360 region.
The recent move produced a strong recovery followed by a breakout above the previous consolidation area.
ETH is now moving through an important:
Recovery → Breakout → Retest → Consolidation
structure.
The major upside liquidity is concentrated around $2,475–$2,538. A decisive move through this zone would place $2,784.60 as the next major Fibonacci reference.
📊 RSI Momentum
RSI (14): 54.28
RSI remains above the neutral 50 level after the recent recovery.
The current reading shows moderately positive momentum, while the RSI signal line is around 60.07.
A sustained RSI move above 55–60 would indicate improving momentum toward the upper resistance area.
A move back below 50 would indicate increasing short-term momentum weakness.
🎯 Key Levels
🔴 Major Resistance: $2,454.11 → $2,475.84 → $2,503.11 → $2,529.05 → $2,538.00
🟢 Major Support: $2,435.06 → $2,422.34 → $2,405.75 → $2,370.85 → $2,358.59
📉 Dynamic EMA Support: $2,435.06 — 20 EMA | $2,282.92 — 50 EMA | $2,210.20 — 200 EMA | $2,162.32 — 100 EMA
🚀 Upside References: $2,538 → $2,784.60 → $3,163.97 → $3,543.34
📌 Final Outlook
ETH's broader structure remains constructive after the recent recovery, with price holding above the $2,405–$2,435 area.
The $2,405–$2,435 zone is now an important short-term support region. As long as ETH maintains this area, the current recovery structure remains active.
The immediate battle is around $2,475–$2,538. A confirmed move above $2,538 could open the path toward $2,784.60, followed by $3,163.97.
However, rejection from resistance followed by a sustained loss of $2,282.92 would weaken the broader structure and increase the possibility of a deeper retracement toward the $2,210–$2,162 area.
Bias: 🟢 Recovery structure intact above $2,282.92. A breakout above $2,538 could open the path toward $2,784.60, with $3,163.97 as the next major Fibonacci reference.
$ETH
75
·
--
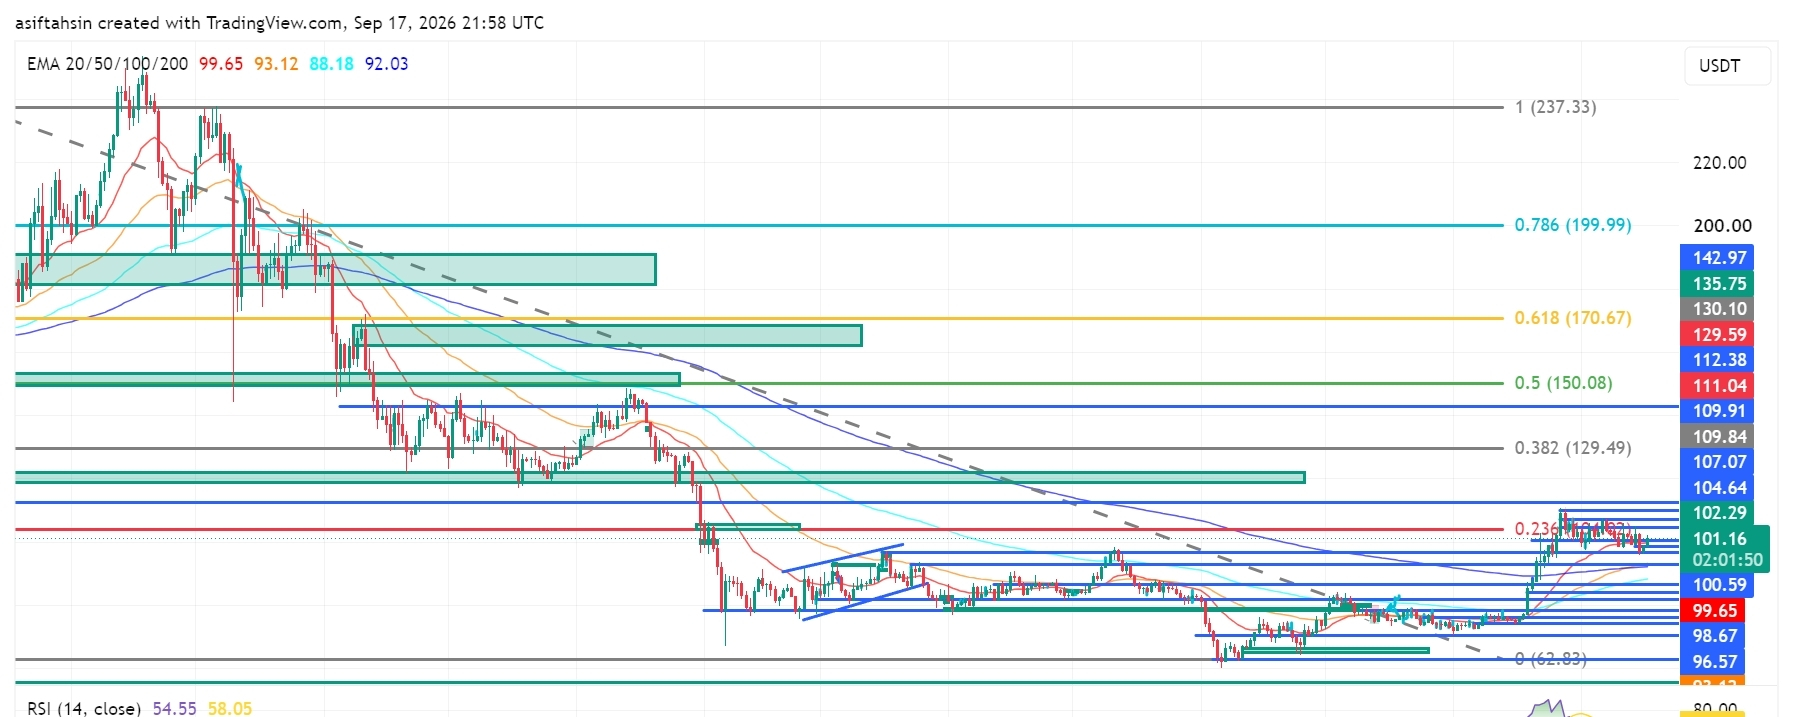
Artikel
Übersetzung ansehen
SOL Technical Outlook: Solana Holds Above $100 as Bulls Defend the RecoverySOL is currently trading around $101.16, holding above the $99–$100 breakout zone after the recent bullish expansion from the $92–$94 demand area.
The broader recovery structure remains constructive, but SOL is now consolidating below the $102.29–$107.07 resistance cluster. Bulls need to reclaim this area and break the $109.91–$112.38 zone for the next major upside expansion.
📈 EMA Structure
- 20 EMA: $99.65
- 50 EMA: $93.12
- 100 EMA: $88.18
- 200 EMA: $92.03
SOL is currently trading above the 20 EMA at $99.65.
The recovery above the 50 EMA at $93.12 and 200 EMA at $92.03 keeps the broader recovery structure intact.
A sustained hold above the 20 EMA would support short-term momentum, while losing the $93.12–$92.03 area would weaken the current structure.
📐 Fibonacci Levels
Key Fibonacci levels:
- 0.236: $104.64
- 0.382: $129.49
- 0.5: $150.08
- 0.618: $170.67
- 0.786: $199.99
- 1.0: $237.33
SOL is currently trading below the 0.236 Fibonacci level at $104.64.
The next major Fibonacci resistance is $129.49 — 0.382 Fib.
A sustained breakout through the $104–$112 resistance structure could open the path toward the $129.49 region.
🟢 Bullish Scenario
SOL is consolidating after the recent recovery and is currently maintaining acceptance above the $100 area.
Immediate resistance:
- $102.29
- $104.64 — 0.236 Fibonacci
- $107.07
- $109.84
- $109.91
- $111.04
- $112.38
A clean breakout and sustained close above $111.04–$112.38 would provide stronger confirmation of bullish continuation.
🎯 Target 1: $104.64
🎯 Target 2: $107.07
🎯 Target 3: $109.91
🎯 Target 4: $112.38
🎯 Target 5: $129.49 — 0.382 Fibonacci
🎯 Target 6: $150.08 — 0.5 Fibonacci
A confirmed breakout above the $111–$112 zone could strengthen the medium-term recovery structure and potentially accelerate SOL toward the $129–$150 region.
🔴 Pullback Scenario
After the recent bullish expansion, a retest of the breakout area would be normal.
Key supports:
- $100.59
- $99.65 — 20 EMA
- $98.67
- $96.57
- $93.12 — 50 EMA
- $92.94
- $92.03 — 200 EMA
- $88.18 — 100 EMA
The $96–$100 zone is particularly important.
If SOL continues to hold this area during a pullback, the current recovery structure remains active.
A sustained loss of $92.03 would weaken the current structure and could expose the $88.18 support zone.
🧠 Market Structure & Liquidity
SOL has formed a clear recovery structure after sweeping liquidity around the $92–$94 demand region.
The recent move produced a market-structure shift followed by a breakout and higher-low formation.
SOL is now moving through an important:
Breakout → Retest → Consolidation → Continuation
structure.
The major upside liquidity is concentrated around $102–$112. A decisive breakout above this zone would place $129.49 as the next major Fibonacci reference.
📊 RSI Momentum
RSI (14): 54.55
RSI remains above the neutral 50 level after cooling from the recent bullish expansion.
The current reading shows moderately positive momentum without reaching an extreme zone.
A sustained RSI move above 55–60 would indicate improving momentum toward the upper resistance area.
A move back below 50 would indicate increasing short-term momentum weakness.
🎯 Key Levels
🔴 Major Resistance: $102.29 → $104.64 → $107.07 → $109.91 → $111.04 → $112.38
🟢 Major Support: $100.59 → $99.65 → $98.67 → $96.57 → $93.12 → $92.03
📉 Dynamic EMA Support: $99.65 — 20 EMA | $93.12 — 50 EMA | $92.03 — 200 EMA | $88.18 — 100 EMA
🚀 Upside Targets: $112.38 → $129.49 → $150.08 → $170.67
📌 Final Outlook
SOL's broader structure remains constructive after the recent breakout, with price holding above the $99–$100 region.
The $96–$100 area is now an important short-term support region. As long as SOL maintains this area, the current recovery structure remains active.
The immediate battle is around $102–$112. A confirmed breakout above $112.38 could open the path toward $129.49, followed by $150.08 and potentially $170.67.
However, rejection from resistance followed by a sustained loss of $92.03 would weaken the current structure and increase the possibility of a deeper retracement toward the $88.18 area.
Bias: 🟢 Recovery structure intact above $92.03. A breakout above $112.38 could open the path toward $129.49, with $150.08 as the next major Fibonacci target.
$SOL
{future}(SOLUSDT)
SOL Technical Outlook: Solana Holds Above $100 as Bulls Defend the Recovery
SOL is currently trading around $101.16, holding above the $99–$100 breakout zone after the recent bullish expansion from the $92–$94 demand area.
The broader recovery structure remains constructive, but SOL is now consolidating below the $102.29–$107.07 resistance cluster. Bulls need to reclaim this area and break the $109.91–$112.38 zone for the next major upside expansion.
📈 EMA Structure
- 20 EMA: $99.65
- 50 EMA: $93.12
- 100 EMA: $88.18
- 200 EMA: $92.03
SOL is currently trading above the 20 EMA at $99.65.
The recovery above the 50 EMA at $93.12 and 200 EMA at $92.03 keeps the broader recovery structure intact.
A sustained hold above the 20 EMA would support short-term momentum, while losing the $93.12–$92.03 area would weaken the current structure.
📐 Fibonacci Levels
Key Fibonacci levels:
- 0.236: $104.64
- 0.382: $129.49
- 0.5: $150.08
- 0.618: $170.67
- 0.786: $199.99
- 1.0: $237.33
SOL is currently trading below the 0.236 Fibonacci level at $104.64.
The next major Fibonacci resistance is $129.49 — 0.382 Fib.
A sustained breakout through the $104–$112 resistance structure could open the path toward the $129.49 region.
🟢 Bullish Scenario
SOL is consolidating after the recent recovery and is currently maintaining acceptance above the $100 area.
Immediate resistance:
- $102.29
- $104.64 — 0.236 Fibonacci
- $107.07
- $109.84
- $109.91
- $111.04
- $112.38
A clean breakout and sustained close above $111.04–$112.38 would provide stronger confirmation of bullish continuation.
🎯 Target 1: $104.64
🎯 Target 2: $107.07
🎯 Target 3: $109.91
🎯 Target 4: $112.38
🎯 Target 5: $129.49 — 0.382 Fibonacci
🎯 Target 6: $150.08 — 0.5 Fibonacci
A confirmed breakout above the $111–$112 zone could strengthen the medium-term recovery structure and potentially accelerate SOL toward the $129–$150 region.
🔴 Pullback Scenario
After the recent bullish expansion, a retest of the breakout area would be normal.
Key supports:
- $100.59
- $99.65 — 20 EMA
- $98.67
- $96.57
- $93.12 — 50 EMA
- $92.94
- $92.03 — 200 EMA
- $88.18 — 100 EMA
The $96–$100 zone is particularly important.
If SOL continues to hold this area during a pullback, the current recovery structure remains active.
A sustained loss of $92.03 would weaken the current structure and could expose the $88.18 support zone.
🧠 Market Structure & Liquidity
SOL has formed a clear recovery structure after sweeping liquidity around the $92–$94 demand region.
The recent move produced a market-structure shift followed by a breakout and higher-low formation.
SOL is now moving through an important:
Breakout → Retest → Consolidation → Continuation
structure.
The major upside liquidity is concentrated around $102–$112. A decisive breakout above this zone would place $129.49 as the next major Fibonacci reference.
📊 RSI Momentum
RSI (14): 54.55
RSI remains above the neutral 50 level after cooling from the recent bullish expansion.
The current reading shows moderately positive momentum without reaching an extreme zone.
A sustained RSI move above 55–60 would indicate improving momentum toward the upper resistance area.
A move back below 50 would indicate increasing short-term momentum weakness.
🎯 Key Levels
🔴 Major Resistance: $102.29 → $104.64 → $107.07 → $109.91 → $111.04 → $112.38
🟢 Major Support: $100.59 → $99.65 → $98.67 → $96.57 → $93.12 → $92.03
📉 Dynamic EMA Support: $99.65 — 20 EMA | $93.12 — 50 EMA | $92.03 — 200 EMA | $88.18 — 100 EMA
🚀 Upside Targets: $112.38 → $129.49 → $150.08 → $170.67
📌 Final Outlook
SOL's broader structure remains constructive after the recent breakout, with price holding above the $99–$100 region.
The $96–$100 area is now an important short-term support region. As long as SOL maintains this area, the current recovery structure remains active.
The immediate battle is around $102–$112. A confirmed breakout above $112.38 could open the path toward $129.49, followed by $150.08 and potentially $170.67.
However, rejection from resistance followed by a sustained loss of $92.03 would weaken the current structure and increase the possibility of a deeper retracement toward the $88.18 area.
Bias: 🟢 Recovery structure intact above $92.03. A breakout above $112.38 could open the path toward $129.49, with $150.08 as the next major Fibonacci target.
$SOL
The broader recovery structure remains constructive, but SOL is now consolidating below the $102.29–$107.07 resistance cluster. Bulls need to reclaim this area and break the $109.91–$112.38 zone for the next major upside expansion.
📈 EMA Structure
- 20 EMA: $99.65
- 50 EMA: $93.12
- 100 EMA: $88.18
- 200 EMA: $92.03
SOL is currently trading above the 20 EMA at $99.65.
The recovery above the 50 EMA at $93.12 and 200 EMA at $92.03 keeps the broader recovery structure intact.
A sustained hold above the 20 EMA would support short-term momentum, while losing the $93.12–$92.03 area would weaken the current structure.
📐 Fibonacci Levels
Key Fibonacci levels:
- 0.236: $104.64
- 0.382: $129.49
- 0.5: $150.08
- 0.618: $170.67
- 0.786: $199.99
- 1.0: $237.33
SOL is currently trading below the 0.236 Fibonacci level at $104.64.
The next major Fibonacci resistance is $129.49 — 0.382 Fib.
A sustained breakout through the $104–$112 resistance structure could open the path toward the $129.49 region.
🟢 Bullish Scenario
SOL is consolidating after the recent recovery and is currently maintaining acceptance above the $100 area.
Immediate resistance:
- $102.29
- $104.64 — 0.236 Fibonacci
- $107.07
- $109.84
- $109.91
- $111.04
- $112.38
A clean breakout and sustained close above $111.04–$112.38 would provide stronger confirmation of bullish continuation.
🎯 Target 1: $104.64
🎯 Target 2: $107.07
🎯 Target 3: $109.91
🎯 Target 4: $112.38
🎯 Target 5: $129.49 — 0.382 Fibonacci
🎯 Target 6: $150.08 — 0.5 Fibonacci
A confirmed breakout above the $111–$112 zone could strengthen the medium-term recovery structure and potentially accelerate SOL toward the $129–$150 region.
🔴 Pullback Scenario
After the recent bullish expansion, a retest of the breakout area would be normal.
Key supports:
- $100.59
- $99.65 — 20 EMA
- $98.67
- $96.57
- $93.12 — 50 EMA
- $92.94
- $92.03 — 200 EMA
- $88.18 — 100 EMA
The $96–$100 zone is particularly important.
If SOL continues to hold this area during a pullback, the current recovery structure remains active.
A sustained loss of $92.03 would weaken the current structure and could expose the $88.18 support zone.
🧠 Market Structure & Liquidity
SOL has formed a clear recovery structure after sweeping liquidity around the $92–$94 demand region.
The recent move produced a market-structure shift followed by a breakout and higher-low formation.
SOL is now moving through an important:
Breakout → Retest → Consolidation → Continuation
structure.
The major upside liquidity is concentrated around $102–$112. A decisive breakout above this zone would place $129.49 as the next major Fibonacci reference.
📊 RSI Momentum
RSI (14): 54.55
RSI remains above the neutral 50 level after cooling from the recent bullish expansion.
The current reading shows moderately positive momentum without reaching an extreme zone.
A sustained RSI move above 55–60 would indicate improving momentum toward the upper resistance area.
A move back below 50 would indicate increasing short-term momentum weakness.
🎯 Key Levels
🔴 Major Resistance: $102.29 → $104.64 → $107.07 → $109.91 → $111.04 → $112.38
🟢 Major Support: $100.59 → $99.65 → $98.67 → $96.57 → $93.12 → $92.03
📉 Dynamic EMA Support: $99.65 — 20 EMA | $93.12 — 50 EMA | $92.03 — 200 EMA | $88.18 — 100 EMA
🚀 Upside Targets: $112.38 → $129.49 → $150.08 → $170.67
📌 Final Outlook
SOL's broader structure remains constructive after the recent breakout, with price holding above the $99–$100 region.
The $96–$100 area is now an important short-term support region. As long as SOL maintains this area, the current recovery structure remains active.
The immediate battle is around $102–$112. A confirmed breakout above $112.38 could open the path toward $129.49, followed by $150.08 and potentially $170.67.
However, rejection from resistance followed by a sustained loss of $92.03 would weaken the current structure and increase the possibility of a deeper retracement toward the $88.18 area.
Bias: 🟢 Recovery structure intact above $92.03. A breakout above $112.38 could open the path toward $129.49, with $150.08 as the next major Fibonacci target.
$SOL
73
·
--
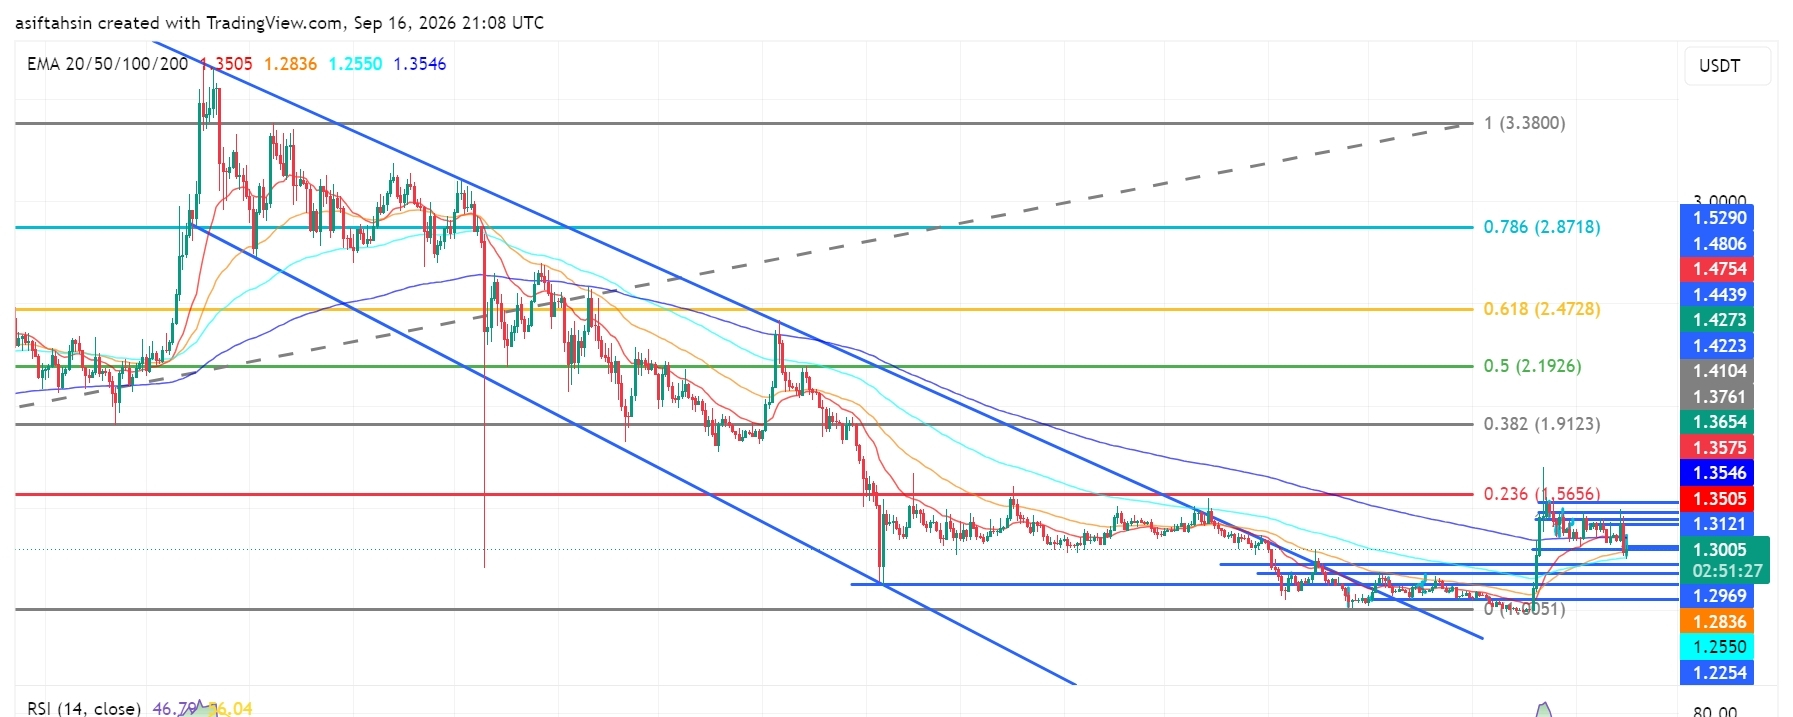
Artikel
XRP-Technischer Ausblick: XRP konsolidiert nahe $1.30 nach scharfem RücksetzerXRP handelt derzeit bei etwa $1.30 auf dem Chart, nachdem es eine scharfe Abweisung aus der $1.35–$1.43-Region gegeben hat. Der Kurs ist in Richtung des Ausbruchsbereichs zurückgekehrt, während der breitere Chart weiterhin eine Erholungsphase aus der $1.20–$1.25-Zone durchläuft. Aktuell ist die Dynamik neutral: Der RSI liegt unter 50.
📈 EMA-Struktur
20 EMA: $1.3505
50 EMA: $1.2836
100 EMA: $1.2550
200 EMA: $1.3546
XRP liegt derzeit unter der 20-EMA und der 200-EMA, während die 50- und 100-EMAs unter dem Kurs bleiben. Die Rückeroberung des $1.35-Bereichs würde die kurzfristige Struktur verbessern.
XRP-Technischer Ausblick: XRP konsolidiert nahe $1.30 nach scharfem Rücksetzer
XRP handelt derzeit bei etwa $1.30 auf dem Chart, nachdem es eine scharfe Abweisung aus der $1.35–$1.43-Region gegeben hat. Der Kurs ist in Richtung des Ausbruchsbereichs zurückgekehrt, während der breitere Chart weiterhin eine Erholungsphase aus der $1.20–$1.25-Zone durchläuft. Aktuell ist die Dynamik neutral: Der RSI liegt unter 50.
📈 EMA-Struktur
20 EMA: $1.3505
50 EMA: $1.2836
100 EMA: $1.2550
200 EMA: $1.3546
XRP liegt derzeit unter der 20-EMA und der 200-EMA, während die 50- und 100-EMAs unter dem Kurs bleiben. Die Rückeroberung des $1.35-Bereichs würde die kurzfristige Struktur verbessern.
📈 EMA-Struktur
20 EMA: $1.3505
50 EMA: $1.2836
100 EMA: $1.2550
200 EMA: $1.3546
XRP liegt derzeit unter der 20-EMA und der 200-EMA, während die 50- und 100-EMAs unter dem Kurs bleiben. Die Rückeroberung des $1.35-Bereichs würde die kurzfristige Struktur verbessern.
1
3
787
·
--
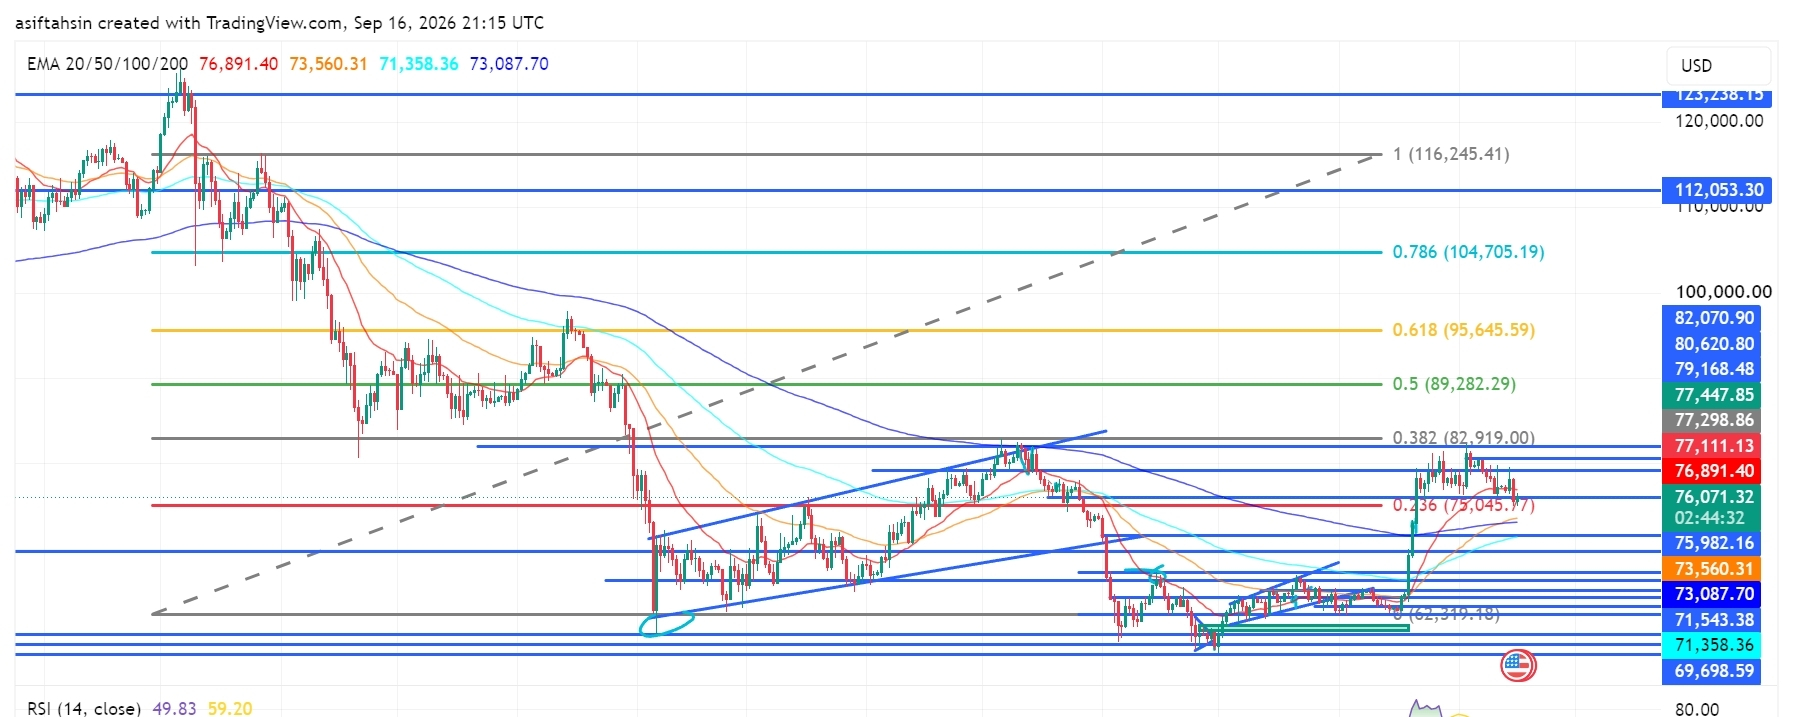
Artikel
BTC-Technischer Ausblick: Bitcoin konsolidiert unter $77K, während die Bullen die Erholung verteidigenBitcoin handelt rund um $76,9K und konsolidiert nach der jüngsten Erholung vom $69K–$71K-Nachfragebereich. Der Kurs bleibt oberhalb der wichtigen $75K-Unterstützungszone, aber der Schwung hat sich abgekühlt, da BTC unter der Widerstandsregion $77,1K–$82,9K bleibt. Der nächste Ausbruch oder Zusammenbruch sollte die kurzfristige Richtung bestimmen.
📈 EMA-Struktur
20 EMA: $76,891
50 EMA: $73,560
100 EMA: $71,358
200 EMA: $73,088
BTC befindet sich derzeit um die 20 EMA, während die 50/100/200 EMAs unter dem Kurs bleiben. Wenn $75K gehalten wird, bleibt die breitere Erholungsstruktur intakt, aber der Verlust der 20 EMA könnte einen tieferen Retest auslösen.
BTC-Technischer Ausblick: Bitcoin konsolidiert unter $77K, während die Bullen die Erholung verteidigen
Bitcoin handelt rund um $76,9K und konsolidiert nach der jüngsten Erholung vom $69K–$71K-Nachfragebereich. Der Kurs bleibt oberhalb der wichtigen $75K-Unterstützungszone, aber der Schwung hat sich abgekühlt, da BTC unter der Widerstandsregion $77,1K–$82,9K bleibt. Der nächste Ausbruch oder Zusammenbruch sollte die kurzfristige Richtung bestimmen.
📈 EMA-Struktur
20 EMA: $76,891
50 EMA: $73,560
100 EMA: $71,358
200 EMA: $73,088
BTC befindet sich derzeit um die 20 EMA, während die 50/100/200 EMAs unter dem Kurs bleiben. Wenn $75K gehalten wird, bleibt die breitere Erholungsstruktur intakt, aber der Verlust der 20 EMA könnte einen tieferen Retest auslösen.
📈 EMA-Struktur
20 EMA: $76,891
50 EMA: $73,560
100 EMA: $71,358
200 EMA: $73,088
BTC befindet sich derzeit um die 20 EMA, während die 50/100/200 EMAs unter dem Kurs bleiben. Wenn $75K gehalten wird, bleibt die breitere Erholungsstruktur intakt, aber der Verlust der 20 EMA könnte einen tieferen Retest auslösen.
61
·
--
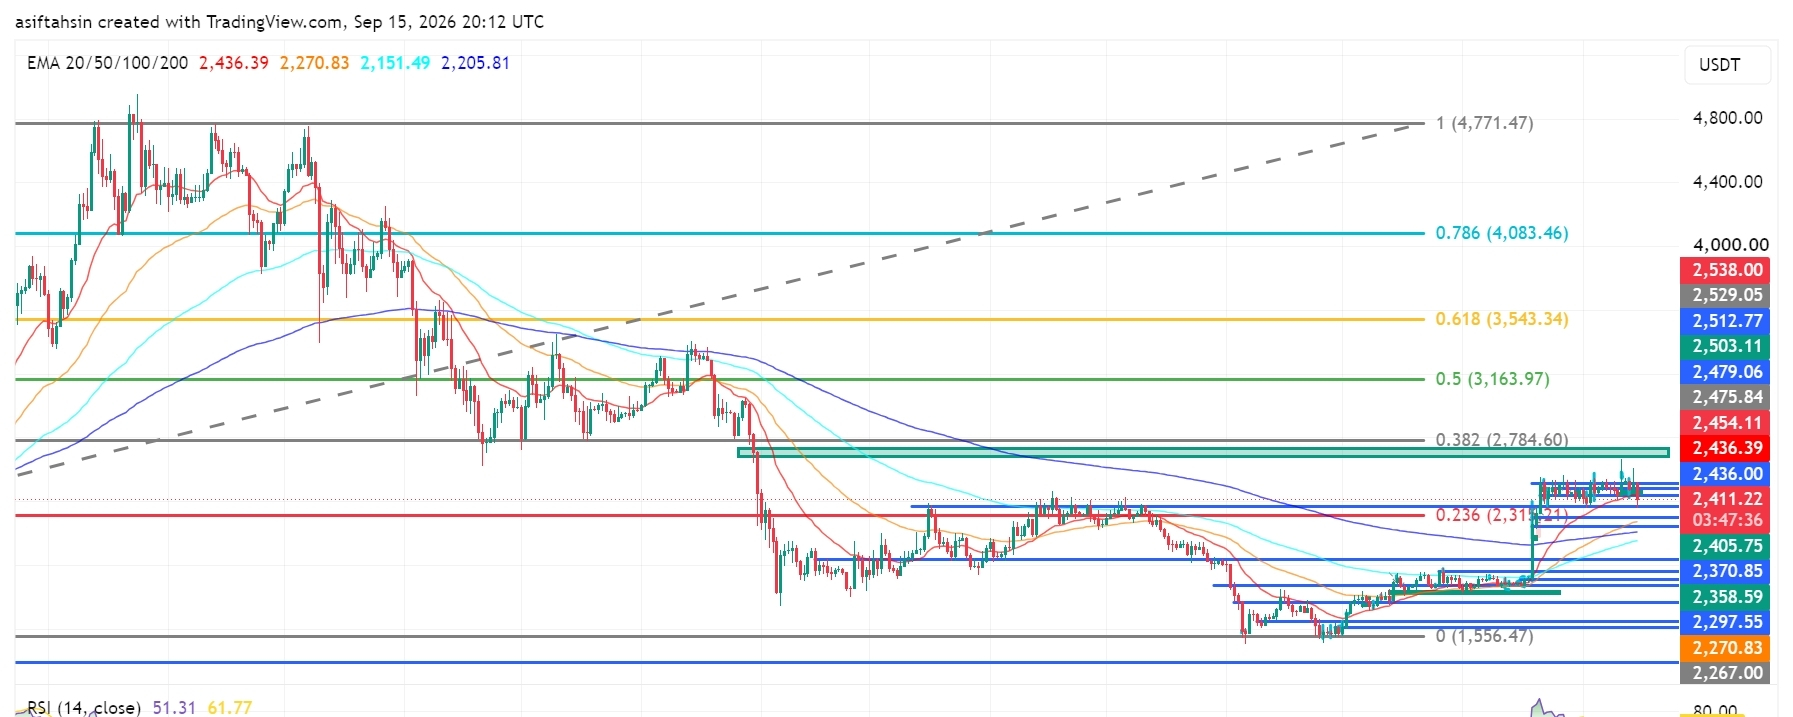
Artikel
Übersetzung ansehen
SOL Technical Outlook: Solana Holds Near $100 as Bulls Defend the BreakoutSOL is currently trading around $99.6, holding near the $99–$100 breakout zone after the recent bullish expansion from the $92–$94 demand area.
The broader recovery structure remains constructive, but SOL is now consolidating below the $100.59–$104.64 resistance cluster. Bulls need to reclaim this area and break the $107.07–$109.91 zone for the next major upside expansion.
📈 EMA Structure
20 EMA: $99.62
50 EMA: $92.58
100 EMA: $87.71
200 EMA: $91.88
SOL is currently testing the 20 EMA at $99.62.
The recovery above the 50 EMA at $92.58 and 200 EMA at $91.88 keeps the broader recovery structure intact.
A sustained hold above the 20 EMA would strengthen short-term momentum, while losing the $92.58–$91.88 area would weaken the current structure.
📐 Fibonacci Levels
Key Fibonacci levels:
0.236: $100.02
0.382: $129.49
0.5: $150.08
0.618: $170.67
0.786: $199.99
1.0: $237.33
SOL is currently testing the 0.236 Fibonacci region around $100.02.
The next major Fibonacci resistance is $129.49 — 0.382 Fib.
A sustained breakout above the $100–$107 resistance structure could open the path toward the $129.49 region.
🟢 Bullish Scenario
SOL is consolidating after the recent recovery and is currently building acceptance around the $99–$100 area.
Immediate resistance:
$100.02 — 0.236 Fibonacci
$100.59
$102.00
$102.29
$104.64
$107.07
$109.91
$111.04
A clean breakout and sustained close above $109.91–$111.04 would provide stronger confirmation of bullish continuation.
🎯 Target 1: $100.59
🎯 Target 2: $104.64
🎯 Target 3: $107.07
🎯 Target 4: $111.04
🎯 Target 5: $129.49 — 0.382 Fibonacci
🎯 Target 6: $150.08 — 0.5 Fibonacci
A confirmed breakout above the $109.91–$111.04 zone could strengthen the medium-term recovery structure and potentially accelerate SOL toward the $129–$150 region.
🔴 Pullback Scenario
After the recent bullish expansion, a retest of the breakout area would be normal.
Key supports:
$97.42
$96.33
$92.94
$92.58 — 50 EMA
$91.88 — 200 EMA
$87.71 — 100 EMA
The $92–$97 zone is particularly important.
If SOL continues to hold this area during a pullback, the current recovery structure remains valid.
A sustained loss of $91.88 would weaken the bullish setup and could expose the $87.71 support zone.
🧠 Market Structure & Liquidity
SOL has formed a clear recovery structure after sweeping liquidity around the $92–$94 demand region.
The recent move produced a market-structure shift followed by a breakout and higher-low formation.
SOL is now moving through an important:
Breakout → Retest → Consolidation → Continuation
structure.
The major upside liquidity is concentrated around $100–$111. A decisive breakout above this zone would place $129.49 as the next major Fibonacci target.
📊 RSI Momentum
RSI (14): 49.30
RSI has cooled back toward the neutral 50 level after the recent bullish expansion.
The current reading shows that short-term momentum is balanced rather than strongly overbought.
A sustained RSI move back above 50–55 would favor another bullish attempt toward the resistance zone.
A breakdown below 50 would indicate increasing short-term momentum weakness.
🎯 Key Levels
🔴 Major Resistance: $100.02 → $100.59 → $104.64 → $107.07 → $109.91 → $111.04
🟢 Major Support: $97.42 → $96.33 → $92.94 → $92.58 → $91.88
📉 Dynamic EMA Support: $92.58 — 50 EMA | $91.88 — 200 EMA | $87.71 — 100 EMA
🚀 Upside Targets: $111.04 → $129.49 → $150.08 → $170.67
📌 Final Outlook
SOL's broader structure remains constructive after the recent breakout, but price is currently consolidating around the $100 area and below the $100.59–$111 resistance zone.
The $92–$97 area is now the key short-term support region. As long as SOL holds above this zone, the current recovery structure remains active.
The immediate battle is around $100–$111. A confirmed breakout above $111.04 could open the path toward $129.49, followed by $150.08 and potentially $170.67.
However, rejection from resistance followed by a sustained loss of $91.88 would weaken the bullish structure and increase the risk of a deeper retracement toward the $87.71 area.
Bias: 🟢 Recovery structure intact above $91.88. A breakout above $111.04 could open the path toward $129.49, with $150.08 as the next major Fibonacci target.
$SOL
{future}(SOLUSDT)
SOL Technical Outlook: Solana Holds Near $100 as Bulls Defend the Breakout
SOL is currently trading around $99.6, holding near the $99–$100 breakout zone after the recent bullish expansion from the $92–$94 demand area.
The broader recovery structure remains constructive, but SOL is now consolidating below the $100.59–$104.64 resistance cluster. Bulls need to reclaim this area and break the $107.07–$109.91 zone for the next major upside expansion.
📈 EMA Structure
20 EMA: $99.62
50 EMA: $92.58
100 EMA: $87.71
200 EMA: $91.88
SOL is currently testing the 20 EMA at $99.62.
The recovery above the 50 EMA at $92.58 and 200 EMA at $91.88 keeps the broader recovery structure intact.
A sustained hold above the 20 EMA would strengthen short-term momentum, while losing the $92.58–$91.88 area would weaken the current structure.
📐 Fibonacci Levels
Key Fibonacci levels:
0.236: $100.02
0.382: $129.49
0.5: $150.08
0.618: $170.67
0.786: $199.99
1.0: $237.33
SOL is currently testing the 0.236 Fibonacci region around $100.02.
The next major Fibonacci resistance is $129.49 — 0.382 Fib.
A sustained breakout above the $100–$107 resistance structure could open the path toward the $129.49 region.
🟢 Bullish Scenario
SOL is consolidating after the recent recovery and is currently building acceptance around the $99–$100 area.
Immediate resistance:
$100.02 — 0.236 Fibonacci
$100.59
$102.00
$102.29
$104.64
$107.07
$109.91
$111.04
A clean breakout and sustained close above $109.91–$111.04 would provide stronger confirmation of bullish continuation.
🎯 Target 1: $100.59
🎯 Target 2: $104.64
🎯 Target 3: $107.07
🎯 Target 4: $111.04
🎯 Target 5: $129.49 — 0.382 Fibonacci
🎯 Target 6: $150.08 — 0.5 Fibonacci
A confirmed breakout above the $109.91–$111.04 zone could strengthen the medium-term recovery structure and potentially accelerate SOL toward the $129–$150 region.
🔴 Pullback Scenario
After the recent bullish expansion, a retest of the breakout area would be normal.
Key supports:
$97.42
$96.33
$92.94
$92.58 — 50 EMA
$91.88 — 200 EMA
$87.71 — 100 EMA
The $92–$97 zone is particularly important.
If SOL continues to hold this area during a pullback, the current recovery structure remains valid.
A sustained loss of $91.88 would weaken the bullish setup and could expose the $87.71 support zone.
🧠 Market Structure & Liquidity
SOL has formed a clear recovery structure after sweeping liquidity around the $92–$94 demand region.
The recent move produced a market-structure shift followed by a breakout and higher-low formation.
SOL is now moving through an important:
Breakout → Retest → Consolidation → Continuation
structure.
The major upside liquidity is concentrated around $100–$111. A decisive breakout above this zone would place $129.49 as the next major Fibonacci target.
📊 RSI Momentum
RSI (14): 49.30
RSI has cooled back toward the neutral 50 level after the recent bullish expansion.
The current reading shows that short-term momentum is balanced rather than strongly overbought.
A sustained RSI move back above 50–55 would favor another bullish attempt toward the resistance zone.
A breakdown below 50 would indicate increasing short-term momentum weakness.
🎯 Key Levels
🔴 Major Resistance: $100.02 → $100.59 → $104.64 → $107.07 → $109.91 → $111.04
🟢 Major Support: $97.42 → $96.33 → $92.94 → $92.58 → $91.88
📉 Dynamic EMA Support: $92.58 — 50 EMA | $91.88 — 200 EMA | $87.71 — 100 EMA
🚀 Upside Targets: $111.04 → $129.49 → $150.08 → $170.67
📌 Final Outlook
SOL's broader structure remains constructive after the recent breakout, but price is currently consolidating around the $100 area and below the $100.59–$111 resistance zone.
The $92–$97 area is now the key short-term support region. As long as SOL holds above this zone, the current recovery structure remains active.
The immediate battle is around $100–$111. A confirmed breakout above $111.04 could open the path toward $129.49, followed by $150.08 and potentially $170.67.
However, rejection from resistance followed by a sustained loss of $91.88 would weaken the bullish structure and increase the risk of a deeper retracement toward the $87.71 area.
Bias: 🟢 Recovery structure intact above $91.88. A breakout above $111.04 could open the path toward $129.49, with $150.08 as the next major Fibonacci target.
$SOL
The broader recovery structure remains constructive, but SOL is now consolidating below the $100.59–$104.64 resistance cluster. Bulls need to reclaim this area and break the $107.07–$109.91 zone for the next major upside expansion.
📈 EMA Structure
20 EMA: $99.62
50 EMA: $92.58
100 EMA: $87.71
200 EMA: $91.88
SOL is currently testing the 20 EMA at $99.62.
The recovery above the 50 EMA at $92.58 and 200 EMA at $91.88 keeps the broader recovery structure intact.
A sustained hold above the 20 EMA would strengthen short-term momentum, while losing the $92.58–$91.88 area would weaken the current structure.
📐 Fibonacci Levels
Key Fibonacci levels:
0.236: $100.02
0.382: $129.49
0.5: $150.08
0.618: $170.67
0.786: $199.99
1.0: $237.33
SOL is currently testing the 0.236 Fibonacci region around $100.02.
The next major Fibonacci resistance is $129.49 — 0.382 Fib.
A sustained breakout above the $100–$107 resistance structure could open the path toward the $129.49 region.
🟢 Bullish Scenario
SOL is consolidating after the recent recovery and is currently building acceptance around the $99–$100 area.
Immediate resistance:
$100.02 — 0.236 Fibonacci
$100.59
$102.00
$102.29
$104.64
$107.07
$109.91
$111.04
A clean breakout and sustained close above $109.91–$111.04 would provide stronger confirmation of bullish continuation.
🎯 Target 1: $100.59
🎯 Target 2: $104.64
🎯 Target 3: $107.07
🎯 Target 4: $111.04
🎯 Target 5: $129.49 — 0.382 Fibonacci
🎯 Target 6: $150.08 — 0.5 Fibonacci
A confirmed breakout above the $109.91–$111.04 zone could strengthen the medium-term recovery structure and potentially accelerate SOL toward the $129–$150 region.
🔴 Pullback Scenario
After the recent bullish expansion, a retest of the breakout area would be normal.
Key supports:
$97.42
$96.33
$92.94
$92.58 — 50 EMA
$91.88 — 200 EMA
$87.71 — 100 EMA
The $92–$97 zone is particularly important.
If SOL continues to hold this area during a pullback, the current recovery structure remains valid.
A sustained loss of $91.88 would weaken the bullish setup and could expose the $87.71 support zone.
🧠 Market Structure & Liquidity
SOL has formed a clear recovery structure after sweeping liquidity around the $92–$94 demand region.
The recent move produced a market-structure shift followed by a breakout and higher-low formation.
SOL is now moving through an important:
Breakout → Retest → Consolidation → Continuation
structure.
The major upside liquidity is concentrated around $100–$111. A decisive breakout above this zone would place $129.49 as the next major Fibonacci target.
📊 RSI Momentum
RSI (14): 49.30
RSI has cooled back toward the neutral 50 level after the recent bullish expansion.
The current reading shows that short-term momentum is balanced rather than strongly overbought.
A sustained RSI move back above 50–55 would favor another bullish attempt toward the resistance zone.
A breakdown below 50 would indicate increasing short-term momentum weakness.
🎯 Key Levels
🔴 Major Resistance: $100.02 → $100.59 → $104.64 → $107.07 → $109.91 → $111.04
🟢 Major Support: $97.42 → $96.33 → $92.94 → $92.58 → $91.88
📉 Dynamic EMA Support: $92.58 — 50 EMA | $91.88 — 200 EMA | $87.71 — 100 EMA
🚀 Upside Targets: $111.04 → $129.49 → $150.08 → $170.67
📌 Final Outlook
SOL's broader structure remains constructive after the recent breakout, but price is currently consolidating around the $100 area and below the $100.59–$111 resistance zone.
The $92–$97 area is now the key short-term support region. As long as SOL holds above this zone, the current recovery structure remains active.
The immediate battle is around $100–$111. A confirmed breakout above $111.04 could open the path toward $129.49, followed by $150.08 and potentially $170.67.
However, rejection from resistance followed by a sustained loss of $91.88 would weaken the bullish structure and increase the risk of a deeper retracement toward the $87.71 area.
Bias: 🟢 Recovery structure intact above $91.88. A breakout above $111.04 could open the path toward $129.49, with $150.08 as the next major Fibonacci target.
$SOL
62
·
--
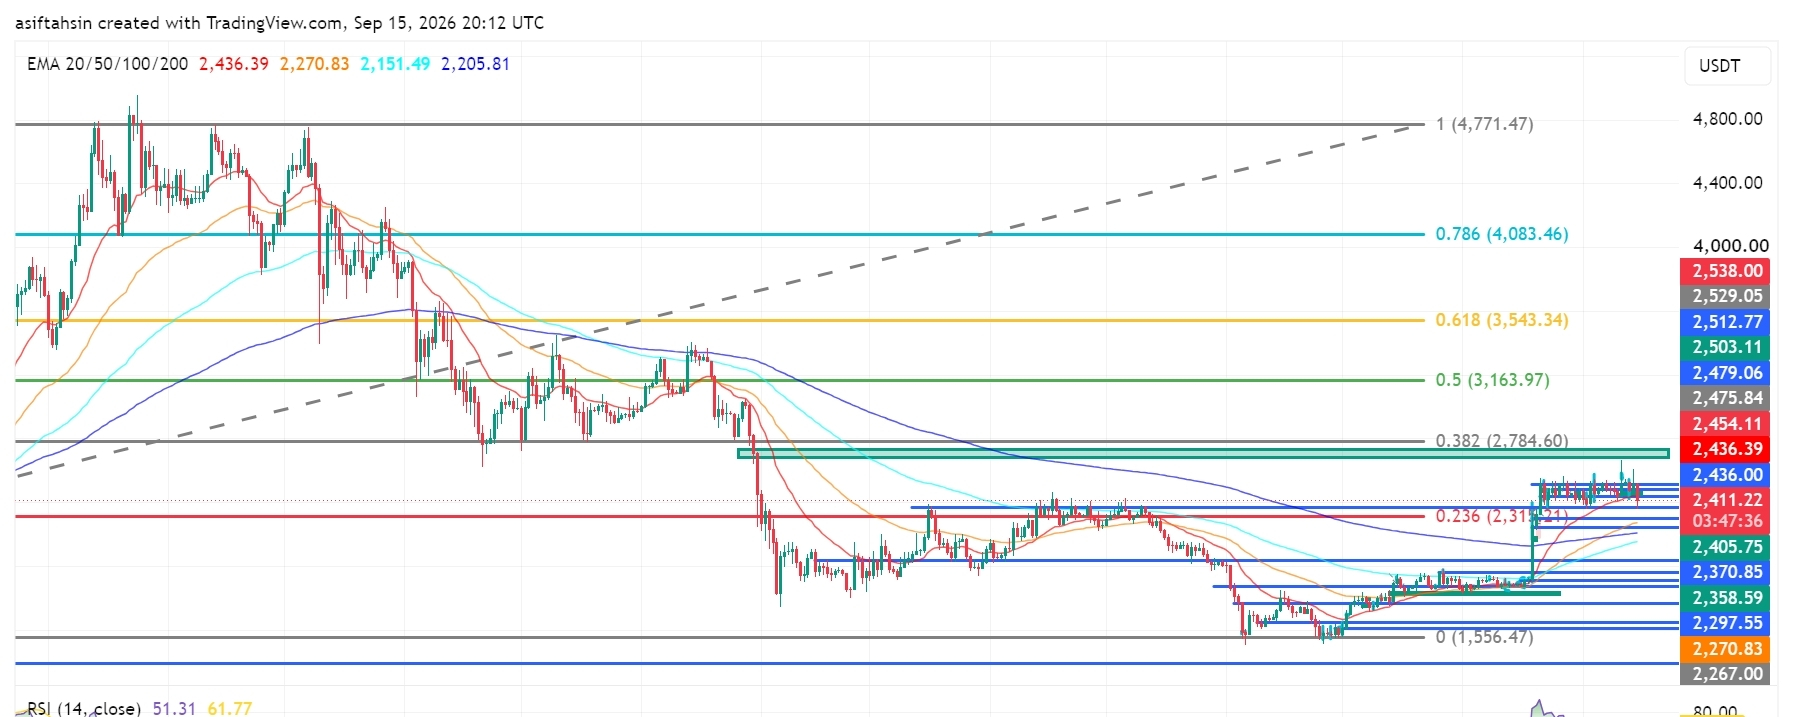
Artikel
Übersetzung ansehen
ETH Technical Outlook: Ethereum Holds Above $2.4K as Bulls Defend the RecoveryETH is currently trading around $2.41K, holding above the $2.40K–$2.41K support area after the recent recovery from the $2.27K–$2.30K demand zone.
The broader recovery structure remains constructive, but ETH is now consolidating below the $2.436K–$2.454K resistance cluster. Bulls need to reclaim this area and break $2,538 for the next major upside expansion.
📈 EMA Structure
20 EMA: $2,436.39
50 EMA: $2,270.83
100 EMA: $2,151.49
200 EMA: $2,205.81
ETH remains above the 50, 100 and 200 EMAs.
The 20 EMA at $2,436.39 is currently the key short-term resistance. A sustained reclaim above this level would strengthen the bullish recovery structure.
The 200 EMA at $2,205.81 remains an important dynamic support.
📐 Fibonacci Levels
Key Fibonacci levels:
0.236: $2,315.21
0.382: $2,784.60
0.5: $3,163.97
0.618: $3,543.34
0.786: $4,083.46
1.0: $4,771.47
ETH has reclaimed the 0.236 Fibonacci region at $2,315.21, while the next major Fibonacci resistance is $2,784.60 — 0.382 Fib.
A sustained breakout above the current resistance structure could open the path toward the $2.78K region.
🟢 Bullish Scenario
ETH is consolidating after the recent recovery and is currently building acceptance around the $2.4K area.
Immediate resistance:
$2,436.39 — 20 EMA
$2,454.11
$2,475.84
$2,503.11
$2,512.77
$2,529.05
$2,538.00
A clean breakout and sustained close above $2,538 would provide stronger confirmation of bullish continuation.
🎯 Target 1: $2,475.84
🎯 Target 2: $2,503.11
🎯 Target 3: $2,538
🎯 Target 4: $2,784.60 — 0.382 Fibonacci
🎯 Target 5: $3,163.97 — 0.5 Fibonacci
A confirmed breakout above $2,538 could strengthen the medium-term structure and potentially accelerate ETH toward the $2.78K–$3.16K region.
🔴 Pullback Scenario
After the recent recovery, consolidation or a retest of the breakout area would be normal.
Key supports:
$2,405.75
$2,370.85
$2,358.59
$2,297.55
$2,270.83 — 50 EMA
$2,205.81 — 200 EMA
$2,151.49 — 100 EMA
The $2,358–$2,405 zone is particularly important.
If ETH continues to hold this area during a pullback, the current recovery structure remains valid.
A sustained loss of $2,315.21 would weaken the bullish setup and could expose the $2,270–$2,205 support zone.
🧠 Market Structure & Liquidity
ETH has formed a clear recovery structure after sweeping liquidity around the $2.27K–$2.30K demand region.
The recent move produced a market-structure shift followed by a breakout and higher-low formation.
ETH is now moving through an important:
Breakout → Retest → Consolidation → Continuation
structure.
The major upside liquidity remains around $2,436–$2,538. A decisive breakout above this zone would place $2,784.60 as the next major Fibonacci target.
📊 RSI Momentum
RSI (14): 51.31
RSI has cooled toward the neutral 50 level, showing that short-term momentum has weakened after the previous recovery.
A sustained RSI hold above 50–55 would favor another bullish attempt toward the resistance zone.
A breakdown below 50 would indicate increasing short-term momentum weakness.
🎯 Key Levels
🔴 Major Resistance: $2,436.39 → $2,454.11 → $2,475.84 → $2,503.11 → $2,538
🟢 Major Support: $2,405.75 → $2,370.85 → $2,358.59 → $2,297.55
📉 Dynamic EMA Support: $2,270.83 — 50 EMA | $2,205.81 — 200 EMA
🚀 Upside Targets: $2,538 → $2,784.60 → $3,163.97 → $3,543.34
📌 Final Outlook
ETH's broader structure remains constructive after the recent recovery, but price is currently consolidating below the $2.436K–$2.538K resistance zone.
The $2.358K–$2.405K area is now the key short-term support region. As long as ETH holds above this zone, the current recovery structure remains active.
The immediate battle is around $2,436–$2,538. A confirmed breakout above $2,538 could open the path toward $2,784.60, followed by $3,163.97 and potentially $3,543.34.
However, rejection from resistance followed by a sustained loss of $2,315.21 would weaken the bullish structure and increase the risk of a deeper retracement toward the $2,270–$2,205 area.
Bias: 🟢 Bullish above $2,315.21. A breakout above $2,538 could open the path toward $2,784.60, with $3,163.97 as the next major Fibonacci target.
$ETH
{future}(ETHUSDT)
ETH Technical Outlook: Ethereum Holds Above $2.4K as Bulls Defend the Recovery
ETH is currently trading around $2.41K, holding above the $2.40K–$2.41K support area after the recent recovery from the $2.27K–$2.30K demand zone.
The broader recovery structure remains constructive, but ETH is now consolidating below the $2.436K–$2.454K resistance cluster. Bulls need to reclaim this area and break $2,538 for the next major upside expansion.
📈 EMA Structure
20 EMA: $2,436.39
50 EMA: $2,270.83
100 EMA: $2,151.49
200 EMA: $2,205.81
ETH remains above the 50, 100 and 200 EMAs.
The 20 EMA at $2,436.39 is currently the key short-term resistance. A sustained reclaim above this level would strengthen the bullish recovery structure.
The 200 EMA at $2,205.81 remains an important dynamic support.
📐 Fibonacci Levels
Key Fibonacci levels:
0.236: $2,315.21
0.382: $2,784.60
0.5: $3,163.97
0.618: $3,543.34
0.786: $4,083.46
1.0: $4,771.47
ETH has reclaimed the 0.236 Fibonacci region at $2,315.21, while the next major Fibonacci resistance is $2,784.60 — 0.382 Fib.
A sustained breakout above the current resistance structure could open the path toward the $2.78K region.
🟢 Bullish Scenario
ETH is consolidating after the recent recovery and is currently building acceptance around the $2.4K area.
Immediate resistance:
$2,436.39 — 20 EMA
$2,454.11
$2,475.84
$2,503.11
$2,512.77
$2,529.05
$2,538.00
A clean breakout and sustained close above $2,538 would provide stronger confirmation of bullish continuation.
🎯 Target 1: $2,475.84
🎯 Target 2: $2,503.11
🎯 Target 3: $2,538
🎯 Target 4: $2,784.60 — 0.382 Fibonacci
🎯 Target 5: $3,163.97 — 0.5 Fibonacci
A confirmed breakout above $2,538 could strengthen the medium-term structure and potentially accelerate ETH toward the $2.78K–$3.16K region.
🔴 Pullback Scenario
After the recent recovery, consolidation or a retest of the breakout area would be normal.
Key supports:
$2,405.75
$2,370.85
$2,358.59
$2,297.55
$2,270.83 — 50 EMA
$2,205.81 — 200 EMA
$2,151.49 — 100 EMA
The $2,358–$2,405 zone is particularly important.
If ETH continues to hold this area during a pullback, the current recovery structure remains valid.
A sustained loss of $2,315.21 would weaken the bullish setup and could expose the $2,270–$2,205 support zone.
🧠 Market Structure & Liquidity
ETH has formed a clear recovery structure after sweeping liquidity around the $2.27K–$2.30K demand region.
The recent move produced a market-structure shift followed by a breakout and higher-low formation.
ETH is now moving through an important:
Breakout → Retest → Consolidation → Continuation
structure.
The major upside liquidity remains around $2,436–$2,538. A decisive breakout above this zone would place $2,784.60 as the next major Fibonacci target.
📊 RSI Momentum
RSI (14): 51.31
RSI has cooled toward the neutral 50 level, showing that short-term momentum has weakened after the previous recovery.
A sustained RSI hold above 50–55 would favor another bullish attempt toward the resistance zone.
A breakdown below 50 would indicate increasing short-term momentum weakness.
🎯 Key Levels
🔴 Major Resistance: $2,436.39 → $2,454.11 → $2,475.84 → $2,503.11 → $2,538
🟢 Major Support: $2,405.75 → $2,370.85 → $2,358.59 → $2,297.55
📉 Dynamic EMA Support: $2,270.83 — 50 EMA | $2,205.81 — 200 EMA
🚀 Upside Targets: $2,538 → $2,784.60 → $3,163.97 → $3,543.34
📌 Final Outlook
ETH's broader structure remains constructive after the recent recovery, but price is currently consolidating below the $2.436K–$2.538K resistance zone.
The $2.358K–$2.405K area is now the key short-term support region. As long as ETH holds above this zone, the current recovery structure remains active.
The immediate battle is around $2,436–$2,538. A confirmed breakout above $2,538 could open the path toward $2,784.60, followed by $3,163.97 and potentially $3,543.34.
However, rejection from resistance followed by a sustained loss of $2,315.21 would weaken the bullish structure and increase the risk of a deeper retracement toward the $2,270–$2,205 area.
Bias: 🟢 Bullish above $2,315.21. A breakout above $2,538 could open the path toward $2,784.60, with $3,163.97 as the next major Fibonacci target.
$ETH
The broader recovery structure remains constructive, but ETH is now consolidating below the $2.436K–$2.454K resistance cluster. Bulls need to reclaim this area and break $2,538 for the next major upside expansion.
📈 EMA Structure
20 EMA: $2,436.39
50 EMA: $2,270.83
100 EMA: $2,151.49
200 EMA: $2,205.81
ETH remains above the 50, 100 and 200 EMAs.
The 20 EMA at $2,436.39 is currently the key short-term resistance. A sustained reclaim above this level would strengthen the bullish recovery structure.
The 200 EMA at $2,205.81 remains an important dynamic support.
📐 Fibonacci Levels
Key Fibonacci levels:
0.236: $2,315.21
0.382: $2,784.60
0.5: $3,163.97
0.618: $3,543.34
0.786: $4,083.46
1.0: $4,771.47
ETH has reclaimed the 0.236 Fibonacci region at $2,315.21, while the next major Fibonacci resistance is $2,784.60 — 0.382 Fib.
A sustained breakout above the current resistance structure could open the path toward the $2.78K region.
🟢 Bullish Scenario
ETH is consolidating after the recent recovery and is currently building acceptance around the $2.4K area.
Immediate resistance:
$2,436.39 — 20 EMA
$2,454.11
$2,475.84
$2,503.11
$2,512.77
$2,529.05
$2,538.00
A clean breakout and sustained close above $2,538 would provide stronger confirmation of bullish continuation.
🎯 Target 1: $2,475.84
🎯 Target 2: $2,503.11
🎯 Target 3: $2,538
🎯 Target 4: $2,784.60 — 0.382 Fibonacci
🎯 Target 5: $3,163.97 — 0.5 Fibonacci
A confirmed breakout above $2,538 could strengthen the medium-term structure and potentially accelerate ETH toward the $2.78K–$3.16K region.
🔴 Pullback Scenario
After the recent recovery, consolidation or a retest of the breakout area would be normal.
Key supports:
$2,405.75
$2,370.85
$2,358.59
$2,297.55
$2,270.83 — 50 EMA
$2,205.81 — 200 EMA
$2,151.49 — 100 EMA
The $2,358–$2,405 zone is particularly important.
If ETH continues to hold this area during a pullback, the current recovery structure remains valid.
A sustained loss of $2,315.21 would weaken the bullish setup and could expose the $2,270–$2,205 support zone.
🧠 Market Structure & Liquidity
ETH has formed a clear recovery structure after sweeping liquidity around the $2.27K–$2.30K demand region.
The recent move produced a market-structure shift followed by a breakout and higher-low formation.
ETH is now moving through an important:
Breakout → Retest → Consolidation → Continuation
structure.
The major upside liquidity remains around $2,436–$2,538. A decisive breakout above this zone would place $2,784.60 as the next major Fibonacci target.
📊 RSI Momentum
RSI (14): 51.31
RSI has cooled toward the neutral 50 level, showing that short-term momentum has weakened after the previous recovery.
A sustained RSI hold above 50–55 would favor another bullish attempt toward the resistance zone.
A breakdown below 50 would indicate increasing short-term momentum weakness.
🎯 Key Levels
🔴 Major Resistance: $2,436.39 → $2,454.11 → $2,475.84 → $2,503.11 → $2,538
🟢 Major Support: $2,405.75 → $2,370.85 → $2,358.59 → $2,297.55
📉 Dynamic EMA Support: $2,270.83 — 50 EMA | $2,205.81 — 200 EMA
🚀 Upside Targets: $2,538 → $2,784.60 → $3,163.97 → $3,543.34
📌 Final Outlook
ETH's broader structure remains constructive after the recent recovery, but price is currently consolidating below the $2.436K–$2.538K resistance zone.
The $2.358K–$2.405K area is now the key short-term support region. As long as ETH holds above this zone, the current recovery structure remains active.
The immediate battle is around $2,436–$2,538. A confirmed breakout above $2,538 could open the path toward $2,784.60, followed by $3,163.97 and potentially $3,543.34.
However, rejection from resistance followed by a sustained loss of $2,315.21 would weaken the bullish structure and increase the risk of a deeper retracement toward the $2,270–$2,205 area.
Bias: 🟢 Bullish above $2,315.21. A breakout above $2,538 could open the path toward $2,784.60, with $3,163.97 as the next major Fibonacci target.
$ETH
63
·
--
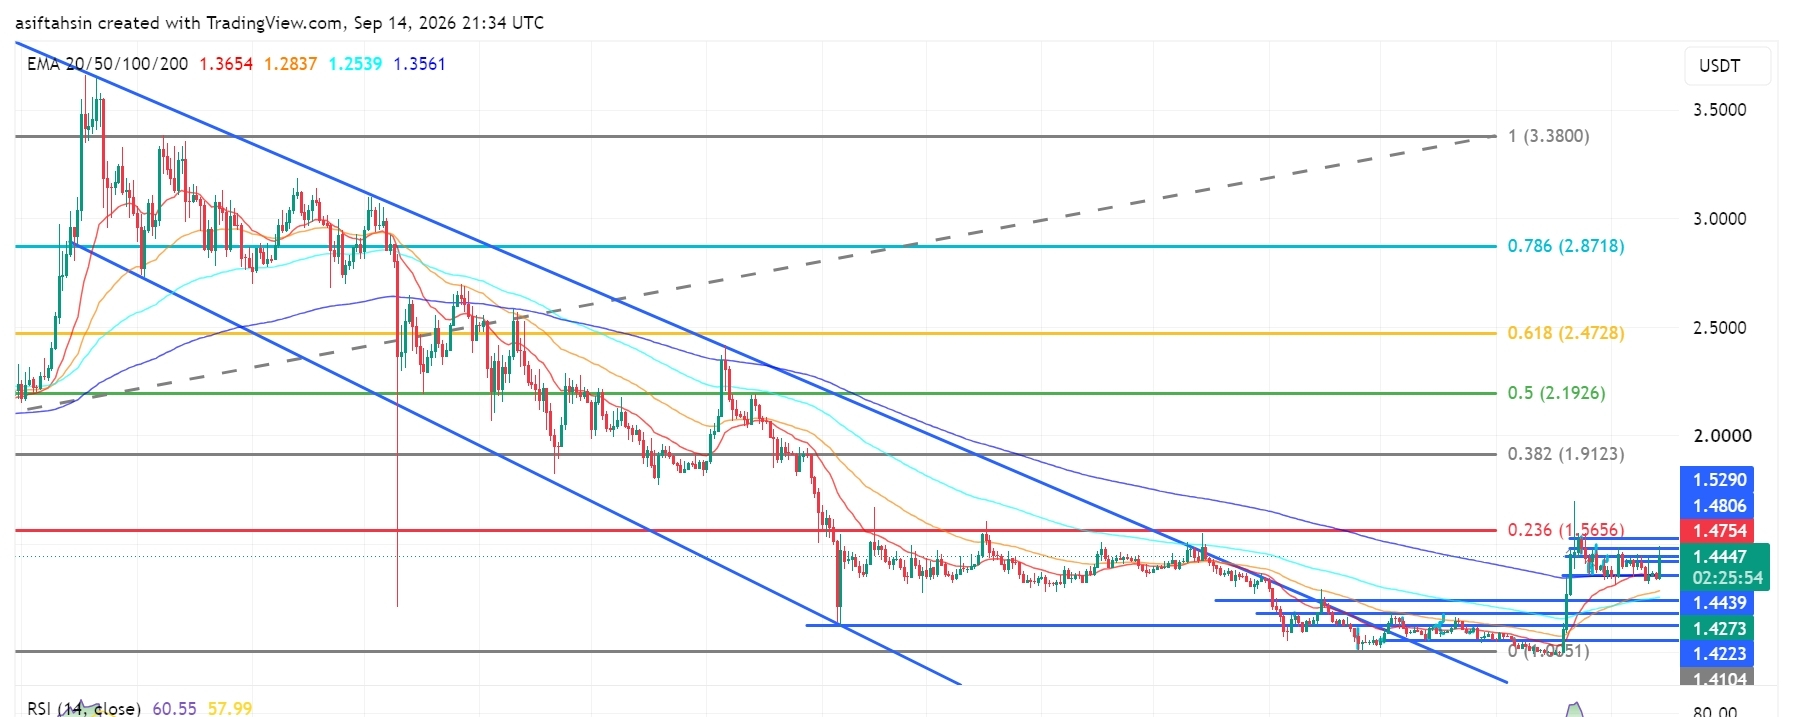
Artikel
XRP-Technischer Ausblick: XRP hält sich über 1,40 US-Dollar, während die Bullen $1,56 anpeilenXRP wird derzeit bei etwa 1,44 US-Dollar gehandelt und konsolidiert oberhalb der wichtigen psychologischen Marke von 1,40 US-Dollar, nachdem es sich nach dem starken Rückgang von den Tiefs im Juni–Juli deutlich erholt hat.
Die übergeordnete Struktur hat sich deutlich verbessert: XRP handelt mittlerweile über allen vier wichtigen EMAs. Allerdings nähert sich der Kurs einem wichtigen Widerstandscluster im Bereich von 1,475–1,53 US-Dollar. Die Bullen brauchen einen sauberen Ausbruch über diesen Bereich, um den Weg in Richtung des Fibonacci-Widerstands bei 1,5656 freizumachen.
📈 EMA-Struktur
20 EMA: 1,3653 $
50 EMA: 1,2837 $
100 EMA: 1,2539 $
200 EMA: 1,3561 $
XRP-Technischer Ausblick: XRP hält sich über 1,40 US-Dollar, während die Bullen $1,56 anpeilen
XRP wird derzeit bei etwa 1,44 US-Dollar gehandelt und konsolidiert oberhalb der wichtigen psychologischen Marke von 1,40 US-Dollar, nachdem es sich nach dem starken Rückgang von den Tiefs im Juni–Juli deutlich erholt hat.
Die übergeordnete Struktur hat sich deutlich verbessert: XRP handelt mittlerweile über allen vier wichtigen EMAs. Allerdings nähert sich der Kurs einem wichtigen Widerstandscluster im Bereich von 1,475–1,53 US-Dollar. Die Bullen brauchen einen sauberen Ausbruch über diesen Bereich, um den Weg in Richtung des Fibonacci-Widerstands bei 1,5656 freizumachen.
📈 EMA-Struktur
20 EMA: 1,3653 $
50 EMA: 1,2837 $
100 EMA: 1,2539 $
200 EMA: 1,3561 $
Die übergeordnete Struktur hat sich deutlich verbessert: XRP handelt mittlerweile über allen vier wichtigen EMAs. Allerdings nähert sich der Kurs einem wichtigen Widerstandscluster im Bereich von 1,475–1,53 US-Dollar. Die Bullen brauchen einen sauberen Ausbruch über diesen Bereich, um den Weg in Richtung des Fibonacci-Widerstands bei 1,5656 freizumachen.
📈 EMA-Struktur
20 EMA: 1,3653 $
50 EMA: 1,2837 $
100 EMA: 1,2539 $
200 EMA: 1,3561 $
2
1
1.2k
·
--
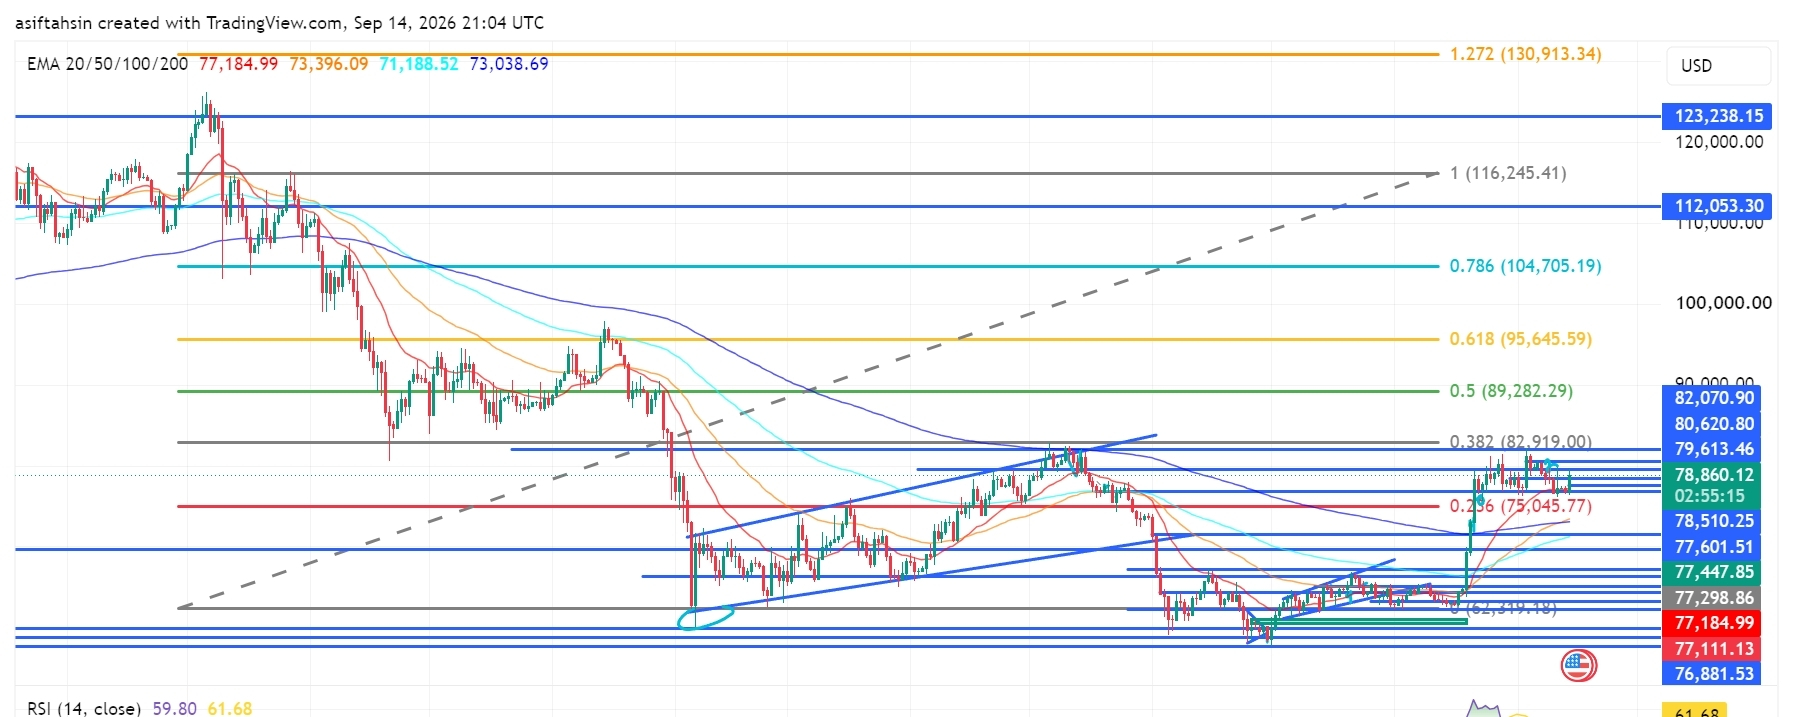
Artikel
Übersetzung ansehen
Bitcoin (BTC) Technical Outlook: BTC Holds Above $78K as Bulls Target $80K–$83K ResistanceBTC is currently trading around $78,860, consolidating above the $78K level after a strong recovery from the June lows.
The broader structure remains constructive, with BTC trading above all four major EMAs. However, price is now approaching a significant resistance cluster around $79,613–$82,070. Bulls need a clean breakout above this zone to open the path toward the $82,919 Fibonacci resistance and potentially higher levels.
📈 EMA Structure
20 EMA: $77,182.98
50 EMA: $73,395.26
100 EMA: $71,188.10
200 EMA: $73,038.48
BTC remains above all four major EMAs, keeping the medium-term recovery structure bullish.
The $77,182.98 20 EMA is now the key dynamic support. As long as BTC remains above this level, buyers maintain control of the current recovery.
📐 Fibonacci Levels
0.236: $75,045.77
0.382: $82,919.00
0.5: $89,282.29
0.618: $95,645.59
0.786: $104,705.19
1.0: $116,245.41
1.272: $130,913.34
The $82,919 0.382 Fibonacci level is the next major upside objective after the current resistance cluster.
🟢 Bullish Scenario
BTC is consolidating just below the $79,613–$82,070 resistance area.
A clean breakout and sustained close above $82,070 could trigger another bullish expansion.
🎯 Target 1: $82,070
🎯 Target 2: $82,919
🎯 Target 3: $89,282
🎯 Target 4: $95,645
🎯 Target 5: $104,705
🎯 Target 6: $116,245
A decisive reclaim of $82,919 would be an important confirmation that BTC is transitioning into a stronger medium-term recovery phase.
🔴 Pullback Scenario
If BTC fails to break the $79,613–$82,070 resistance cluster, a short-term pullback could develop.
Key supports:
$78,510.25
$77,601.51
$77,447.85
$77,298.86
$77,182.98 — 20 EMA
$77,111.13
$76,881.53
$75,045.77 — 0.236 Fib
The $77,600–$77,180 region is particularly important. A successful retest here could provide a base for another attempt at the $80K+ resistance zone.
A sustained break below the 20 EMA at $77,182.98 would weaken the short-term bullish structure.
🧠 Market Structure & Liquidity
BTC's recent structure can be viewed as:
Liquidity Sweep → Accumulation → Higher Lows → Breakout → Reclaim → Consolidation → Potential Continuation
The June low created a major liquidity event, followed by accumulation and a gradual recovery.
BTC subsequently broke higher from the July–August consolidation structure and reclaimed the $75K area. Price is now consolidating near $79K, with the next major structural test sitting between $79,613 and $82,070.
A breakout above this region would put the $82,919 Fibonacci level into focus.
📊 RSI Momentum
RSI: 59.80
RSI MA: 61.68
RSI remains above 50, confirming that bullish momentum is still present.
However, RSI is currently slightly below its moving average, suggesting that momentum has cooled from the recent upside move. A renewed move above 62–65 would strengthen the continuation setup.
🎯 Key Levels
Resistance:
$79,613.46 → $80,620.80 → $82,070.90 → $82,919 → $89,282.29 → $95,645.59
Support:
$78,510.25 → $77,601.51 → $77,447.85 → $77,298.86 → $77,182.98 → $77,111.13 → $76,881.53 → $75,045.77
📌 Final Outlook
BTC remains in a constructive recovery structure while holding above the $77K area and all four major EMAs.
The immediate battle is $79,613–$82,070. A decisive breakout above this zone could push BTC toward $82,919 → $89,282 → $95,645, while a sustained reclaim of $82,919 could open the path toward the higher Fibonacci levels.
On the downside, $77,182.98 is the key dynamic support. As long as BTC holds above this level, the broader bullish recovery remains intact.
Bias: 🟢 Bullish above $77,183 | Stronger above $82,070
$BTC
{future}(BTCUSDT)
Bitcoin (BTC) Technical Outlook: BTC Holds Above $78K as Bulls Target $80K–$83K Resistance
BTC is currently trading around $78,860, consolidating above the $78K level after a strong recovery from the June lows.
The broader structure remains constructive, with BTC trading above all four major EMAs. However, price is now approaching a significant resistance cluster around $79,613–$82,070. Bulls need a clean breakout above this zone to open the path toward the $82,919 Fibonacci resistance and potentially higher levels.
📈 EMA Structure
20 EMA: $77,182.98
50 EMA: $73,395.26
100 EMA: $71,188.10
200 EMA: $73,038.48
BTC remains above all four major EMAs, keeping the medium-term recovery structure bullish.
The $77,182.98 20 EMA is now the key dynamic support. As long as BTC remains above this level, buyers maintain control of the current recovery.
📐 Fibonacci Levels
0.236: $75,045.77
0.382: $82,919.00
0.5: $89,282.29
0.618: $95,645.59
0.786: $104,705.19
1.0: $116,245.41
1.272: $130,913.34
The $82,919 0.382 Fibonacci level is the next major upside objective after the current resistance cluster.
🟢 Bullish Scenario
BTC is consolidating just below the $79,613–$82,070 resistance area.
A clean breakout and sustained close above $82,070 could trigger another bullish expansion.
🎯 Target 1: $82,070
🎯 Target 2: $82,919
🎯 Target 3: $89,282
🎯 Target 4: $95,645
🎯 Target 5: $104,705
🎯 Target 6: $116,245
A decisive reclaim of $82,919 would be an important confirmation that BTC is transitioning into a stronger medium-term recovery phase.
🔴 Pullback Scenario
If BTC fails to break the $79,613–$82,070 resistance cluster, a short-term pullback could develop.
Key supports:
$78,510.25
$77,601.51
$77,447.85
$77,298.86
$77,182.98 — 20 EMA
$77,111.13
$76,881.53
$75,045.77 — 0.236 Fib
The $77,600–$77,180 region is particularly important. A successful retest here could provide a base for another attempt at the $80K+ resistance zone.
A sustained break below the 20 EMA at $77,182.98 would weaken the short-term bullish structure.
🧠 Market Structure & Liquidity
BTC's recent structure can be viewed as:
Liquidity Sweep → Accumulation → Higher Lows → Breakout → Reclaim → Consolidation → Potential Continuation
The June low created a major liquidity event, followed by accumulation and a gradual recovery.
BTC subsequently broke higher from the July–August consolidation structure and reclaimed the $75K area. Price is now consolidating near $79K, with the next major structural test sitting between $79,613 and $82,070.
A breakout above this region would put the $82,919 Fibonacci level into focus.
📊 RSI Momentum
RSI: 59.80
RSI MA: 61.68
RSI remains above 50, confirming that bullish momentum is still present.
However, RSI is currently slightly below its moving average, suggesting that momentum has cooled from the recent upside move. A renewed move above 62–65 would strengthen the continuation setup.
🎯 Key Levels
Resistance:
$79,613.46 → $80,620.80 → $82,070.90 → $82,919 → $89,282.29 → $95,645.59
Support:
$78,510.25 → $77,601.51 → $77,447.85 → $77,298.86 → $77,182.98 → $77,111.13 → $76,881.53 → $75,045.77
📌 Final Outlook
BTC remains in a constructive recovery structure while holding above the $77K area and all four major EMAs.
The immediate battle is $79,613–$82,070. A decisive breakout above this zone could push BTC toward $82,919 → $89,282 → $95,645, while a sustained reclaim of $82,919 could open the path toward the higher Fibonacci levels.
On the downside, $77,182.98 is the key dynamic support. As long as BTC holds above this level, the broader bullish recovery remains intact.
Bias: 🟢 Bullish above $77,183 | Stronger above $82,070
$BTC
The broader structure remains constructive, with BTC trading above all four major EMAs. However, price is now approaching a significant resistance cluster around $79,613–$82,070. Bulls need a clean breakout above this zone to open the path toward the $82,919 Fibonacci resistance and potentially higher levels.
📈 EMA Structure
20 EMA: $77,182.98
50 EMA: $73,395.26
100 EMA: $71,188.10
200 EMA: $73,038.48
BTC remains above all four major EMAs, keeping the medium-term recovery structure bullish.
The $77,182.98 20 EMA is now the key dynamic support. As long as BTC remains above this level, buyers maintain control of the current recovery.
📐 Fibonacci Levels
0.236: $75,045.77
0.382: $82,919.00
0.5: $89,282.29
0.618: $95,645.59
0.786: $104,705.19
1.0: $116,245.41
1.272: $130,913.34
The $82,919 0.382 Fibonacci level is the next major upside objective after the current resistance cluster.
🟢 Bullish Scenario
BTC is consolidating just below the $79,613–$82,070 resistance area.
A clean breakout and sustained close above $82,070 could trigger another bullish expansion.
🎯 Target 1: $82,070
🎯 Target 2: $82,919
🎯 Target 3: $89,282
🎯 Target 4: $95,645
🎯 Target 5: $104,705
🎯 Target 6: $116,245
A decisive reclaim of $82,919 would be an important confirmation that BTC is transitioning into a stronger medium-term recovery phase.
🔴 Pullback Scenario
If BTC fails to break the $79,613–$82,070 resistance cluster, a short-term pullback could develop.
Key supports:
$78,510.25
$77,601.51
$77,447.85
$77,298.86
$77,182.98 — 20 EMA
$77,111.13
$76,881.53
$75,045.77 — 0.236 Fib
The $77,600–$77,180 region is particularly important. A successful retest here could provide a base for another attempt at the $80K+ resistance zone.
A sustained break below the 20 EMA at $77,182.98 would weaken the short-term bullish structure.
🧠 Market Structure & Liquidity
BTC's recent structure can be viewed as:
Liquidity Sweep → Accumulation → Higher Lows → Breakout → Reclaim → Consolidation → Potential Continuation
The June low created a major liquidity event, followed by accumulation and a gradual recovery.
BTC subsequently broke higher from the July–August consolidation structure and reclaimed the $75K area. Price is now consolidating near $79K, with the next major structural test sitting between $79,613 and $82,070.
A breakout above this region would put the $82,919 Fibonacci level into focus.
📊 RSI Momentum
RSI: 59.80
RSI MA: 61.68
RSI remains above 50, confirming that bullish momentum is still present.
However, RSI is currently slightly below its moving average, suggesting that momentum has cooled from the recent upside move. A renewed move above 62–65 would strengthen the continuation setup.
🎯 Key Levels
Resistance:
$79,613.46 → $80,620.80 → $82,070.90 → $82,919 → $89,282.29 → $95,645.59
Support:
$78,510.25 → $77,601.51 → $77,447.85 → $77,298.86 → $77,182.98 → $77,111.13 → $76,881.53 → $75,045.77
📌 Final Outlook
BTC remains in a constructive recovery structure while holding above the $77K area and all four major EMAs.
The immediate battle is $79,613–$82,070. A decisive breakout above this zone could push BTC toward $82,919 → $89,282 → $95,645, while a sustained reclaim of $82,919 could open the path toward the higher Fibonacci levels.
On the downside, $77,182.98 is the key dynamic support. As long as BTC holds above this level, the broader bullish recovery remains intact.
Bias: 🟢 Bullish above $77,183 | Stronger above $82,070
$BTC
69
·
--
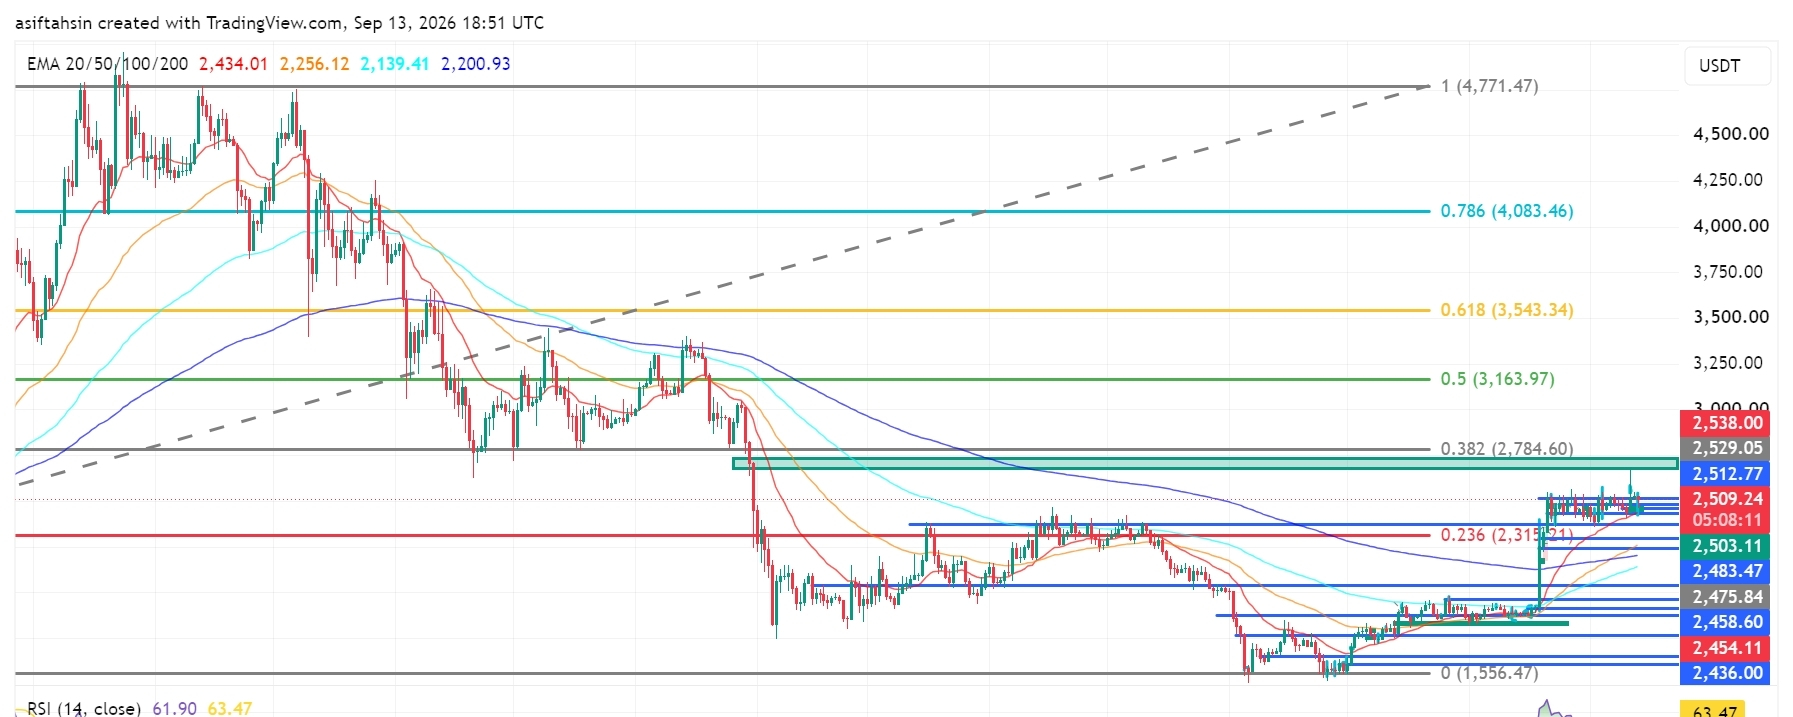
Artikel
Übersetzung ansehen
Solana (SOL) Technical Outlook: SOL Holds Above $100 as Bulls Target Higher ResistanceSOL is currently trading around $101.25, consolidating above the psychological $100 level after a strong recovery from the June lows.
The broader structure is showing signs of improvement, with SOL now trading above all four major EMAs. However, price is facing a significant resistance cluster around $102.29–$104.64. Bulls need a clean breakout above this zone to open the path toward the $107–$109 area and the $129.49 Fibonacci resistance.
📈 EMA Structure
20 EMA: $99.76
50 EMA: $92.04
100 EMA: $87.25
200 EMA: $91.74
SOL is currently trading above all four major EMAs, supporting the ongoing recovery structure.
The $99.76 20 EMA is the key dynamic support. As long as SOL remains above this level, buyers maintain control of the current short-term structure.
📐 Fibonacci Levels
0.236: $104.00
0.382: $129.49
0.5: $150.08
0.618: $170.67
0.786: $199.99
1.0: $237.33
The $104.00 0.236 Fibonacci level is the immediate major resistance. A successful reclaim could strengthen the path toward $129.49.
🟢 Bullish Scenario
SOL is consolidating around the $100–$102 region after recovering from the recent lows.
A clean breakout and sustained close above $104.64 could trigger another bullish expansion.
🎯 Target 1: $107.07
🎯 Target 2: $109.84
🎯 Target 3: $112.00
🎯 Target 4: $129.49
🎯 Target 5: $150.08
🎯 Target 6: $170.67
A decisive reclaim of $129.49 would be an important confirmation that SOL is transitioning into a stronger medium-term recovery phase.
🔴 Pullback Scenario
If SOL fails to break the $102.29–$104.64 resistance cluster, a short-term pullback could develop.
Key supports:
$100.59
$99.76
$96.33
$92.94
$92.04
$91.74 — 200 EMA
$87.25 — 100 EMA
$86.69
The $100.59–$99.76 region is particularly important. A successful retest here could provide a base for another attempt at the $104 resistance.
A sustained break below the 20 EMA at $99.76 would weaken the short-term bullish structure.
🧠 Market Structure & Liquidity
SOL's recent structure can be viewed as:
Liquidity Sweep → Accumulation → Higher Lows → MSS/BOS → Breakout → Reclaim → Consolidation → Potential Continuation
The June low created a major liquidity event, followed by a prolonged accumulation phase and gradual recovery.
SOL has now reclaimed the $100 psychological level and is holding above the major EMA cluster.
The next major structural test is $102.29–$104.64, followed by the $107–$112 resistance area.
📊 RSI Momentum
RSI: 56.24
RSI MA: 61.94
RSI remains above 50, indicating that bullish momentum is still present.
However, RSI is currently below its moving average, suggesting that momentum has cooled from the recent upside move. A renewed push above 60–62 would strengthen the continuation setup.
🎯 Key Levels
Resistance:
$102.29 → $104.00 → $104.64 → $107.07 → $109.84 → $112.00 → $129.49
Support:
$100.59 → $99.76 → $96.33 → $92.94 → $92.04 → $91.74 → $87.25 → $86.69
📌 Final Outlook
SOL remains in a constructive recovery structure while holding above the $100 area and all major EMAs.
The immediate battle is $102.29–$104.64. A decisive breakout above this zone could push SOL toward $107 → $109.84 → $112, while a sustained move beyond these levels could open the path toward $129.49.
On the downside, $99.76 is the key dynamic support. As long as SOL holds above this level, the broader recovery structure remains intact.
Bias: 🟢 Bullish above $99.76 | Stronger above $104.64
$SOL
{future}(SOLUSDT)
Solana (SOL) Technical Outlook: SOL Holds Above $100 as Bulls Target Higher Resistance
SOL is currently trading around $101.25, consolidating above the psychological $100 level after a strong recovery from the June lows.
The broader structure is showing signs of improvement, with SOL now trading above all four major EMAs. However, price is facing a significant resistance cluster around $102.29–$104.64. Bulls need a clean breakout above this zone to open the path toward the $107–$109 area and the $129.49 Fibonacci resistance.
📈 EMA Structure
20 EMA: $99.76
50 EMA: $92.04
100 EMA: $87.25
200 EMA: $91.74
SOL is currently trading above all four major EMAs, supporting the ongoing recovery structure.
The $99.76 20 EMA is the key dynamic support. As long as SOL remains above this level, buyers maintain control of the current short-term structure.
📐 Fibonacci Levels
0.236: $104.00
0.382: $129.49
0.5: $150.08
0.618: $170.67
0.786: $199.99
1.0: $237.33
The $104.00 0.236 Fibonacci level is the immediate major resistance. A successful reclaim could strengthen the path toward $129.49.
🟢 Bullish Scenario
SOL is consolidating around the $100–$102 region after recovering from the recent lows.
A clean breakout and sustained close above $104.64 could trigger another bullish expansion.
🎯 Target 1: $107.07
🎯 Target 2: $109.84
🎯 Target 3: $112.00
🎯 Target 4: $129.49
🎯 Target 5: $150.08
🎯 Target 6: $170.67
A decisive reclaim of $129.49 would be an important confirmation that SOL is transitioning into a stronger medium-term recovery phase.
🔴 Pullback Scenario
If SOL fails to break the $102.29–$104.64 resistance cluster, a short-term pullback could develop.
Key supports:
$100.59
$99.76
$96.33
$92.94
$92.04
$91.74 — 200 EMA
$87.25 — 100 EMA
$86.69
The $100.59–$99.76 region is particularly important. A successful retest here could provide a base for another attempt at the $104 resistance.
A sustained break below the 20 EMA at $99.76 would weaken the short-term bullish structure.
🧠 Market Structure & Liquidity
SOL's recent structure can be viewed as:
Liquidity Sweep → Accumulation → Higher Lows → MSS/BOS → Breakout → Reclaim → Consolidation → Potential Continuation
The June low created a major liquidity event, followed by a prolonged accumulation phase and gradual recovery.
SOL has now reclaimed the $100 psychological level and is holding above the major EMA cluster.
The next major structural test is $102.29–$104.64, followed by the $107–$112 resistance area.
📊 RSI Momentum
RSI: 56.24
RSI MA: 61.94
RSI remains above 50, indicating that bullish momentum is still present.
However, RSI is currently below its moving average, suggesting that momentum has cooled from the recent upside move. A renewed push above 60–62 would strengthen the continuation setup.
🎯 Key Levels
Resistance:
$102.29 → $104.00 → $104.64 → $107.07 → $109.84 → $112.00 → $129.49
Support:
$100.59 → $99.76 → $96.33 → $92.94 → $92.04 → $91.74 → $87.25 → $86.69
📌 Final Outlook
SOL remains in a constructive recovery structure while holding above the $100 area and all major EMAs.
The immediate battle is $102.29–$104.64. A decisive breakout above this zone could push SOL toward $107 → $109.84 → $112, while a sustained move beyond these levels could open the path toward $129.49.
On the downside, $99.76 is the key dynamic support. As long as SOL holds above this level, the broader recovery structure remains intact.
Bias: 🟢 Bullish above $99.76 | Stronger above $104.64
$SOL
The broader structure is showing signs of improvement, with SOL now trading above all four major EMAs. However, price is facing a significant resistance cluster around $102.29–$104.64. Bulls need a clean breakout above this zone to open the path toward the $107–$109 area and the $129.49 Fibonacci resistance.
📈 EMA Structure
20 EMA: $99.76
50 EMA: $92.04
100 EMA: $87.25
200 EMA: $91.74
SOL is currently trading above all four major EMAs, supporting the ongoing recovery structure.
The $99.76 20 EMA is the key dynamic support. As long as SOL remains above this level, buyers maintain control of the current short-term structure.
📐 Fibonacci Levels
0.236: $104.00
0.382: $129.49
0.5: $150.08
0.618: $170.67
0.786: $199.99
1.0: $237.33
The $104.00 0.236 Fibonacci level is the immediate major resistance. A successful reclaim could strengthen the path toward $129.49.
🟢 Bullish Scenario
SOL is consolidating around the $100–$102 region after recovering from the recent lows.
A clean breakout and sustained close above $104.64 could trigger another bullish expansion.
🎯 Target 1: $107.07
🎯 Target 2: $109.84
🎯 Target 3: $112.00
🎯 Target 4: $129.49
🎯 Target 5: $150.08
🎯 Target 6: $170.67
A decisive reclaim of $129.49 would be an important confirmation that SOL is transitioning into a stronger medium-term recovery phase.
🔴 Pullback Scenario
If SOL fails to break the $102.29–$104.64 resistance cluster, a short-term pullback could develop.
Key supports:
$100.59
$99.76
$96.33
$92.94
$92.04
$91.74 — 200 EMA
$87.25 — 100 EMA
$86.69
The $100.59–$99.76 region is particularly important. A successful retest here could provide a base for another attempt at the $104 resistance.
A sustained break below the 20 EMA at $99.76 would weaken the short-term bullish structure.
🧠 Market Structure & Liquidity
SOL's recent structure can be viewed as:
Liquidity Sweep → Accumulation → Higher Lows → MSS/BOS → Breakout → Reclaim → Consolidation → Potential Continuation
The June low created a major liquidity event, followed by a prolonged accumulation phase and gradual recovery.
SOL has now reclaimed the $100 psychological level and is holding above the major EMA cluster.
The next major structural test is $102.29–$104.64, followed by the $107–$112 resistance area.
📊 RSI Momentum
RSI: 56.24
RSI MA: 61.94
RSI remains above 50, indicating that bullish momentum is still present.
However, RSI is currently below its moving average, suggesting that momentum has cooled from the recent upside move. A renewed push above 60–62 would strengthen the continuation setup.
🎯 Key Levels
Resistance:
$102.29 → $104.00 → $104.64 → $107.07 → $109.84 → $112.00 → $129.49
Support:
$100.59 → $99.76 → $96.33 → $92.94 → $92.04 → $91.74 → $87.25 → $86.69
📌 Final Outlook
SOL remains in a constructive recovery structure while holding above the $100 area and all major EMAs.
The immediate battle is $102.29–$104.64. A decisive breakout above this zone could push SOL toward $107 → $109.84 → $112, while a sustained move beyond these levels could open the path toward $129.49.
On the downside, $99.76 is the key dynamic support. As long as SOL holds above this level, the broader recovery structure remains intact.
Bias: 🟢 Bullish above $99.76 | Stronger above $104.64
$SOL
61
·
--
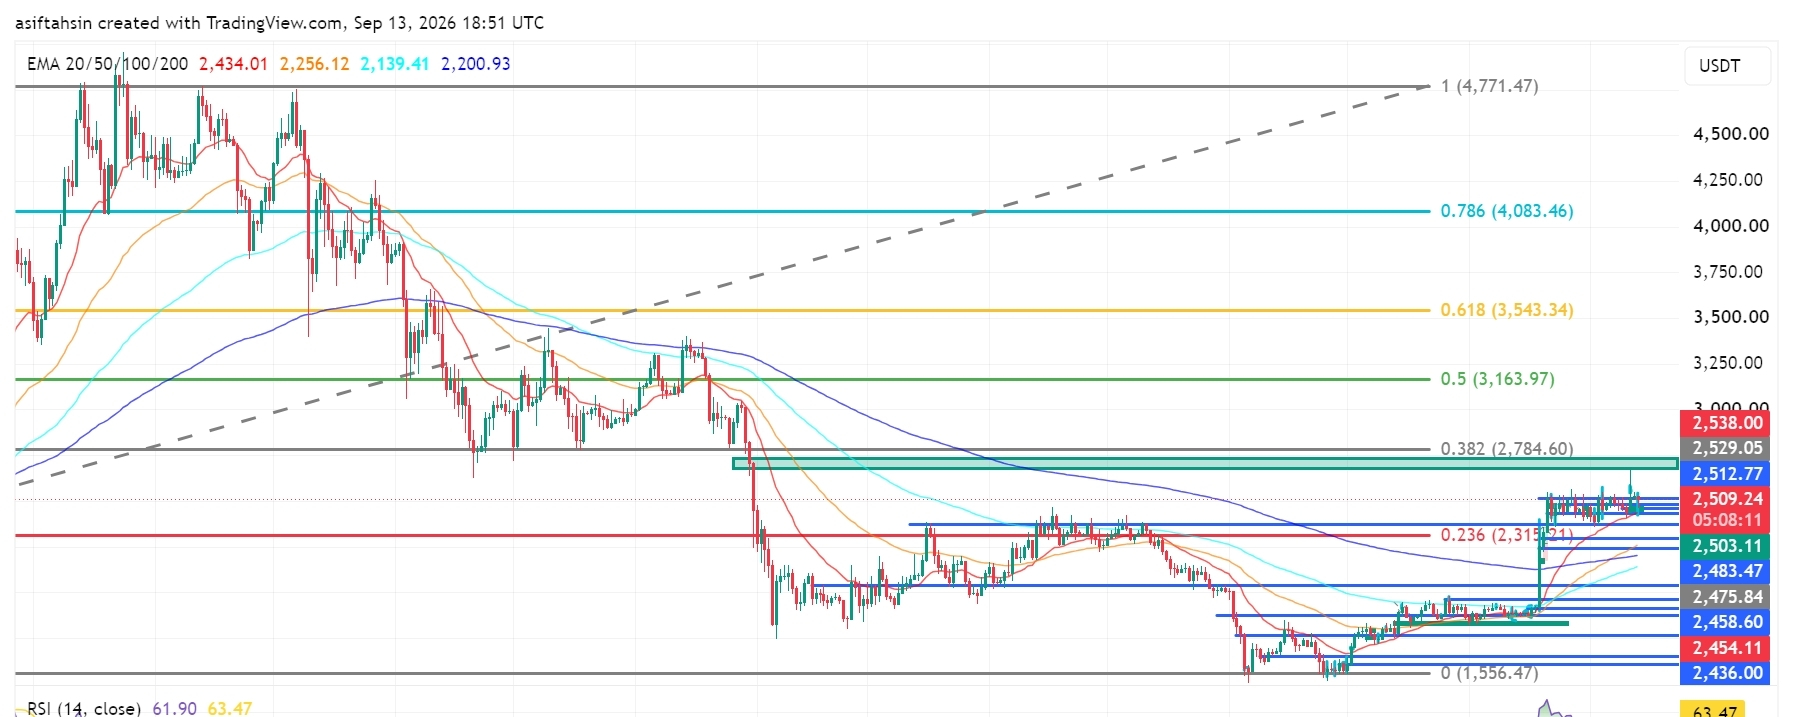
Artikel
Übersetzung ansehen
ETH Technical Outlook: Ethereum Holds Above $2.5K as Bulls Target Higher ResistanceETH is currently trading around $2,509, consolidating above the psychological $2,500 level after a strong recovery from the June lows.
The broader structure remains constructive, with ETH trading well above all four major EMAs. However, price is now approaching a significant resistance cluster around $2,512–$2,538. Bulls need a clean breakout above this zone to open the path toward the $2,784 Fibonacci resistance.
📈 EMA Structure
20 EMA: $2,434.01
50 EMA: $2,256.12
100 EMA: $2,139.41
200 EMA: $2,200.93
ETH remains comfortably above all four major EMAs, keeping the medium-term recovery structure bullish.
The $2,434 20 EMA is now the key dynamic support. As long as ETH remains above this level, buyers maintain control of the current recovery.
📐 Fibonacci Levels
0.236: $2,315.21
0.382: $2,784.60
0.5: $3,163.97
0.618: $3,543.34
0.786: $4,083.46
1.0: $4,771.47
The $2,784.60 0.382 Fibonacci level is the next major upside objective after the current resistance cluster.
🟢 Bullish Scenario
ETH is consolidating just below the $2,512–$2,538 resistance zone.
A clean breakout and sustained close above $2,538 could trigger another bullish expansion.
🎯 Target 1: $2,550
🎯 Target 2: $2,600
🎯 Target 3: $2,700
🎯 Target 4: $2,784.60
🎯 Target 5: $3,163.97
🎯 Target 6: $3,543.34
A decisive reclaim of $2,784.60 would be an important confirmation that ETH is transitioning into a stronger medium-term recovery phase.
🔴 Pullback Scenario
If ETH fails to break the $2,512–$2,538 resistance cluster, a short-term pullback could develop.
Key supports:
$2,503.11
$2,483.47
$2,475.84
$2,458.60
$2,454.11
$2,434.01 — 20 EMA
$2,315.21 — 0.236 Fib
The $2,454–$2,434 region is particularly important. A successful retest here could provide a base for another attempt at the $2,538 resistance.
A sustained break below the 20 EMA would weaken the short-term bullish structure.
🧠 Market Structure & Liquidity
ETH's recent structure can be viewed as:
Liquidity Sweep → Accumulation → Higher Lows → Breakout → Reclaim → Consolidation → Potential Continuation
The June low around $1,556 created a major liquidity sweep, followed by a strong recovery and a series of higher lows.
ETH has now reclaimed the $2,500 psychological level and is consolidating near the recent highs.
The next major structural test is $2,538, followed by the $2,784.60 Fibonacci resistance.
📊 RSI Momentum
RSI: 61.90
RSI MA: 63.47
RSI remains above 60, confirming that bullish momentum is still present.
However, RSI is slightly below its moving average, suggesting momentum has cooled from the recent spike. A renewed move above 63–65 would strengthen the continuation setup.
🎯 Key Levels
Resistance:
$2,512.77 → $2,529.05 → $2,538 → $2,784.60 → $3,163.97 → $3,543.34
Support:
$2,503.11 → $2,483.47 → $2,475.84 → $2,458.60 → $2,454.11 → $2,434.01 → $2,315.21
📌 Final Outlook
ETH remains in a constructive recovery structure while holding above the $2,500 area and all major EMAs.
The immediate battle is $2,512–$2,538. A decisive breakout above this zone could push ETH toward $2,600 → $2,700 → $2,784.60, while a confirmed break above $2,784 could open the path toward $3,163.97.
On the downside, $2,434 is the key dynamic support. As long as ETH holds above this level, the broader bullish recovery remains intact.
Bias: 🟢 Bullish above $2,434 | Stronger above $2,538
$ETH
{future}(ETHUSDT)
ETH Technical Outlook: Ethereum Holds Above $2.5K as Bulls Target Higher Resistance
ETH is currently trading around $2,509, consolidating above the psychological $2,500 level after a strong recovery from the June lows.
The broader structure remains constructive, with ETH trading well above all four major EMAs. However, price is now approaching a significant resistance cluster around $2,512–$2,538. Bulls need a clean breakout above this zone to open the path toward the $2,784 Fibonacci resistance.
📈 EMA Structure
20 EMA: $2,434.01
50 EMA: $2,256.12
100 EMA: $2,139.41
200 EMA: $2,200.93
ETH remains comfortably above all four major EMAs, keeping the medium-term recovery structure bullish.
The $2,434 20 EMA is now the key dynamic support. As long as ETH remains above this level, buyers maintain control of the current recovery.
📐 Fibonacci Levels
0.236: $2,315.21
0.382: $2,784.60
0.5: $3,163.97
0.618: $3,543.34
0.786: $4,083.46
1.0: $4,771.47
The $2,784.60 0.382 Fibonacci level is the next major upside objective after the current resistance cluster.
🟢 Bullish Scenario
ETH is consolidating just below the $2,512–$2,538 resistance zone.
A clean breakout and sustained close above $2,538 could trigger another bullish expansion.
🎯 Target 1: $2,550
🎯 Target 2: $2,600
🎯 Target 3: $2,700
🎯 Target 4: $2,784.60
🎯 Target 5: $3,163.97
🎯 Target 6: $3,543.34
A decisive reclaim of $2,784.60 would be an important confirmation that ETH is transitioning into a stronger medium-term recovery phase.
🔴 Pullback Scenario
If ETH fails to break the $2,512–$2,538 resistance cluster, a short-term pullback could develop.
Key supports:
$2,503.11
$2,483.47
$2,475.84
$2,458.60
$2,454.11
$2,434.01 — 20 EMA
$2,315.21 — 0.236 Fib
The $2,454–$2,434 region is particularly important. A successful retest here could provide a base for another attempt at the $2,538 resistance.
A sustained break below the 20 EMA would weaken the short-term bullish structure.
🧠 Market Structure & Liquidity
ETH's recent structure can be viewed as:
Liquidity Sweep → Accumulation → Higher Lows → Breakout → Reclaim → Consolidation → Potential Continuation
The June low around $1,556 created a major liquidity sweep, followed by a strong recovery and a series of higher lows.
ETH has now reclaimed the $2,500 psychological level and is consolidating near the recent highs.
The next major structural test is $2,538, followed by the $2,784.60 Fibonacci resistance.
📊 RSI Momentum
RSI: 61.90
RSI MA: 63.47
RSI remains above 60, confirming that bullish momentum is still present.
However, RSI is slightly below its moving average, suggesting momentum has cooled from the recent spike. A renewed move above 63–65 would strengthen the continuation setup.
🎯 Key Levels
Resistance:
$2,512.77 → $2,529.05 → $2,538 → $2,784.60 → $3,163.97 → $3,543.34
Support:
$2,503.11 → $2,483.47 → $2,475.84 → $2,458.60 → $2,454.11 → $2,434.01 → $2,315.21
📌 Final Outlook
ETH remains in a constructive recovery structure while holding above the $2,500 area and all major EMAs.
The immediate battle is $2,512–$2,538. A decisive breakout above this zone could push ETH toward $2,600 → $2,700 → $2,784.60, while a confirmed break above $2,784 could open the path toward $3,163.97.
On the downside, $2,434 is the key dynamic support. As long as ETH holds above this level, the broader bullish recovery remains intact.
Bias: 🟢 Bullish above $2,434 | Stronger above $2,538
$ETH
The broader structure remains constructive, with ETH trading well above all four major EMAs. However, price is now approaching a significant resistance cluster around $2,512–$2,538. Bulls need a clean breakout above this zone to open the path toward the $2,784 Fibonacci resistance.
📈 EMA Structure
20 EMA: $2,434.01
50 EMA: $2,256.12
100 EMA: $2,139.41
200 EMA: $2,200.93
ETH remains comfortably above all four major EMAs, keeping the medium-term recovery structure bullish.
The $2,434 20 EMA is now the key dynamic support. As long as ETH remains above this level, buyers maintain control of the current recovery.
📐 Fibonacci Levels
0.236: $2,315.21
0.382: $2,784.60
0.5: $3,163.97
0.618: $3,543.34
0.786: $4,083.46
1.0: $4,771.47
The $2,784.60 0.382 Fibonacci level is the next major upside objective after the current resistance cluster.
🟢 Bullish Scenario
ETH is consolidating just below the $2,512–$2,538 resistance zone.
A clean breakout and sustained close above $2,538 could trigger another bullish expansion.
🎯 Target 1: $2,550
🎯 Target 2: $2,600
🎯 Target 3: $2,700
🎯 Target 4: $2,784.60
🎯 Target 5: $3,163.97
🎯 Target 6: $3,543.34
A decisive reclaim of $2,784.60 would be an important confirmation that ETH is transitioning into a stronger medium-term recovery phase.
🔴 Pullback Scenario
If ETH fails to break the $2,512–$2,538 resistance cluster, a short-term pullback could develop.
Key supports:
$2,503.11
$2,483.47
$2,475.84
$2,458.60
$2,454.11
$2,434.01 — 20 EMA
$2,315.21 — 0.236 Fib
The $2,454–$2,434 region is particularly important. A successful retest here could provide a base for another attempt at the $2,538 resistance.
A sustained break below the 20 EMA would weaken the short-term bullish structure.
🧠 Market Structure & Liquidity
ETH's recent structure can be viewed as:
Liquidity Sweep → Accumulation → Higher Lows → Breakout → Reclaim → Consolidation → Potential Continuation
The June low around $1,556 created a major liquidity sweep, followed by a strong recovery and a series of higher lows.
ETH has now reclaimed the $2,500 psychological level and is consolidating near the recent highs.
The next major structural test is $2,538, followed by the $2,784.60 Fibonacci resistance.
📊 RSI Momentum
RSI: 61.90
RSI MA: 63.47
RSI remains above 60, confirming that bullish momentum is still present.
However, RSI is slightly below its moving average, suggesting momentum has cooled from the recent spike. A renewed move above 63–65 would strengthen the continuation setup.
🎯 Key Levels
Resistance:
$2,512.77 → $2,529.05 → $2,538 → $2,784.60 → $3,163.97 → $3,543.34
Support:
$2,503.11 → $2,483.47 → $2,475.84 → $2,458.60 → $2,454.11 → $2,434.01 → $2,315.21
📌 Final Outlook
ETH remains in a constructive recovery structure while holding above the $2,500 area and all major EMAs.
The immediate battle is $2,512–$2,538. A decisive breakout above this zone could push ETH toward $2,600 → $2,700 → $2,784.60, while a confirmed break above $2,784 could open the path toward $3,163.97.
On the downside, $2,434 is the key dynamic support. As long as ETH holds above this level, the broader bullish recovery remains intact.
Bias: 🟢 Bullish above $2,434 | Stronger above $2,538
$ETH
83
·
--
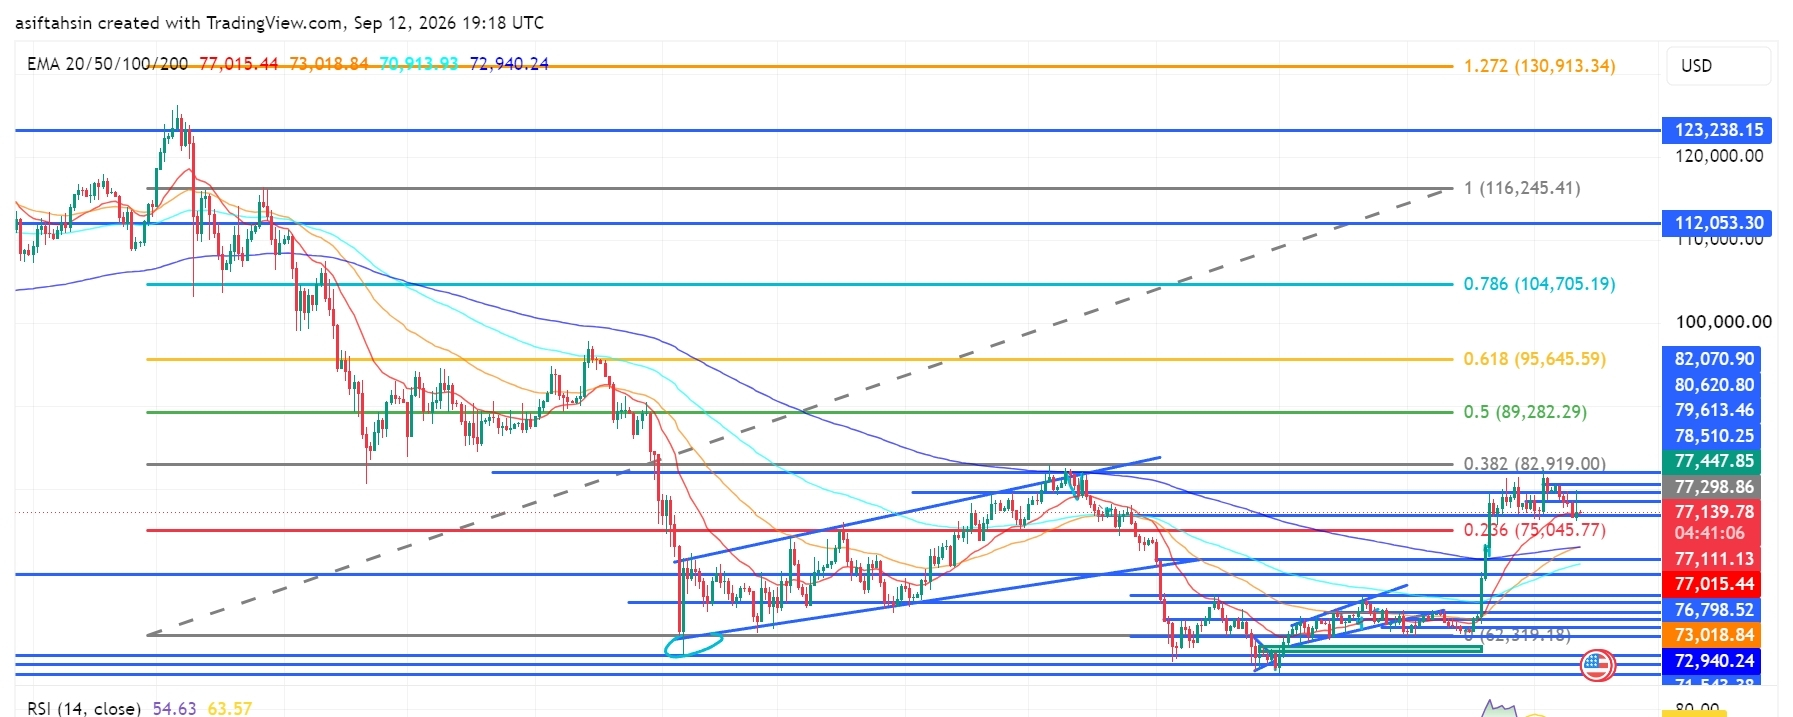
Artikel
Übersetzung ansehen
BTC Technical Outlook: Bitcoin Holds Above $77K as Bulls Defend the BreakoutBTC is currently trading around $77.1K, consolidating above the $75K–$77K breakout zone after the recent bullish recovery.
The broader structure remains constructive, but BTC is facing strong resistance around $77.4K–$82.9K. Bulls need to reclaim this resistance cluster and break the $82,919 Fibonacci level to unlock the next major upside expansion.
📈 EMA Structure
20 EMA: $77,015.44
50 EMA: $73,018.84
100 EMA: $70,913.93
200 EMA: $72,940.24
BTC is currently holding just above the 20 EMA, while remaining above the 50, 100 and 200 EMAs.
The $77,015 20 EMA is now an important short-term pivot. Holding above it keeps the recent recovery structure intact.
📐 Fibonacci Levels
0.236: $75,045.77
0.382: $82,919.00
0.5: $89,282.29
0.618: $95,645.59
0.786: $104,705.19
1.0: $116,245.41
1.272: $130,913.34
The $82,919 0.382 Fibonacci level is the key breakout point. A sustained move above it would significantly strengthen the medium-term bullish structure.
🟢 Bullish Scenario
BTC is currently consolidating below the $77.4K–$80.6K resistance cluster.
A clean breakout above $78,510–$79,614 could bring the next resistance levels into play.
🎯 Target 1: $80,620
🎯 Target 2: $82,070
🎯 Target 3: $82,919
🎯 Target 4: $89,282
🎯 Target 5: $95,645
🎯 Target 6: $104,705
If BTC successfully reclaims $82,919, the broader recovery could accelerate toward $89K and $95.6K.
🔴 Pullback Scenario
If BTC fails to break the current resistance zone, sellers could push price back toward the EMA and Fibonacci support structure.
Key supports:
$77,015 — 20 EMA
$76,798
$75,045 — 0.236 Fib
$73,018 — 50 EMA
$72,940 — 200 EMA
$71,543
$70,913 — 100 EMA
The $75,045–$77,015 region is particularly important. A successful retest here could provide the foundation for another attempt at $80K+.
However, losing $72,940–$70,913 would significantly weaken the current recovery structure.
🧠 Market Structure & Liquidity
BTC's recent structure can be viewed as:
Liquidity Sweep → Accumulation → Higher Highs/Higher Lows → Breakout → Retest → Consolidation → Potential Continuation
The June/July lows created a major liquidity area, followed by a strong recovery and breakout through the previous consolidation range.
BTC is now attempting to establish acceptance above $77K. The next major structural test is the $82K–$82.9K region, where previous price action and the 0.382 Fibonacci level converge.
📊 RSI Momentum
RSI: 54.63
RSI MA: 63.57
RSI remains above the neutral 50 level, indicating that bullish momentum is still present.
However, RSI is below its moving average, showing that momentum has cooled from the recent spike. A move back above 60–63 would strengthen the continuation setup.
🎯 Key Levels
Resistance:
$77,447 → $78,510 → $79,614 → $80,620 → $82,070 → $82,919 → $89,282 → $95,645
Support:
$77,015 → $76,798 → $75,045 → $73,018 → $72,940 → $71,543 → $70,913
📌 Final Outlook
BTC remains in a constructive recovery structure while holding above the $75K–$77K zone and the major EMA support cluster.
The immediate battle is $77.4K–$80.6K. A decisive breakout above this region could send BTC toward $82K–$82.9K, while a confirmed break above $82,919 would open the path toward $89.2K → $95.6K → $104.7K.
On the downside, $75,045 is the key Fibonacci support, while $72.9K–$70.9K is the major structural defense.
Bias: 🟢 Bullish above $75,045 | Stronger above $82,919
$BTC
{future}(BTCUSDT)
BTC Technical Outlook: Bitcoin Holds Above $77K as Bulls Defend the Breakout
BTC is currently trading around $77.1K, consolidating above the $75K–$77K breakout zone after the recent bullish recovery.
The broader structure remains constructive, but BTC is facing strong resistance around $77.4K–$82.9K. Bulls need to reclaim this resistance cluster and break the $82,919 Fibonacci level to unlock the next major upside expansion.
📈 EMA Structure
20 EMA: $77,015.44
50 EMA: $73,018.84
100 EMA: $70,913.93
200 EMA: $72,940.24
BTC is currently holding just above the 20 EMA, while remaining above the 50, 100 and 200 EMAs.
The $77,015 20 EMA is now an important short-term pivot. Holding above it keeps the recent recovery structure intact.
📐 Fibonacci Levels
0.236: $75,045.77
0.382: $82,919.00
0.5: $89,282.29
0.618: $95,645.59
0.786: $104,705.19
1.0: $116,245.41
1.272: $130,913.34
The $82,919 0.382 Fibonacci level is the key breakout point. A sustained move above it would significantly strengthen the medium-term bullish structure.
🟢 Bullish Scenario
BTC is currently consolidating below the $77.4K–$80.6K resistance cluster.
A clean breakout above $78,510–$79,614 could bring the next resistance levels into play.
🎯 Target 1: $80,620
🎯 Target 2: $82,070
🎯 Target 3: $82,919
🎯 Target 4: $89,282
🎯 Target 5: $95,645
🎯 Target 6: $104,705
If BTC successfully reclaims $82,919, the broader recovery could accelerate toward $89K and $95.6K.
🔴 Pullback Scenario
If BTC fails to break the current resistance zone, sellers could push price back toward the EMA and Fibonacci support structure.
Key supports:
$77,015 — 20 EMA
$76,798
$75,045 — 0.236 Fib
$73,018 — 50 EMA
$72,940 — 200 EMA
$71,543
$70,913 — 100 EMA
The $75,045–$77,015 region is particularly important. A successful retest here could provide the foundation for another attempt at $80K+.
However, losing $72,940–$70,913 would significantly weaken the current recovery structure.
🧠 Market Structure & Liquidity
BTC's recent structure can be viewed as:
Liquidity Sweep → Accumulation → Higher Highs/Higher Lows → Breakout → Retest → Consolidation → Potential Continuation
The June/July lows created a major liquidity area, followed by a strong recovery and breakout through the previous consolidation range.
BTC is now attempting to establish acceptance above $77K. The next major structural test is the $82K–$82.9K region, where previous price action and the 0.382 Fibonacci level converge.
📊 RSI Momentum
RSI: 54.63
RSI MA: 63.57
RSI remains above the neutral 50 level, indicating that bullish momentum is still present.
However, RSI is below its moving average, showing that momentum has cooled from the recent spike. A move back above 60–63 would strengthen the continuation setup.
🎯 Key Levels
Resistance:
$77,447 → $78,510 → $79,614 → $80,620 → $82,070 → $82,919 → $89,282 → $95,645
Support:
$77,015 → $76,798 → $75,045 → $73,018 → $72,940 → $71,543 → $70,913
📌 Final Outlook
BTC remains in a constructive recovery structure while holding above the $75K–$77K zone and the major EMA support cluster.
The immediate battle is $77.4K–$80.6K. A decisive breakout above this region could send BTC toward $82K–$82.9K, while a confirmed break above $82,919 would open the path toward $89.2K → $95.6K → $104.7K.
On the downside, $75,045 is the key Fibonacci support, while $72.9K–$70.9K is the major structural defense.
Bias: 🟢 Bullish above $75,045 | Stronger above $82,919
$BTC
The broader structure remains constructive, but BTC is facing strong resistance around $77.4K–$82.9K. Bulls need to reclaim this resistance cluster and break the $82,919 Fibonacci level to unlock the next major upside expansion.
📈 EMA Structure
20 EMA: $77,015.44
50 EMA: $73,018.84
100 EMA: $70,913.93
200 EMA: $72,940.24
BTC is currently holding just above the 20 EMA, while remaining above the 50, 100 and 200 EMAs.
The $77,015 20 EMA is now an important short-term pivot. Holding above it keeps the recent recovery structure intact.
📐 Fibonacci Levels
0.236: $75,045.77
0.382: $82,919.00
0.5: $89,282.29
0.618: $95,645.59
0.786: $104,705.19
1.0: $116,245.41
1.272: $130,913.34
The $82,919 0.382 Fibonacci level is the key breakout point. A sustained move above it would significantly strengthen the medium-term bullish structure.
🟢 Bullish Scenario
BTC is currently consolidating below the $77.4K–$80.6K resistance cluster.
A clean breakout above $78,510–$79,614 could bring the next resistance levels into play.
🎯 Target 1: $80,620
🎯 Target 2: $82,070
🎯 Target 3: $82,919
🎯 Target 4: $89,282
🎯 Target 5: $95,645
🎯 Target 6: $104,705
If BTC successfully reclaims $82,919, the broader recovery could accelerate toward $89K and $95.6K.
🔴 Pullback Scenario
If BTC fails to break the current resistance zone, sellers could push price back toward the EMA and Fibonacci support structure.
Key supports:
$77,015 — 20 EMA
$76,798
$75,045 — 0.236 Fib
$73,018 — 50 EMA
$72,940 — 200 EMA
$71,543
$70,913 — 100 EMA
The $75,045–$77,015 region is particularly important. A successful retest here could provide the foundation for another attempt at $80K+.
However, losing $72,940–$70,913 would significantly weaken the current recovery structure.
🧠 Market Structure & Liquidity
BTC's recent structure can be viewed as:
Liquidity Sweep → Accumulation → Higher Highs/Higher Lows → Breakout → Retest → Consolidation → Potential Continuation
The June/July lows created a major liquidity area, followed by a strong recovery and breakout through the previous consolidation range.
BTC is now attempting to establish acceptance above $77K. The next major structural test is the $82K–$82.9K region, where previous price action and the 0.382 Fibonacci level converge.
📊 RSI Momentum
RSI: 54.63
RSI MA: 63.57
RSI remains above the neutral 50 level, indicating that bullish momentum is still present.
However, RSI is below its moving average, showing that momentum has cooled from the recent spike. A move back above 60–63 would strengthen the continuation setup.
🎯 Key Levels
Resistance:
$77,447 → $78,510 → $79,614 → $80,620 → $82,070 → $82,919 → $89,282 → $95,645
Support:
$77,015 → $76,798 → $75,045 → $73,018 → $72,940 → $71,543 → $70,913
📌 Final Outlook
BTC remains in a constructive recovery structure while holding above the $75K–$77K zone and the major EMA support cluster.
The immediate battle is $77.4K–$80.6K. A decisive breakout above this region could send BTC toward $82K–$82.9K, while a confirmed break above $82,919 would open the path toward $89.2K → $95.6K → $104.7K.
On the downside, $75,045 is the key Fibonacci support, while $72.9K–$70.9K is the major structural defense.
Bias: 🟢 Bullish above $75,045 | Stronger above $82,919
$BTC
37
Anmelden und weiter Inhalte entdecken
Krypto-Nutzer weltweit auf Binance Square kennenlernen
⚡️ Bleib in Sachen Krypto stets am Puls.
💬 Die weltgrößte Kryptobörse vertraut darauf.
👍 Erhalte verlässliche Einblicke von verifizierten Creators.
E-Mail-Adresse/Telefonnummer
Trendthemen
AIStocksWhatNext
88,755 Aufrufe
1,130 Kommentare
Teile & gewinne Traffic-Rewards in unserer angesagten Hashtag-Kampagne
✨Thema: Welche anderen Investitionsmöglichkeiten gibt es noch, während KI-Aktien weiter steigen?
👉So machst du mit:
Veröffentliche einen kurzen Beitrag oder Artikel mit dem Hashtag #AIStocksWhatNext
Teile, ob du bullisch oder bärisch bist, und poste deine KI-Aktienbestände oder Trades – die Nutzung des Trade-Widgets kann deine Berechtigung verbessern.
Du kannst deinen Beitrag auch stärken, indem du Daten oder Diagramme teilst und KI-generierte Bilder vermeidest.
✍️Erstelle Inhalte basierend auf den folgenden Blickwinkeln:
- Nvidia sagt, dass sich der Chip-Umsatz im nächsten Jahr verdoppeln wird, und die führenden KI-Unternehmen erreichen weiterhin Rekordumsätze – der Rechenaufwand dahinter ist ebenso beeindruckend. Verläuft die Nachfrage nach KI wirklich gerade erst so richtig, oder geht es nur noch eine Weile weiter? KI-Aktien steigen derzeit branchenweit. Ist das ein echter Ausbruch oder nur ein kurzfristiger Rückprall?
- Branchenführer fordern dazu auf, die Entwicklung von KI zu verlangsamen, während Trump plant, eine „AI Force“ aufzubauen, und behauptet, KI könne in der Zukunft 25% des US-BIP ausmachen. Auf welcher Seite stehst du? Wird staatliche Unterstützung ein langfristiger Gewinn für KI-Aktien sein?
- Kaufst du KI-Aktien? Teile deinen KI-bezogenen Trade/deine Bestände mit unserem Trade-Sharing-Widget.
⏰Kampagnenzeitraum:
- 2026-09-22 7:00 - 2026-09-24 4:00 UTC
🎁Belohnung:
- Qualifizierte Beiträge, die die oben genannten Richtlinien einhalten und mehr als 100 Wörter enthalten, werden überprüft und können möglicherweise einen zufälligen Traffic-Boost von 500 bis 3.000 Views erhalten. Du erhältst eine Benachrichtigung von deiner Feed-Sekretärin, wenn dein Beitrag ausgewählt wurde.
- Erhalte die Chance, dass dein Artikel auf Binance Square Official vorgestellt wird
Brauchst du Ideen für deinen Beitrag? Besuche die Thema-Seite #AIStocksWhatNext oder die Square Guide on How to Post for Better Reach.
Binance Square Official
·188 Likes
·286.5k Aufrufe
BitcoinBreaksAboveMayHighNears$86K
899 Aufrufe
29 Kommentare
DogecoinRises15%
2,837 Aufrufe
149 Kommentare