
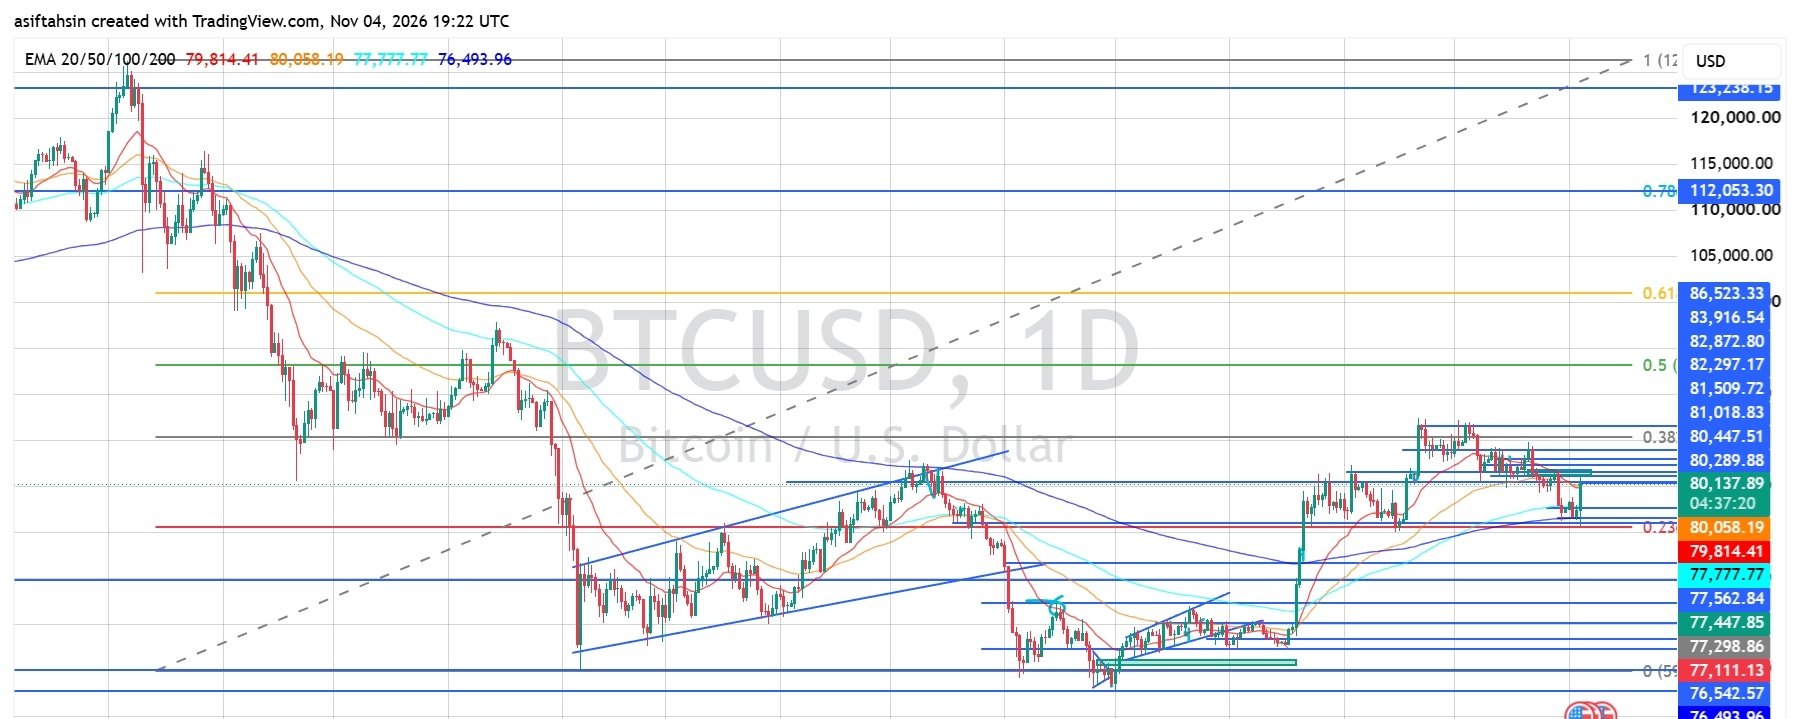

Bitcoin is currently trading around $80,137, attempting to recover after a recent pullback from the $81,000–$81,500 region. Price has moved back toward the short-term moving averages, but BTC is still facing resistance around $80,300–$80,450.
The market is showing signs of stabilization after the recent decline. However, buyers need to reclaim the $81,000–$81,500 zone to strengthen the recovery. Holding above the $79,800 area is important to prevent further downside pressure.
EMA Structure
* 20 EMA: $79,814.41
* 50 EMA: $80,058.19
* 100 EMA: $77,777.77
* 200 EMA: $76,493.96
BTC is trading slightly above all four EMAs, suggesting that the broader recovery structure remains intact. However, the 20 and 50 EMAs are close to the current price, making the $79,800–$80,100 region an important short-term support area.
A sustained move above the $80,450 resistance zone would improve the immediate bullish outlook.
Fibonacci Levels
Based on the chart:
* 0.236: Around $79,800
* 0.382: $80,447.51
* 0.5: $82,872.80
* 0.618: Around $100,000
* 0.786: $112,053.30
* 1.0: $123,238.15
BTC is currently trading around the lower Fibonacci retracement area. Reclaiming $80,447 would be an important step toward a recovery, while the next major Fibonacci resistance is near $82,872.
Bullish Scenario
If BTC maintains support above $79,800 and breaks through the nearby resistance zone, buyers could attempt a move toward:
$80,289–$80,447
$81,018
$81,509
$82,297
$82,872
$83,916
$86,523
A sustained breakout above $81,509 would strengthen the short-term recovery structure. A move above $82,872 could open the path toward the $83,916–$86,523 resistance region.
Pullback Scenario
If BTC fails to hold above $79,800 and selling pressure increases, the following support levels become important:
* $79,814 — 20 EMA
* $80,058 — 50 EMA
* $77,777 — 100 EMA
* $77,562
* $77,447
* $77,298–$77,111
* $76,542–$76,493 — 200 EMA area
* $75,982
* $71,543
A sustained move below $79,800 would weaken the immediate recovery and could expose the $77,777–$77,100 support region. Losing that area would increase the risk of a deeper correction toward the $76,500 zone.
RSI Momentum
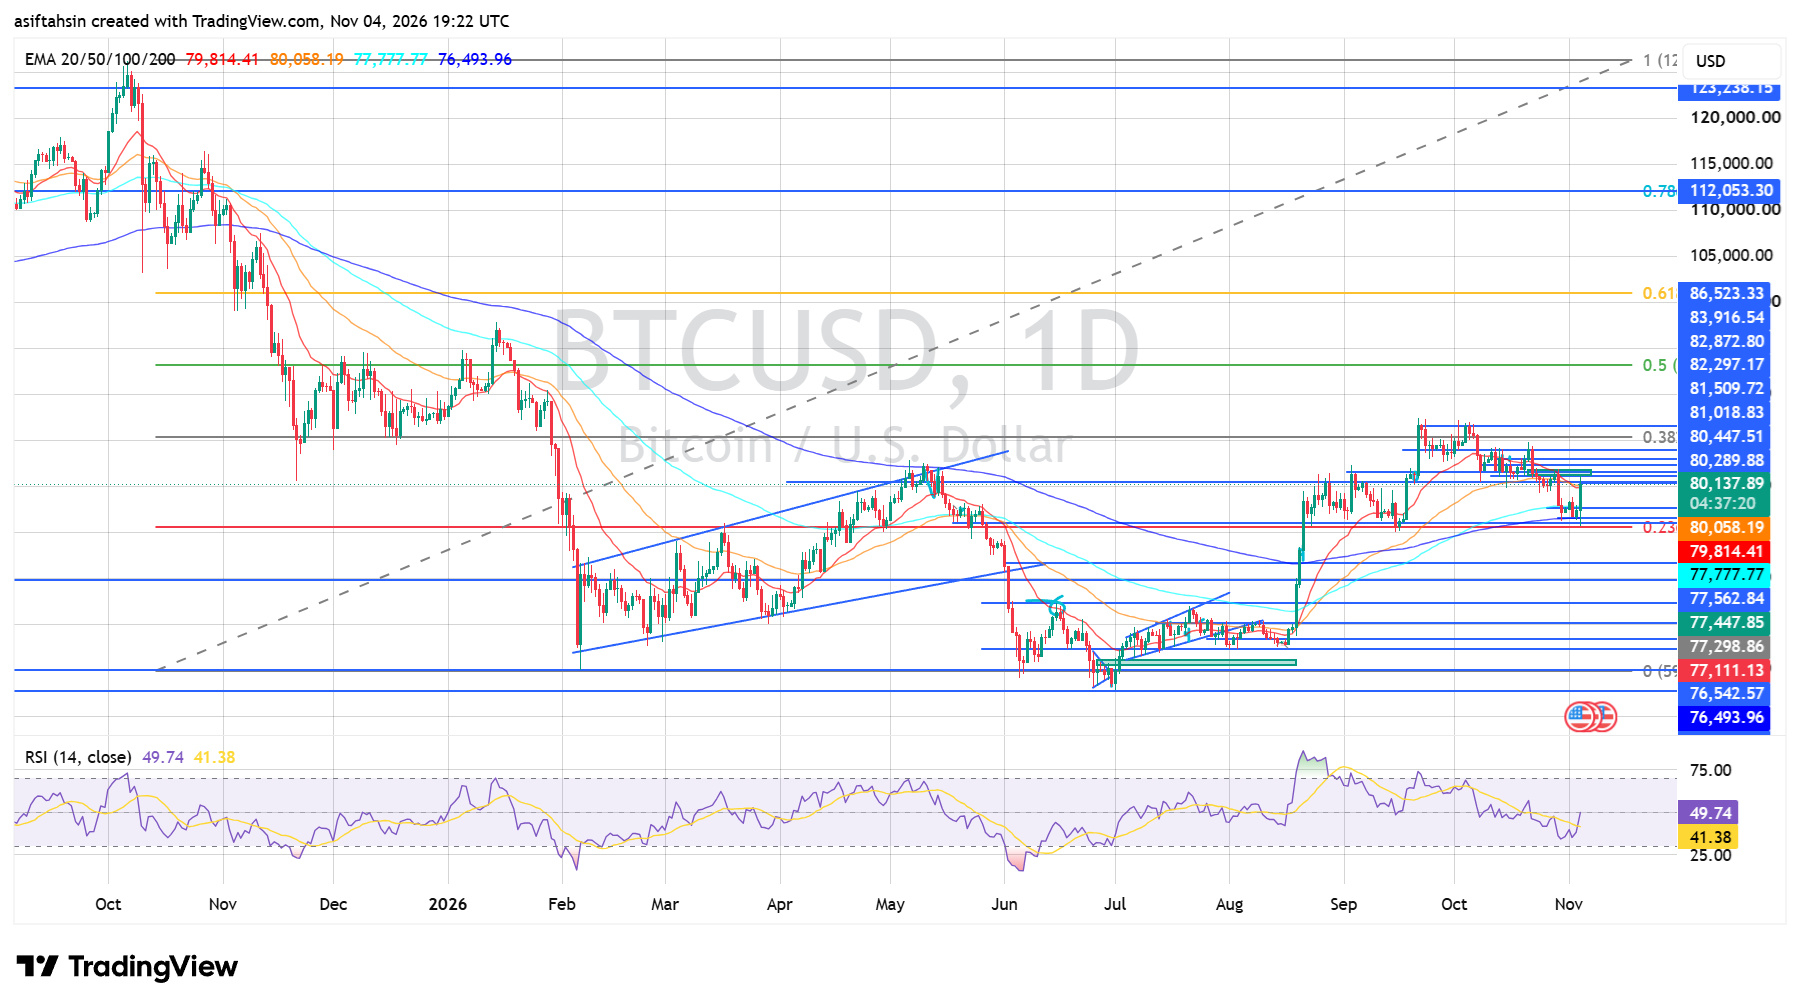
* RSI: 49.74
* RSI Signal Average: 41.38
RSI has recovered toward the neutral 50 level and is currently above its signal average. This indicates improving momentum, although bullish strength is not yet firmly established.
A sustained move above 50–55 would support further recovery, while a drop below 45 could indicate renewed selling pressure.
Market Structure & Liquidity
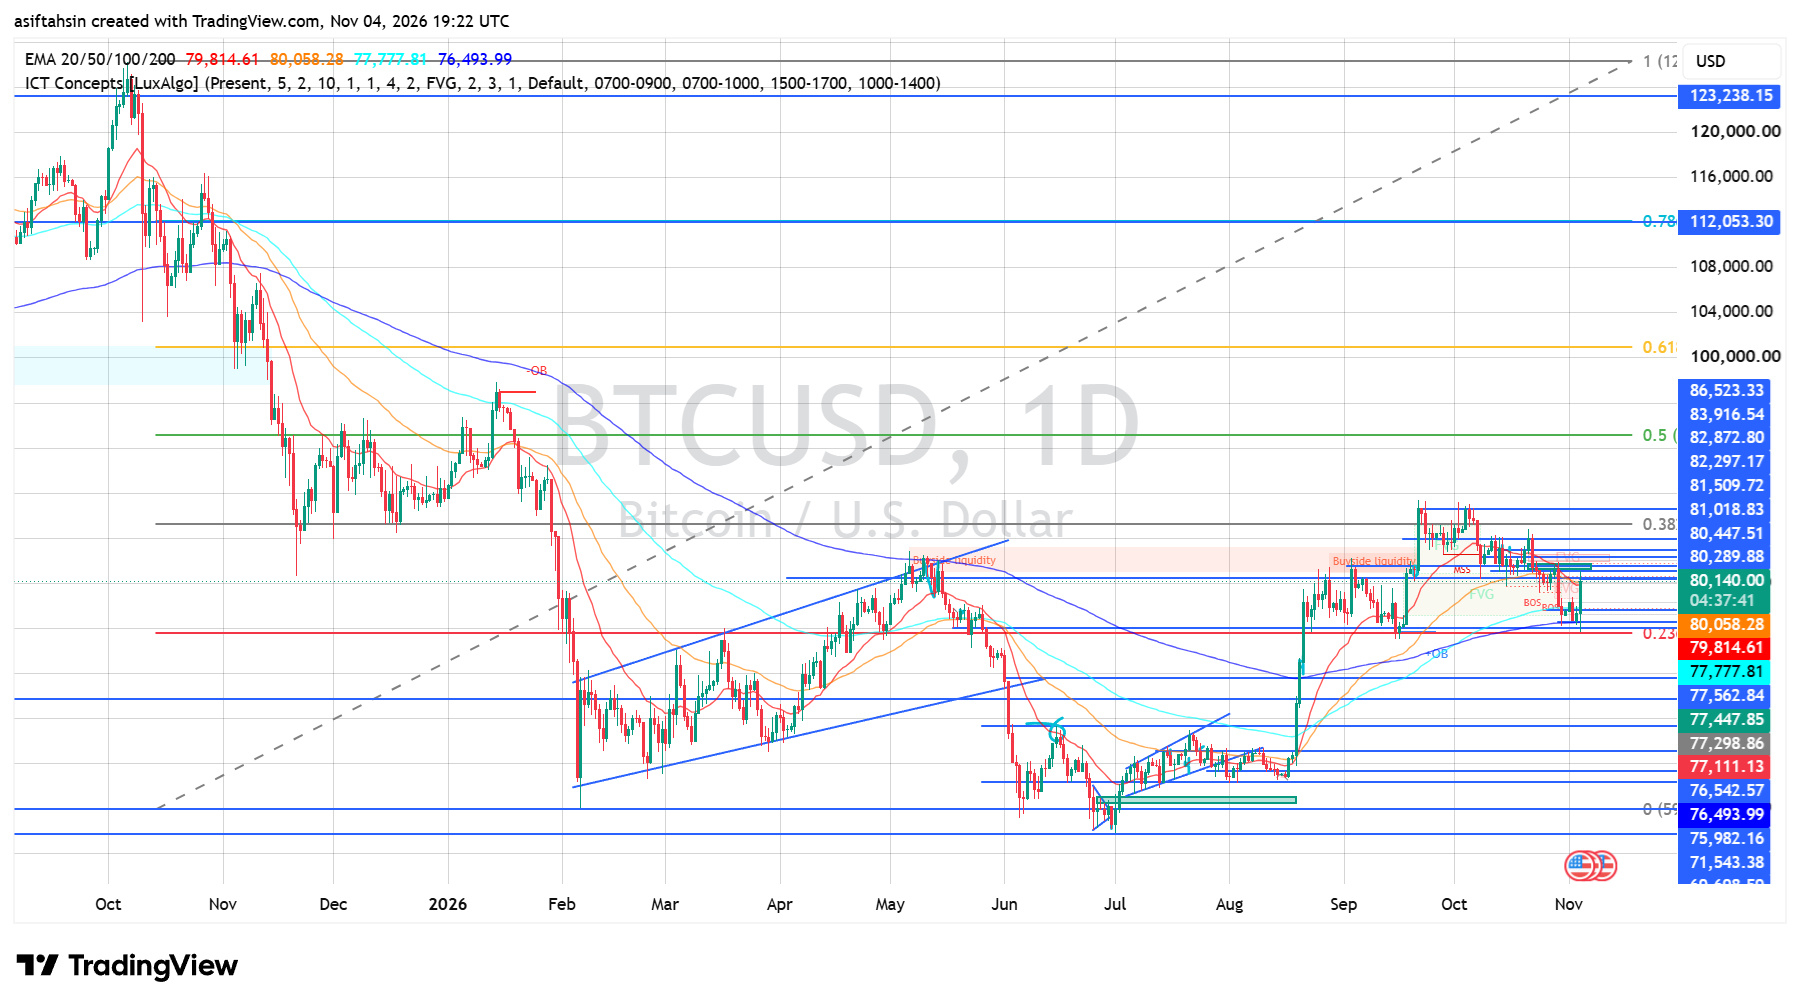
BTC has recovered from the $76,000–$77,000 region and previously rallied toward the $81,000 area. However, the latest price action shows a pullback and consolidation around $80,000.
The current price is trading near the 20 and 50 EMAs, with resistance building around $80,300–$80,450. Buyers need to reclaim the recent resistance levels to confirm that bullish momentum is returning.
The broader recovery remains constructive while BTC holds above the $77,100–$77,700 support region. However, a decisive breakout above $81,509 is needed to strengthen the bullish continuation scenario.
Key Levels
Resistance
* $80,289–$80,447
* $81,018
* $81,509
* $82,297
* $82,872
* $83,916
* $86,523
Support
* $79,814
* $80,058
* $77,777
* $77,562–$77,447
* $77,298–$77,111
* $76,542–$76,493
* $75,982
* $71,543
Final Outlook
BTC is showing early signs of stabilization around $80K, with RSI recovering toward neutral and price trading slightly above its major EMAs.
A sustained move above $80,447 could open the way toward $81,509, followed by $82,872 and $83,916. On the downside, losing $79,814 would increase the risk of a correction toward $77,777–$77,100.
Bias: Neutral to cautiously bullish while holding above $79,800 | Breakout above $81,509 could open the path toward $82,872–$83,916.
These levels are based on the November 4, 2026 chart and represent potential scenarios, not guaranteed price movements.
