
BitcoinGuide
80 Beiträge

BitcoinGuide
Melden
Nutzer blockieren
I've been working as a chart analyst at TradingView for 10 years. You can check "Bitcoin" entry prices, target prices, stop-loss and trading paths in real time daily on a 30-minute candle chart. You'll be the experience a new world. Thank you.
0 Following
2 Follower
1 Like gegeben
Beiträge
Alle
Videos
·
--
[September 11 Bitcoin-Chartanalyse]
BTCUSD 30Min Chart
*Meine Analyse ist für TradingView optimiert.
Wenn du die Replay-Schaltfläche drückst, kannst du die Bewegungen in Echtzeit überprüfen.
-Long-Position-Strategie-
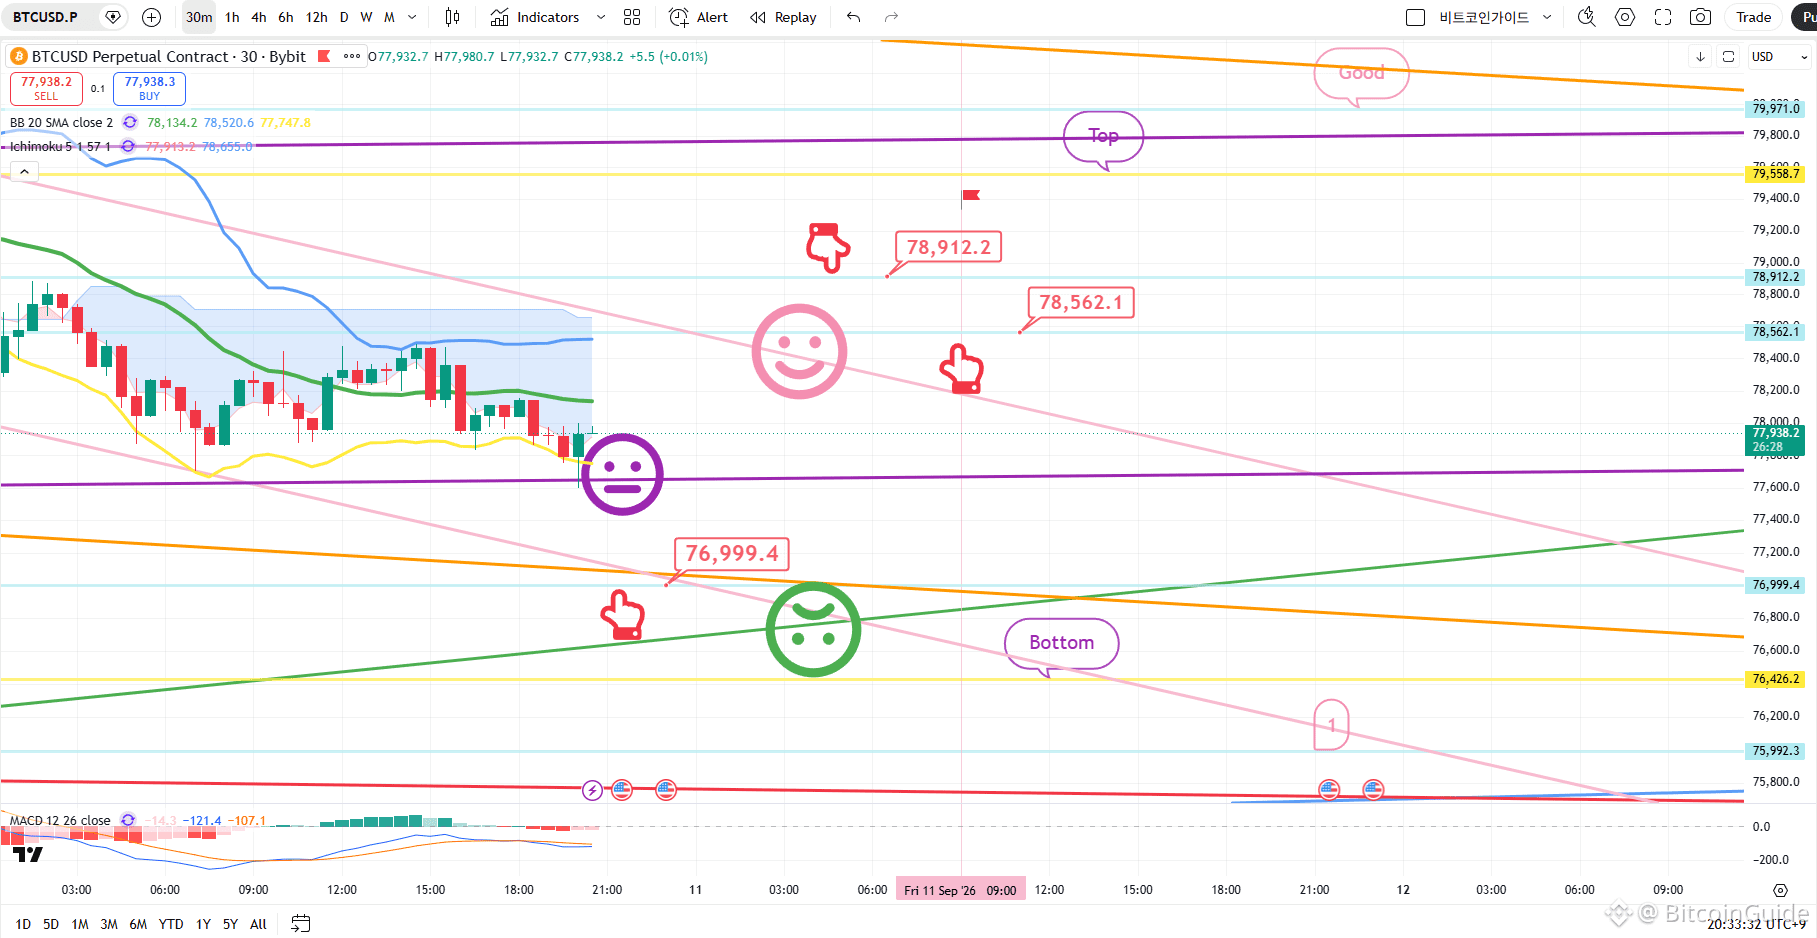
Unten links habe ich die Strategie für den Einstiegspunkt der Long-Position bei 76.999,4 $ (mit einem violetten Finger markiert) beibehalten, die am 10. September festgelegt wurde.
Die CPI-Datenveröffentlichung ist für 9:30 Uhr kurz zuvor geplant.
*Long-Position-Strategie bezüglich der oberen Zone „Purple Finger 1“:
1) Nach Bestätigung eines Touchs der Zone „Purple Finger 1“ bei 78.360,4 $:
Long-Position Einstieg bei 77.743,5 $ (roter Finger); Stop-Loss, wenn die violette Unterstützungs-Linie durchbrochen wird.
2) Erster Long-Zielbereich bei 79.558,7 $ ->
Weitere Ziele für das Wochenende: „Good“, gefolgt von „Great.“
- Wenn die Strategie erfolgreich ist, kann die 78,9K-Ebene genutzt werden, um erneut eine Long-Position einzusteigen.
3) Wenn der Preis direkt fällt, ohne die Zone „Purple Finger 1“ zu berühren:
Long-Position Einstieg in der unteren „Zone 2“ (76.748,2 $); Stop-Loss, wenn die violette Unterstützungs-Linie durchbrochen wird.
- Für diejenigen, die aktuell die 76,9K-Long-Position halten, kannst du die gleiche Stop-Loss-Regel anwenden (Ausstieg, wenn die violette Unterstützungs-Linie durchbrochen wird).
- Wenn die violette Unterstützungs-Linie bricht, bewegt sich der Kurs in die „Bottom“-Zone (die letzte Unterstützungs-Linie des steigenden Kanals).
- Obwohl das im Chart nicht sichtbar ist, gibt es potenziellen Abwärts-Spielraum bis zu 74,9K unter diese Marke.
Bitte nutze diese Analyse ausschließlich als Referenz und für Planungszwecke.
Ich hoffe, du handelst sicher, indem du dich an deine Prinzipien hältst und Stop-Loss-Orders verwendest.
Ich poste die Analyse-Ergebnisse jeden Tag als Kommentar.
Vielen Dank.
(Du findest den Link in meinem Profil.)
- Klicke auf „Folgen“, um jeden Tag schnellere Informationen zu erhalten.
- Prüfe die Ergebnisse mit der Replay-Schaltfläche auf TradingView.
#BTC-Preisanalye# #BNBChain# #BTC100K #Altcoin-Season# $USDT $ETH $XRP $SOL $BTC
[September 11 Bitcoin-Chartanalyse]
BTCUSD 30Min Chart
*Meine Analyse ist für TradingView optimiert.
Wenn du die Replay-Schaltfläche drückst, kannst du die Bewegungen in Echtzeit überprüfen.
-Long-Position-Strategie-
Unten links habe ich die Strategie für den Einstiegspunkt der Long-Position bei 76.999,4 $ (mit einem violetten Finger markiert) beibehalten, die am 10. September festgelegt wurde.
Die CPI-Datenveröffentlichung ist für 9:30 Uhr kurz zuvor geplant.
*Long-Position-Strategie bezüglich der oberen Zone „Purple Finger 1“:
1) Nach Bestätigung eines Touchs der Zone „Purple Finger 1“ bei 78.360,4 $:
Long-Position Einstieg bei 77.743,5 $ (roter Finger); Stop-Loss, wenn die violette Unterstützungs-Linie durchbrochen wird.
2) Erster Long-Zielbereich bei 79.558,7 $ ->
Weitere Ziele für das Wochenende: „Good“, gefolgt von „Great.“
- Wenn die Strategie erfolgreich ist, kann die 78,9K-Ebene genutzt werden, um erneut eine Long-Position einzusteigen.
3) Wenn der Preis direkt fällt, ohne die Zone „Purple Finger 1“ zu berühren:
Long-Position Einstieg in der unteren „Zone 2“ (76.748,2 $); Stop-Loss, wenn die violette Unterstützungs-Linie durchbrochen wird.
- Für diejenigen, die aktuell die 76,9K-Long-Position halten, kannst du die gleiche Stop-Loss-Regel anwenden (Ausstieg, wenn die violette Unterstützungs-Linie durchbrochen wird).
- Wenn die violette Unterstützungs-Linie bricht, bewegt sich der Kurs in die „Bottom“-Zone (die letzte Unterstützungs-Linie des steigenden Kanals).
- Obwohl das im Chart nicht sichtbar ist, gibt es potenziellen Abwärts-Spielraum bis zu 74,9K unter diese Marke.
Bitte nutze diese Analyse ausschließlich als Referenz und für Planungszwecke.
Ich hoffe, du handelst sicher, indem du dich an deine Prinzipien hältst und Stop-Loss-Orders verwendest.
Ich poste die Analyse-Ergebnisse jeden Tag als Kommentar.
Vielen Dank.
(Du findest den Link in meinem Profil.)
- Klicke auf „Folgen“, um jeden Tag schnellere Informationen zu erhalten.
- Prüfe die Ergebnisse mit der Replay-Schaltfläche auf TradingView.
#BTC-Preisanalye# #BNBChain# #BTC100K #Altcoin-Season# $USDT $ETH $XRP $SOL $BTC
BTCUSD 30Min Chart
*Meine Analyse ist für TradingView optimiert.
Wenn du die Replay-Schaltfläche drückst, kannst du die Bewegungen in Echtzeit überprüfen.
-Long-Position-Strategie-
Unten links habe ich die Strategie für den Einstiegspunkt der Long-Position bei 76.999,4 $ (mit einem violetten Finger markiert) beibehalten, die am 10. September festgelegt wurde.
Die CPI-Datenveröffentlichung ist für 9:30 Uhr kurz zuvor geplant.
*Long-Position-Strategie bezüglich der oberen Zone „Purple Finger 1“:
1) Nach Bestätigung eines Touchs der Zone „Purple Finger 1“ bei 78.360,4 $:
Long-Position Einstieg bei 77.743,5 $ (roter Finger); Stop-Loss, wenn die violette Unterstützungs-Linie durchbrochen wird.
2) Erster Long-Zielbereich bei 79.558,7 $ ->
Weitere Ziele für das Wochenende: „Good“, gefolgt von „Great.“
- Wenn die Strategie erfolgreich ist, kann die 78,9K-Ebene genutzt werden, um erneut eine Long-Position einzusteigen.
3) Wenn der Preis direkt fällt, ohne die Zone „Purple Finger 1“ zu berühren:
Long-Position Einstieg in der unteren „Zone 2“ (76.748,2 $); Stop-Loss, wenn die violette Unterstützungs-Linie durchbrochen wird.
- Für diejenigen, die aktuell die 76,9K-Long-Position halten, kannst du die gleiche Stop-Loss-Regel anwenden (Ausstieg, wenn die violette Unterstützungs-Linie durchbrochen wird).
- Wenn die violette Unterstützungs-Linie bricht, bewegt sich der Kurs in die „Bottom“-Zone (die letzte Unterstützungs-Linie des steigenden Kanals).
- Obwohl das im Chart nicht sichtbar ist, gibt es potenziellen Abwärts-Spielraum bis zu 74,9K unter diese Marke.
Bitte nutze diese Analyse ausschließlich als Referenz und für Planungszwecke.
Ich hoffe, du handelst sicher, indem du dich an deine Prinzipien hältst und Stop-Loss-Orders verwendest.
Ich poste die Analyse-Ergebnisse jeden Tag als Kommentar.
Vielen Dank.
(Du findest den Link in meinem Profil.)
- Klicke auf „Folgen“, um jeden Tag schnellere Informationen zu erhalten.
- Prüfe die Ergebnisse mit der Replay-Schaltfläche auf TradingView.
#BTC-Preisanalye# #BNBChain# #BTC100K #Altcoin-Season# $USDT $ETH $XRP $SOL $BTC

59
·
--
[10. September Bitcoin-Chartanalyse]
BTCUSD 30Min Chart
*Meine Analyse ist für TradingView optimiert.
Wenn du die Replay-Taste drückst, kannst du die Bewegungen in Echtzeit überprüfen.
-Long-Position-Strategie-
*Wenn der Preis dem durch den roten Pfeil angezeigten Pfad folgt:
Long-Position-Strategie
1) Long-Einstiegszone: $76,999.4 / Stop-Loss: Wenn der Preis unter die grüne Unterstützungs-linie fällt
2) Long-Position 1. Ziel: $78,912.2 -> Folgeziel(e): „Top“ und dann „Good“
- Wenn die Strategie erfolgreich ist, kann die $78,5K-Marke (die durch den roten Pfeil markiert ist) als Re-Entry-Zone für Long-Positionen genutzt werden.
- Wenn der Preis unter die grüne Unterstützungs-linie fällt,
wird der steigende Kanal ungültig, und es kann lange dauern, bis der Preis wieder steigt.
- Aktuell zeigt der Nasdaq im 12-Stunden-Chart einen MACD „Death Cross“,
daher besteht eine hohe Wahrscheinlichkeit für eine Seitwärtsbewegung.
Wenn der Preis über der violetten Unterstützungs-linie hält, kann der Markt mit einem nach oben driftenden Seitwärts-Trend schließen.
Wenn er unter die grüne Unterstützungs-linie fällt, könnte der Preis in Richtung der unten markierten „Bottom“-Stufe fallen
-> möglicherweise bis in die „1“-Zone.
Ich poste die Analyseergebnisse jeden Tag als Kommentar.
Vielen Dank.
(Den Link findest du in meinem Profil.)
- Klicke auf „Follow“, um jeden Tag schnellere Informationen zu erhalten.
- Prüfe die Ergebnisse mit der Replay-Funktion in TradingView.
#BTC Preisanalyse# #Altcoin Season# #Krypto# $USDT $BTC $ETH
[10. September Bitcoin-Chartanalyse]
BTCUSD 30Min Chart
*Meine Analyse ist für TradingView optimiert.
Wenn du die Replay-Taste drückst, kannst du die Bewegungen in Echtzeit überprüfen.
-Long-Position-Strategie-
*Wenn der Preis dem durch den roten Pfeil angezeigten Pfad folgt:
Long-Position-Strategie
1) Long-Einstiegszone: $76,999.4 / Stop-Loss: Wenn der Preis unter die grüne Unterstützungs-linie fällt
2) Long-Position 1. Ziel: $78,912.2 -> Folgeziel(e): „Top“ und dann „Good“
- Wenn die Strategie erfolgreich ist, kann die $78,5K-Marke (die durch den roten Pfeil markiert ist) als Re-Entry-Zone für Long-Positionen genutzt werden.
- Wenn der Preis unter die grüne Unterstützungs-linie fällt,
wird der steigende Kanal ungültig, und es kann lange dauern, bis der Preis wieder steigt.
- Aktuell zeigt der Nasdaq im 12-Stunden-Chart einen MACD „Death Cross“,
daher besteht eine hohe Wahrscheinlichkeit für eine Seitwärtsbewegung.
Wenn der Preis über der violetten Unterstützungs-linie hält, kann der Markt mit einem nach oben driftenden Seitwärts-Trend schließen.
Wenn er unter die grüne Unterstützungs-linie fällt, könnte der Preis in Richtung der unten markierten „Bottom“-Stufe fallen
-> möglicherweise bis in die „1“-Zone.
Ich poste die Analyseergebnisse jeden Tag als Kommentar.
Vielen Dank.
(Den Link findest du in meinem Profil.)
- Klicke auf „Follow“, um jeden Tag schnellere Informationen zu erhalten.
- Prüfe die Ergebnisse mit der Replay-Funktion in TradingView.
#BTC Preisanalyse# #Altcoin Season# #Krypto# $USDT $BTC $ETH
BTCUSD 30Min Chart
*Meine Analyse ist für TradingView optimiert.
Wenn du die Replay-Taste drückst, kannst du die Bewegungen in Echtzeit überprüfen.
-Long-Position-Strategie-
*Wenn der Preis dem durch den roten Pfeil angezeigten Pfad folgt:
Long-Position-Strategie
1) Long-Einstiegszone: $76,999.4 / Stop-Loss: Wenn der Preis unter die grüne Unterstützungs-linie fällt
2) Long-Position 1. Ziel: $78,912.2 -> Folgeziel(e): „Top“ und dann „Good“
- Wenn die Strategie erfolgreich ist, kann die $78,5K-Marke (die durch den roten Pfeil markiert ist) als Re-Entry-Zone für Long-Positionen genutzt werden.
- Wenn der Preis unter die grüne Unterstützungs-linie fällt,
wird der steigende Kanal ungültig, und es kann lange dauern, bis der Preis wieder steigt.
- Aktuell zeigt der Nasdaq im 12-Stunden-Chart einen MACD „Death Cross“,
daher besteht eine hohe Wahrscheinlichkeit für eine Seitwärtsbewegung.
Wenn der Preis über der violetten Unterstützungs-linie hält, kann der Markt mit einem nach oben driftenden Seitwärts-Trend schließen.
Wenn er unter die grüne Unterstützungs-linie fällt, könnte der Preis in Richtung der unten markierten „Bottom“-Stufe fallen
-> möglicherweise bis in die „1“-Zone.
Ich poste die Analyseergebnisse jeden Tag als Kommentar.
Vielen Dank.
(Den Link findest du in meinem Profil.)
- Klicke auf „Follow“, um jeden Tag schnellere Informationen zu erhalten.
- Prüfe die Ergebnisse mit der Replay-Funktion in TradingView.
#BTC Preisanalyse# #Altcoin Season# #Krypto# $USDT $BTC $ETH
69
·
--
[9. September Bitcoin-Chartanalyse]
*Meine Analyse ist für TradingView optimiert.
Wenn du den Replay-Button drückst, kannst du die Echtzeitbewegungen überprüfen.
Dies ist der Bitcoin-30-Minuten-Chart.
Da das übergeordnete mittelfristige Muster sich aufgelöst hat,
können wir in beide Richtungen mit erheblicher Volatilität rechnen.
*Eine neutrale Strategie (Handel in beide Richtungen)
angewendet im Bereich der „Purple Finger 1“-Zone oben:
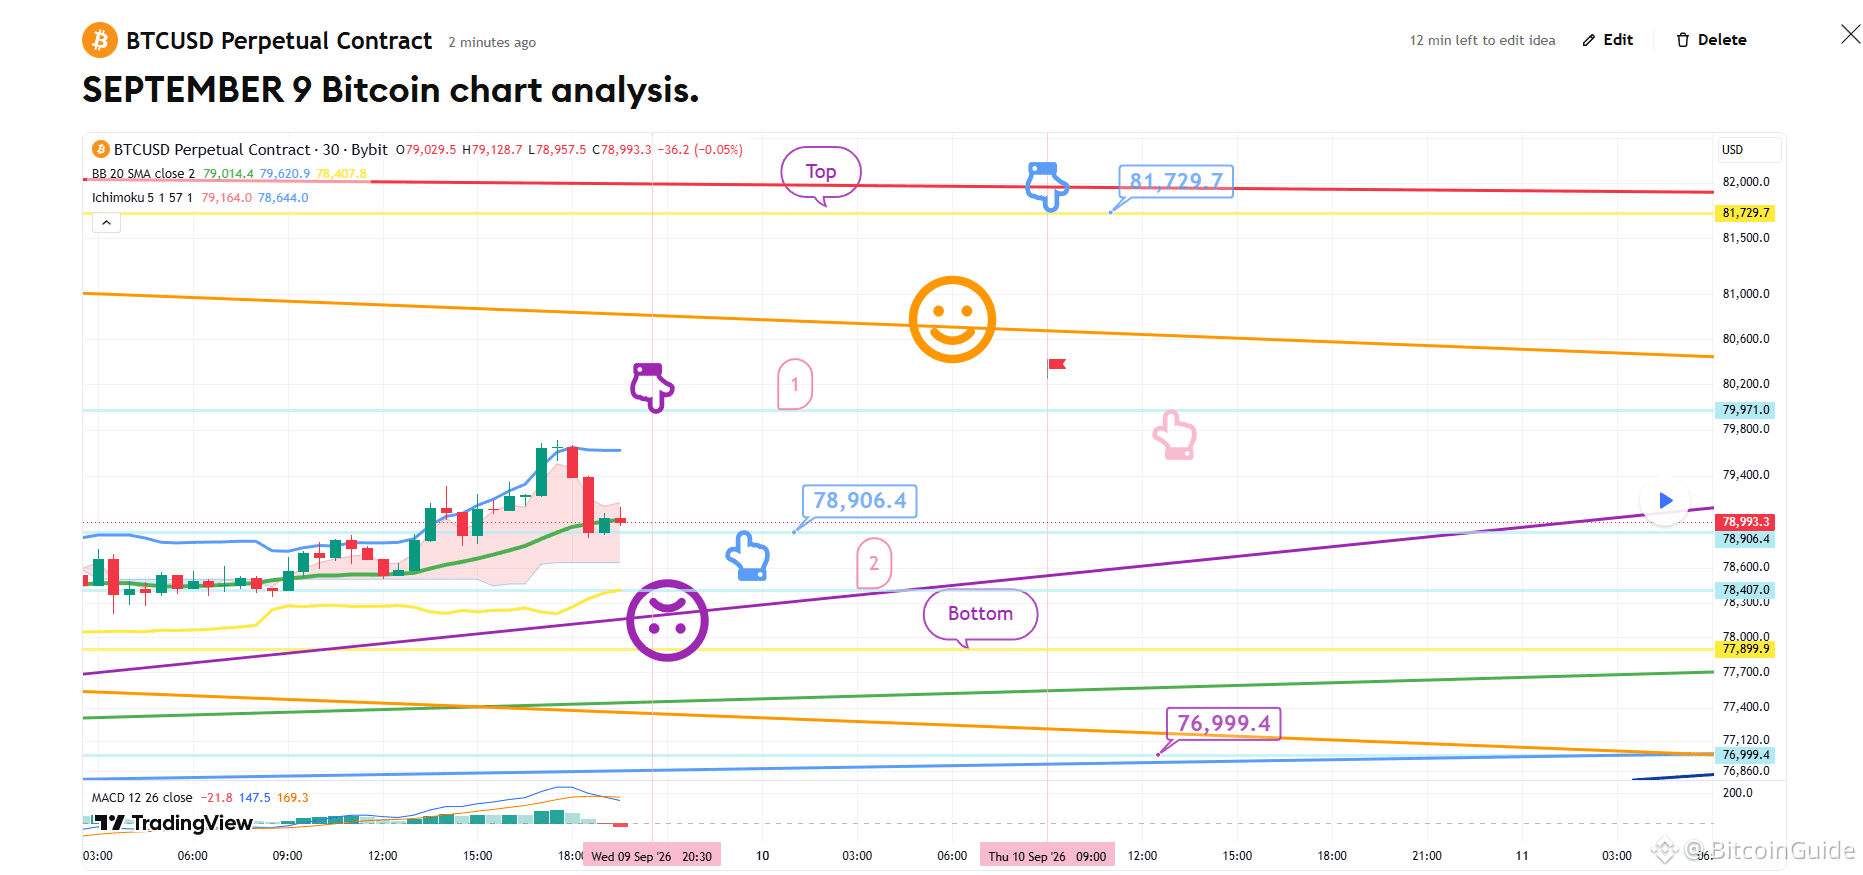
1) Nach Bestätigung eines Touchs der „Purple Finger 1“-Zone bei $79.791 (als Short-Position in Betracht ziehen),
suche einen Einstieg für eine Long-Position auf dem unteren Level, das durch den hellblauen Finger markiert ist ($78.906,4).
/ Stop-Loss, falls die violette Support-Linie gebrochen wird.
2) Wechsle zu einer Short-Position bei $81.729,7 / Stop-Loss, falls die rote Widerstandslinie gebrochen wird.
Dies dient außerdem als letzte Zone, um erneut eine Long-Position einzunehmen.
3) Wenn der Kurs sofort fällt, ohne die 1-Zone oben zu berühren,
ist das „Zone 2“-Level bei $78,4K der letzte Wartepunkt für eine Long-Position.
Die Stop-Loss-Bedingung (falls die violette Support-Linie gebrochen wird) bleibt gleich.
Sobald die violette Support-Linie gebrochen ist,
könnte der Kurs zum unten markierten „Bottom“-Level fallen—möglicherweise bis auf $76,9K—
daher bitte mit Vorsicht vorgehen.
Wenn die hellblaue Support-Linie bei $76,9K gebrochen wird,
wird der mittelfristige bullische Kanal ungültig, was für Long-Positionen ungünstig ist.
Ich poste die Analyseergebnisse täglich als Kommentar.
Vielen Dank.
(Du findest den Link in meinem Profil.)
- Klicke auf „Follow“, um jeden Tag schnellere Informationen zu erhalten.
- Überprüfe die Ergebnisse mit dem Replay-Button in TradingView.
#Crypto# #BTC-Preisanalysen# #Altcoin-Saison# #BNBChain# #ㅠㅆ
[9. September Bitcoin-Chartanalyse]
*Meine Analyse ist für TradingView optimiert.
Wenn du den Replay-Button drückst, kannst du die Echtzeitbewegungen überprüfen.
Dies ist der Bitcoin-30-Minuten-Chart.
Da das übergeordnete mittelfristige Muster sich aufgelöst hat,
können wir in beide Richtungen mit erheblicher Volatilität rechnen.
*Eine neutrale Strategie (Handel in beide Richtungen)
angewendet im Bereich der „Purple Finger 1“-Zone oben:
1) Nach Bestätigung eines Touchs der „Purple Finger 1“-Zone bei $79.791 (als Short-Position in Betracht ziehen),
suche einen Einstieg für eine Long-Position auf dem unteren Level, das durch den hellblauen Finger markiert ist ($78.906,4).
/ Stop-Loss, falls die violette Support-Linie gebrochen wird.
2) Wechsle zu einer Short-Position bei $81.729,7 / Stop-Loss, falls die rote Widerstandslinie gebrochen wird.
Dies dient außerdem als letzte Zone, um erneut eine Long-Position einzunehmen.
3) Wenn der Kurs sofort fällt, ohne die 1-Zone oben zu berühren,
ist das „Zone 2“-Level bei $78,4K der letzte Wartepunkt für eine Long-Position.
Die Stop-Loss-Bedingung (falls die violette Support-Linie gebrochen wird) bleibt gleich.
Sobald die violette Support-Linie gebrochen ist,
könnte der Kurs zum unten markierten „Bottom“-Level fallen—möglicherweise bis auf $76,9K—
daher bitte mit Vorsicht vorgehen.
Wenn die hellblaue Support-Linie bei $76,9K gebrochen wird,
wird der mittelfristige bullische Kanal ungültig, was für Long-Positionen ungünstig ist.
Ich poste die Analyseergebnisse täglich als Kommentar.
Vielen Dank.
(Du findest den Link in meinem Profil.)
- Klicke auf „Follow“, um jeden Tag schnellere Informationen zu erhalten.
- Überprüfe die Ergebnisse mit dem Replay-Button in TradingView.
#Crypto# #BTC-Preisanalysen# #Altcoin-Saison# #BNBChain# #ㅠㅆ
*Meine Analyse ist für TradingView optimiert.
Wenn du den Replay-Button drückst, kannst du die Echtzeitbewegungen überprüfen.
Dies ist der Bitcoin-30-Minuten-Chart.
Da das übergeordnete mittelfristige Muster sich aufgelöst hat,
können wir in beide Richtungen mit erheblicher Volatilität rechnen.
*Eine neutrale Strategie (Handel in beide Richtungen)
angewendet im Bereich der „Purple Finger 1“-Zone oben:
1) Nach Bestätigung eines Touchs der „Purple Finger 1“-Zone bei $79.791 (als Short-Position in Betracht ziehen),
suche einen Einstieg für eine Long-Position auf dem unteren Level, das durch den hellblauen Finger markiert ist ($78.906,4).
/ Stop-Loss, falls die violette Support-Linie gebrochen wird.
2) Wechsle zu einer Short-Position bei $81.729,7 / Stop-Loss, falls die rote Widerstandslinie gebrochen wird.
Dies dient außerdem als letzte Zone, um erneut eine Long-Position einzunehmen.
3) Wenn der Kurs sofort fällt, ohne die 1-Zone oben zu berühren,
ist das „Zone 2“-Level bei $78,4K der letzte Wartepunkt für eine Long-Position.
Die Stop-Loss-Bedingung (falls die violette Support-Linie gebrochen wird) bleibt gleich.
Sobald die violette Support-Linie gebrochen ist,
könnte der Kurs zum unten markierten „Bottom“-Level fallen—möglicherweise bis auf $76,9K—
daher bitte mit Vorsicht vorgehen.
Wenn die hellblaue Support-Linie bei $76,9K gebrochen wird,
wird der mittelfristige bullische Kanal ungültig, was für Long-Positionen ungünstig ist.
Ich poste die Analyseergebnisse täglich als Kommentar.
Vielen Dank.
(Du findest den Link in meinem Profil.)
- Klicke auf „Follow“, um jeden Tag schnellere Informationen zu erhalten.
- Überprüfe die Ergebnisse mit dem Replay-Button in TradingView.
#Crypto# #BTC-Preisanalysen# #Altcoin-Saison# #BNBChain# #ㅠㅆ
56
·
--
[4. September Bitcoin-Chartanalyse]
BTCUSD 30Min-Chart
*Meine Analyse ist für TradingView optimiert.
Wenn du die Wiedergabe-Taste drückst, kannst du die Echtzeit-Bewegungen prüfen.
-Long-Position-Strategie-
*Wenn der Preis dem durch den roten Pfeil angegebenen Pfad folgt:
Long-Position-Strategie
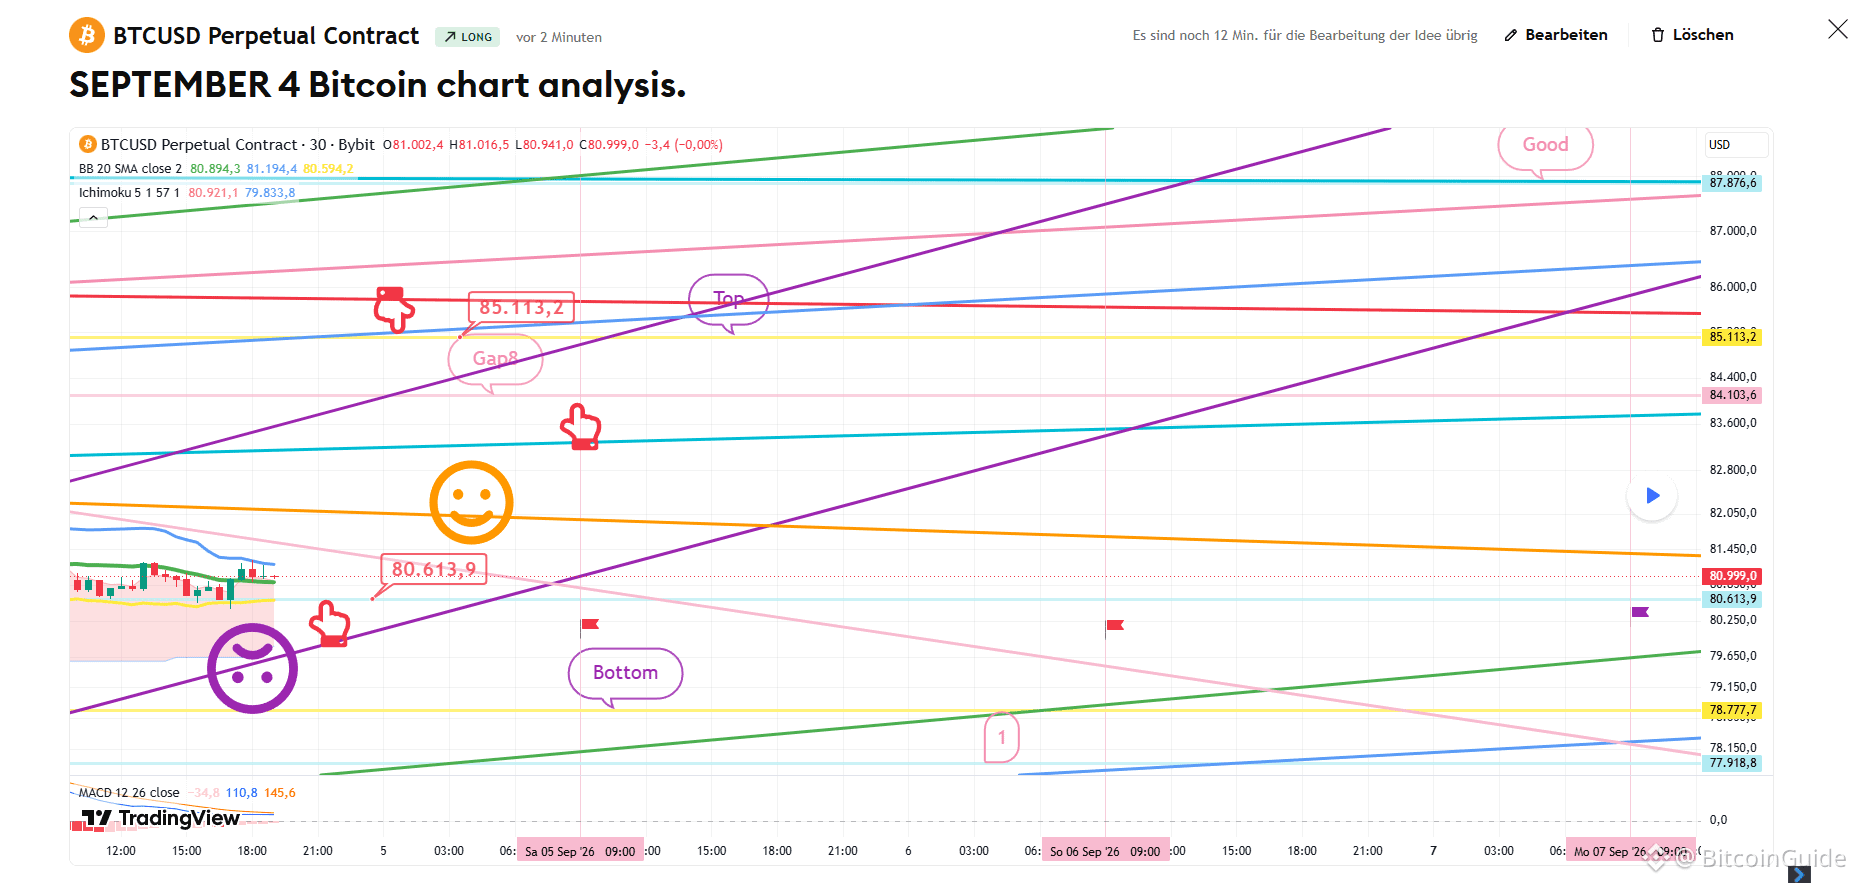
1) Long-Einstiegszone: 80.613,9 $ / Stop-Loss: Wenn die violette Unterstützungs-Linie durchbrochen wird
2) 1. Ziel: 85.113,2 $ -> 2. Ziel: Die "Good"-Zone (gültig bis zum Wochenende)
Wenn die Strategie erfolgreich ist, kann die "Gap 8"-Zone für einen erneuten Long-Einstieg genutzt werden.
- Die "Good"-Zone ist diese Monats die kritischste Widerstandsmarke.
Ein starker Ausbruch über diese Zone könnte zu einer kraftvollen Fortsetzung des Aufwärtstrends führen.
Wenn die violette Unterstützungs-Linie durchbrochen wird,
bitte beachte, dass der Preis bis zur "Bottom"-Marke fallen könnte
oder sogar so weit wie "Zone 1" (unten markiert).
Der MACD im 2-Stunden-Chart zeigt derzeit ein "Dead Cross,"
daher bitte bedenke, dass sich der Preis heute möglicherweise seitwärts bewegen könnte, während du deine Trades verwaltest.
Bitte behandle diese Analyse nur als Referenz.
Ich poste die Analyse-Ergebnisse täglich als Kommentar.
Danke.
(Den Link findest du in meinem Profil.)
- Klicke auf „Follow“, um täglich schnellere Informationen zu erhalten.
- Prüfe die Ergebnisse mit der Wiedergabe-Taste in TradingView.
#BTC100K #Macro Insights# #Altcoin Season# #BTCCharts# $USDT $TRX $BTC $ETH
[4. September Bitcoin-Chartanalyse]
BTCUSD 30Min-Chart
*Meine Analyse ist für TradingView optimiert.
Wenn du die Wiedergabe-Taste drückst, kannst du die Echtzeit-Bewegungen prüfen.
-Long-Position-Strategie-
*Wenn der Preis dem durch den roten Pfeil angegebenen Pfad folgt:
Long-Position-Strategie
1) Long-Einstiegszone: 80.613,9 $ / Stop-Loss: Wenn die violette Unterstützungs-Linie durchbrochen wird
2) 1. Ziel: 85.113,2 $ -> 2. Ziel: Die "Good"-Zone (gültig bis zum Wochenende)
Wenn die Strategie erfolgreich ist, kann die "Gap 8"-Zone für einen erneuten Long-Einstieg genutzt werden.
- Die "Good"-Zone ist diese Monats die kritischste Widerstandsmarke.
Ein starker Ausbruch über diese Zone könnte zu einer kraftvollen Fortsetzung des Aufwärtstrends führen.
Wenn die violette Unterstützungs-Linie durchbrochen wird,
bitte beachte, dass der Preis bis zur "Bottom"-Marke fallen könnte
oder sogar so weit wie "Zone 1" (unten markiert).
Der MACD im 2-Stunden-Chart zeigt derzeit ein "Dead Cross,"
daher bitte bedenke, dass sich der Preis heute möglicherweise seitwärts bewegen könnte, während du deine Trades verwaltest.
Bitte behandle diese Analyse nur als Referenz.
Ich poste die Analyse-Ergebnisse täglich als Kommentar.
Danke.
(Den Link findest du in meinem Profil.)
- Klicke auf „Follow“, um täglich schnellere Informationen zu erhalten.
- Prüfe die Ergebnisse mit der Wiedergabe-Taste in TradingView.
#BTC100K #Macro Insights# #Altcoin Season# #BTCCharts# $USDT $TRX $BTC $ETH
BTCUSD 30Min-Chart
*Meine Analyse ist für TradingView optimiert.
Wenn du die Wiedergabe-Taste drückst, kannst du die Echtzeit-Bewegungen prüfen.
-Long-Position-Strategie-
*Wenn der Preis dem durch den roten Pfeil angegebenen Pfad folgt:
Long-Position-Strategie
1) Long-Einstiegszone: 80.613,9 $ / Stop-Loss: Wenn die violette Unterstützungs-Linie durchbrochen wird
2) 1. Ziel: 85.113,2 $ -> 2. Ziel: Die "Good"-Zone (gültig bis zum Wochenende)
Wenn die Strategie erfolgreich ist, kann die "Gap 8"-Zone für einen erneuten Long-Einstieg genutzt werden.
- Die "Good"-Zone ist diese Monats die kritischste Widerstandsmarke.
Ein starker Ausbruch über diese Zone könnte zu einer kraftvollen Fortsetzung des Aufwärtstrends führen.
Wenn die violette Unterstützungs-Linie durchbrochen wird,
bitte beachte, dass der Preis bis zur "Bottom"-Marke fallen könnte
oder sogar so weit wie "Zone 1" (unten markiert).
Der MACD im 2-Stunden-Chart zeigt derzeit ein "Dead Cross,"
daher bitte bedenke, dass sich der Preis heute möglicherweise seitwärts bewegen könnte, während du deine Trades verwaltest.
Bitte behandle diese Analyse nur als Referenz.
Ich poste die Analyse-Ergebnisse täglich als Kommentar.
Danke.
(Den Link findest du in meinem Profil.)
- Klicke auf „Follow“, um täglich schnellere Informationen zu erhalten.
- Prüfe die Ergebnisse mit der Wiedergabe-Taste in TradingView.
#BTC100K #Macro Insights# #Altcoin Season# #BTCCharts# $USDT $TRX $BTC $ETH
68
·
--
[1. SEPTEMBER Bitcoin-Chartanalyse]
BTCUSD 30Min Chart
*Meine Analyse ist für TradingView optimiert.
Wenn du die Wiedergabe-Taste drückst, kannst du die Echtzeitbewegungen überprüfen.
-Long-Position-Strategie-
Dies ist der Bitcoin-30-Minuten-Chart.
Aktuell befindet sich auf dem Tageschart ein MACD-Dead-Cross in Arbeit.
Vorsicht ist geboten, da diese Position das Potenzial für einen starken Rückgang hat.
Ich habe eine Strategie entwickelt, die auf einem Seitwärtsmarkt basiert und den Kanal beibehält.
*Long-Position-Strategie basierend auf dem Bewegungsweg des roten Fingers
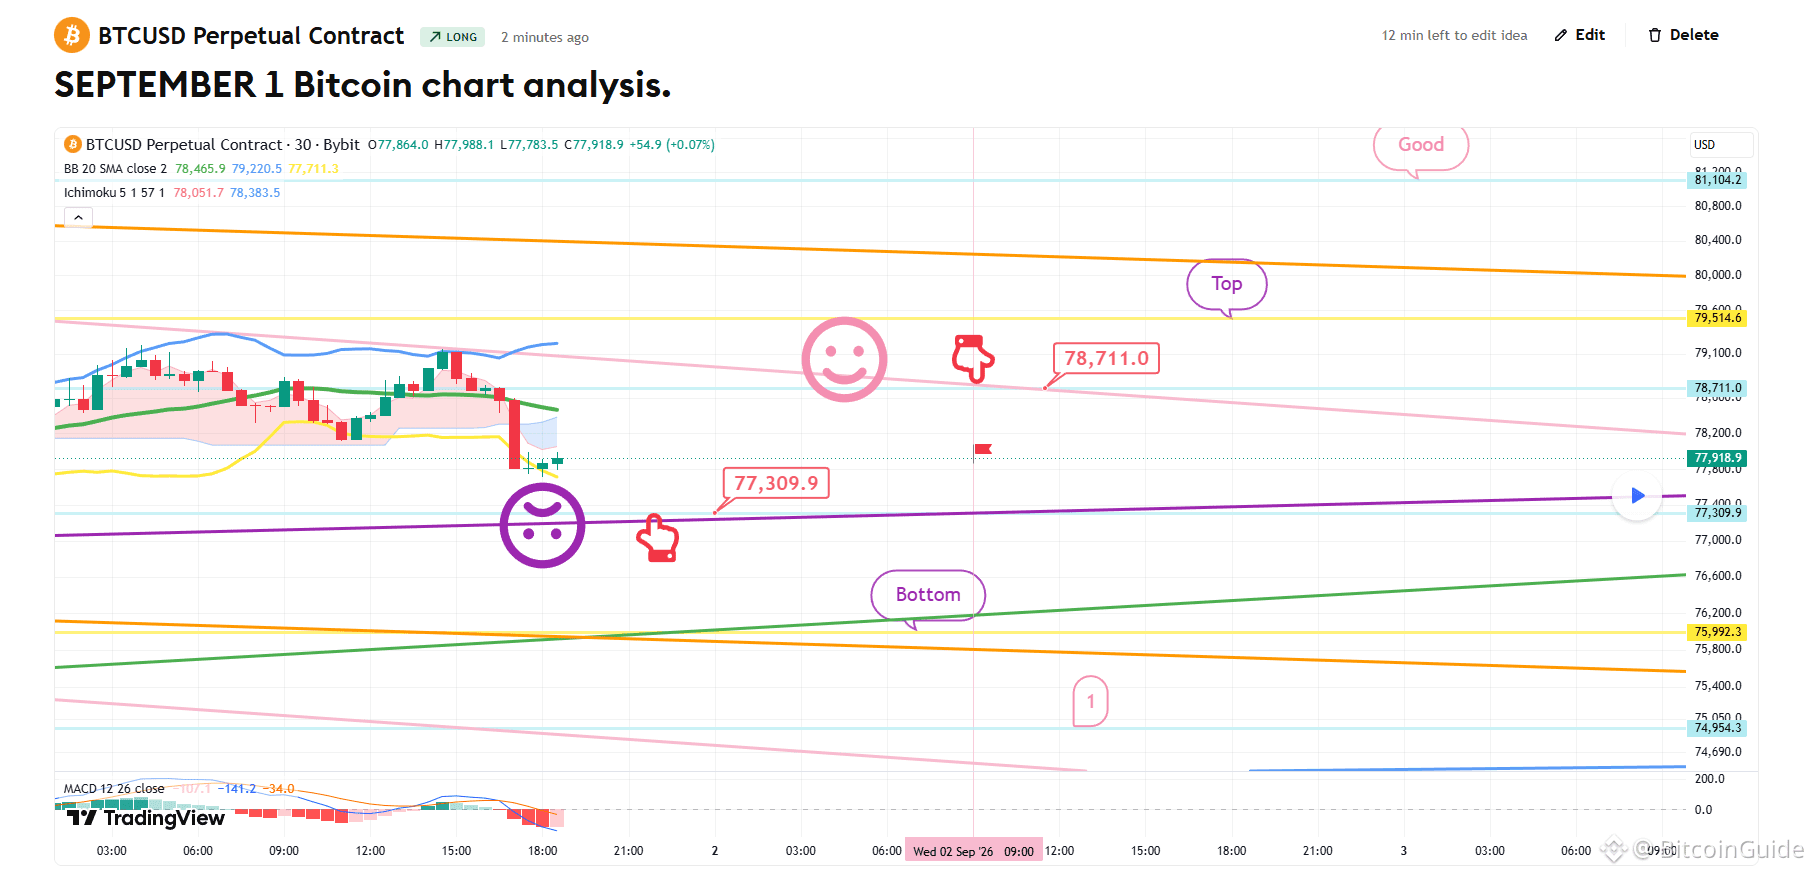
1) Einstiegspunkt für die Long-Position bei $77,309.9 / Stop-Loss, wenn die violette Unterstützungs-Linie gebrochen wird
2) 1. Ziel für die Long-Position bei $78,711 -> Zielpreise in der Reihenfolge Oben, Gut
Während der Gesamtrend darauf hindeutet, dass die Bottom-Zone wahrscheinlich ist,
bin ich mit der Strategie basierend auf den Bewegungen der Nasdaq vorgegangen.
Wenn die Bottom-Zone durchbrochen wird, bleibt die Möglichkeit bestehen, Zone 1 zu erreichen.
Ich poste die Analyseergebnisse jeden Tag als Kommentar.
Danke.
(Den Link findest du in meinem Profil.)
- Klicke auf „Folgen“, um täglich schnellere Informationen zu erhalten.
- Prüfe die Ergebnisse mit der Wiedergabe-Schaltfläche in TradingView.
#BTC Preisanalyse# #Altcoin-Saison# #BTC100K #XRP $ETH $USDT $BTC $GOLD
[1. SEPTEMBER Bitcoin-Chartanalyse]
BTCUSD 30Min Chart
*Meine Analyse ist für TradingView optimiert.
Wenn du die Wiedergabe-Taste drückst, kannst du die Echtzeitbewegungen überprüfen.
-Long-Position-Strategie-
Dies ist der Bitcoin-30-Minuten-Chart.
Aktuell befindet sich auf dem Tageschart ein MACD-Dead-Cross in Arbeit.
Vorsicht ist geboten, da diese Position das Potenzial für einen starken Rückgang hat.
Ich habe eine Strategie entwickelt, die auf einem Seitwärtsmarkt basiert und den Kanal beibehält.
*Long-Position-Strategie basierend auf dem Bewegungsweg des roten Fingers
1) Einstiegspunkt für die Long-Position bei $77,309.9 / Stop-Loss, wenn die violette Unterstützungs-Linie gebrochen wird
2) 1. Ziel für die Long-Position bei $78,711 -> Zielpreise in der Reihenfolge Oben, Gut
Während der Gesamtrend darauf hindeutet, dass die Bottom-Zone wahrscheinlich ist,
bin ich mit der Strategie basierend auf den Bewegungen der Nasdaq vorgegangen.
Wenn die Bottom-Zone durchbrochen wird, bleibt die Möglichkeit bestehen, Zone 1 zu erreichen.
Ich poste die Analyseergebnisse jeden Tag als Kommentar.
Danke.
(Den Link findest du in meinem Profil.)
- Klicke auf „Folgen“, um täglich schnellere Informationen zu erhalten.
- Prüfe die Ergebnisse mit der Wiedergabe-Schaltfläche in TradingView.
#BTC Preisanalyse# #Altcoin-Saison# #BTC100K #XRP $ETH $USDT $BTC $GOLD
BTCUSD 30Min Chart
*Meine Analyse ist für TradingView optimiert.
Wenn du die Wiedergabe-Taste drückst, kannst du die Echtzeitbewegungen überprüfen.
-Long-Position-Strategie-
Dies ist der Bitcoin-30-Minuten-Chart.
Aktuell befindet sich auf dem Tageschart ein MACD-Dead-Cross in Arbeit.
Vorsicht ist geboten, da diese Position das Potenzial für einen starken Rückgang hat.
Ich habe eine Strategie entwickelt, die auf einem Seitwärtsmarkt basiert und den Kanal beibehält.
*Long-Position-Strategie basierend auf dem Bewegungsweg des roten Fingers
1) Einstiegspunkt für die Long-Position bei $77,309.9 / Stop-Loss, wenn die violette Unterstützungs-Linie gebrochen wird
2) 1. Ziel für die Long-Position bei $78,711 -> Zielpreise in der Reihenfolge Oben, Gut
Während der Gesamtrend darauf hindeutet, dass die Bottom-Zone wahrscheinlich ist,
bin ich mit der Strategie basierend auf den Bewegungen der Nasdaq vorgegangen.
Wenn die Bottom-Zone durchbrochen wird, bleibt die Möglichkeit bestehen, Zone 1 zu erreichen.
Ich poste die Analyseergebnisse jeden Tag als Kommentar.
Danke.
(Den Link findest du in meinem Profil.)
- Klicke auf „Folgen“, um täglich schnellere Informationen zu erhalten.
- Prüfe die Ergebnisse mit der Wiedergabe-Schaltfläche in TradingView.
#BTC Preisanalyse# #Altcoin-Saison# #BTC100K #XRP $ETH $USDT $BTC $GOLD
79
·
--
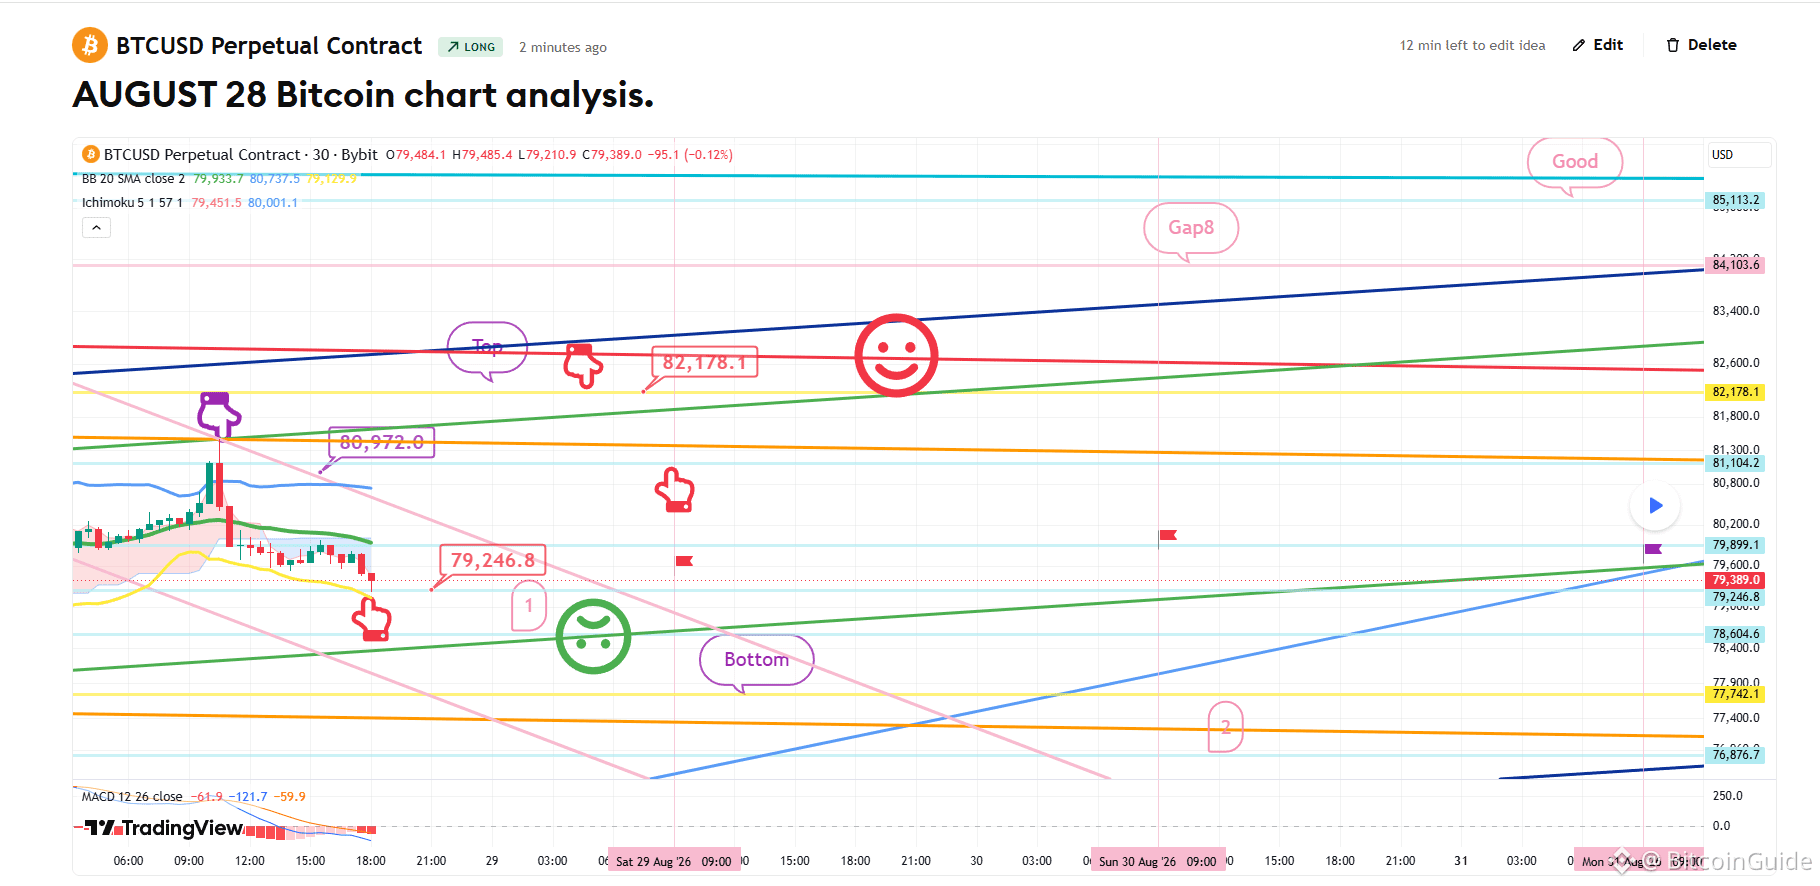
[28. August Bitcoin-Chartanalyse]
BTCUSD 30Min Chart
*Meine Analyse ist für TradingView optimiert.
Wenn du die Wiedergabetaste drückst, kannst du Echtzeitbewegungen überprüfen.
-Long-Position-Strategie-
Das ist der Bitcoin-30-Minuten-Chart.
Oben links habe ich den letzten Einstiegspunkt für die Short-Position bei $80.792 mit dem violetten Finger verbunden.
Der Grund, warum die Korrektur stärker ausfällt als erwartet nach der vorherigen Hoch-Erneuerung, ist, dass das mittelfristige Muster gebrochen wurde, als es am 26. die Mittellinie der 6-Stunden-Bollinger-Bänder berührte, was ich das letzte Mal erklärt habe.
Da die Korrektur stark ist, ging ich davon aus, dass sich einige von euch schnell auf Long-Positionen umgestellt haben, daher bin ich aggressiv vorgegangen.
*Kauf hinterher (Chase Buy) und Long-Position-Strategie entlang des Bewegungswegs des roten Fingers.
1) $79.246,8 Einstiegspunkt für Long / Stop-Loss, wenn die grüne Unterstützungs-Linie gebrochen wird.
Es könnte in Zone 1 darunter fallen, die ich als den sichersten Einstiegspunkt für eine Long-Position betrachte. 2) $82.178,1 Long Position 1. Ziel -> Zielpreis in der maximalen „Good“-Zone am Wochenende
Wenn die Strategie erfolgreich ist, ist die rote Markierung bei $80,9K die Zone, die du für den Wiedereinstieg in die Long-Position nutzen solltest.
Bitte sei vorsichtig, da die untere Linie (Bottom) sich für Zone 2 öffnet, sobald sie unter die grüne Unterstützungs-Linie bricht.
Ich poste die Analyseergebnisse jeden Tag als Kommentar.
Vielen Dank.
(Du kannst den Link in meinem Profil finden.)
- Klicke auf Follow, um jeden Tag schnellere Informationen zu erhalten.
- Prüfe die Ergebnisse mit der Wiedergabetaste auf TradingView.
#BTC100K #Altcoin Season# #BTC Price Analysis# #Crypto $USDT $BTC $ETH $XRP
[28. August Bitcoin-Chartanalyse]
BTCUSD 30Min Chart
*Meine Analyse ist für TradingView optimiert.
Wenn du die Wiedergabetaste drückst, kannst du Echtzeitbewegungen überprüfen.
-Long-Position-Strategie-
Das ist der Bitcoin-30-Minuten-Chart.
Oben links habe ich den letzten Einstiegspunkt für die Short-Position bei $80.792 mit dem violetten Finger verbunden.
Der Grund, warum die Korrektur stärker ausfällt als erwartet nach der vorherigen Hoch-Erneuerung, ist, dass das mittelfristige Muster gebrochen wurde, als es am 26. die Mittellinie der 6-Stunden-Bollinger-Bänder berührte, was ich das letzte Mal erklärt habe.
Da die Korrektur stark ist, ging ich davon aus, dass sich einige von euch schnell auf Long-Positionen umgestellt haben, daher bin ich aggressiv vorgegangen.
*Kauf hinterher (Chase Buy) und Long-Position-Strategie entlang des Bewegungswegs des roten Fingers.
1) $79.246,8 Einstiegspunkt für Long / Stop-Loss, wenn die grüne Unterstützungs-Linie gebrochen wird.
Es könnte in Zone 1 darunter fallen, die ich als den sichersten Einstiegspunkt für eine Long-Position betrachte. 2) $82.178,1 Long Position 1. Ziel -> Zielpreis in der maximalen „Good“-Zone am Wochenende
Wenn die Strategie erfolgreich ist, ist die rote Markierung bei $80,9K die Zone, die du für den Wiedereinstieg in die Long-Position nutzen solltest.
Bitte sei vorsichtig, da die untere Linie (Bottom) sich für Zone 2 öffnet, sobald sie unter die grüne Unterstützungs-Linie bricht.
Ich poste die Analyseergebnisse jeden Tag als Kommentar.
Vielen Dank.
(Du kannst den Link in meinem Profil finden.)
- Klicke auf Follow, um jeden Tag schnellere Informationen zu erhalten.
- Prüfe die Ergebnisse mit der Wiedergabetaste auf TradingView.
#BTC100K #Altcoin Season# #BTC Price Analysis# #Crypto $USDT $BTC $ETH $XRP
BTCUSD 30Min Chart
*Meine Analyse ist für TradingView optimiert.
Wenn du die Wiedergabetaste drückst, kannst du Echtzeitbewegungen überprüfen.
-Long-Position-Strategie-
Das ist der Bitcoin-30-Minuten-Chart.
Oben links habe ich den letzten Einstiegspunkt für die Short-Position bei $80.792 mit dem violetten Finger verbunden.
Der Grund, warum die Korrektur stärker ausfällt als erwartet nach der vorherigen Hoch-Erneuerung, ist, dass das mittelfristige Muster gebrochen wurde, als es am 26. die Mittellinie der 6-Stunden-Bollinger-Bänder berührte, was ich das letzte Mal erklärt habe.
Da die Korrektur stark ist, ging ich davon aus, dass sich einige von euch schnell auf Long-Positionen umgestellt haben, daher bin ich aggressiv vorgegangen.
*Kauf hinterher (Chase Buy) und Long-Position-Strategie entlang des Bewegungswegs des roten Fingers.
1) $79.246,8 Einstiegspunkt für Long / Stop-Loss, wenn die grüne Unterstützungs-Linie gebrochen wird.
Es könnte in Zone 1 darunter fallen, die ich als den sichersten Einstiegspunkt für eine Long-Position betrachte. 2) $82.178,1 Long Position 1. Ziel -> Zielpreis in der maximalen „Good“-Zone am Wochenende
Wenn die Strategie erfolgreich ist, ist die rote Markierung bei $80,9K die Zone, die du für den Wiedereinstieg in die Long-Position nutzen solltest.
Bitte sei vorsichtig, da die untere Linie (Bottom) sich für Zone 2 öffnet, sobald sie unter die grüne Unterstützungs-Linie bricht.
Ich poste die Analyseergebnisse jeden Tag als Kommentar.
Vielen Dank.
(Du kannst den Link in meinem Profil finden.)
- Klicke auf Follow, um jeden Tag schnellere Informationen zu erhalten.
- Prüfe die Ergebnisse mit der Wiedergabetaste auf TradingView.
#BTC100K #Altcoin Season# #BTC Price Analysis# #Crypto $USDT $BTC $ETH $XRP
64
·
--
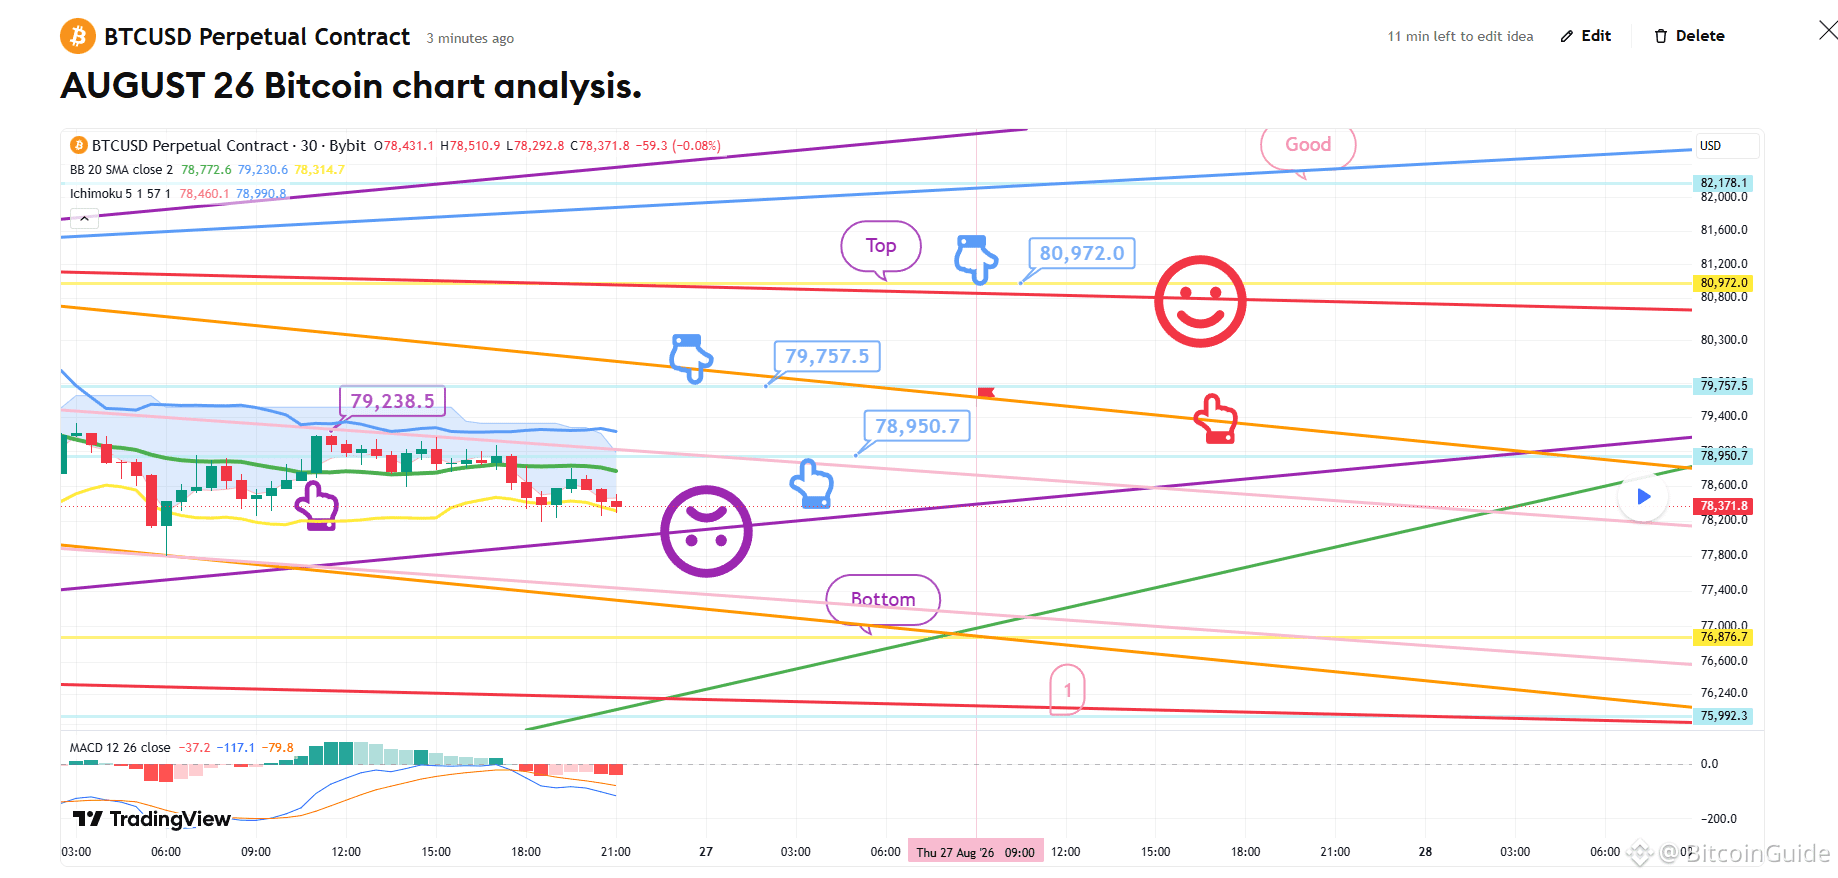
[26. August Bitcoin-Chartanalyse]
BTCUSD 30Min Chart
*Meine Analyse ist für TradingView optimiert.
Wenn du die Wiedergabetaste drückst, kannst du Echtzeitbewegungen prüfen.
-Links, markiert durch den violetten Finger, habe ich die Strategie exakt so verbunden, wie sie am Einstiegspunkt der am 25. eingegangenen Long-Position bei 79,2K war.
Aktuell läuft auf dem 12-Stunden-Chart ein MACD Dead Cross.
*Basierend auf dem Bewegungsweg des hellblauen Fingers:
Short -> Long -> Short-2-Wege-Neutral-Strategie
1) Einstieg Short bei 79.757,5 $ / Stop-Loss bei Ausbruch über die orange Widerstandslinie
2) Wechsel auf Long bei 78.950,7 $ / Stop-Loss bei Ausbruch über die violette Unterstützungs-linie
(Derselbe Stop-Loss gilt für diejenigen, die die Long-Position bei 79,2K halten)
3) Wechsel auf Short bei 80.972 $ / Stop-Loss bei Ausbruch über die rote Widerstandslinie
Dies ist der Bereich, der ab morgen genutzt werden soll, um die Long-Position bei 79,7K erneut einzusteigen.
- Wenn der Preis heute den „Guten“ Bereich erreicht,
musst du keine Short-Position eröffnen,
und es besteht eine sehr hohe Wahrscheinlichkeit für seitwärts gerichtete Bewegung heute.
Bitte sei vorsichtig, da ein Bruch unter die violette Unterstützungs-linie zu einem Rückgang bis zum Boden -> bis Zone 1 führen könnte.
Ich poste die Analyseergebnisse jeden Tag als Kommentar.
Vielen Dank.
(Du kannst den Link in meinem Profil finden.)
- Klicke auf „Folgen“, um täglich schnellere Informationen zu erhalten.
- Prüfe die Ergebnisse mit der Wiedergabe-Funktion im TradingView.
#BTC100K #Altcoin Season# #ETH #BTC-Preis-Analyse# $CRYPTO $GOLD $XRP $BTC
[26. August Bitcoin-Chartanalyse]
BTCUSD 30Min Chart
*Meine Analyse ist für TradingView optimiert.
Wenn du die Wiedergabetaste drückst, kannst du Echtzeitbewegungen prüfen.
-Links, markiert durch den violetten Finger, habe ich die Strategie exakt so verbunden, wie sie am Einstiegspunkt der am 25. eingegangenen Long-Position bei 79,2K war.
Aktuell läuft auf dem 12-Stunden-Chart ein MACD Dead Cross.
*Basierend auf dem Bewegungsweg des hellblauen Fingers:
Short -> Long -> Short-2-Wege-Neutral-Strategie
1) Einstieg Short bei 79.757,5 $ / Stop-Loss bei Ausbruch über die orange Widerstandslinie
2) Wechsel auf Long bei 78.950,7 $ / Stop-Loss bei Ausbruch über die violette Unterstützungs-linie
(Derselbe Stop-Loss gilt für diejenigen, die die Long-Position bei 79,2K halten)
3) Wechsel auf Short bei 80.972 $ / Stop-Loss bei Ausbruch über die rote Widerstandslinie
Dies ist der Bereich, der ab morgen genutzt werden soll, um die Long-Position bei 79,7K erneut einzusteigen.
- Wenn der Preis heute den „Guten“ Bereich erreicht,
musst du keine Short-Position eröffnen,
und es besteht eine sehr hohe Wahrscheinlichkeit für seitwärts gerichtete Bewegung heute.
Bitte sei vorsichtig, da ein Bruch unter die violette Unterstützungs-linie zu einem Rückgang bis zum Boden -> bis Zone 1 führen könnte.
Ich poste die Analyseergebnisse jeden Tag als Kommentar.
Vielen Dank.
(Du kannst den Link in meinem Profil finden.)
- Klicke auf „Folgen“, um täglich schnellere Informationen zu erhalten.
- Prüfe die Ergebnisse mit der Wiedergabe-Funktion im TradingView.
#BTC100K #Altcoin Season# #ETH #BTC-Preis-Analyse# $CRYPTO $GOLD $XRP $BTC
BTCUSD 30Min Chart
*Meine Analyse ist für TradingView optimiert.
Wenn du die Wiedergabetaste drückst, kannst du Echtzeitbewegungen prüfen.
-Links, markiert durch den violetten Finger, habe ich die Strategie exakt so verbunden, wie sie am Einstiegspunkt der am 25. eingegangenen Long-Position bei 79,2K war.
Aktuell läuft auf dem 12-Stunden-Chart ein MACD Dead Cross.
*Basierend auf dem Bewegungsweg des hellblauen Fingers:
Short -> Long -> Short-2-Wege-Neutral-Strategie
1) Einstieg Short bei 79.757,5 $ / Stop-Loss bei Ausbruch über die orange Widerstandslinie
2) Wechsel auf Long bei 78.950,7 $ / Stop-Loss bei Ausbruch über die violette Unterstützungs-linie
(Derselbe Stop-Loss gilt für diejenigen, die die Long-Position bei 79,2K halten)
3) Wechsel auf Short bei 80.972 $ / Stop-Loss bei Ausbruch über die rote Widerstandslinie
Dies ist der Bereich, der ab morgen genutzt werden soll, um die Long-Position bei 79,7K erneut einzusteigen.
- Wenn der Preis heute den „Guten“ Bereich erreicht,
musst du keine Short-Position eröffnen,
und es besteht eine sehr hohe Wahrscheinlichkeit für seitwärts gerichtete Bewegung heute.
Bitte sei vorsichtig, da ein Bruch unter die violette Unterstützungs-linie zu einem Rückgang bis zum Boden -> bis Zone 1 führen könnte.
Ich poste die Analyseergebnisse jeden Tag als Kommentar.
Vielen Dank.
(Du kannst den Link in meinem Profil finden.)
- Klicke auf „Folgen“, um täglich schnellere Informationen zu erhalten.
- Prüfe die Ergebnisse mit der Wiedergabe-Funktion im TradingView.
#BTC100K #Altcoin Season# #ETH #BTC-Preis-Analyse# $CRYPTO $GOLD $XRP $BTC
71
·
--
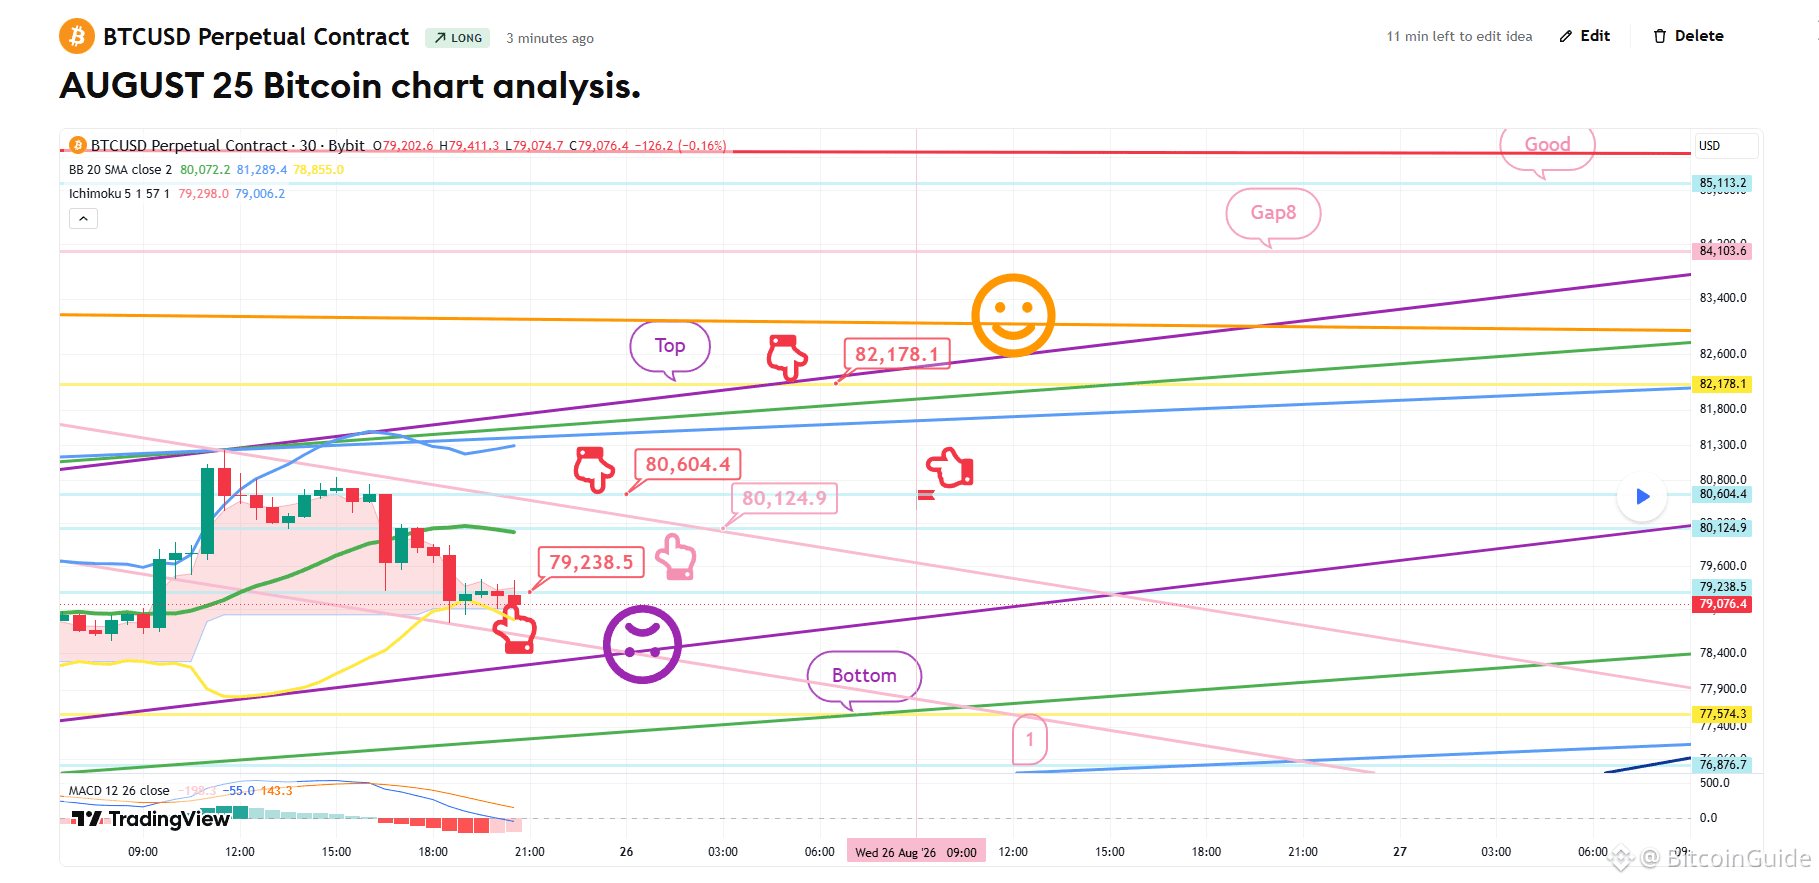
[August 25 Bitcoin-Chartanalyse]
BTCUSD 30Min-Chart
*Meine Analyse ist für TradingView optimiert.
Wenn du die Wiedergabe-Taste drückst, kannst du die Bewegungen in Echtzeit überprüfen.
-Long-Position-Strategie-
Dies ist das Bitcoin-30-Minuten-Chart.
Es gibt eine Nasdaq-Indikator-Veröffentlichung um 11:00.
*Long-Position-Strategie basierend auf dem Bewegungsweg des roten Fingers
1) Kauf bei $79.238,5 / Stop-Loss, falls der Kurs unter die violette Unterstützungslinie fällt
2) 1. Ziel für die Long-Position in der $82.178,1 Top-Zone -> Zielpreise in der Reihenfolge von Gap 8 und Good
- Wenn der Kurs unter die violette Unterstützungslinie bricht
Bitte sei vorsichtig, da der Preis in die unten angegebene Bottom-Zone fallen könnte -> bis Zone 1.
Ich poste die Analyseergebnisse jeden Tag als Kommentar.
Vielen Dank.
(Du findest den Link in meinem Profil.)
- Klicke auf „Follow“, um täglich schnellere Informationen zu erhalten.
- Überprüfe die Ergebnisse mit der Wiedergabetaste in TradingView.
#BTC-Preis-Analyse# #Altcoin-Saison# #Bitcoin #Krypto# $XRP $ETH $BTC $USDT
[August 25 Bitcoin-Chartanalyse]
BTCUSD 30Min-Chart
*Meine Analyse ist für TradingView optimiert.
Wenn du die Wiedergabe-Taste drückst, kannst du die Bewegungen in Echtzeit überprüfen.
-Long-Position-Strategie-
Dies ist das Bitcoin-30-Minuten-Chart.
Es gibt eine Nasdaq-Indikator-Veröffentlichung um 11:00.
*Long-Position-Strategie basierend auf dem Bewegungsweg des roten Fingers
1) Kauf bei $79.238,5 / Stop-Loss, falls der Kurs unter die violette Unterstützungslinie fällt
2) 1. Ziel für die Long-Position in der $82.178,1 Top-Zone -> Zielpreise in der Reihenfolge von Gap 8 und Good
- Wenn der Kurs unter die violette Unterstützungslinie bricht
Bitte sei vorsichtig, da der Preis in die unten angegebene Bottom-Zone fallen könnte -> bis Zone 1.
Ich poste die Analyseergebnisse jeden Tag als Kommentar.
Vielen Dank.
(Du findest den Link in meinem Profil.)
- Klicke auf „Follow“, um täglich schnellere Informationen zu erhalten.
- Überprüfe die Ergebnisse mit der Wiedergabetaste in TradingView.
#BTC-Preis-Analyse# #Altcoin-Saison# #Bitcoin #Krypto# $XRP $ETH $BTC $USDT
BTCUSD 30Min-Chart
*Meine Analyse ist für TradingView optimiert.
Wenn du die Wiedergabe-Taste drückst, kannst du die Bewegungen in Echtzeit überprüfen.
-Long-Position-Strategie-
Dies ist das Bitcoin-30-Minuten-Chart.
Es gibt eine Nasdaq-Indikator-Veröffentlichung um 11:00.
*Long-Position-Strategie basierend auf dem Bewegungsweg des roten Fingers
1) Kauf bei $79.238,5 / Stop-Loss, falls der Kurs unter die violette Unterstützungslinie fällt
2) 1. Ziel für die Long-Position in der $82.178,1 Top-Zone -> Zielpreise in der Reihenfolge von Gap 8 und Good
- Wenn der Kurs unter die violette Unterstützungslinie bricht
Bitte sei vorsichtig, da der Preis in die unten angegebene Bottom-Zone fallen könnte -> bis Zone 1.
Ich poste die Analyseergebnisse jeden Tag als Kommentar.
Vielen Dank.
(Du findest den Link in meinem Profil.)
- Klicke auf „Follow“, um täglich schnellere Informationen zu erhalten.
- Überprüfe die Ergebnisse mit der Wiedergabetaste in TradingView.
#BTC-Preis-Analyse# #Altcoin-Saison# #Bitcoin #Krypto# $XRP $ETH $BTC $USDT
93
·
--
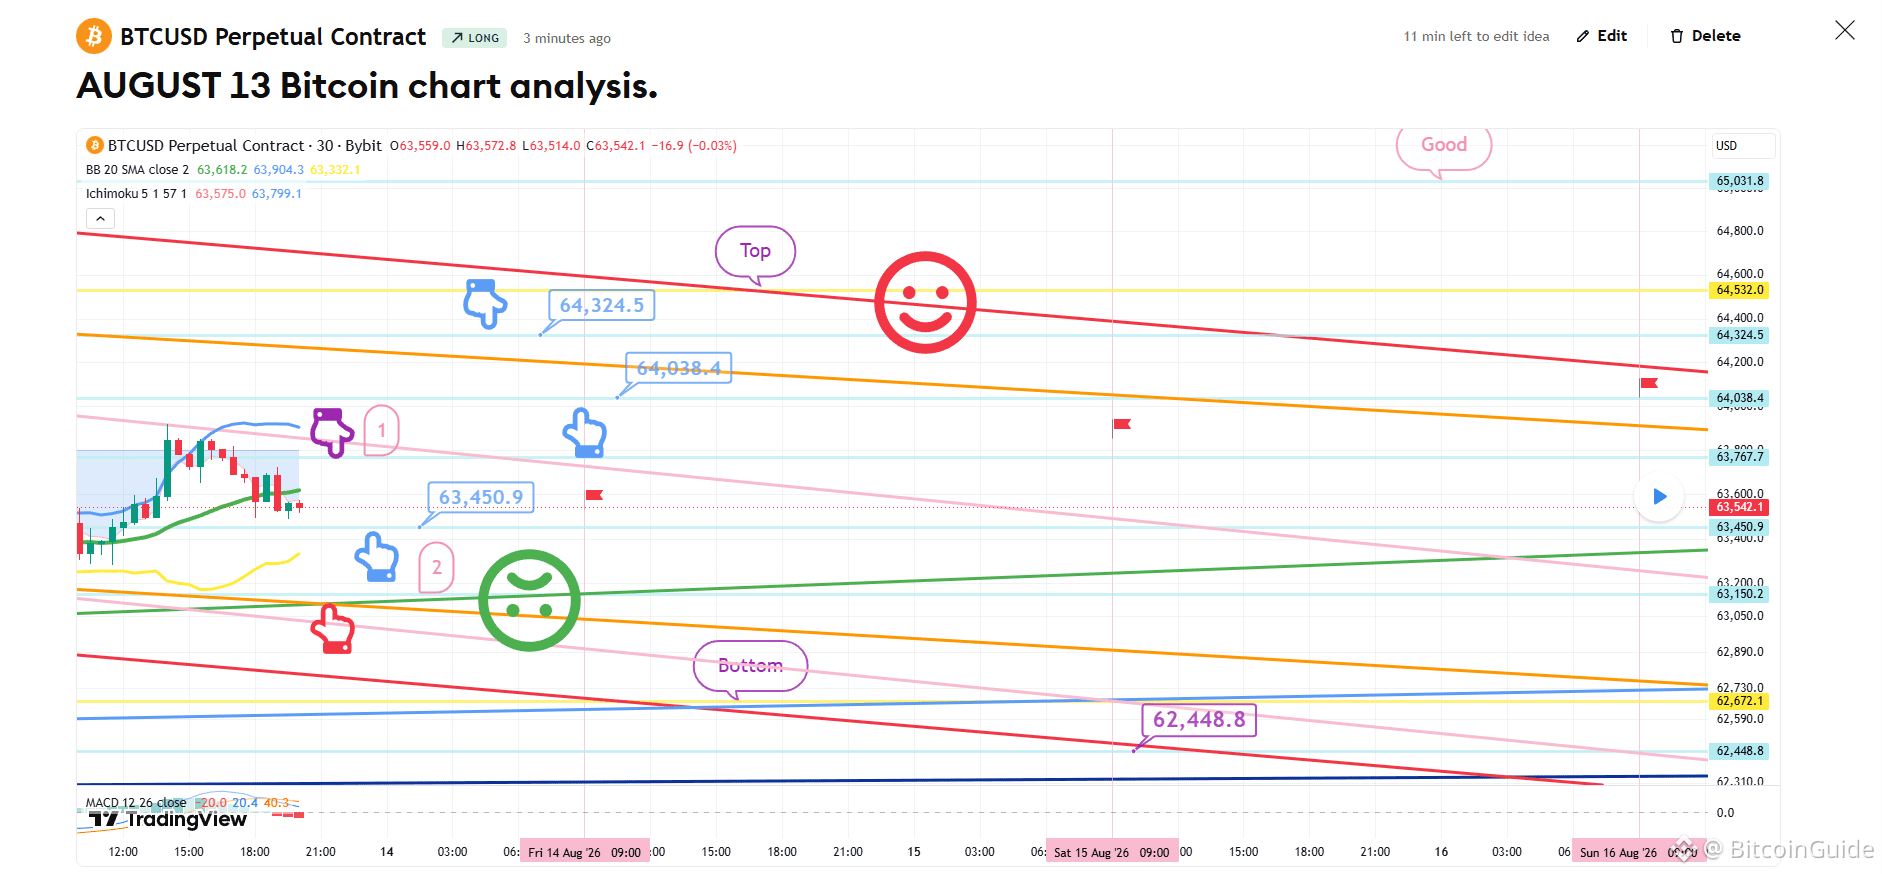
[August 13 Bitcoin-Chartanalyse]
BTCUSD 30Min-Chart
*Meine Analyse ist für TradingView optimiert.
Wenn du die Wiedergabetaste drückst, kannst du die Bewegungen in Echtzeit prüfen.
-Long-Position-Strategie-
Was den Nasdaq betrifft: Aufgrund des MACD-Dead-Cross im 12-Stunden-Chart
ist es sehr wahrscheinlich, dass er bis morgen seitwärts handeln wird.
*Long-Position-Strategie (Um den Zeitpunkt des Purple-Finger-Touches 1 oben)
1) Nach der Bestätigung des Touches von $63,7K im Purple-Finger-Zone-1,
ist der Einstiegspunkt für die Long-Position $63.450,9 (hellblaue Hand) / Stop-Loss, falls die grüne Unterstützungslinie gebrochen wird.
2) $64.324,5 ist das erste Ziel für die Long-Position –> Zielpreise in der Reihenfolge Oben, Gut.
- Wenn der Kurs bei $64,3K erreicht wird, nutze den Bereich $64.038,4, um die Long-Position erneut einzusteigen.
3) Wenn der Preis Zone 1 nicht berührt und sofort abfällt:
Der Einstiegspunkt für die Long-Position ist $63.150,2 in der roten Finger-Zone 2 unten / Stop-Loss, falls die grüne Unterstützungslinie gebrochen wird –> Die verbleibenden Zielpreise bleiben gleich.
- Die Bottom-Zone unten ist eine mittelfristige Aufwärtstrendlinie, also
nicht empfehlenswert, wenn sie bricht, da weitere Rückgänge auftreten könnten.
Die Begrenzung ist offen bis zu maximal $62.448,8.
Bitte nutze meine Analysebeiträge lediglich als Referenz und für praktische Zwecke.
Ich hoffe, dass du sicher agierst, indem du dich strikt an die Handelsprinzipien und Stop-Loss-Orders hältst.
Ich poste die Analyseergebnisse jeden Tag als Kommentar.
Vielen Dank.
(Du kannst den Link auf meinem Profil finden.)
- Klicke auf „Folgen“, um jeden Tag schnellere Informationen zu erhalten.
- Überprüfe die Ergebnisse mit der Wiedergabetaste in TradingView.
#Crypto #BTC100K #Altcoin Season# #BTC Price Analysis# $ETH $USDT $BTC $USDT
[August 13 Bitcoin-Chartanalyse]
BTCUSD 30Min-Chart
*Meine Analyse ist für TradingView optimiert.
Wenn du die Wiedergabetaste drückst, kannst du die Bewegungen in Echtzeit prüfen.
-Long-Position-Strategie-
Was den Nasdaq betrifft: Aufgrund des MACD-Dead-Cross im 12-Stunden-Chart
ist es sehr wahrscheinlich, dass er bis morgen seitwärts handeln wird.
*Long-Position-Strategie (Um den Zeitpunkt des Purple-Finger-Touches 1 oben)
1) Nach der Bestätigung des Touches von $63,7K im Purple-Finger-Zone-1,
ist der Einstiegspunkt für die Long-Position $63.450,9 (hellblaue Hand) / Stop-Loss, falls die grüne Unterstützungslinie gebrochen wird.
2) $64.324,5 ist das erste Ziel für die Long-Position –> Zielpreise in der Reihenfolge Oben, Gut.
- Wenn der Kurs bei $64,3K erreicht wird, nutze den Bereich $64.038,4, um die Long-Position erneut einzusteigen.
3) Wenn der Preis Zone 1 nicht berührt und sofort abfällt:
Der Einstiegspunkt für die Long-Position ist $63.150,2 in der roten Finger-Zone 2 unten / Stop-Loss, falls die grüne Unterstützungslinie gebrochen wird –> Die verbleibenden Zielpreise bleiben gleich.
- Die Bottom-Zone unten ist eine mittelfristige Aufwärtstrendlinie, also
nicht empfehlenswert, wenn sie bricht, da weitere Rückgänge auftreten könnten.
Die Begrenzung ist offen bis zu maximal $62.448,8.
Bitte nutze meine Analysebeiträge lediglich als Referenz und für praktische Zwecke.
Ich hoffe, dass du sicher agierst, indem du dich strikt an die Handelsprinzipien und Stop-Loss-Orders hältst.
Ich poste die Analyseergebnisse jeden Tag als Kommentar.
Vielen Dank.
(Du kannst den Link auf meinem Profil finden.)
- Klicke auf „Folgen“, um jeden Tag schnellere Informationen zu erhalten.
- Überprüfe die Ergebnisse mit der Wiedergabetaste in TradingView.
#Crypto #BTC100K #Altcoin Season# #BTC Price Analysis# $ETH $USDT $BTC $USDT
BTCUSD 30Min-Chart
*Meine Analyse ist für TradingView optimiert.
Wenn du die Wiedergabetaste drückst, kannst du die Bewegungen in Echtzeit prüfen.
-Long-Position-Strategie-
Was den Nasdaq betrifft: Aufgrund des MACD-Dead-Cross im 12-Stunden-Chart
ist es sehr wahrscheinlich, dass er bis morgen seitwärts handeln wird.
*Long-Position-Strategie (Um den Zeitpunkt des Purple-Finger-Touches 1 oben)
1) Nach der Bestätigung des Touches von $63,7K im Purple-Finger-Zone-1,
ist der Einstiegspunkt für die Long-Position $63.450,9 (hellblaue Hand) / Stop-Loss, falls die grüne Unterstützungslinie gebrochen wird.
2) $64.324,5 ist das erste Ziel für die Long-Position –> Zielpreise in der Reihenfolge Oben, Gut.
- Wenn der Kurs bei $64,3K erreicht wird, nutze den Bereich $64.038,4, um die Long-Position erneut einzusteigen.
3) Wenn der Preis Zone 1 nicht berührt und sofort abfällt:
Der Einstiegspunkt für die Long-Position ist $63.150,2 in der roten Finger-Zone 2 unten / Stop-Loss, falls die grüne Unterstützungslinie gebrochen wird –> Die verbleibenden Zielpreise bleiben gleich.
- Die Bottom-Zone unten ist eine mittelfristige Aufwärtstrendlinie, also
nicht empfehlenswert, wenn sie bricht, da weitere Rückgänge auftreten könnten.
Die Begrenzung ist offen bis zu maximal $62.448,8.
Bitte nutze meine Analysebeiträge lediglich als Referenz und für praktische Zwecke.
Ich hoffe, dass du sicher agierst, indem du dich strikt an die Handelsprinzipien und Stop-Loss-Orders hältst.
Ich poste die Analyseergebnisse jeden Tag als Kommentar.
Vielen Dank.
(Du kannst den Link auf meinem Profil finden.)
- Klicke auf „Folgen“, um jeden Tag schnellere Informationen zu erhalten.
- Überprüfe die Ergebnisse mit der Wiedergabetaste in TradingView.
#Crypto #BTC100K #Altcoin Season# #BTC Price Analysis# $ETH $USDT $BTC $USDT
86
·
--
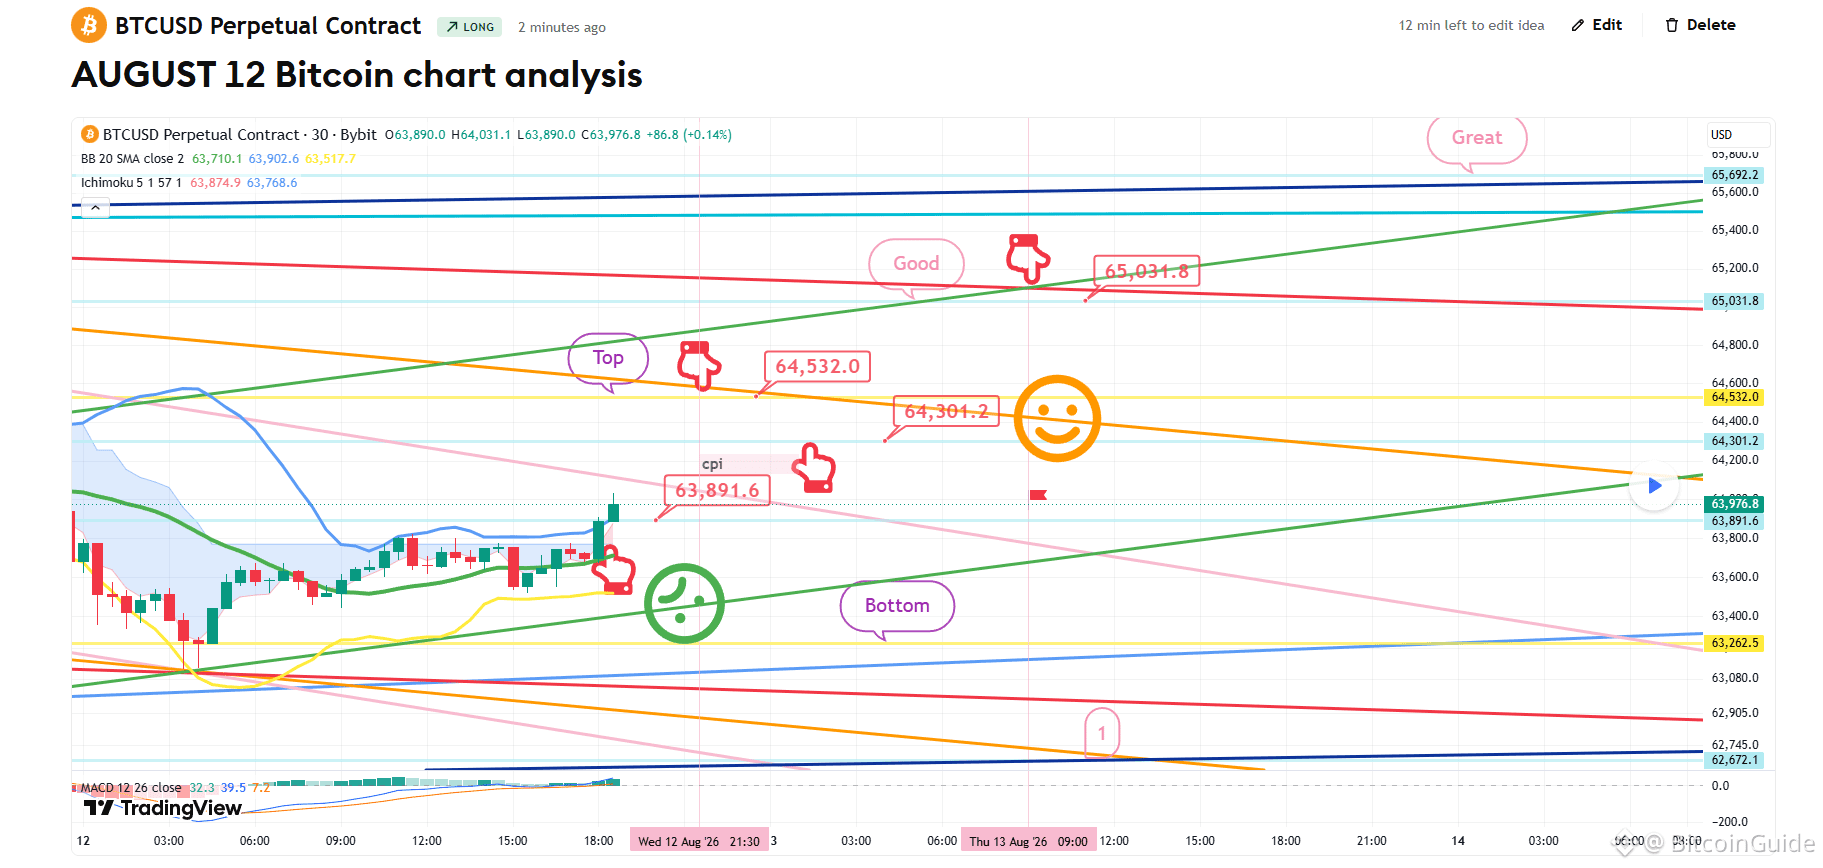
[12. August Bitcoin-Chartanalyse]
BTCUSD 30Min Chart
*Meine Analyse ist für TradingView optimiert.
Wenn du die Wiedergabetaste drückst, kannst du die Bewegungen in Echtzeit überprüfen.
-Long-Position-Strategie-
Der CPI-Indikator wird in Kürze um 9:30 Uhr veröffentlicht.
*Dies ist eine Long-Position-Strategie, um dem Preis zu folgen, indem der Bewegungsweg des roten Fingers nachgezeichnet wird.
1) Einstieg für die Long-Position bei 63.891,6 $ / Stop-Loss, falls die grüne Unterstützungs-Linie durchbrochen wird.
2) 1. Ziel für die Long-Position bei 64.532 $ -> gutes 2. Ziel.
- Wenn die Strategie erfolgreich ist, nutze den Bereich von 64,3K, um erneut in die Long-Position einzusteigen.
- Endzielpreis für den großen Bereich nach morgen.
Wenn die grüne Unterstützungs-Linie durchbrochen wird,
Bitte sei vorsichtig, da der Boden bis zur 1. Zone offen ist.
Angesichts der kürzlichen Beteiligungsrate und der heißen Wetterlage: Wenn heute ein Stop-Loss eintritt, mache ich diese Woche eine Pause vom Veröffentlichen von Analyseartikeln.
Ich poste die Analyseergebnisse jeden Tag als Kommentar.
Vielen Dank.
(Du findest den Link auf meinem Profil.)
- Klicke auf „Folgen“, um jeden Tag schnellere Informationen zu erhalten.
- Prüfe die Ergebnisse mit der Wiedergabe-Schaltfläche auf TradingView.
#BTC100K #Altcoin Season# #BTC Price Analysis# #BNBChain# $BTC $ETH $USDT $ALT $XRP
[12. August Bitcoin-Chartanalyse]
BTCUSD 30Min Chart
*Meine Analyse ist für TradingView optimiert.
Wenn du die Wiedergabetaste drückst, kannst du die Bewegungen in Echtzeit überprüfen.
-Long-Position-Strategie-
Der CPI-Indikator wird in Kürze um 9:30 Uhr veröffentlicht.
*Dies ist eine Long-Position-Strategie, um dem Preis zu folgen, indem der Bewegungsweg des roten Fingers nachgezeichnet wird.
1) Einstieg für die Long-Position bei 63.891,6 $ / Stop-Loss, falls die grüne Unterstützungs-Linie durchbrochen wird.
2) 1. Ziel für die Long-Position bei 64.532 $ -> gutes 2. Ziel.
- Wenn die Strategie erfolgreich ist, nutze den Bereich von 64,3K, um erneut in die Long-Position einzusteigen.
- Endzielpreis für den großen Bereich nach morgen.
Wenn die grüne Unterstützungs-Linie durchbrochen wird,
Bitte sei vorsichtig, da der Boden bis zur 1. Zone offen ist.
Angesichts der kürzlichen Beteiligungsrate und der heißen Wetterlage: Wenn heute ein Stop-Loss eintritt, mache ich diese Woche eine Pause vom Veröffentlichen von Analyseartikeln.
Ich poste die Analyseergebnisse jeden Tag als Kommentar.
Vielen Dank.
(Du findest den Link auf meinem Profil.)
- Klicke auf „Folgen“, um jeden Tag schnellere Informationen zu erhalten.
- Prüfe die Ergebnisse mit der Wiedergabe-Schaltfläche auf TradingView.
#BTC100K #Altcoin Season# #BTC Price Analysis# #BNBChain# $BTC $ETH $USDT $ALT $XRP
BTCUSD 30Min Chart
*Meine Analyse ist für TradingView optimiert.
Wenn du die Wiedergabetaste drückst, kannst du die Bewegungen in Echtzeit überprüfen.
-Long-Position-Strategie-
Der CPI-Indikator wird in Kürze um 9:30 Uhr veröffentlicht.
*Dies ist eine Long-Position-Strategie, um dem Preis zu folgen, indem der Bewegungsweg des roten Fingers nachgezeichnet wird.
1) Einstieg für die Long-Position bei 63.891,6 $ / Stop-Loss, falls die grüne Unterstützungs-Linie durchbrochen wird.
2) 1. Ziel für die Long-Position bei 64.532 $ -> gutes 2. Ziel.
- Wenn die Strategie erfolgreich ist, nutze den Bereich von 64,3K, um erneut in die Long-Position einzusteigen.
- Endzielpreis für den großen Bereich nach morgen.
Wenn die grüne Unterstützungs-Linie durchbrochen wird,
Bitte sei vorsichtig, da der Boden bis zur 1. Zone offen ist.
Angesichts der kürzlichen Beteiligungsrate und der heißen Wetterlage: Wenn heute ein Stop-Loss eintritt, mache ich diese Woche eine Pause vom Veröffentlichen von Analyseartikeln.
Ich poste die Analyseergebnisse jeden Tag als Kommentar.
Vielen Dank.
(Du findest den Link auf meinem Profil.)
- Klicke auf „Folgen“, um jeden Tag schnellere Informationen zu erhalten.
- Prüfe die Ergebnisse mit der Wiedergabe-Schaltfläche auf TradingView.
#BTC100K #Altcoin Season# #BTC Price Analysis# #BNBChain# $BTC $ETH $USDT $ALT $XRP
75
·
--
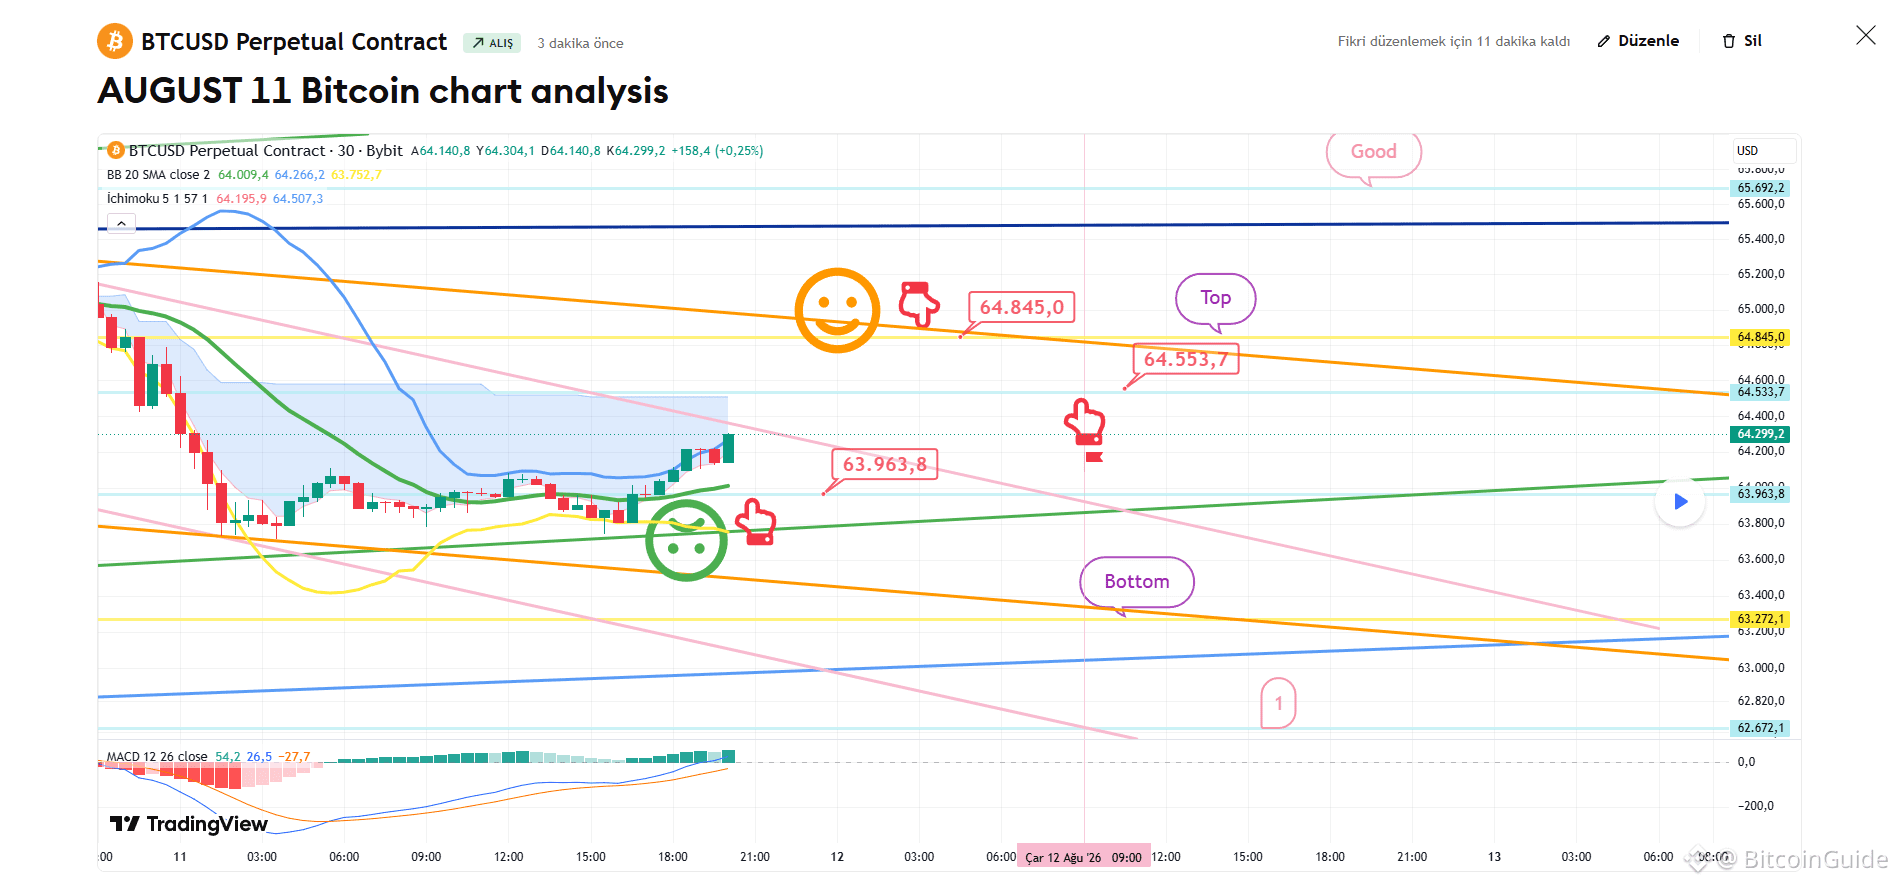
[August 11 Bitcoin Chart-Analyse]
BTCUSD 30Min Chart
*Meine Analyse ist für TradingView optimiert.
Wenn du die Wiedergabetaste drückst, kannst du die Echtzeitbewegungen überprüfen.
-Long-Position-Strategie-
Aktuell läuft auf den 12-Stunden- und Tages-Charts ein MACD Dead Cross.
Ab diesem Punkt ist es die optimale Einstiegzone für eine Short-Position.
*Dies ist eine Long-Position-Strategie, wenn man dem Bewegungsweg folgt, der durch den roten Finger angezeigt wird.
1) $63,963.8 Long-Position Einstiegzone / Stop-Loss, falls unter die grüne Unterstützungs-Linie gebrochen wird
2) $64,845 Long-Position 1. Ziel -> Gutes 2. Ziel
- Wenn die Strategie erfolgreich ist, dient $64.5K als Re-Entry-Zone für die Long-Position.
- Sobald die "Gute"-Zone berührt wird, wird das MACD Dead Cross im Tageschart ignoriert.
Bitte sei vorsichtig, da der Bereich unter der grünen Unterstützungs-Linie bis zum Boden -> bis Zone 1 öffnet.
Ich poste die Analyseergebnisse jeden Tag als Kommentar.
Vielen Dank.
(Du findest den Link in meinem Profil.)
- Klicke auf „Follow“, um jeden Tag schnellere Informationen zu erhalten.
- Überprüfe die Ergebnisse mit der Wiedergabetaste in TradingView.
#BTC Preisanalyse# #Crypto #Altcoin-Season# #BTC100K $USDT $BTC $GOLD $XRP $ETH
[August 11 Bitcoin Chart-Analyse]
BTCUSD 30Min Chart
*Meine Analyse ist für TradingView optimiert.
Wenn du die Wiedergabetaste drückst, kannst du die Echtzeitbewegungen überprüfen.
-Long-Position-Strategie-
Aktuell läuft auf den 12-Stunden- und Tages-Charts ein MACD Dead Cross.
Ab diesem Punkt ist es die optimale Einstiegzone für eine Short-Position.
*Dies ist eine Long-Position-Strategie, wenn man dem Bewegungsweg folgt, der durch den roten Finger angezeigt wird.
1) $63,963.8 Long-Position Einstiegzone / Stop-Loss, falls unter die grüne Unterstützungs-Linie gebrochen wird
2) $64,845 Long-Position 1. Ziel -> Gutes 2. Ziel
- Wenn die Strategie erfolgreich ist, dient $64.5K als Re-Entry-Zone für die Long-Position.
- Sobald die "Gute"-Zone berührt wird, wird das MACD Dead Cross im Tageschart ignoriert.
Bitte sei vorsichtig, da der Bereich unter der grünen Unterstützungs-Linie bis zum Boden -> bis Zone 1 öffnet.
Ich poste die Analyseergebnisse jeden Tag als Kommentar.
Vielen Dank.
(Du findest den Link in meinem Profil.)
- Klicke auf „Follow“, um jeden Tag schnellere Informationen zu erhalten.
- Überprüfe die Ergebnisse mit der Wiedergabetaste in TradingView.
#BTC Preisanalyse# #Crypto #Altcoin-Season# #BTC100K $USDT $BTC $GOLD $XRP $ETH
BTCUSD 30Min Chart
*Meine Analyse ist für TradingView optimiert.
Wenn du die Wiedergabetaste drückst, kannst du die Echtzeitbewegungen überprüfen.
-Long-Position-Strategie-
Aktuell läuft auf den 12-Stunden- und Tages-Charts ein MACD Dead Cross.
Ab diesem Punkt ist es die optimale Einstiegzone für eine Short-Position.
*Dies ist eine Long-Position-Strategie, wenn man dem Bewegungsweg folgt, der durch den roten Finger angezeigt wird.
1) $63,963.8 Long-Position Einstiegzone / Stop-Loss, falls unter die grüne Unterstützungs-Linie gebrochen wird
2) $64,845 Long-Position 1. Ziel -> Gutes 2. Ziel
- Wenn die Strategie erfolgreich ist, dient $64.5K als Re-Entry-Zone für die Long-Position.
- Sobald die "Gute"-Zone berührt wird, wird das MACD Dead Cross im Tageschart ignoriert.
Bitte sei vorsichtig, da der Bereich unter der grünen Unterstützungs-Linie bis zum Boden -> bis Zone 1 öffnet.
Ich poste die Analyseergebnisse jeden Tag als Kommentar.
Vielen Dank.
(Du findest den Link in meinem Profil.)
- Klicke auf „Follow“, um jeden Tag schnellere Informationen zu erhalten.
- Überprüfe die Ergebnisse mit der Wiedergabetaste in TradingView.
#BTC Preisanalyse# #Crypto #Altcoin-Season# #BTC100K $USDT $BTC $GOLD $XRP $ETH
72
·
--
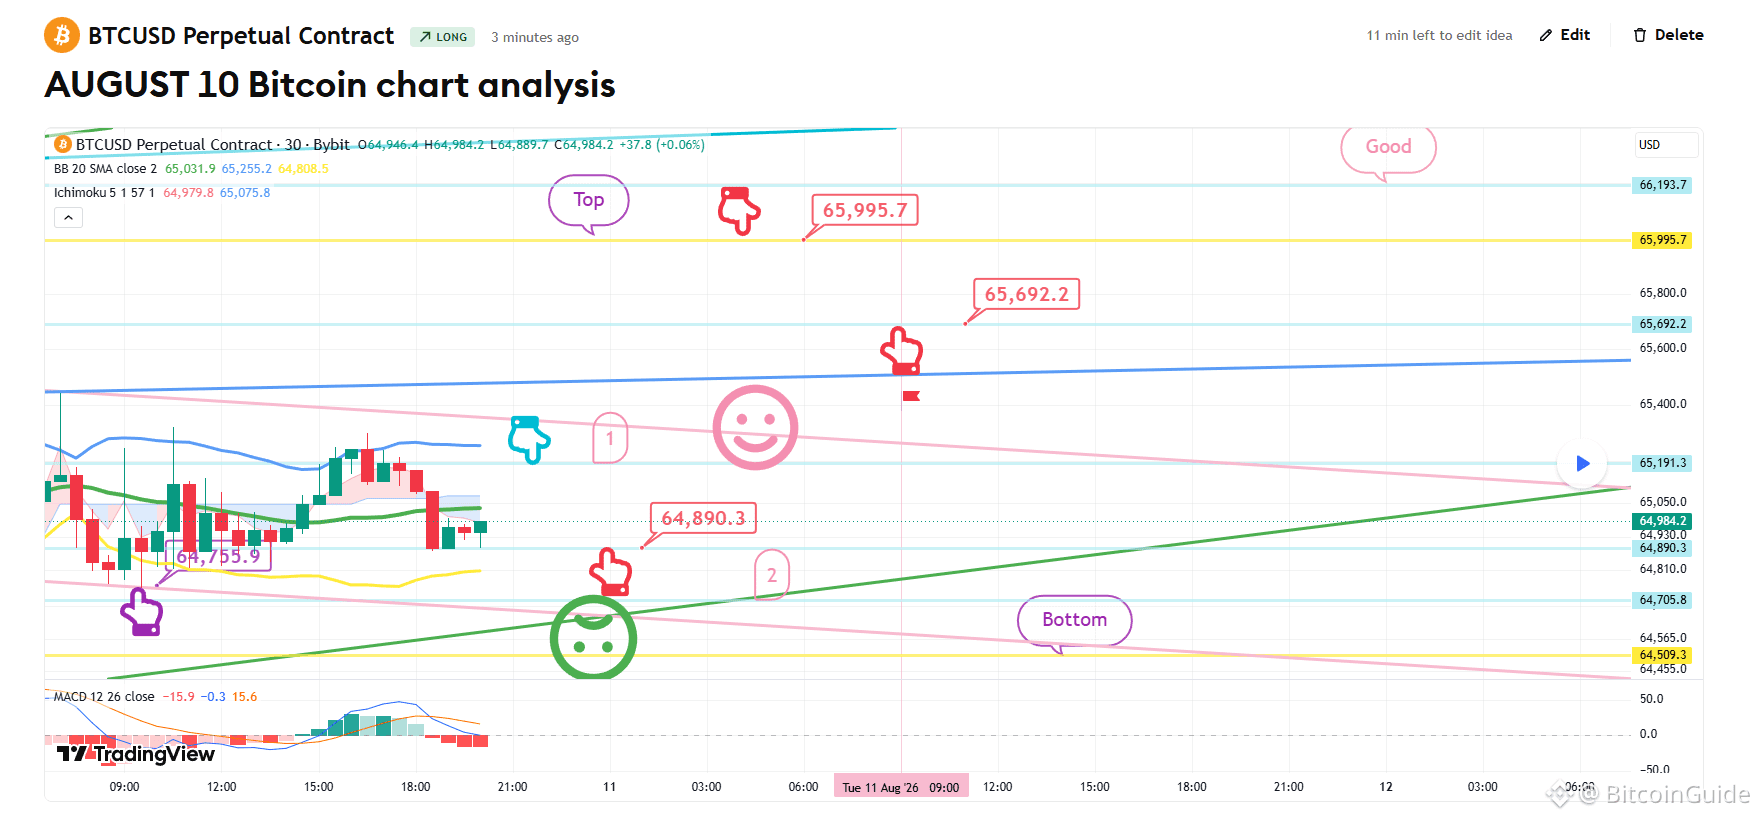
[10. August Bitcoin-Chartanalyse]
BTCUSD 30Min Chart
*Meine Analyse ist für TradingView optimiert.
Wenn du die Wiedergabe-Taste drückst, kannst du die Live-Bewegungen überprüfen.
-Long-Position-Strategie-
Unten links habe ich die Strategie genau mit dem Einstiegspunkt von 64,7K für die Long-Position verbunden, die am 7. August eingegangen wurde, angezeigt durch den violetten Finger.
*Die Long-Position-Strategie wird vor und nach dem Berühren der Teal-Zonenummer 1 oben gezeigt.
1) Nachdem die Berührung von Zone 1 bestätigt wurde (Teal Finger), gehe short.
/ Wechsle zu einer Long-Position bei $64.890,3 (Red Finger) / Stop-Loss, wenn die grüne Unterstützungs-Linie gebrochen wird.
2) $65.995,7 Long Position 1. Ziel -> Guter 2. Zielpreis.
- Wenn die Strategie erfolgreich ist, nutze den 65,6K-Bereich, um die Long-Position erneut einzusteigen.
3) Wenn es sofort fällt, ohne Zone 1 oben zu berühren,
gehe long in Zone 2 ($64.705,8) unten.
/ Stop-Loss, wenn die grüne Unterstützungs-Linie gebrochen wird.
- Bitte sei vorsichtig, denn wenn die grüne Unterstützungs-Linie gebrochen wird, könnte es bis zur Bottom-Zone am unteren Ende fallen.
- Basierend auf dem Muster muss es sich sofort nach oben bewegen, ohne Zone 2 zu berühren, um den Aufwärtstrend sicher aufrechtzuerhalten.
Ich poste die Analyseergebnisse jeden Tag als Kommentar.
Vielen Dank.
(Du findest den Link in meinem Profil.)
- Klicke auf „Follow“, um jeden Tag schnellere Informationen zu erhalten.
- Prüfe die Ergebnisse mit der Wiedergabe-Taste in TradingView.
#Bitcoin #BTC100K #Crypto #Altcoin Season# $USDT $GOLD $QQQX $BTC
[10. August Bitcoin-Chartanalyse]
BTCUSD 30Min Chart
*Meine Analyse ist für TradingView optimiert.
Wenn du die Wiedergabe-Taste drückst, kannst du die Live-Bewegungen überprüfen.
-Long-Position-Strategie-
Unten links habe ich die Strategie genau mit dem Einstiegspunkt von 64,7K für die Long-Position verbunden, die am 7. August eingegangen wurde, angezeigt durch den violetten Finger.
*Die Long-Position-Strategie wird vor und nach dem Berühren der Teal-Zonenummer 1 oben gezeigt.
1) Nachdem die Berührung von Zone 1 bestätigt wurde (Teal Finger), gehe short.
/ Wechsle zu einer Long-Position bei $64.890,3 (Red Finger) / Stop-Loss, wenn die grüne Unterstützungs-Linie gebrochen wird.
2) $65.995,7 Long Position 1. Ziel -> Guter 2. Zielpreis.
- Wenn die Strategie erfolgreich ist, nutze den 65,6K-Bereich, um die Long-Position erneut einzusteigen.
3) Wenn es sofort fällt, ohne Zone 1 oben zu berühren,
gehe long in Zone 2 ($64.705,8) unten.
/ Stop-Loss, wenn die grüne Unterstützungs-Linie gebrochen wird.
- Bitte sei vorsichtig, denn wenn die grüne Unterstützungs-Linie gebrochen wird, könnte es bis zur Bottom-Zone am unteren Ende fallen.
- Basierend auf dem Muster muss es sich sofort nach oben bewegen, ohne Zone 2 zu berühren, um den Aufwärtstrend sicher aufrechtzuerhalten.
Ich poste die Analyseergebnisse jeden Tag als Kommentar.
Vielen Dank.
(Du findest den Link in meinem Profil.)
- Klicke auf „Follow“, um jeden Tag schnellere Informationen zu erhalten.
- Prüfe die Ergebnisse mit der Wiedergabe-Taste in TradingView.
#Bitcoin #BTC100K #Crypto #Altcoin Season# $USDT $GOLD $QQQX $BTC
BTCUSD 30Min Chart
*Meine Analyse ist für TradingView optimiert.
Wenn du die Wiedergabe-Taste drückst, kannst du die Live-Bewegungen überprüfen.
-Long-Position-Strategie-
Unten links habe ich die Strategie genau mit dem Einstiegspunkt von 64,7K für die Long-Position verbunden, die am 7. August eingegangen wurde, angezeigt durch den violetten Finger.
*Die Long-Position-Strategie wird vor und nach dem Berühren der Teal-Zonenummer 1 oben gezeigt.
1) Nachdem die Berührung von Zone 1 bestätigt wurde (Teal Finger), gehe short.
/ Wechsle zu einer Long-Position bei $64.890,3 (Red Finger) / Stop-Loss, wenn die grüne Unterstützungs-Linie gebrochen wird.
2) $65.995,7 Long Position 1. Ziel -> Guter 2. Zielpreis.
- Wenn die Strategie erfolgreich ist, nutze den 65,6K-Bereich, um die Long-Position erneut einzusteigen.
3) Wenn es sofort fällt, ohne Zone 1 oben zu berühren,
gehe long in Zone 2 ($64.705,8) unten.
/ Stop-Loss, wenn die grüne Unterstützungs-Linie gebrochen wird.
- Bitte sei vorsichtig, denn wenn die grüne Unterstützungs-Linie gebrochen wird, könnte es bis zur Bottom-Zone am unteren Ende fallen.
- Basierend auf dem Muster muss es sich sofort nach oben bewegen, ohne Zone 2 zu berühren, um den Aufwärtstrend sicher aufrechtzuerhalten.
Ich poste die Analyseergebnisse jeden Tag als Kommentar.
Vielen Dank.
(Du findest den Link in meinem Profil.)
- Klicke auf „Follow“, um jeden Tag schnellere Informationen zu erhalten.
- Prüfe die Ergebnisse mit der Wiedergabe-Taste in TradingView.
#Bitcoin #BTC100K #Crypto #Altcoin Season# $USDT $GOLD $QQQX $BTC
77
·
--
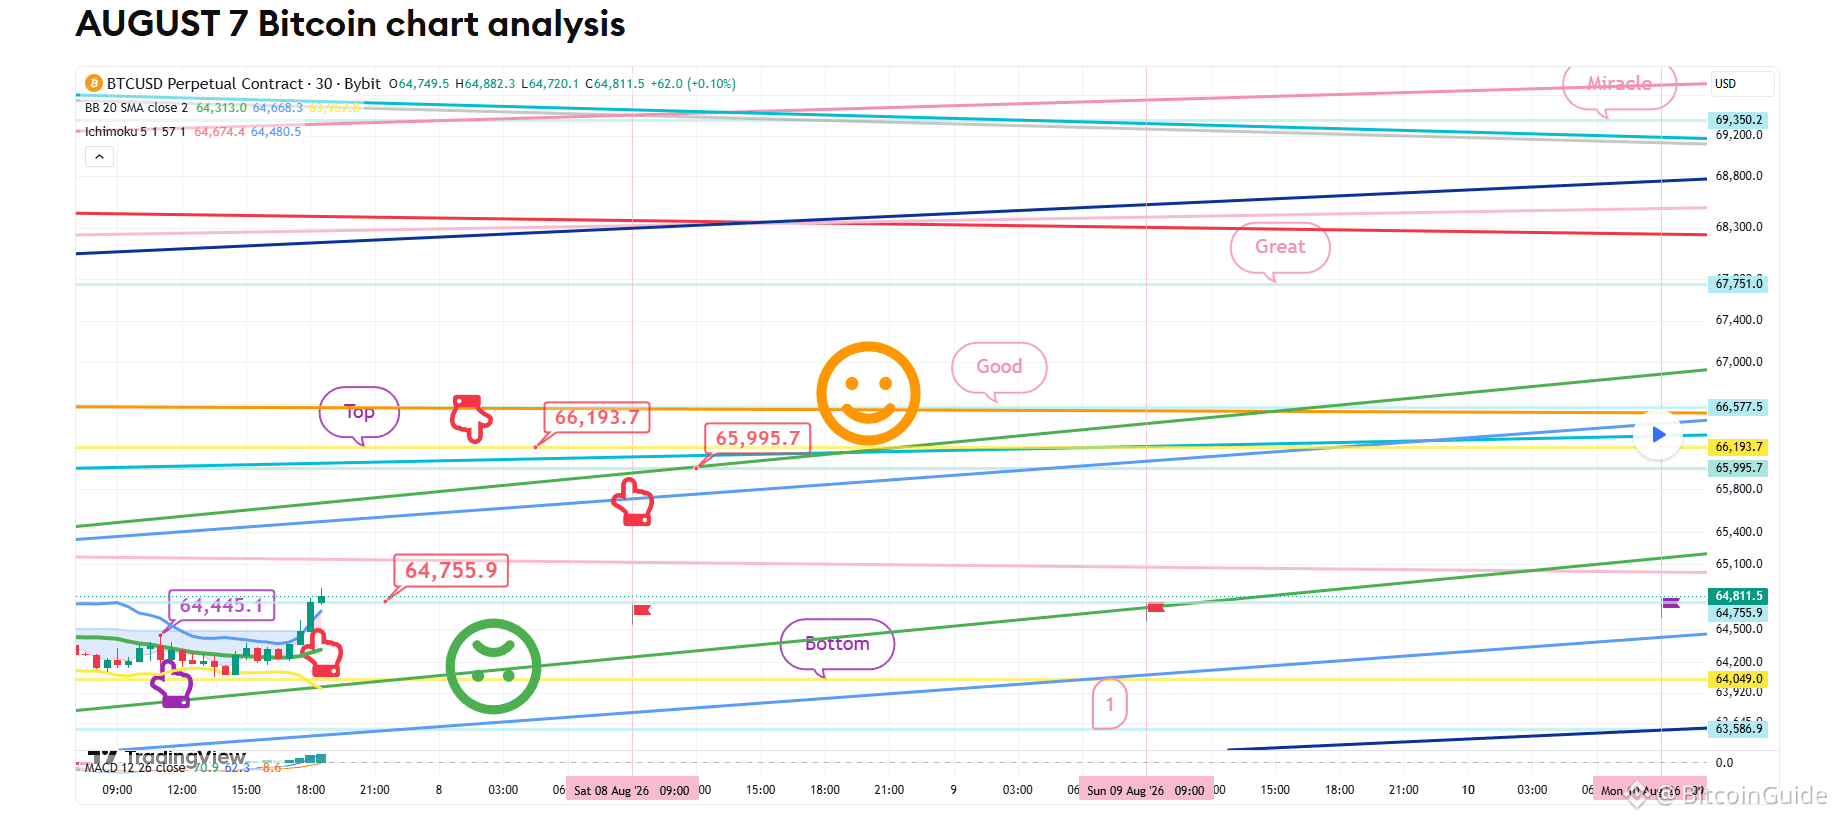
[August 7 Bitcoin Chart-Analyse]
BTCUSD 30Min Chart
*Meine Analyse ist für TradingView optimiert.
Wenn du die Wiedergabetaste drückst, kannst du Echtzeitbewegungen überprüfen.
-Long-Position-Strategie-
*Chase-Buy-Long-Position-Strategie, die dem Bewegungsweg des roten Fingers folgt
1) Chase Buy bei 64.755,9 $ / Stop Loss, falls der Kurs unter der grünen Unterstützungslinie bricht
2) Long-Position 1 bei 66.193,7 $ 1. Ziel -> Wunder-Endzielpreis bis zum Wochenende
- Wenn die Wunder-Marke durchbrochen wird, beginnt ab der nächsten Woche ein Aufwärtstrend.
- Für alle, die Long-Positionen bei 64,4K halten, bleibt der Stop Loss der grünen Unterstützungslinie unverändert.
- 65,9K ist eine Zone, die man für das erneute Eingehen von Long-Positionen nutzen kann.
Ab dem Zeitpunkt, an dem es unter die grüne Unterstützungslinie bricht, kann der Preis auf das Bottom -> Zone 1 fallen, die unten angezeigt ist.
Ich poste die Analyseergebnisse jeden Tag als Kommentar.
Vielen Dank.
(Den Link findest du in meinem Profil.)
- Klicke auf „Follow“, um jeden Tag schnellere Informationen zu erhalten.
- Überprüfe die Ergebnisse mit der Wiedergabetaste in TradingView.
#Bitcoin #BTC100K #BTC Preis-Analyse# #Krypto $ALT $USDT $BTC $XRP $ETH
[August 7 Bitcoin Chart-Analyse]
BTCUSD 30Min Chart
*Meine Analyse ist für TradingView optimiert.
Wenn du die Wiedergabetaste drückst, kannst du Echtzeitbewegungen überprüfen.
-Long-Position-Strategie-
*Chase-Buy-Long-Position-Strategie, die dem Bewegungsweg des roten Fingers folgt
1) Chase Buy bei 64.755,9 $ / Stop Loss, falls der Kurs unter der grünen Unterstützungslinie bricht
2) Long-Position 1 bei 66.193,7 $ 1. Ziel -> Wunder-Endzielpreis bis zum Wochenende
- Wenn die Wunder-Marke durchbrochen wird, beginnt ab der nächsten Woche ein Aufwärtstrend.
- Für alle, die Long-Positionen bei 64,4K halten, bleibt der Stop Loss der grünen Unterstützungslinie unverändert.
- 65,9K ist eine Zone, die man für das erneute Eingehen von Long-Positionen nutzen kann.
Ab dem Zeitpunkt, an dem es unter die grüne Unterstützungslinie bricht, kann der Preis auf das Bottom -> Zone 1 fallen, die unten angezeigt ist.
Ich poste die Analyseergebnisse jeden Tag als Kommentar.
Vielen Dank.
(Den Link findest du in meinem Profil.)
- Klicke auf „Follow“, um jeden Tag schnellere Informationen zu erhalten.
- Überprüfe die Ergebnisse mit der Wiedergabetaste in TradingView.
#Bitcoin #BTC100K #BTC Preis-Analyse# #Krypto $ALT $USDT $BTC $XRP $ETH
BTCUSD 30Min Chart
*Meine Analyse ist für TradingView optimiert.
Wenn du die Wiedergabetaste drückst, kannst du Echtzeitbewegungen überprüfen.
-Long-Position-Strategie-
*Chase-Buy-Long-Position-Strategie, die dem Bewegungsweg des roten Fingers folgt
1) Chase Buy bei 64.755,9 $ / Stop Loss, falls der Kurs unter der grünen Unterstützungslinie bricht
2) Long-Position 1 bei 66.193,7 $ 1. Ziel -> Wunder-Endzielpreis bis zum Wochenende
- Wenn die Wunder-Marke durchbrochen wird, beginnt ab der nächsten Woche ein Aufwärtstrend.
- Für alle, die Long-Positionen bei 64,4K halten, bleibt der Stop Loss der grünen Unterstützungslinie unverändert.
- 65,9K ist eine Zone, die man für das erneute Eingehen von Long-Positionen nutzen kann.
Ab dem Zeitpunkt, an dem es unter die grüne Unterstützungslinie bricht, kann der Preis auf das Bottom -> Zone 1 fallen, die unten angezeigt ist.
Ich poste die Analyseergebnisse jeden Tag als Kommentar.
Vielen Dank.
(Den Link findest du in meinem Profil.)
- Klicke auf „Follow“, um jeden Tag schnellere Informationen zu erhalten.
- Überprüfe die Ergebnisse mit der Wiedergabetaste in TradingView.
#Bitcoin #BTC100K #BTC Preis-Analyse# #Krypto $ALT $USDT $BTC $XRP $ETH
70
·
--
[6. August Bitcoin-Chartanalyse]
BTCUSD 30Min-Chart
*Meine Analyse ist für TradingView optimiert.
Wenn Sie die Wiedergabe-Taste drücken, können Sie Echtzeitbewegungen überprüfen.
-Long-Position-Strategie-
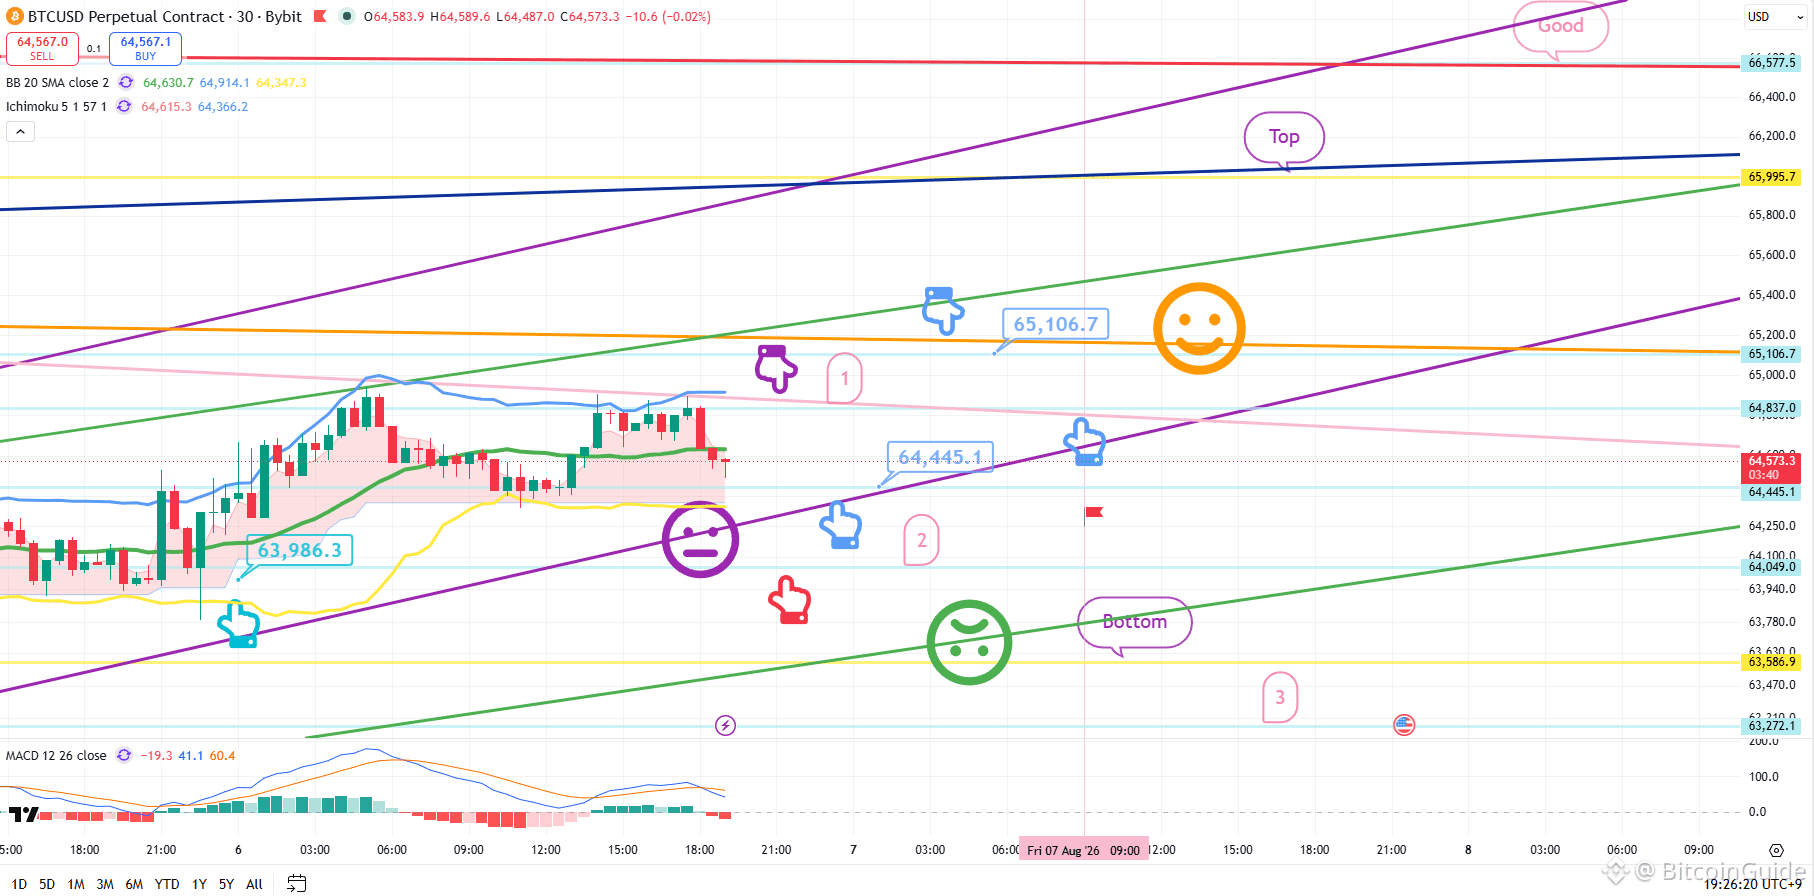
Unten links, in Türkis markiert, wurde die Strategie beibehalten, nachdem die Long-Position am 5. August bei $63.986,3 eröffnet wurde.
*Die Strategie wurde wie sie ist beibehalten. *Long-Position-Strategie vor und nach dem Berühren von Zone 1 (Lila Finger) am oberen Bereich
1) Lila-Finger-Zone 1: 64,8K Einstieg in Short-Position
/ Stop-Loss bei Bruch der orangefarbenen Widerstandslinie
2) Wechsel zur Long-Position bei $64445,1 / Stop-Loss bei Bruch der lila Support-Linie
3) $65106,7 Long-Position 1. Ziel -> Top 2. Ziel-Preis
- Wenn die Strategie erfolgreich ist, dient Zone 1 als Re-Entry-Zone für die Long-Position.
4) Wenn der Preis Zone 1 (Lila Finger) oben nicht berührt und sofort abfällt:
Roter-Finger-Zone 2 (Roter Finger) unten: $64049 Einstieg in die Long-Position / Stop-Loss bei Bruch der grünen Support-Linie
- Der Stop-Loss ist derselbe für alle, die derzeit Long bei 63,9K halten.
- Bitte seien Sie vorsichtig, da die Möglichkeit eines Abstiegs in die 3. Zone offen ist, falls die untere Zone durchbrochen wird.
Bitte achten Sie besonders auf die Echtzeitbewegungen des NASDAQ.
(Gold steigt ganz von selbst.)
Ich poste die Analyseergebnisse täglich als Kommentar.
Vielen Dank.
(Den Link finden Sie auf meinem Profil.)
- Klicken Sie auf „Follow“, um jeden Tag schnellere Informationen zu erhalten.
- Prüfen Sie die Ergebnisse mit der Wiedergabe-Taste in TradingView.
#Bitcoin #BTC-Preisanalysen# #Crypto #Altcoin-Saison# $ETH $USDT $XRP $BTC
[6. August Bitcoin-Chartanalyse]
BTCUSD 30Min-Chart
*Meine Analyse ist für TradingView optimiert.
Wenn Sie die Wiedergabe-Taste drücken, können Sie Echtzeitbewegungen überprüfen.
-Long-Position-Strategie-
Unten links, in Türkis markiert, wurde die Strategie beibehalten, nachdem die Long-Position am 5. August bei $63.986,3 eröffnet wurde.
*Die Strategie wurde wie sie ist beibehalten. *Long-Position-Strategie vor und nach dem Berühren von Zone 1 (Lila Finger) am oberen Bereich
1) Lila-Finger-Zone 1: 64,8K Einstieg in Short-Position
/ Stop-Loss bei Bruch der orangefarbenen Widerstandslinie
2) Wechsel zur Long-Position bei $64445,1 / Stop-Loss bei Bruch der lila Support-Linie
3) $65106,7 Long-Position 1. Ziel -> Top 2. Ziel-Preis
- Wenn die Strategie erfolgreich ist, dient Zone 1 als Re-Entry-Zone für die Long-Position.
4) Wenn der Preis Zone 1 (Lila Finger) oben nicht berührt und sofort abfällt:
Roter-Finger-Zone 2 (Roter Finger) unten: $64049 Einstieg in die Long-Position / Stop-Loss bei Bruch der grünen Support-Linie
- Der Stop-Loss ist derselbe für alle, die derzeit Long bei 63,9K halten.
- Bitte seien Sie vorsichtig, da die Möglichkeit eines Abstiegs in die 3. Zone offen ist, falls die untere Zone durchbrochen wird.
Bitte achten Sie besonders auf die Echtzeitbewegungen des NASDAQ.
(Gold steigt ganz von selbst.)
Ich poste die Analyseergebnisse täglich als Kommentar.
Vielen Dank.
(Den Link finden Sie auf meinem Profil.)
- Klicken Sie auf „Follow“, um jeden Tag schnellere Informationen zu erhalten.
- Prüfen Sie die Ergebnisse mit der Wiedergabe-Taste in TradingView.
#Bitcoin #BTC-Preisanalysen# #Crypto #Altcoin-Saison# $ETH $USDT $XRP $BTC
BTCUSD 30Min-Chart
*Meine Analyse ist für TradingView optimiert.
Wenn Sie die Wiedergabe-Taste drücken, können Sie Echtzeitbewegungen überprüfen.
-Long-Position-Strategie-
Unten links, in Türkis markiert, wurde die Strategie beibehalten, nachdem die Long-Position am 5. August bei $63.986,3 eröffnet wurde.
*Die Strategie wurde wie sie ist beibehalten. *Long-Position-Strategie vor und nach dem Berühren von Zone 1 (Lila Finger) am oberen Bereich
1) Lila-Finger-Zone 1: 64,8K Einstieg in Short-Position
/ Stop-Loss bei Bruch der orangefarbenen Widerstandslinie
2) Wechsel zur Long-Position bei $64445,1 / Stop-Loss bei Bruch der lila Support-Linie
3) $65106,7 Long-Position 1. Ziel -> Top 2. Ziel-Preis
- Wenn die Strategie erfolgreich ist, dient Zone 1 als Re-Entry-Zone für die Long-Position.
4) Wenn der Preis Zone 1 (Lila Finger) oben nicht berührt und sofort abfällt:
Roter-Finger-Zone 2 (Roter Finger) unten: $64049 Einstieg in die Long-Position / Stop-Loss bei Bruch der grünen Support-Linie
- Der Stop-Loss ist derselbe für alle, die derzeit Long bei 63,9K halten.
- Bitte seien Sie vorsichtig, da die Möglichkeit eines Abstiegs in die 3. Zone offen ist, falls die untere Zone durchbrochen wird.
Bitte achten Sie besonders auf die Echtzeitbewegungen des NASDAQ.
(Gold steigt ganz von selbst.)
Ich poste die Analyseergebnisse täglich als Kommentar.
Vielen Dank.
(Den Link finden Sie auf meinem Profil.)
- Klicken Sie auf „Follow“, um jeden Tag schnellere Informationen zu erhalten.
- Prüfen Sie die Ergebnisse mit der Wiedergabe-Taste in TradingView.
#Bitcoin #BTC-Preisanalysen# #Crypto #Altcoin-Saison# $ETH $USDT $XRP $BTC
72
·
--
[August 5 Bitcoin Chart Analyse]
BTCUSD 30Min Chart
*Meine Analyse ist für TradingView optimiert.
Wenn du die Replay-Schaltfläche drückst, kannst du Echtzeitbewegungen überprüfen.
-Long-Position-Strategie-
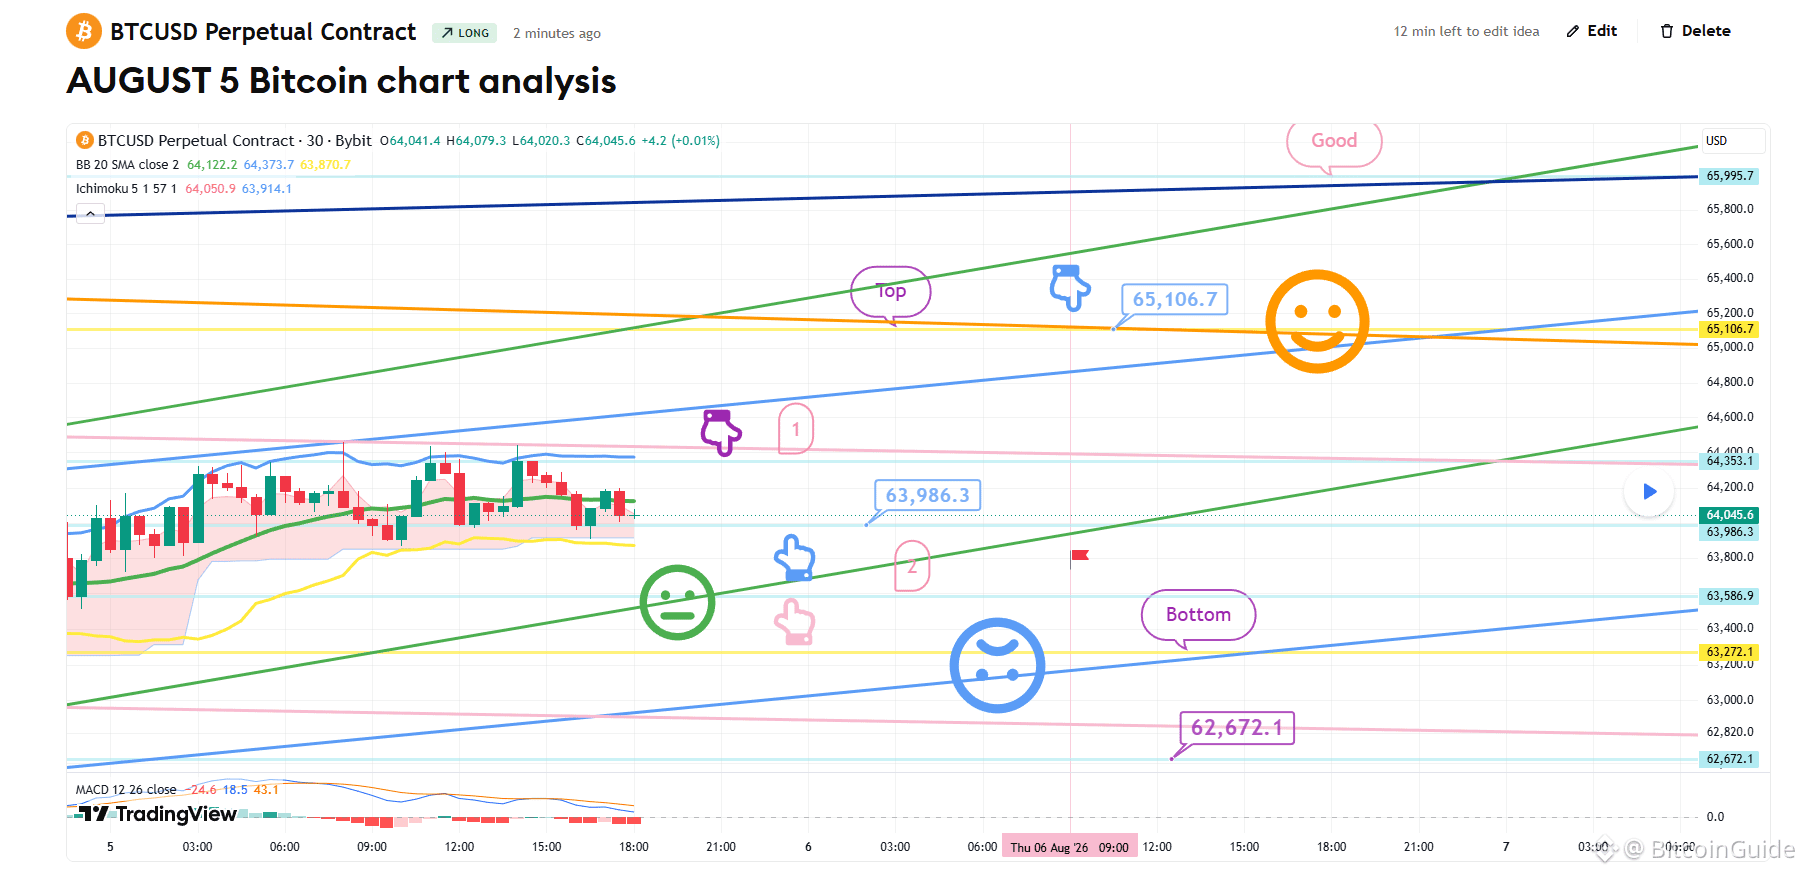
*Long-Position-Strategie: Vor und nach dem Berühren der purpurnen „Finger“-Zone 1 oben
1) Nach dem Berühren der purpurnen „Finger“-Zone 1 (Autonomous Short): Wechsel zu einer Long-Position bei $63,986.3 / Stop-Loss, falls unter die grüne Unterstützungslinie gebrochen wird
2) $65,106.7 Long Position 1. Ziel -> gutes 2. Ziel
- Wenn es sofort fällt, ohne die purpurne „Finger“-Zone zu berühren:
Long-Position in Zone 2 unten eröffnen, $63,586.9
/ Stop-Loss, falls unter die hellblaue Unterstützungslinie gebrochen wird
Bitte sei vorsichtig, da der Kurs am absoluten unteren Ende bei $62,672.1 aufspringt, nachdem die untere Zone gebrochen wurde.
Ich poste die Analyseergebnisse täglich als Kommentar.
Vielen Dank.
(Den Link findest du auf meinem Profil.)
- Klicke auf „Follow“, um jeden Tag schnellere Informationen zu erhalten.
- Prüfe die Ergebnisse mit der Replay-Funktion auf TradingView.
#Bitcoin #BTC Preisanalyse# #Krypto #Altcoin-Season# $ETH $GOLD $BTC $QQQX
[August 5 Bitcoin Chart Analyse]
BTCUSD 30Min Chart
*Meine Analyse ist für TradingView optimiert.
Wenn du die Replay-Schaltfläche drückst, kannst du Echtzeitbewegungen überprüfen.
-Long-Position-Strategie-
*Long-Position-Strategie: Vor und nach dem Berühren der purpurnen „Finger“-Zone 1 oben
1) Nach dem Berühren der purpurnen „Finger“-Zone 1 (Autonomous Short): Wechsel zu einer Long-Position bei $63,986.3 / Stop-Loss, falls unter die grüne Unterstützungslinie gebrochen wird
2) $65,106.7 Long Position 1. Ziel -> gutes 2. Ziel
- Wenn es sofort fällt, ohne die purpurne „Finger“-Zone zu berühren:
Long-Position in Zone 2 unten eröffnen, $63,586.9
/ Stop-Loss, falls unter die hellblaue Unterstützungslinie gebrochen wird
Bitte sei vorsichtig, da der Kurs am absoluten unteren Ende bei $62,672.1 aufspringt, nachdem die untere Zone gebrochen wurde.
Ich poste die Analyseergebnisse täglich als Kommentar.
Vielen Dank.
(Den Link findest du auf meinem Profil.)
- Klicke auf „Follow“, um jeden Tag schnellere Informationen zu erhalten.
- Prüfe die Ergebnisse mit der Replay-Funktion auf TradingView.
#Bitcoin #BTC Preisanalyse# #Krypto #Altcoin-Season# $ETH $GOLD $BTC $QQQX
BTCUSD 30Min Chart
*Meine Analyse ist für TradingView optimiert.
Wenn du die Replay-Schaltfläche drückst, kannst du Echtzeitbewegungen überprüfen.
-Long-Position-Strategie-
*Long-Position-Strategie: Vor und nach dem Berühren der purpurnen „Finger“-Zone 1 oben
1) Nach dem Berühren der purpurnen „Finger“-Zone 1 (Autonomous Short): Wechsel zu einer Long-Position bei $63,986.3 / Stop-Loss, falls unter die grüne Unterstützungslinie gebrochen wird
2) $65,106.7 Long Position 1. Ziel -> gutes 2. Ziel
- Wenn es sofort fällt, ohne die purpurne „Finger“-Zone zu berühren:
Long-Position in Zone 2 unten eröffnen, $63,586.9
/ Stop-Loss, falls unter die hellblaue Unterstützungslinie gebrochen wird
Bitte sei vorsichtig, da der Kurs am absoluten unteren Ende bei $62,672.1 aufspringt, nachdem die untere Zone gebrochen wurde.
Ich poste die Analyseergebnisse täglich als Kommentar.
Vielen Dank.
(Den Link findest du auf meinem Profil.)
- Klicke auf „Follow“, um jeden Tag schnellere Informationen zu erhalten.
- Prüfe die Ergebnisse mit der Replay-Funktion auf TradingView.
#Bitcoin #BTC Preisanalyse# #Krypto #Altcoin-Season# $ETH $GOLD $BTC $QQQX
71
·
--
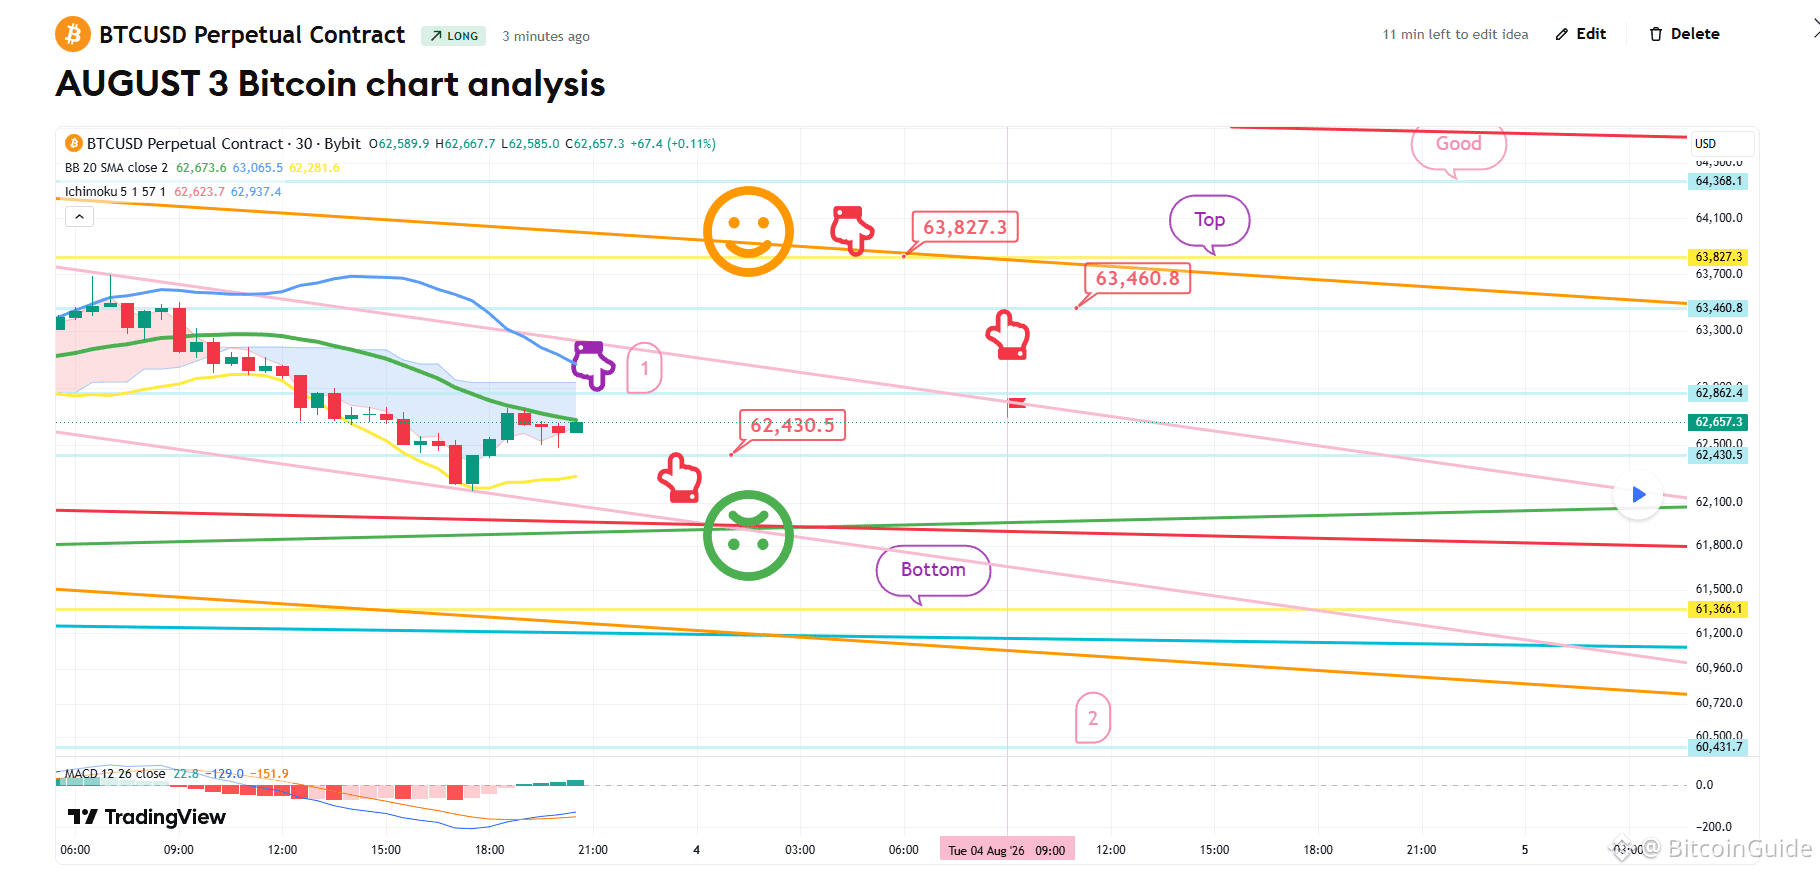
[AUGUST 3 Bitcoin Chart-Analyse] BTCUSD 30Min Chart *Meine Analyse ist für TradingView optimiert. Wenn du die Wiedergabetaste drückst, kannst du Echtzeitbewegungen prüfen. *Long-Position-Strategie nach Bestätigung des Touches des purpurnen Fingers bei Zone 1 1) Nach Bestätigung des Touches des purpurnen Fingers bei Zone 1 bei 62,8K 62.430,5 USD: Einstiegspunkt für eine Long-Position / Stop-Loss, falls gebrochen unter die grüne Unterstützungslinie 2) 63.827,3 USD: Zielpreis für die Long-Position -> Endgültiger Zielpreis in der Good Zone Selbst wenn es oben nicht Zone 1 berührt, kann es weiter steigen, solange es heute nicht unter die grüne Unterstützungslinie fällt. Bitte sei jedoch vorsichtig, da der Markt vom unteren Bereich bis Zone 2 geöffnet ist, sobald die grüne Unterstützungslinie gebrochen wird. Ich poste die Analyseergebnisse jeden Tag als Kommentar. Vielen Dank. (Den Link findest du in meinem Profil.) - Klicke auf „Follow“, um täglich schnellere Informationen zu erhalten. - Prüfe die Ergebnisse mit der Wiedergabetaste auf TradingView. #BTC-Preisanalyse# #Crypto #USDT #Altcoin-Season# $BTC $ETH $XRP
[AUGUST 3 Bitcoin Chart-Analyse] BTCUSD 30Min Chart *Meine Analyse ist für TradingView optimiert. Wenn du die Wiedergabetaste drückst, kannst du Echtzeitbewegungen prüfen. *Long-Position-Strategie nach Bestätigung des Touches des purpurnen Fingers bei Zone 1 1) Nach Bestätigung des Touches des purpurnen Fingers bei Zone 1 bei 62,8K 62.430,5 USD: Einstiegspunkt für eine Long-Position / Stop-Loss, falls gebrochen unter die grüne Unterstützungslinie 2) 63.827,3 USD: Zielpreis für die Long-Position -> Endgültiger Zielpreis in der Good Zone Selbst wenn es oben nicht Zone 1 berührt, kann es weiter steigen, solange es heute nicht unter die grüne Unterstützungslinie fällt. Bitte sei jedoch vorsichtig, da der Markt vom unteren Bereich bis Zone 2 geöffnet ist, sobald die grüne Unterstützungslinie gebrochen wird. Ich poste die Analyseergebnisse jeden Tag als Kommentar. Vielen Dank. (Den Link findest du in meinem Profil.) - Klicke auf „Follow“, um täglich schnellere Informationen zu erhalten. - Prüfe die Ergebnisse mit der Wiedergabetaste auf TradingView. #BTC-Preisanalyse# #Crypto #USDT #Altcoin-Season# $BTC $ETH $XRP
55
·
--
[31. Juli Bitcoin-Chartanalyse]
BTCUSD 30Min-Chart
*Meine Analyse ist für TradingView optimiert.
Wenn Sie die Wiedergabetaste drücken, können Sie Echtzeitbewegungen überprüfen.
*Long-Position-Strategie basierend auf dem Bewegungsweg des roten Fingers
1) Nachdem Sie bestätigt haben, dass der violette Finger einmal die Oberkante berührt (Short nach Ihrem Ermessen)
$63,613.2 ist der Einstiegspunkt für die Long-Position / Stop-Loss, falls die grüne Unterstützungslinie gebrochen wird
2) $65,106.7 ist das 1. Ziel für die Long-Position -> Guter 2. Zielpreis
- Wenn es sofort fällt, ohne Zone 1 zu berühren, platzieren Sie eine finale Long-Position am Bottom / Stop-Loss, falls es durch die hellblaue Unterstützungslinie gebrochen wird
Wenn die blaue Unterstützungslinie gebrochen wird
Bottom am unteren Bereich -> Bitte seien Sie vorsichtig, da es bis zu Zone 2 fallen könnte.
Ich poste die Analyseergebnisse jeden Tag als Kommentar.
Vielen Dank.
(Den Link finden Sie in meinem Profil.)
- Klicken Sie auf „Folgen“, um jeden Tag schnellere Informationen zu erhalten.
- Überprüfen Sie die Ergebnisse mit der Wiedergabetaste in TradingView.
#BTC-Preisanalys# #Altcoin-Saison# #Krypto# #USDT $ETH $BTC $XRP $ALT
[31. Juli Bitcoin-Chartanalyse]
BTCUSD 30Min-Chart
*Meine Analyse ist für TradingView optimiert.
Wenn Sie die Wiedergabetaste drücken, können Sie Echtzeitbewegungen überprüfen.
*Long-Position-Strategie basierend auf dem Bewegungsweg des roten Fingers
1) Nachdem Sie bestätigt haben, dass der violette Finger einmal die Oberkante berührt (Short nach Ihrem Ermessen)
$63,613.2 ist der Einstiegspunkt für die Long-Position / Stop-Loss, falls die grüne Unterstützungslinie gebrochen wird
2) $65,106.7 ist das 1. Ziel für die Long-Position -> Guter 2. Zielpreis
- Wenn es sofort fällt, ohne Zone 1 zu berühren, platzieren Sie eine finale Long-Position am Bottom / Stop-Loss, falls es durch die hellblaue Unterstützungslinie gebrochen wird
Wenn die blaue Unterstützungslinie gebrochen wird
Bottom am unteren Bereich -> Bitte seien Sie vorsichtig, da es bis zu Zone 2 fallen könnte.
Ich poste die Analyseergebnisse jeden Tag als Kommentar.
Vielen Dank.
(Den Link finden Sie in meinem Profil.)
- Klicken Sie auf „Folgen“, um jeden Tag schnellere Informationen zu erhalten.
- Überprüfen Sie die Ergebnisse mit der Wiedergabetaste in TradingView.
#BTC-Preisanalys# #Altcoin-Saison# #Krypto# #USDT $ETH $BTC $XRP $ALT
BTCUSD 30Min-Chart
*Meine Analyse ist für TradingView optimiert.
Wenn Sie die Wiedergabetaste drücken, können Sie Echtzeitbewegungen überprüfen.
*Long-Position-Strategie basierend auf dem Bewegungsweg des roten Fingers
1) Nachdem Sie bestätigt haben, dass der violette Finger einmal die Oberkante berührt (Short nach Ihrem Ermessen)
$63,613.2 ist der Einstiegspunkt für die Long-Position / Stop-Loss, falls die grüne Unterstützungslinie gebrochen wird
2) $65,106.7 ist das 1. Ziel für die Long-Position -> Guter 2. Zielpreis
- Wenn es sofort fällt, ohne Zone 1 zu berühren, platzieren Sie eine finale Long-Position am Bottom / Stop-Loss, falls es durch die hellblaue Unterstützungslinie gebrochen wird
Wenn die blaue Unterstützungslinie gebrochen wird
Bottom am unteren Bereich -> Bitte seien Sie vorsichtig, da es bis zu Zone 2 fallen könnte.
Ich poste die Analyseergebnisse jeden Tag als Kommentar.
Vielen Dank.
(Den Link finden Sie in meinem Profil.)
- Klicken Sie auf „Folgen“, um jeden Tag schnellere Informationen zu erhalten.
- Überprüfen Sie die Ergebnisse mit der Wiedergabetaste in TradingView.
#BTC-Preisanalys# #Altcoin-Saison# #Krypto# #USDT $ETH $BTC $XRP $ALT

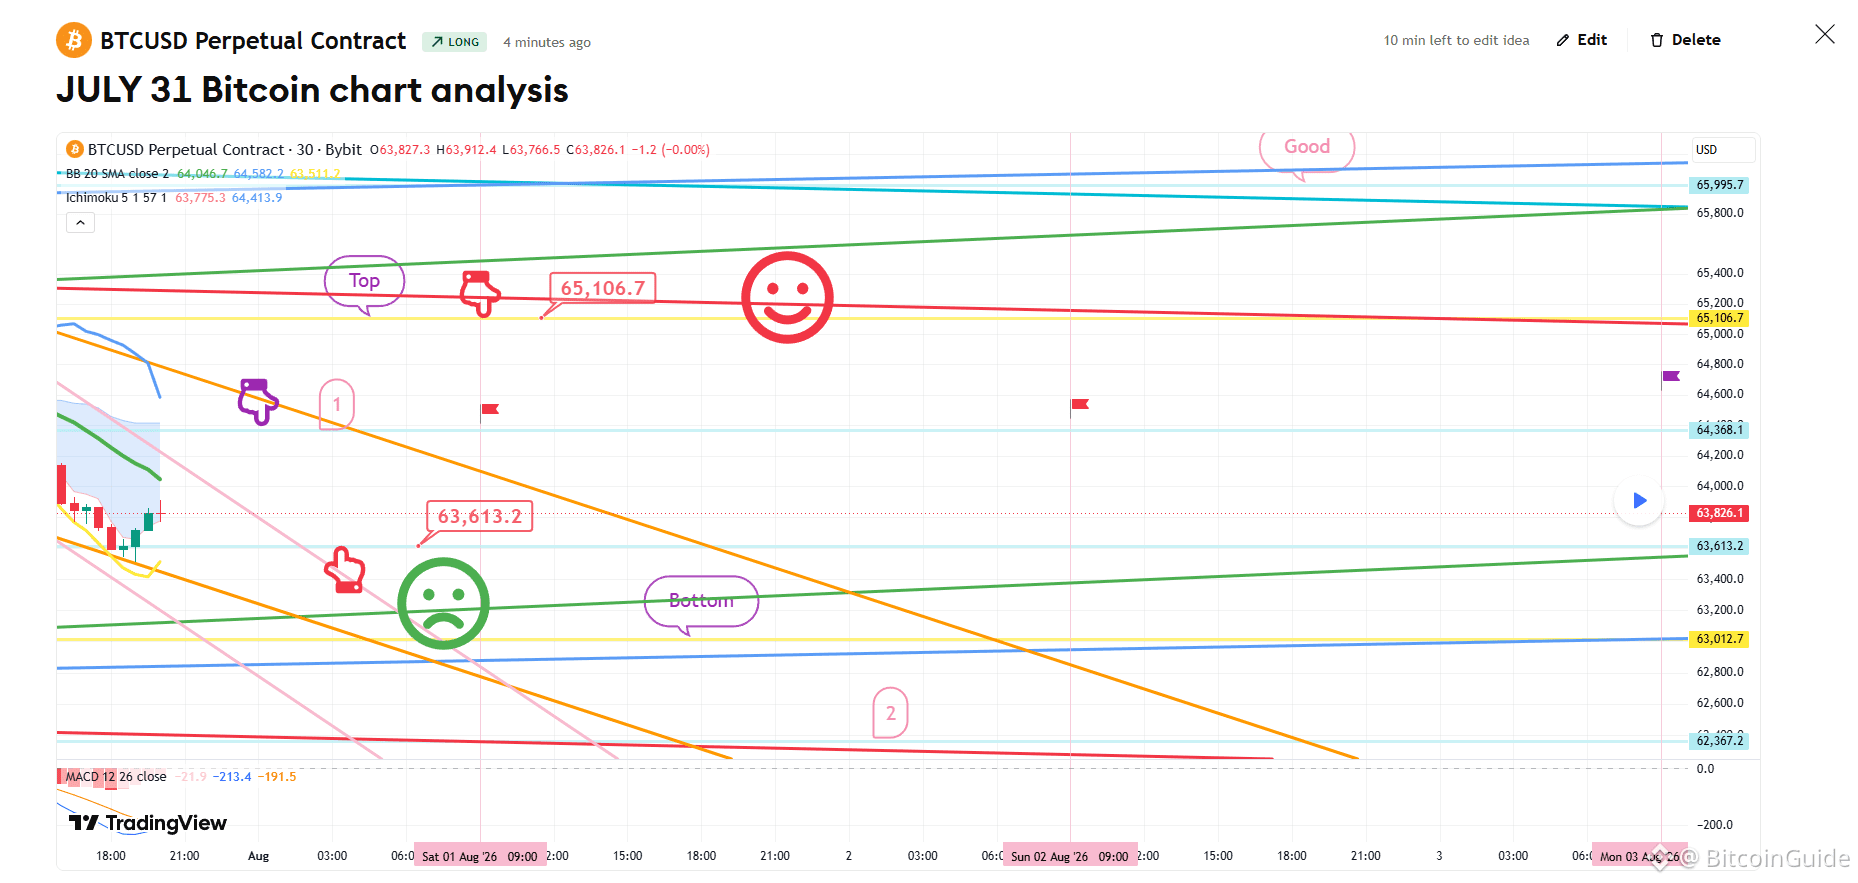
62
·
--
https://x.com/BitcoinGuide_TM/status/2083130886091055580?s=20 Erfolgreicher Rebound auf 27,6K ->Aktueller Preis 28,5K Bitte achte auf den Zielkurs oben. Je stärker der Anstieg heute ist, desto stärker passt es zu einem Aufwärtstrend. Und was ist dann mit Bitcoin?? #BTC Preisanalyse# #Altcoin-Saison# #BTC100K $BTC $USDT $CRYPTO
https://x.com/BitcoinGuide_TM/status/2083130886091055580?s=20 Erfolgreicher Rebound auf 27,6K ->Aktueller Preis 28,5K Bitte achte auf den Zielkurs oben. Je stärker der Anstieg heute ist, desto stärker passt es zu einem Aufwärtstrend. Und was ist dann mit Bitcoin?? #BTC Preisanalyse# #Altcoin-Saison# #BTC100K $BTC $USDT $CRYPTO
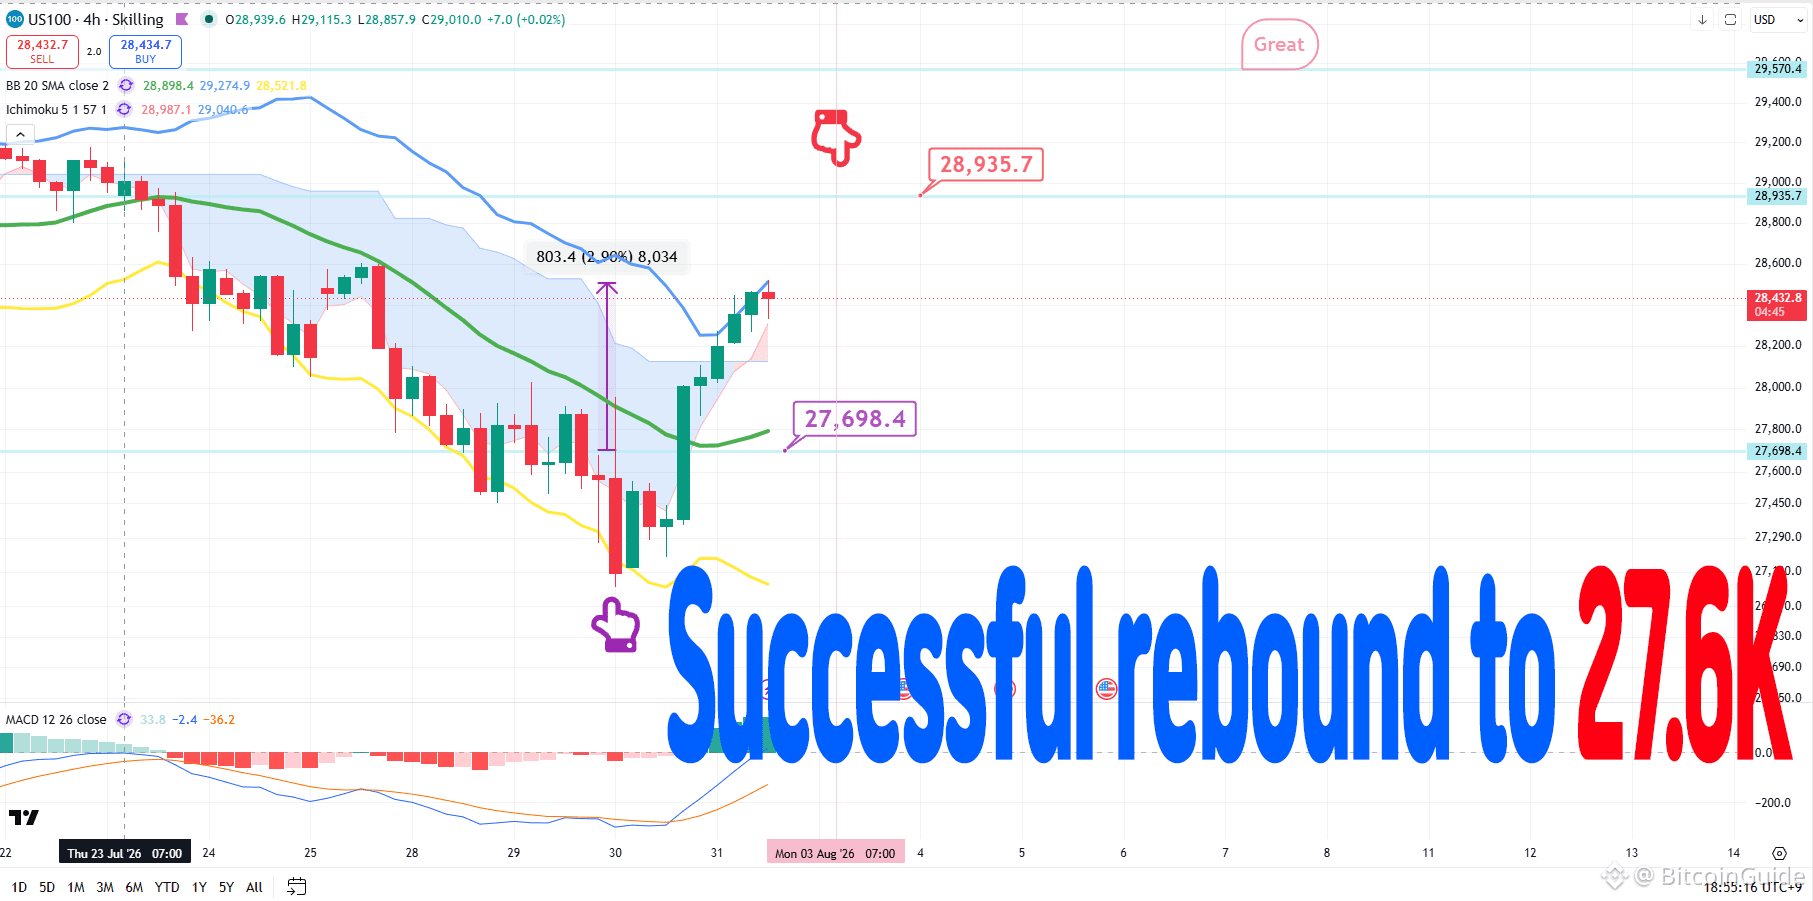
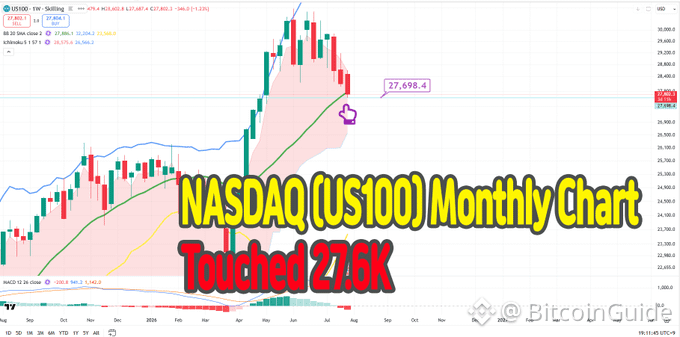
63
·
--
[30. Juli Bitcoin-Chartanalyse]
BTCUSD 30Min-Chart
*Meine Analyse ist für TradingView optimiert.
Wenn du die Replay-Schaltfläche drückst, kannst du die Echtzeitbewegungen prüfen.
-Long-Position-Strategie-
Unten links habe ich die heutige Strategie verbunden, indem ich den Long-Position-Einstiegspunkt von $63,829 verknüpft habe — wo ich am 29. eingestiegen bin (angezeigt durch den violetten Finger) — exakt so, wie er ist.
*Long-Position-Strategie basierend auf dem Bewegungsweg des roten Fingers
1) $64,296.9 Long-Position Einstiegspunkt / Stop Loss, falls die violette Unterstützungslinie gebrochen wird
2) $65,258.5 Long-Position 1. Ziel -> Zielpreise in der Reihenfolge Oben, Gut
Wenn die violette Unterstützungslinie gebrochen wird, könnte der Preis in den unteren Bereich unten abfallen.
Der grüne Unterstützungsbereich „Unten“ ist eine sichere Zone; wenn er gebrochen wird, könnte der Preis auf ein Maximum von Zone 1 fallen.
Bitte nutze meinen Analysebeitrag lediglich als Referenz und für die praktische Anwendung.
Ich poste die Analyseergebnisse jeden Tag als Kommentar.
Vielen Dank.
(Den Link findest du in meinem Profil.)
- Klicke auf „Folgen“, um jeden Tag schnellere Informationen zu erhalten.
- Überprüfe die Ergebnisse mit der Replay-Schaltfläche in TradingView.
#BTC100K #Crypto #Altcoin Season# #USDT #BTC Price Analysis# $ETH $XRP $BTC $GOLD
[30. Juli Bitcoin-Chartanalyse]
BTCUSD 30Min-Chart
*Meine Analyse ist für TradingView optimiert.
Wenn du die Replay-Schaltfläche drückst, kannst du die Echtzeitbewegungen prüfen.
-Long-Position-Strategie-
Unten links habe ich die heutige Strategie verbunden, indem ich den Long-Position-Einstiegspunkt von $63,829 verknüpft habe — wo ich am 29. eingestiegen bin (angezeigt durch den violetten Finger) — exakt so, wie er ist.
*Long-Position-Strategie basierend auf dem Bewegungsweg des roten Fingers
1) $64,296.9 Long-Position Einstiegspunkt / Stop Loss, falls die violette Unterstützungslinie gebrochen wird
2) $65,258.5 Long-Position 1. Ziel -> Zielpreise in der Reihenfolge Oben, Gut
Wenn die violette Unterstützungslinie gebrochen wird, könnte der Preis in den unteren Bereich unten abfallen.
Der grüne Unterstützungsbereich „Unten“ ist eine sichere Zone; wenn er gebrochen wird, könnte der Preis auf ein Maximum von Zone 1 fallen.
Bitte nutze meinen Analysebeitrag lediglich als Referenz und für die praktische Anwendung.
Ich poste die Analyseergebnisse jeden Tag als Kommentar.
Vielen Dank.
(Den Link findest du in meinem Profil.)
- Klicke auf „Folgen“, um jeden Tag schnellere Informationen zu erhalten.
- Überprüfe die Ergebnisse mit der Replay-Schaltfläche in TradingView.
#BTC100K #Crypto #Altcoin Season# #USDT #BTC Price Analysis# $ETH $XRP $BTC $GOLD
BTCUSD 30Min-Chart
*Meine Analyse ist für TradingView optimiert.
Wenn du die Replay-Schaltfläche drückst, kannst du die Echtzeitbewegungen prüfen.
-Long-Position-Strategie-
Unten links habe ich die heutige Strategie verbunden, indem ich den Long-Position-Einstiegspunkt von $63,829 verknüpft habe — wo ich am 29. eingestiegen bin (angezeigt durch den violetten Finger) — exakt so, wie er ist.
*Long-Position-Strategie basierend auf dem Bewegungsweg des roten Fingers
1) $64,296.9 Long-Position Einstiegspunkt / Stop Loss, falls die violette Unterstützungslinie gebrochen wird
2) $65,258.5 Long-Position 1. Ziel -> Zielpreise in der Reihenfolge Oben, Gut
Wenn die violette Unterstützungslinie gebrochen wird, könnte der Preis in den unteren Bereich unten abfallen.
Der grüne Unterstützungsbereich „Unten“ ist eine sichere Zone; wenn er gebrochen wird, könnte der Preis auf ein Maximum von Zone 1 fallen.
Bitte nutze meinen Analysebeitrag lediglich als Referenz und für die praktische Anwendung.
Ich poste die Analyseergebnisse jeden Tag als Kommentar.
Vielen Dank.
(Den Link findest du in meinem Profil.)
- Klicke auf „Folgen“, um jeden Tag schnellere Informationen zu erhalten.
- Überprüfe die Ergebnisse mit der Replay-Schaltfläche in TradingView.
#BTC100K #Crypto #Altcoin Season# #USDT #BTC Price Analysis# $ETH $XRP $BTC $GOLD
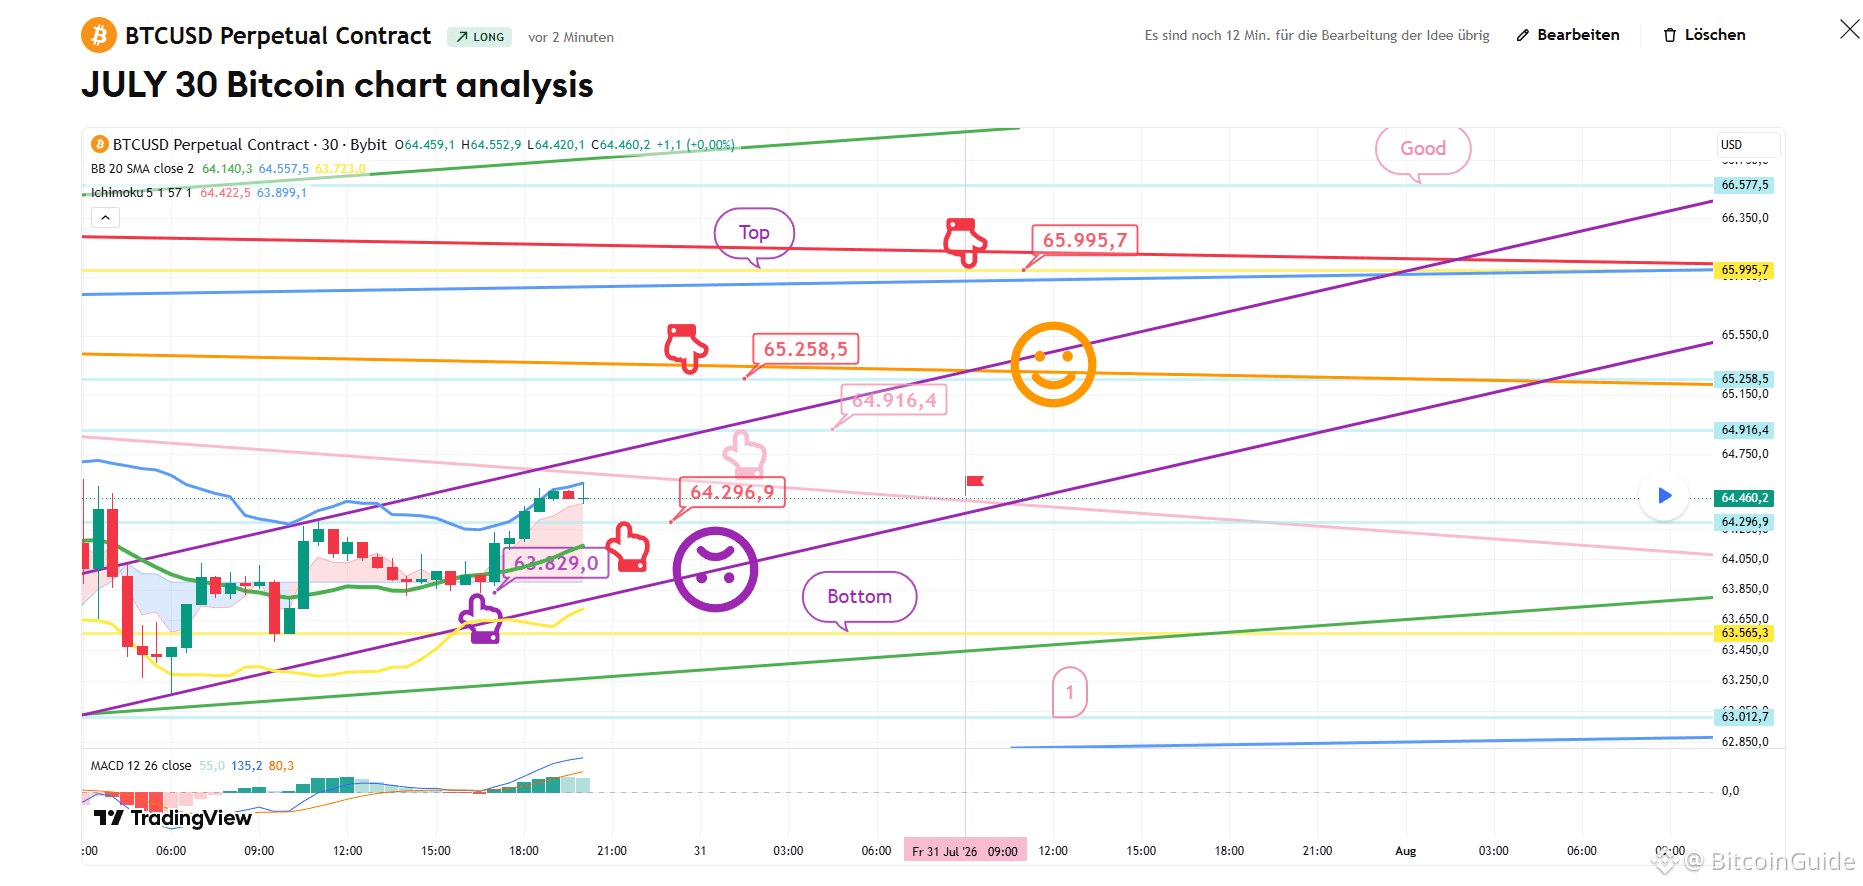
75
·
--
[29. Juli Bitcoin-Chartanalyse]
BTCUSD 30Min Chart
*Meine Analyse ist für TradingView optimiert.
Wenn du die Wiedergabe-Taste drückst, kannst du Echtzeit-Bewegungen prüfen.
-Long-Position-Strategie-
Dies ist der Bitcoin-30-Minuten-Chart.
Die US-FOMC-Indikatoren werden kurz nach 15:00 Uhr veröffentlicht.
Der Nasdaq hat eine wichtige Support-Linie erreicht.
*Long-Position-Strategie basierend auf dem Bewegungsweg des roten Fingers
1) Einstieg für eine Long-Position bei $63,829 / Stop-Loss, falls die grüne Support-Linie durchbrochen wird.
2) 1. Ziel für eine Long-Position bei $65,120.5 -> 2. Ziel im oberen Bereich bei $65,995.7.
Wenn die grüne Support-Linie durchbrochen wird,
könnte es nach unten gehen -> bis Zone 1 maximal.
Zone 1 ist der wichtigste Rebound-Bereich von heute.
Betrachtet man die Bewegung des Nasdaq anhand kurzfristiger Muster,
wird ein seitwärtsgerichteter Markt mit nach oben geneigter Tendenz erwartet,
und wenn er unter das vorherige Tief fällt, könnte das zu einem mittel- bis langfristigen Rückgang führen.
Ich poste die Analyseergebnisse jeden Tag als Kommentar.
Vielen Dank.
(Du findest den Link in meinem Profil.)
- Klicke auf „Folgen“, um täglich schnellere Informationen zu erhalten.
- Prüfe die Ergebnisse mit der Wiedergabe-Taste in TradingView.
#Bitcoin #BTC100K #Crypto #Altcoin Season# #BTC Price Analysis# $USDT $ALT $BTC $GOLD
[29. Juli Bitcoin-Chartanalyse]
BTCUSD 30Min Chart
*Meine Analyse ist für TradingView optimiert.
Wenn du die Wiedergabe-Taste drückst, kannst du Echtzeit-Bewegungen prüfen.
-Long-Position-Strategie-
Dies ist der Bitcoin-30-Minuten-Chart.
Die US-FOMC-Indikatoren werden kurz nach 15:00 Uhr veröffentlicht.
Der Nasdaq hat eine wichtige Support-Linie erreicht.
*Long-Position-Strategie basierend auf dem Bewegungsweg des roten Fingers
1) Einstieg für eine Long-Position bei $63,829 / Stop-Loss, falls die grüne Support-Linie durchbrochen wird.
2) 1. Ziel für eine Long-Position bei $65,120.5 -> 2. Ziel im oberen Bereich bei $65,995.7.
Wenn die grüne Support-Linie durchbrochen wird,
könnte es nach unten gehen -> bis Zone 1 maximal.
Zone 1 ist der wichtigste Rebound-Bereich von heute.
Betrachtet man die Bewegung des Nasdaq anhand kurzfristiger Muster,
wird ein seitwärtsgerichteter Markt mit nach oben geneigter Tendenz erwartet,
und wenn er unter das vorherige Tief fällt, könnte das zu einem mittel- bis langfristigen Rückgang führen.
Ich poste die Analyseergebnisse jeden Tag als Kommentar.
Vielen Dank.
(Du findest den Link in meinem Profil.)
- Klicke auf „Folgen“, um täglich schnellere Informationen zu erhalten.
- Prüfe die Ergebnisse mit der Wiedergabe-Taste in TradingView.
#Bitcoin #BTC100K #Crypto #Altcoin Season# #BTC Price Analysis# $USDT $ALT $BTC $GOLD
BTCUSD 30Min Chart
*Meine Analyse ist für TradingView optimiert.
Wenn du die Wiedergabe-Taste drückst, kannst du Echtzeit-Bewegungen prüfen.
-Long-Position-Strategie-
Dies ist der Bitcoin-30-Minuten-Chart.
Die US-FOMC-Indikatoren werden kurz nach 15:00 Uhr veröffentlicht.
Der Nasdaq hat eine wichtige Support-Linie erreicht.
*Long-Position-Strategie basierend auf dem Bewegungsweg des roten Fingers
1) Einstieg für eine Long-Position bei $63,829 / Stop-Loss, falls die grüne Support-Linie durchbrochen wird.
2) 1. Ziel für eine Long-Position bei $65,120.5 -> 2. Ziel im oberen Bereich bei $65,995.7.
Wenn die grüne Support-Linie durchbrochen wird,
könnte es nach unten gehen -> bis Zone 1 maximal.
Zone 1 ist der wichtigste Rebound-Bereich von heute.
Betrachtet man die Bewegung des Nasdaq anhand kurzfristiger Muster,
wird ein seitwärtsgerichteter Markt mit nach oben geneigter Tendenz erwartet,
und wenn er unter das vorherige Tief fällt, könnte das zu einem mittel- bis langfristigen Rückgang führen.
Ich poste die Analyseergebnisse jeden Tag als Kommentar.
Vielen Dank.
(Du findest den Link in meinem Profil.)
- Klicke auf „Folgen“, um täglich schnellere Informationen zu erhalten.
- Prüfe die Ergebnisse mit der Wiedergabe-Taste in TradingView.
#Bitcoin #BTC100K #Crypto #Altcoin Season# #BTC Price Analysis# $USDT $ALT $BTC $GOLD
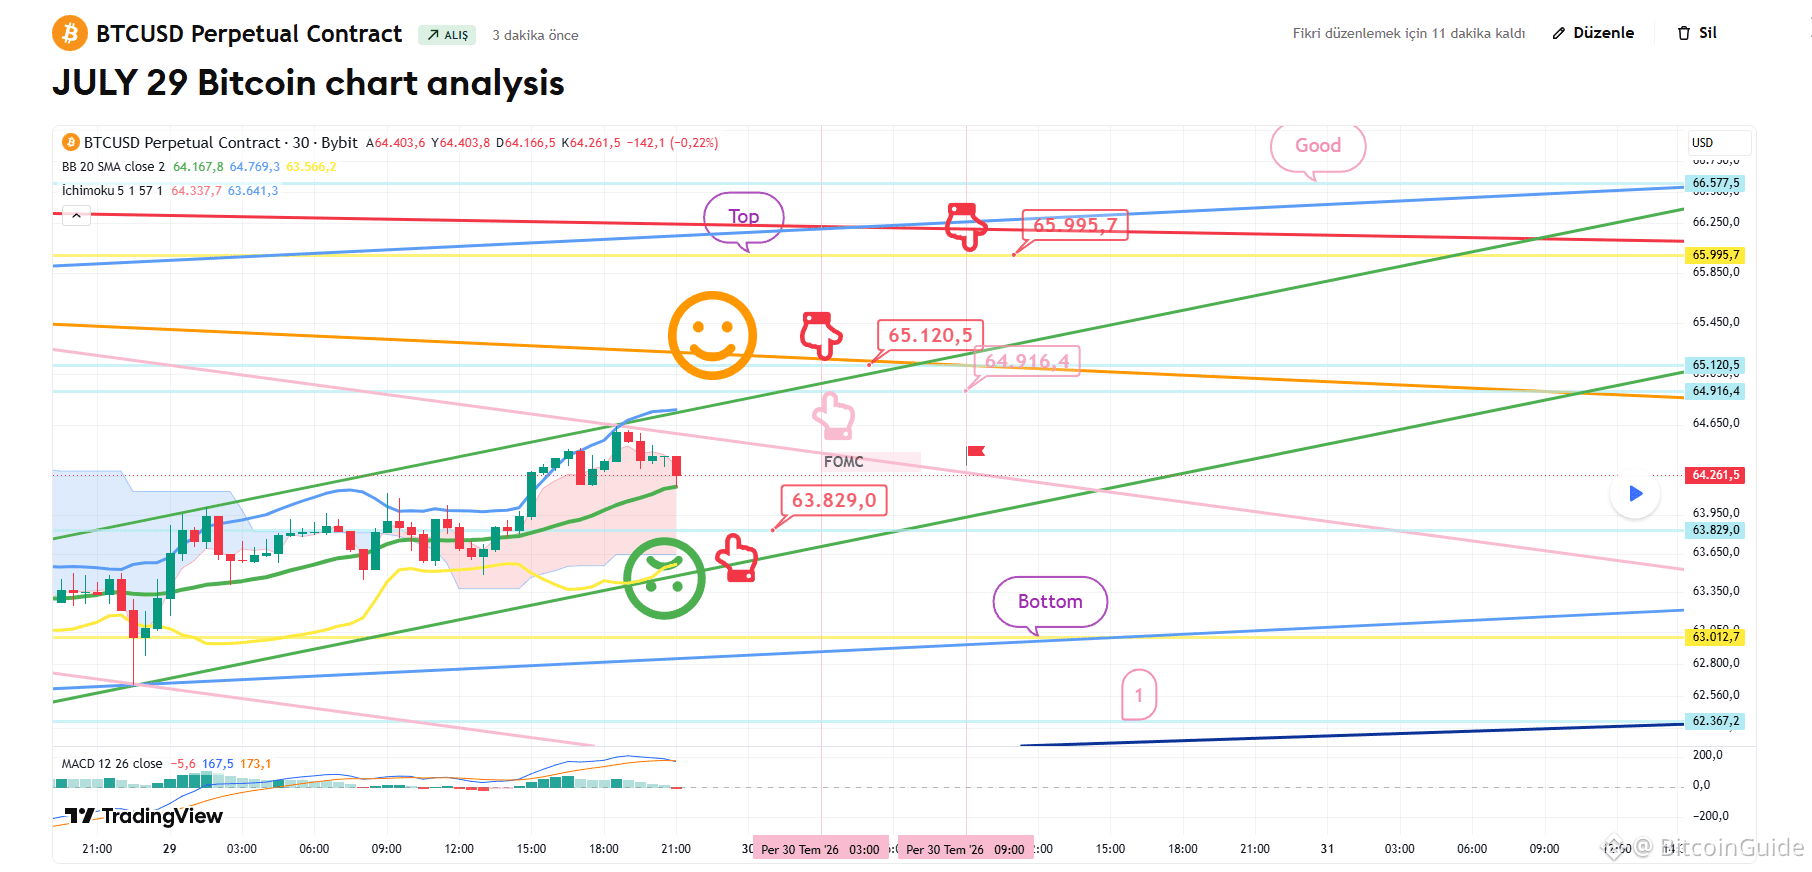

53
Anmelden und weiter Inhalte entdecken
Krypto-Nutzer weltweit auf Binance Square kennenlernen
⚡️ Bleib in Sachen Krypto stets am Puls.
💬 Die weltgrößte Kryptobörse vertraut darauf.
👍 Erhalte verlässliche Einblicke von verifizierten Creators.
E-Mail-Adresse/Telefonnummer
Trendthemen
CryptoLiquidations$674MIn24H
1,408 Aufrufe
31 Kommentare
#CryptoLiquidations$674MIn24H
Die Liquidationswelle im Wert von 674 Millionen US-Dollar bei Krypto traf beide Seiten des Handels.
Ein Bericht vom 12. September von ChainCatcher unter Berufung auf CoinGlass bezifferte Liquidationen auf ungefähr 674 Millionen US-Dollar in den vorangegangenen 24 Stunden:
Short-Positionen: rund 381 Millionen US-Dollar.
Long-Positionen: rund 292 Millionen US-Dollar.
Ethereum-Shorts machten etwa 215 Millionen US-Dollar aus und waren damit ein bedeutender Teil dieses Snapshots.
Short-Liquidationen können zusätzlichen Kaufdruck erzeugen, da bärische Positionen zwangsweise geschlossen werden. Long-Liquidationen können zusätzlichen Verkaufsdruck erzeugen. Diese Mechanismen können Kursbewegungen in beide Richtungen verstärken.
Mein Eindruck: Der nächste Schritt braucht Bestätigung durch die Spot-Nachfrage.
Angesichts substantieller Liquidationen auf beiden Seiten wäre ich vorsichtig, einen plötzlichen Kursanstieg als Beleg dafür zu werten, dass Käufer die Kontrolle übernommen haben.
Wichtig ist für mich, ob Käufer den Markt weiter stützen, nachdem das erzwungene Short-Covering langsamer wird. Eine Erholung, die ihre Gewinne hält, anhaltende Spot-Aktivität anzieht und einen aggressiven Wiederaufbau von Leverage vermeidet, würde mein Vertrauen stärken.
Wenn das Open Interest schnell steigt, während der Kurs Schwierigkeiten hat, weiter voranzukommen, würde ich vorsichtiger werden bei einer erneuten Trendwende.
Die Liquidationszahl zeigt uns, wie viel Positionierung in diesem Zeitraum zwangsweise geschlossen wurde. Um das verbleibende Risiko einzuschätzen, muss man auch die aktuelle Positionierung betrachten.
Worauf schaust du jetzt am genauesten: Spot-Käufe, Funding Rates oder Open Interest?
#CryptoLiquidations #bitcoin #Ethereum #CryptoMarket
$LSK $VTHO $ETHFI
溪月 Xīyuè
·2 Likes
·225 Aufrufe
TokenizedStockHoldersUp619.1%
0 Aufrufe
0 Kommentare
RevolutConfirmsFakeGovEmailDataBreach
9,425 Aufrufe
297 Kommentare