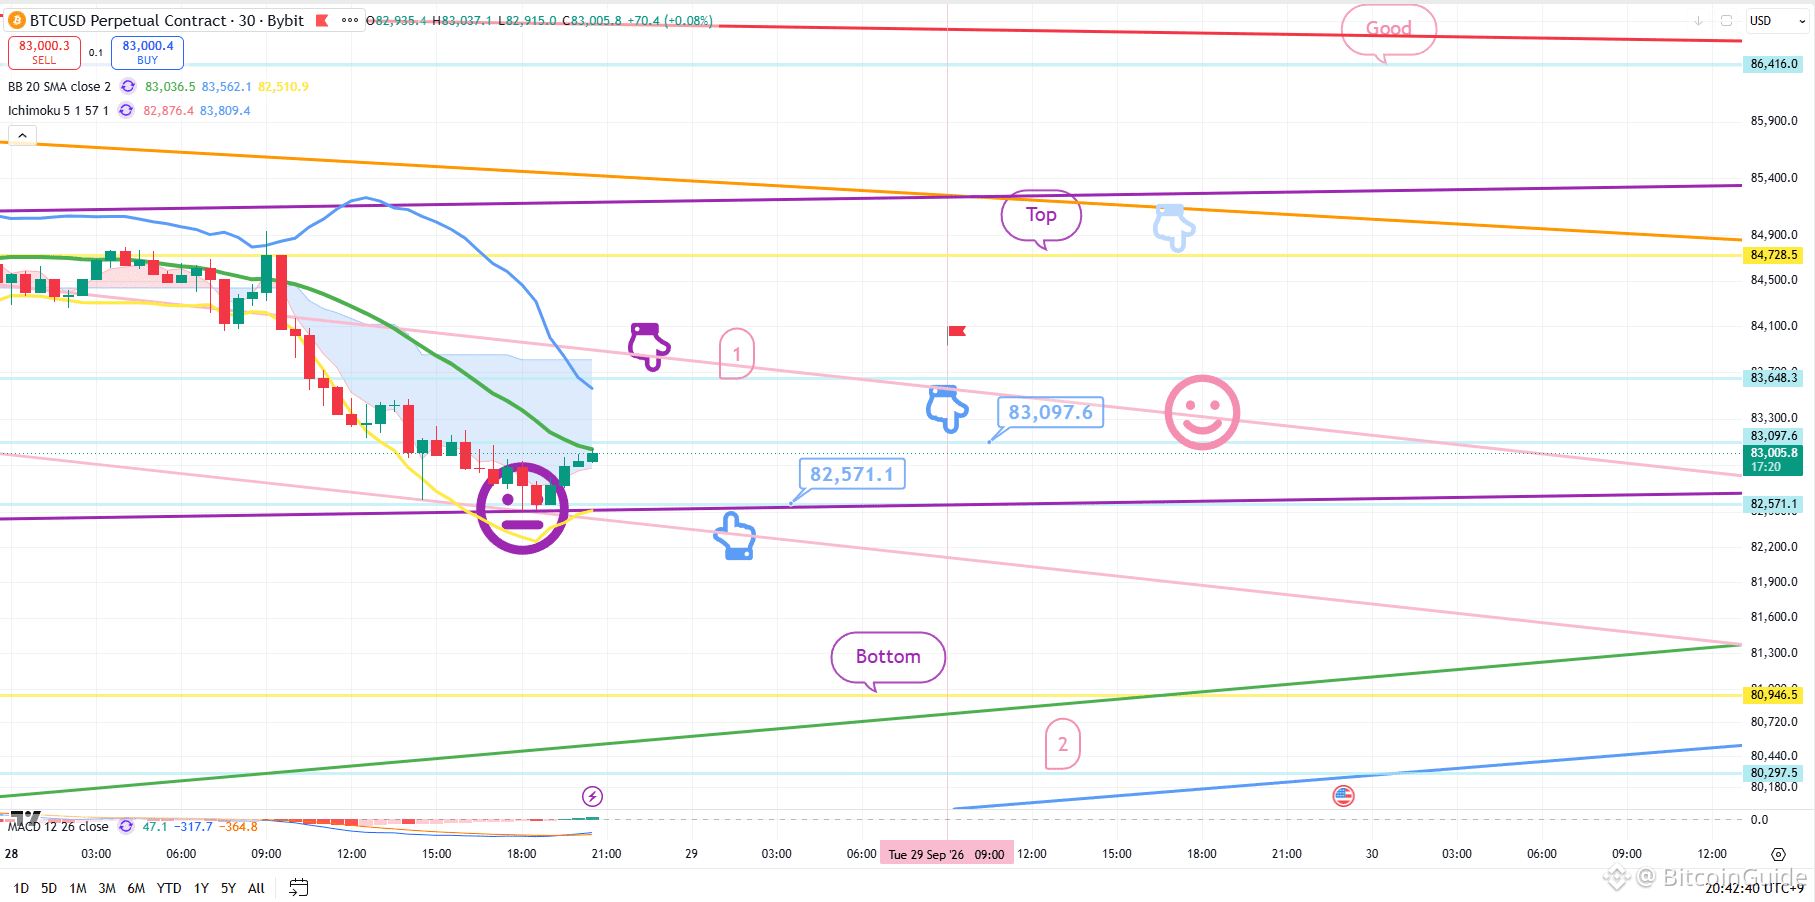
[September 28 Bitcoin chart analysis]
BTCUSD 30Min Chart
*My analysis is optimized for TradingView.
If you press the replay button, you can check real-time movements.
-Neutral two-way strategy-
Currently, the Nasdaq is showing a MACD "death cross" on the 12-hour chart,
while Bitcoin is undergoing a MACD death cross on the daily chart.
Given that we are at a point where a correction is highly likely,
I have prepared a neutral, two-way strategy.
*Strategy involving a switch from short to long, or waiting for a long position,
based on touching the "purple finger" zone (Zone 1) at the top:
1) Upon touching the "purple finger" zone (Zone 1) at the top:
Entry point for a short position; stop-loss if the pink resistance line is broken.
2) Switch to a long position at the "sky-blue finger" level ($82,571.1) at the bottom;
stop-loss if the purple support line is breached.
-> Final target price set for the "Top" zone from tomorrow onwards.
- If the price breaks below the purple support line immediately:
The final long position entry point is at "Zone 2" (the very bottom).
If the price touches the "Bottom" zone and closes there:
Further downward movement could follow from tomorrow onwards.
I post the analysis results as a Comment every day.
Thank you.
(You can find the link on my profile.)
- Click Follow to receive faster information every day.
- Check the results using the replay button on TradingView.
#BTC Price Analysis# #Crypto #Altcoin Season# #Gold #ETH $USDC $TRX $XRP $BTC
BTCUSD 30Min Chart
*My analysis is optimized for TradingView.
If you press the replay button, you can check real-time movements.
-Neutral two-way strategy-
Currently, the Nasdaq is showing a MACD "death cross" on the 12-hour chart,
while Bitcoin is undergoing a MACD death cross on the daily chart.
Given that we are at a point where a correction is highly likely,
I have prepared a neutral, two-way strategy.
*Strategy involving a switch from short to long, or waiting for a long position,
based on touching the "purple finger" zone (Zone 1) at the top:
1) Upon touching the "purple finger" zone (Zone 1) at the top:
Entry point for a short position; stop-loss if the pink resistance line is broken.
2) Switch to a long position at the "sky-blue finger" level ($82,571.1) at the bottom;
stop-loss if the purple support line is breached.
-> Final target price set for the "Top" zone from tomorrow onwards.
- If the price breaks below the purple support line immediately:
The final long position entry point is at "Zone 2" (the very bottom).
If the price touches the "Bottom" zone and closes there:
Further downward movement could follow from tomorrow onwards.
I post the analysis results as a Comment every day.
Thank you.
(You can find the link on my profile.)
- Click Follow to receive faster information every day.
- Check the results using the replay button on TradingView.
#BTC Price Analysis# #Crypto #Altcoin Season# #Gold #ETH $USDC $TRX $XRP $BTC