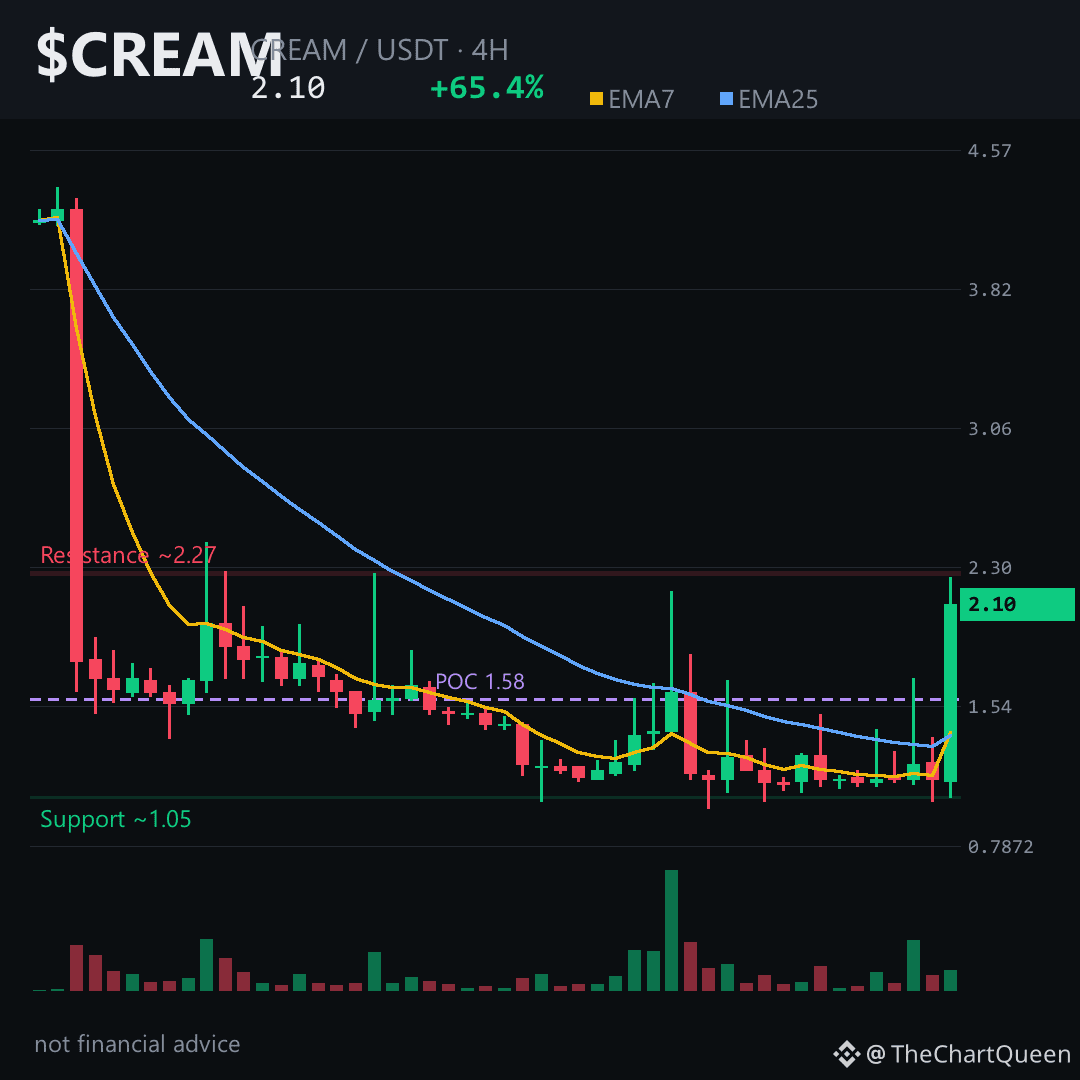
This thing printed an 84% candle in six hours — that’s not momentum, that’s a statement. The real question is whether the structure behind it can hold.
The 4H chart is leaning bullish, but the daily and weekly are still bearish. Short-term buyers are fighting gravity, and gravity has a lot of levels stacked above.
Price is hovering around 2.09, with short-term EMAs bending upward and RSI just below overbought. The support zone that matters sits near 1.98. If that holds, there’s a visible path toward 2.28.
But the daily chart shows an unfilled bearish gap from roughly 3.63 down to 2.44 — a heavy ceiling directly above. The weekly is even colder: the 7-period average near 4.10 is still miles below the 25-period near 12.03. This is a bounce inside a larger downtrend, not a confirmed reversal.
Futures are a ghost town — zero funding, zero open interest. This is spot-driven, real but thin. Thin markets move fast both ways.
If $CREAM can hold ~1.98 on a 4H close, 2.28 becomes a reasonable target. Lose that support and the short-term bullish case unravels quickly. Tap $CREAM and look at that 4H candle cluster — the wicks tell the story.
My read: high-risk bounce inside a bearish structure. Overhead supply is brutal. I’m watching 1.98 closer than anything else.
Follow me for the updated read if this zone gets tested.
Are you trusting the breakout or fading it back into the daily gap? 👇
⚠️ Not financial advice. DYOR.
#CREAM #DeFi #Crypto #BinanceSquare
The 4H chart is leaning bullish, but the daily and weekly are still bearish. Short-term buyers are fighting gravity, and gravity has a lot of levels stacked above.
Price is hovering around 2.09, with short-term EMAs bending upward and RSI just below overbought. The support zone that matters sits near 1.98. If that holds, there’s a visible path toward 2.28.
But the daily chart shows an unfilled bearish gap from roughly 3.63 down to 2.44 — a heavy ceiling directly above. The weekly is even colder: the 7-period average near 4.10 is still miles below the 25-period near 12.03. This is a bounce inside a larger downtrend, not a confirmed reversal.
Futures are a ghost town — zero funding, zero open interest. This is spot-driven, real but thin. Thin markets move fast both ways.
If $CREAM can hold ~1.98 on a 4H close, 2.28 becomes a reasonable target. Lose that support and the short-term bullish case unravels quickly. Tap $CREAM and look at that 4H candle cluster — the wicks tell the story.
My read: high-risk bounce inside a bearish structure. Overhead supply is brutal. I’m watching 1.98 closer than anything else.
Follow me for the updated read if this zone gets tested.
Are you trusting the breakout or fading it back into the daily gap? 👇
⚠️ Not financial advice. DYOR.
#CREAM #DeFi #Crypto #BinanceSquare