Tape Reading on $CHIP: Interpreting Asymmetric Volume
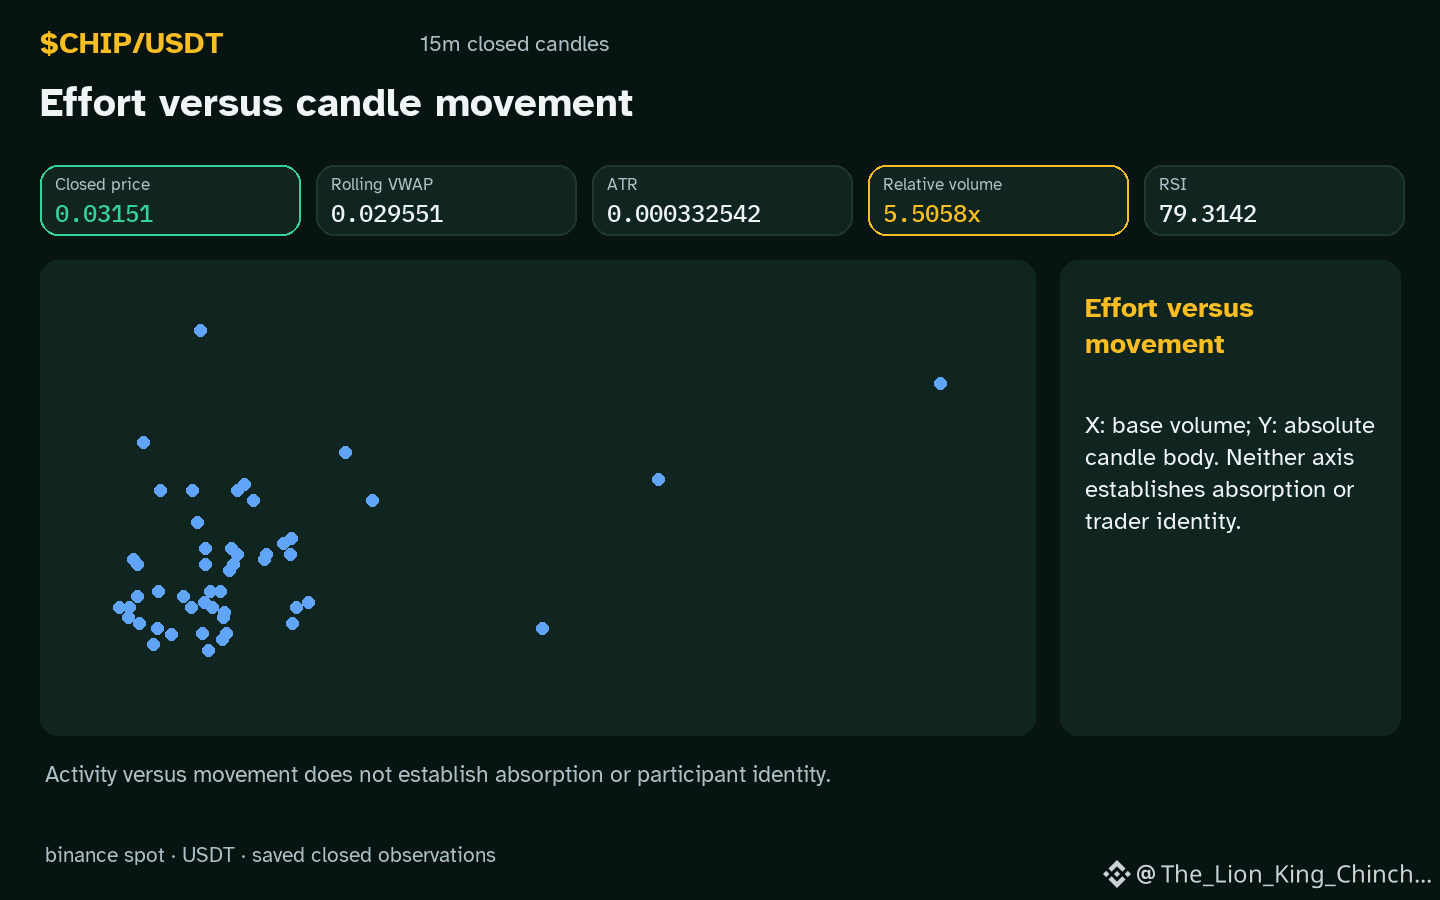
Why does $CHIP show an up direction while volume sits above baseline? The observation notes price above resistance, an hourly up move, and volume higher than the recent norm. One way to read this pattern is to view the stronger volume on up‑bars as a clue that buying pressure is outpacing selling within the last twenty candles. If the up‑bars consistently carry a relative volume of 5.51x, the tape may suggest a short‑term bias toward higher prices.
An alternative reading treats the same data as a temporary imbalance that could reverse once the market absorbs the excess demand. The elevated volume might simply reflect a single news spike rather than a sustained shift, and the price remaining only marginally above resistance provides little cushion against a pullback.
Each interpretation has a weakening condition. The bullish clue loses force if a subsequent closed candle shows a down‑bar with volume equal to or greater than the prior up‑bars, indicating that sellers can match the earlier buying intensity. Conversely, the reversal hypothesis weakens if the next several candles stay above resistance while maintaining the higher relative volume, reinforcing the initial bias.
A practical reassessment step is to watch the next five hourly candles: if any down‑bar exceeds the relative volume of the prior up‑bars, the bullish reading should be reconsidered; if the up‑bars persist with similar volume, the asymmetric‑volume clue gains credibility.
Probabilistic market research, not a recommendation or guaranteed return.
#CHIP #MarketAnalysis #CryptoLearning
Why does $CHIP show an up direction while volume sits above baseline? The observation notes price above resistance, an hourly up move, and volume higher than the recent norm. One way to read this pattern is to view the stronger volume on up‑bars as a clue that buying pressure is outpacing selling within the last twenty candles. If the up‑bars consistently carry a relative volume of 5.51x, the tape may suggest a short‑term bias toward higher prices.
An alternative reading treats the same data as a temporary imbalance that could reverse once the market absorbs the excess demand. The elevated volume might simply reflect a single news spike rather than a sustained shift, and the price remaining only marginally above resistance provides little cushion against a pullback.
Each interpretation has a weakening condition. The bullish clue loses force if a subsequent closed candle shows a down‑bar with volume equal to or greater than the prior up‑bars, indicating that sellers can match the earlier buying intensity. Conversely, the reversal hypothesis weakens if the next several candles stay above resistance while maintaining the higher relative volume, reinforcing the initial bias.
A practical reassessment step is to watch the next five hourly candles: if any down‑bar exceeds the relative volume of the prior up‑bars, the bullish reading should be reconsidered; if the up‑bars persist with similar volume, the asymmetric‑volume clue gains credibility.
Probabilistic market research, not a recommendation or guaranteed return.
#CHIP #MarketAnalysis #CryptoLearning