$BTC 1H Chart Update: Holding Steady After the Dip! 🚀
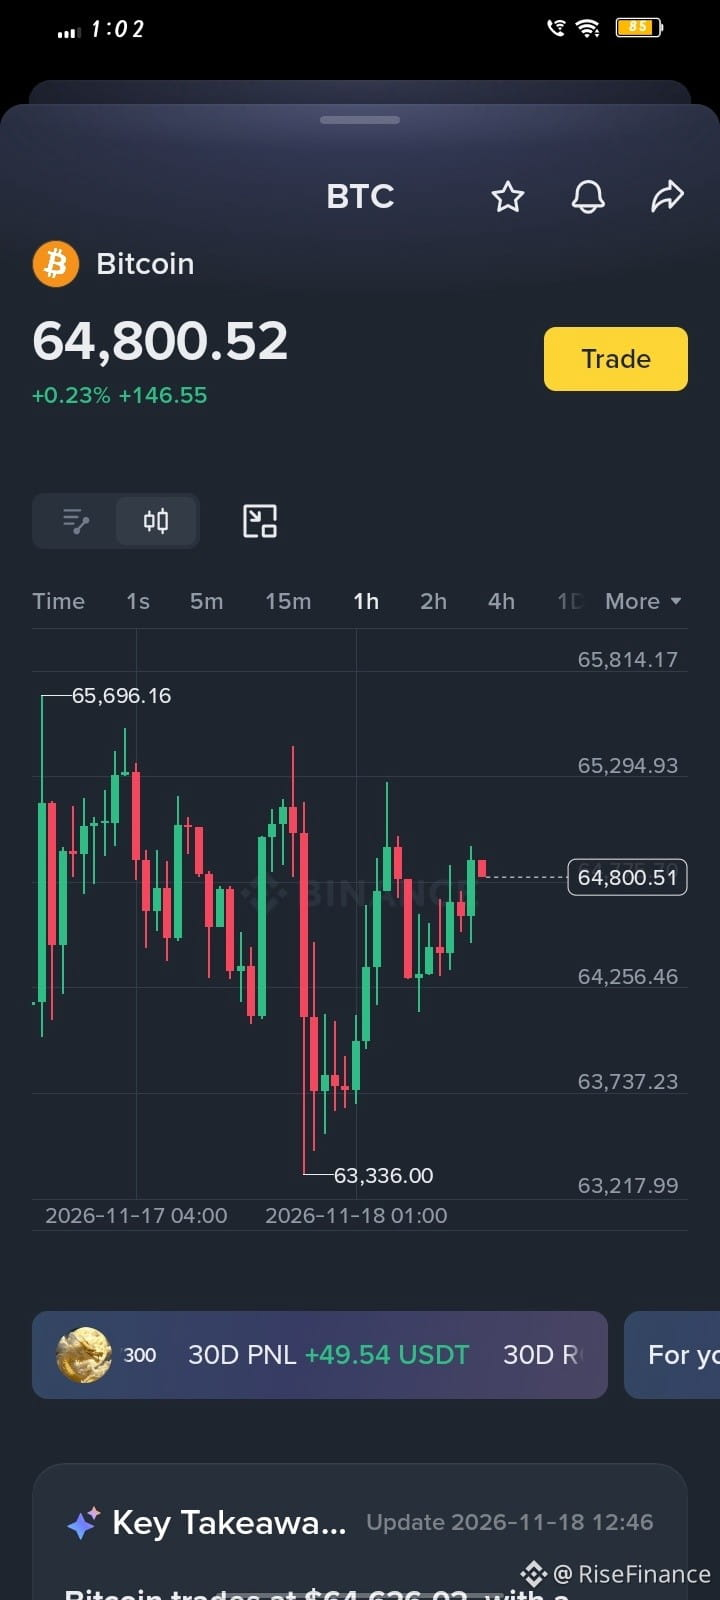
Looking at the 1-hour chart right now, Bitcoin is trading around $64,800 (+0.23%). After facing a sharp rejection near $65,696 and dipping down to test the $63,336 support zone, buyers stepped right back in to push the price up.
Right now, BTC is consolidating in the middle of this range. If we can break and hold above $65,300, we might see another push toward the recent high. On the flip side, losing $64,250 could bring the $63,300 support back into play. Watching volume closely before making my next move!
What’s your game plan for BTC today—are you expecting a breakout above $65.7K or another retest of the $63.3K support? Drop your thoughts below! 👇
Disclaimer: This post reflects my personal market observations and is for informational purposes only, not financial advice. Always do your own research (DYOR) and manage your risk before trading.
#CanNvidia’sDataCenterGrowthContinue? #LedgerHardwareImplantReportsExtendToDubai #NvidiaBoardNotConsideringHuang’sReturnasCEO #KOSPIFalls2.59%ToLowestCloseSinceFebruary #AnthropicClearedToListOnNasdaqAsANT
Looking at the 1-hour chart right now, Bitcoin is trading around $64,800 (+0.23%). After facing a sharp rejection near $65,696 and dipping down to test the $63,336 support zone, buyers stepped right back in to push the price up.
Right now, BTC is consolidating in the middle of this range. If we can break and hold above $65,300, we might see another push toward the recent high. On the flip side, losing $64,250 could bring the $63,300 support back into play. Watching volume closely before making my next move!
What’s your game plan for BTC today—are you expecting a breakout above $65.7K or another retest of the $63.3K support? Drop your thoughts below! 👇
Disclaimer: This post reflects my personal market observations and is for informational purposes only, not financial advice. Always do your own research (DYOR) and manage your risk before trading.
#CanNvidia’sDataCenterGrowthContinue? #LedgerHardwareImplantReportsExtendToDubai #NvidiaBoardNotConsideringHuang’sReturnasCEO #KOSPIFalls2.59%ToLowestCloseSinceFebruary #AnthropicClearedToListOnNasdaqAsANT