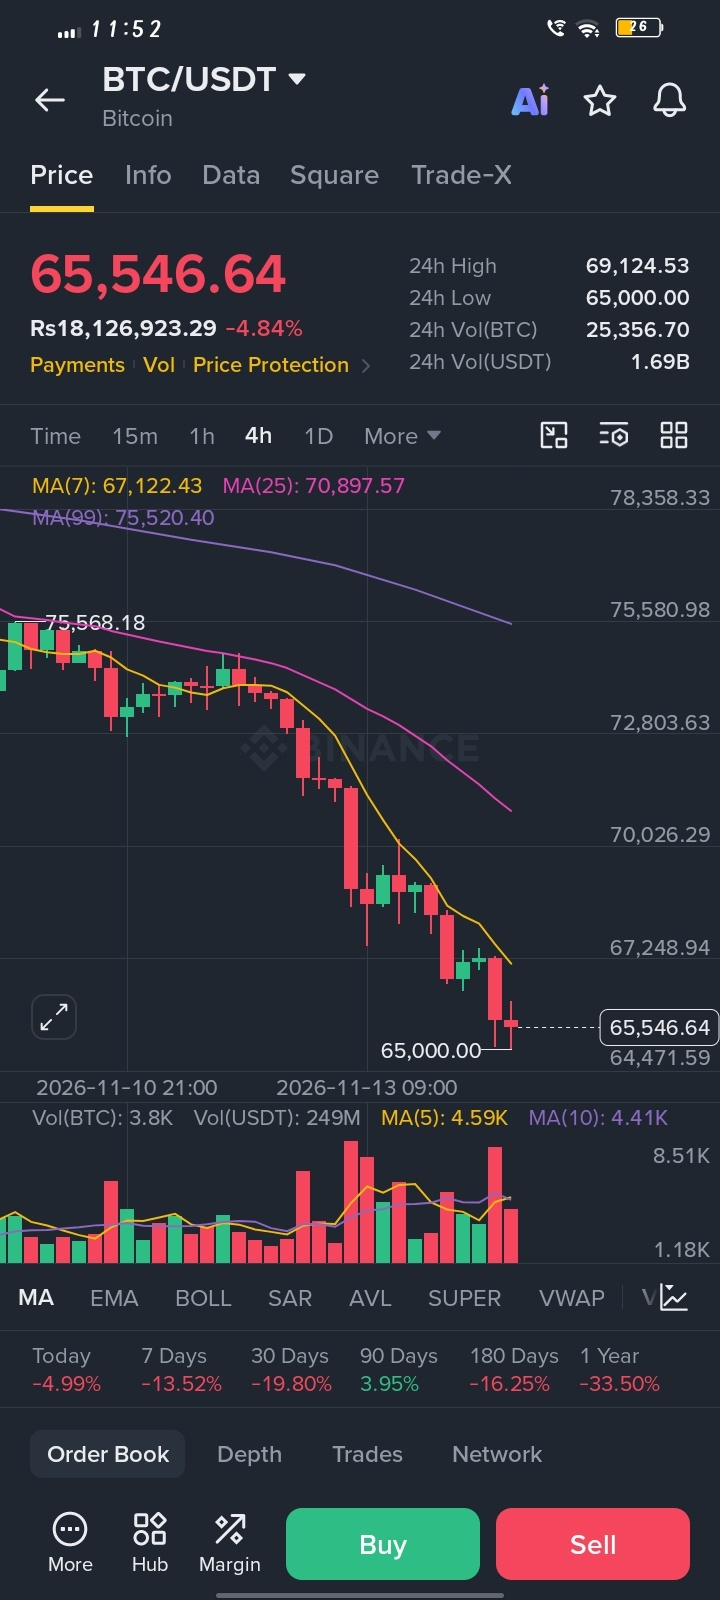
$BTC / USDT (4H) Technical Analysis
Chart Breakdown
• Bitcoin is trading in a strong downtrend after dropping sharply from the 75,568.18 swing high.
• Current price sits at 65,546.64, trading well below the MA(7) at 67,122.43 and MA(25) at 70,897.57.
• Buyers stepped in right at the 65,000.00 psychological support level to spark a minor bounce.
Key Levels & Setup
• 🟢 Support: 65,000.00
• 🔴 Resistance: 67,122.43 / 70,897.57
• 🎯 Entry Zone: 65,000.00 – 65,550.00
• ✅ Take Profit: 67,100.00 / 69,100.00
• 🛑 Stop-Loss: 64,450.00
Engagement Question
Will the 65,000 support hold for a relief bounce, or are we heading lower?
DYOR – Educational analysis only.
#WhoWillSucceedJensenHuangatNvidia? #WhatWillDriveCryptoandStocks’NextRebound? #BitcoinActiveSupplyInProfitDropsBelow45% #KavaSaysAbnormalActivityLimitedToKavaLend #USSpotXRPETFsSeeLargestWeeklyOutflowIn8Months
Chart Breakdown
• Bitcoin is trading in a strong downtrend after dropping sharply from the 75,568.18 swing high.
• Current price sits at 65,546.64, trading well below the MA(7) at 67,122.43 and MA(25) at 70,897.57.
• Buyers stepped in right at the 65,000.00 psychological support level to spark a minor bounce.
Key Levels & Setup
• 🟢 Support: 65,000.00
• 🔴 Resistance: 67,122.43 / 70,897.57
• 🎯 Entry Zone: 65,000.00 – 65,550.00
• ✅ Take Profit: 67,100.00 / 69,100.00
• 🛑 Stop-Loss: 64,450.00
Engagement Question
Will the 65,000 support hold for a relief bounce, or are we heading lower?
DYOR – Educational analysis only.
#WhoWillSucceedJensenHuangatNvidia? #WhatWillDriveCryptoandStocks’NextRebound? #BitcoinActiveSupplyInProfitDropsBelow45% #KavaSaysAbnormalActivityLimitedToKavaLend #USSpotXRPETFsSeeLargestWeeklyOutflowIn8Months