Ethereum slipped below $2,000 and is now testing a critical demand zone.
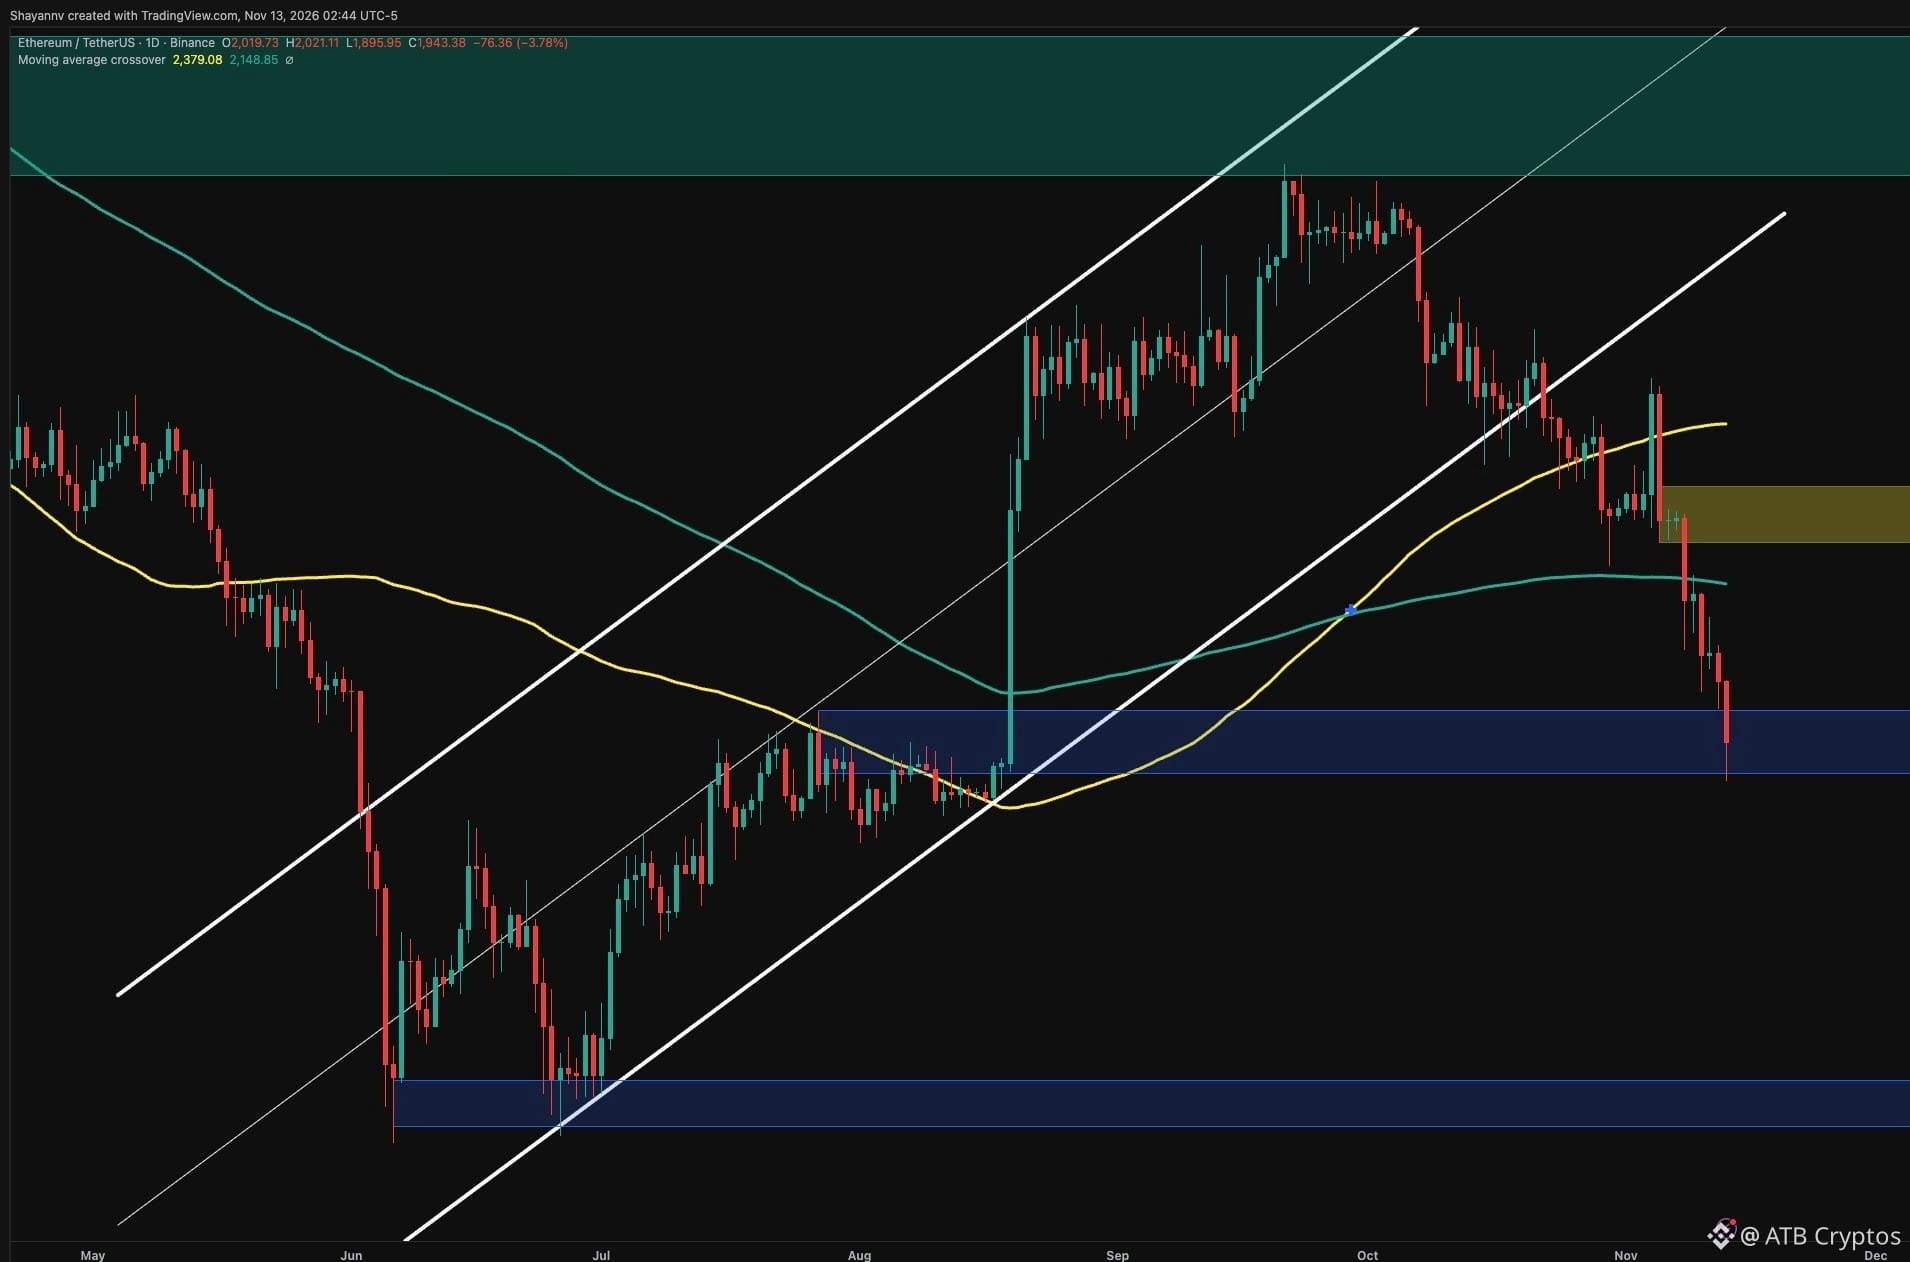
The daily chart shows ETH at $1.94K with an intraday wick under $1.90K, confronting the $1.90K–$1.98K demand zone that overlapped the pre‑August consolidation. The candle remains open and a confirmed reversal has not appeared.
Price is trading below the $2.15K and $2.38K moving averages, which now act as potential recovery hurdles. A daily close under $1.90K would weaken the zone and expose August lows at $1.83K–$1.87K, while deeper support sits at $1.52K–$1.57K. Defending demand and reclaiming $2K could start a bounce toward the $2.20K–$2.29K supply band.
Binance liquidation heatmap highlights concentration around $1.80K–$1.86K below the current price, signaling downside risk if the demand zone fails. Upper liquidation bands sit at $1.94K–$1.98K and $2.10K–$2.20K, which could be tapped if ETH sustains a move above $2K.
Do you think ETH can hold the $1.90K demand zone, or is a deeper correction inevitable?
#Ethereum #Crypto #Blockchain #MarketAnalysis #CryptoTrading
The daily chart shows ETH at $1.94K with an intraday wick under $1.90K, confronting the $1.90K–$1.98K demand zone that overlapped the pre‑August consolidation. The candle remains open and a confirmed reversal has not appeared.
Price is trading below the $2.15K and $2.38K moving averages, which now act as potential recovery hurdles. A daily close under $1.90K would weaken the zone and expose August lows at $1.83K–$1.87K, while deeper support sits at $1.52K–$1.57K. Defending demand and reclaiming $2K could start a bounce toward the $2.20K–$2.29K supply band.
Binance liquidation heatmap highlights concentration around $1.80K–$1.86K below the current price, signaling downside risk if the demand zone fails. Upper liquidation bands sit at $1.94K–$1.98K and $2.10K–$2.20K, which could be tapped if ETH sustains a move above $2K.
Do you think ETH can hold the $1.90K demand zone, or is a deeper correction inevitable?
#Ethereum #Crypto #Blockchain #MarketAnalysis #CryptoTrading