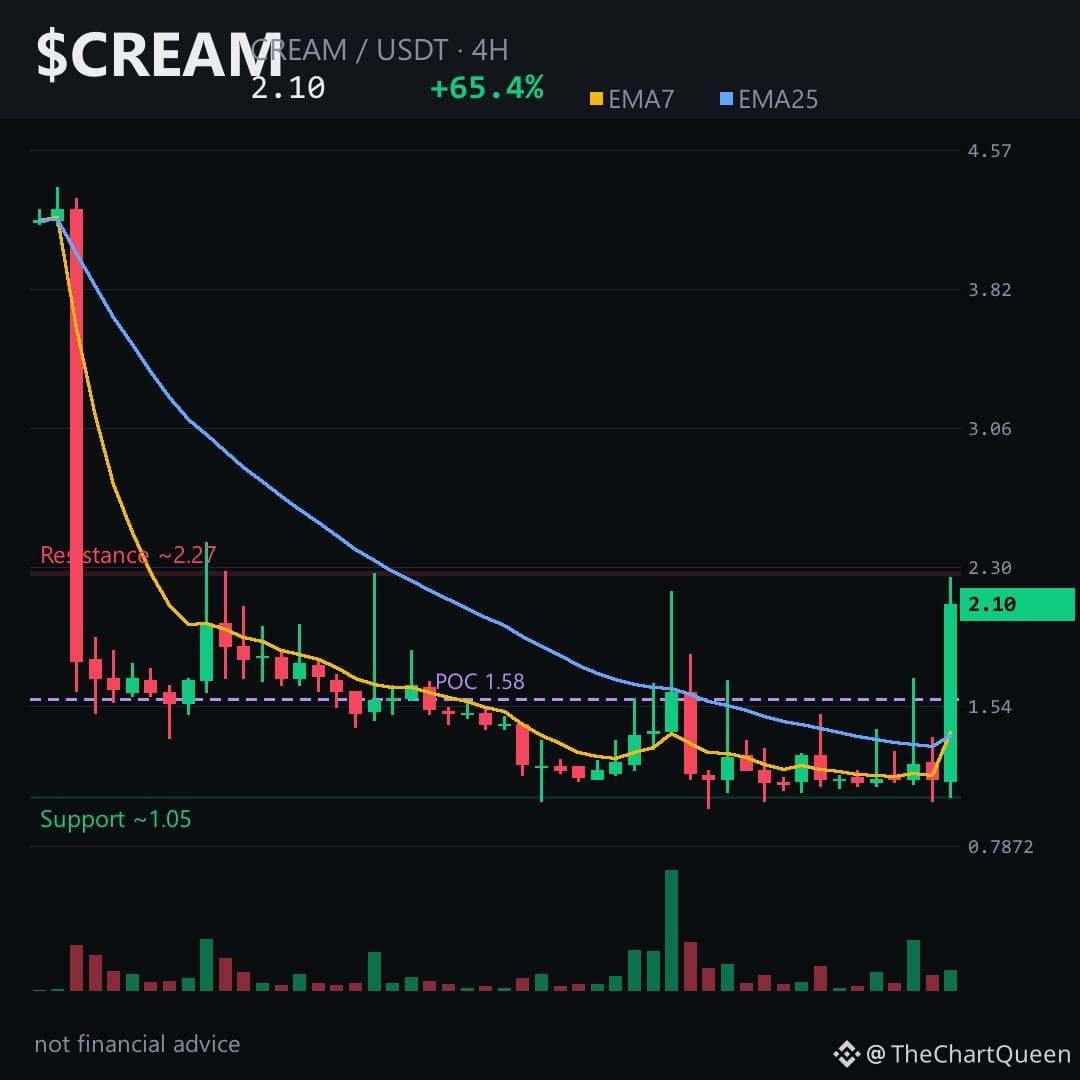
$CREAM just printed a single 4H candle that swallowed the previous 11 candles whole — an 84% range expansion in six hours.
That's not a normal breakout. That's a market waking up after a long sleep.
The 4H is bullish, but the daily and weekly are still bleeding. Momentum vs. gravity — the levels tell you where the rope snaps.
On the 4H, price holds above short-term MAs, RSI in the low 60s — strong, not exhausted. Volume profile's point of control sits near 1.58, well below current price. Thin zone above means fewer trapped sellers, so moves stretch quickly. The ~2.28 area is the natural objective if momentum continues; lose ~1.99 on a 4H close and the bullish read quietly expires.
Zoom out one step.
The daily is bearish. Price trades below both daily averages, and there's an unfilled bearish gap from roughly 2.44 up to 3.63 — an open wound that often acts like a magnet before the trend resumes. The weekly is even colder, with point of control near 3.41.
The short-term pop is real, but it's swimming against a heavier current.
My read: the 4H momentum deserves respect — thin air above 2.10 could let $CREAM drift toward 2.28 before sellers reassert. The real risk isn't the bounce; it's mistaking a violent 4H impulse for a trend change while the daily and weekly still point down. Tap $CREAM to pull up the chart and see how clean that 4H candle looks against the daily void above it.
If this level resolves, I'll post the updated structure as the daily gap comes into play — follow so it lands on your feed.
Which zone are you watching more closely — the 4H objective near 2.28, or the daily gap sitting up toward 2.44? 👇
⚠️ Not financial advice. DYOR.
#CREAM #DeFi #Crypto #BinanceSquare
That's not a normal breakout. That's a market waking up after a long sleep.
The 4H is bullish, but the daily and weekly are still bleeding. Momentum vs. gravity — the levels tell you where the rope snaps.
On the 4H, price holds above short-term MAs, RSI in the low 60s — strong, not exhausted. Volume profile's point of control sits near 1.58, well below current price. Thin zone above means fewer trapped sellers, so moves stretch quickly. The ~2.28 area is the natural objective if momentum continues; lose ~1.99 on a 4H close and the bullish read quietly expires.
Zoom out one step.
The daily is bearish. Price trades below both daily averages, and there's an unfilled bearish gap from roughly 2.44 up to 3.63 — an open wound that often acts like a magnet before the trend resumes. The weekly is even colder, with point of control near 3.41.
The short-term pop is real, but it's swimming against a heavier current.
My read: the 4H momentum deserves respect — thin air above 2.10 could let $CREAM drift toward 2.28 before sellers reassert. The real risk isn't the bounce; it's mistaking a violent 4H impulse for a trend change while the daily and weekly still point down. Tap $CREAM to pull up the chart and see how clean that 4H candle looks against the daily void above it.
If this level resolves, I'll post the updated structure as the daily gap comes into play — follow so it lands on your feed.
Which zone are you watching more closely — the 4H objective near 2.28, or the daily gap sitting up toward 2.44? 👇
⚠️ Not financial advice. DYOR.
#CREAM #DeFi #Crypto #BinanceSquare