
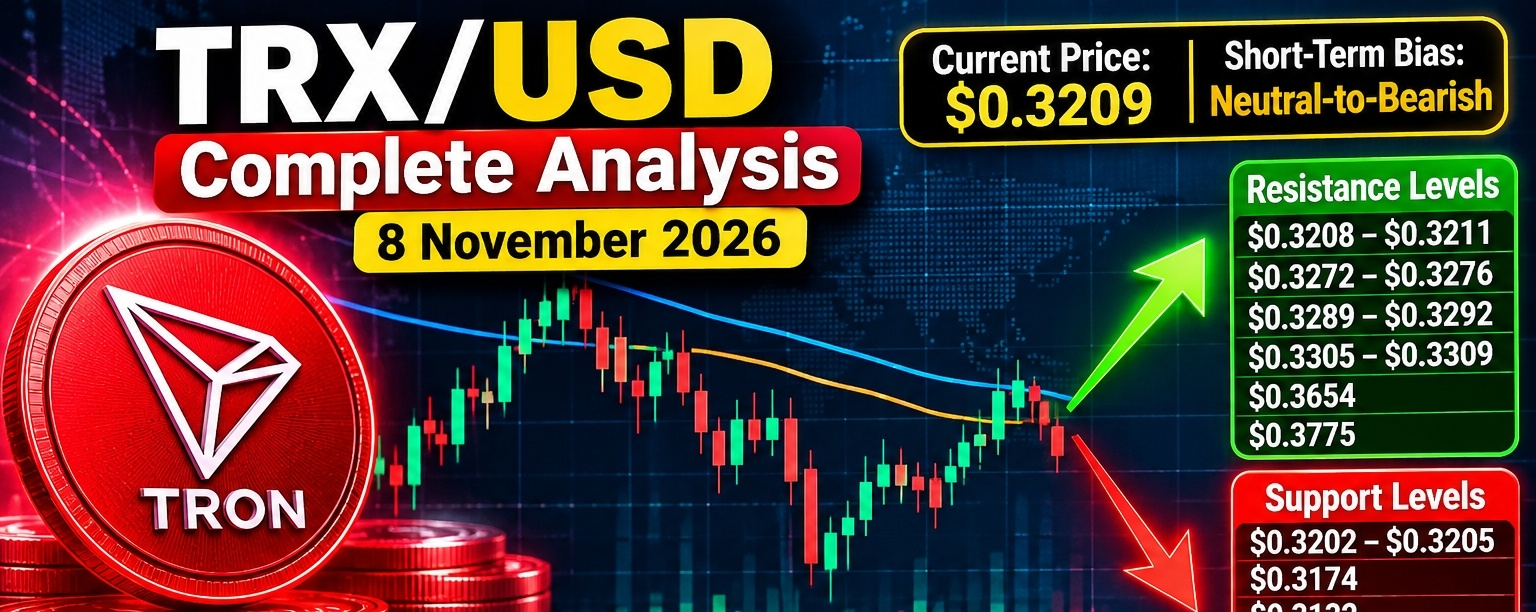

$TRX /USD Complete Analysis — 8 November 2026
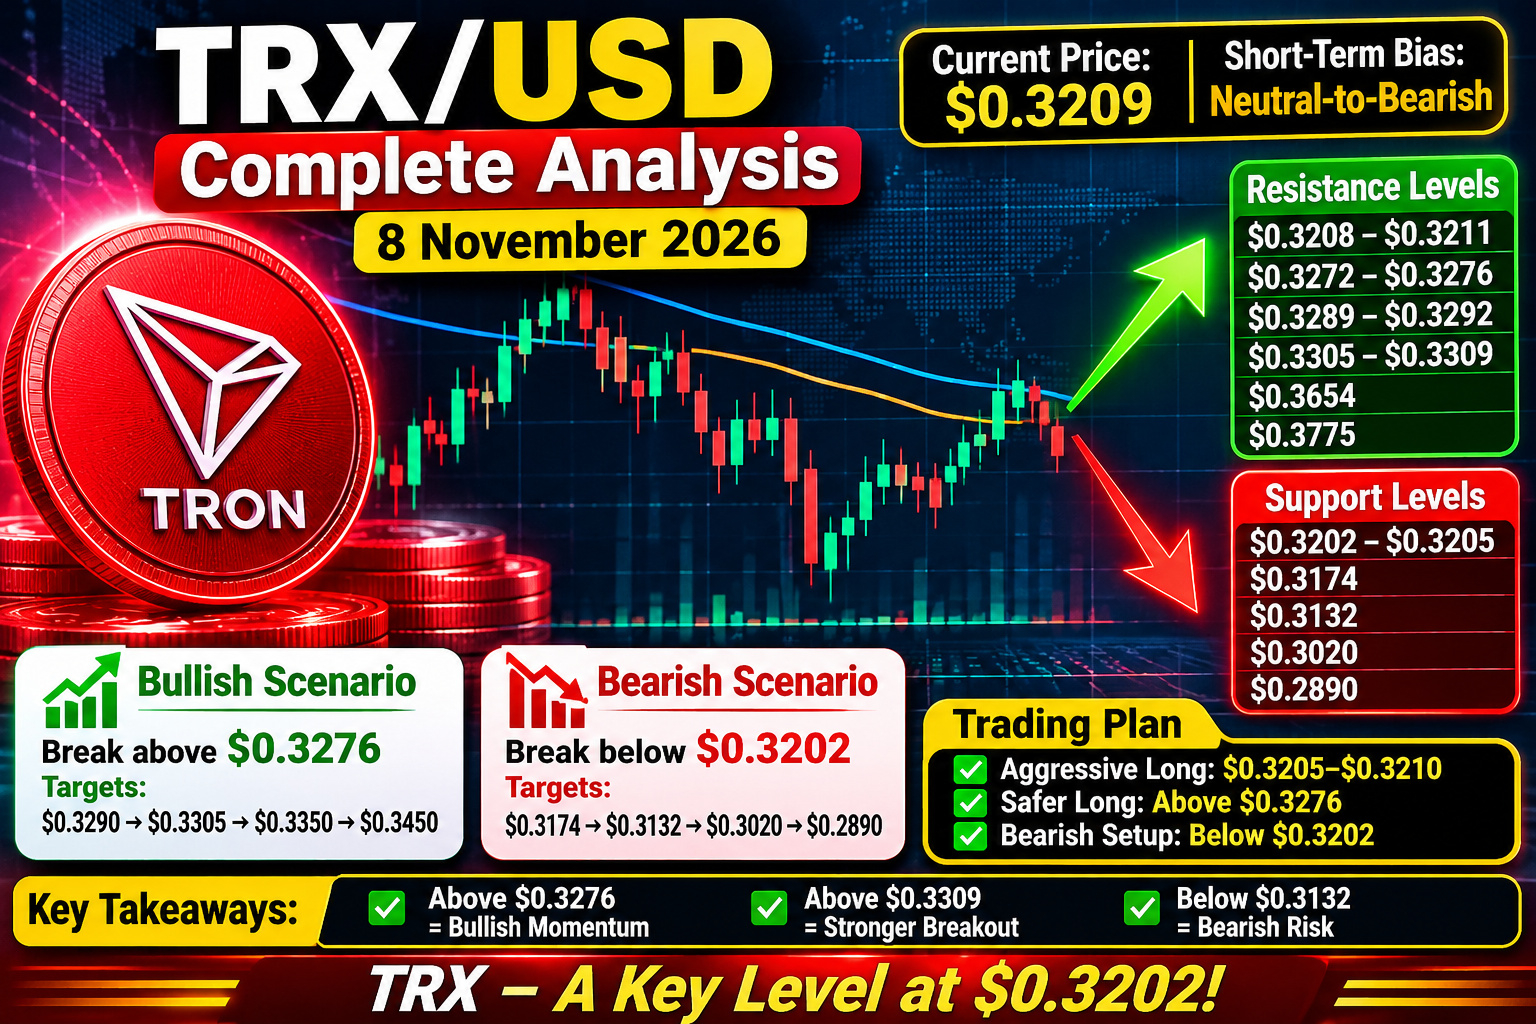
Current price: approximately $0.3209.
Short-term bias: 🟠 Neutral-to-bearish
Key point: $TRX is holding just above $0.3202–$0.3205, but the 4H and daily market structures remain bearish.
📊 Technical indicators

- RSI (14): ~58–62 → bullish momentum, but not yet overbought.
- MACD: Buy signal.
- ADX: ~34–37 → trend has reasonable strength.
- MA20: around $0.3201–$0.3203
- MA50: around $0.3192–$0.3197
- MA100: around $0.3193–$0.3196
- MA200: around $0.3180, although the 200-EMA is near $0.3207.
The interesting part is the conflict between indicators and structure: short-term indicators are mostly positive, while the 4H/daily structure remains bearish. That means confirmation is important before chasing a breakout.
🟢 Important support levels
Level Importance
$0.3202–$0.3205 Immediate support
$0.3174 Strong daily support
$0.3132 Weekly support
$0.3020 Major downside support
$0.2890 Major lower support
The $0.3202–$0.3205 zone is the immediate battleground. A failure there would make $0.3174 the next important test.
🔴 Resistance levels
Level Importance
$0.3208–$0.3211 Immediate resistance
$0.3272–$0.3276 Major 4H resistance
$0.3289–$0.3292 Strong resistance
$0.3305–$0.3309 Breakout zone
$0.3654 Major higher resistance
$0.3775 Major swing high
The first real bullish test is $0.3272–$0.3276. A clean break above that area would improve the structure considerably.
📈 Bullish scenario
If $TRX continues holding $0.3202–$0.3205 and breaks $0.3276, momentum could extend toward:
$0.3290 → $0.3305 → $0.3350 → $0.3450
A sustained move above $0.3309 would be a stronger confirmation that the bearish 4H structure is reversing.
For a larger trend reversal, $0.3654 is the major level to watch.
📉 Bearish scenario
If TRX loses $0.3202, the next targets become:
$0.3174 → $0.3132 → $0.3020 → $0.2890
A daily close below $0.3132 would substantially strengthen the bearish case.
🏦 Fundamental outlook
TRON's fundamentals remain relatively strong. Q3 2026 data showed approximately $2.21 trillion in stablecoin settlement, around 3.7 million daily active addresses, and more than $92.7 billion of USDT on TRON at its Q3 peak. TRON also gained additional institutional access through the Canary Staked TRX ETF, launched in September.
This gives TRX a stronger utility narrative than price action alone suggests. However, strong network activity does not automatically mean the token must rise, so technical confirmation remains important.
🎯 Trading setup
Aggressive long:
$0.3205–$0.3210 after a confirmed bullish reaction
Targets: $0.3275 → $0.3305 → $0.3350
Safer long:
Wait for a breakout above $0.3276, preferably followed by a successful retest.
Bearish setup:
Confirmed break below $0.3202
Targets: $0.3174 → $0.3132 → $0.3020
Bullish invalidation: sustained weakness below $0.3174.
Bearish invalidation: strong breakout and acceptance above $0.3309.
🔥 Overall view
Short term: 🟠 Neutral/Bearish
Medium term: 🟠 Neutral-to-bullish if $0.3174 holds
Long term: 🟢 Fundamentally constructive
Most important levels:
➡️ Above $0.3276 = bullish momentum
➡️ Above $0.3309 = stronger breakout confirmation
➡️ Below $0.3202 = downside risk increases
➡️ Below $0.3132 = bearish structure becomes much stronger
This is technical market analysis, not financial advice. Crypto prices can move rapidly, so use appropriate risk management.
#TRX #TRX/USDT❤️ #TrendingPredictions #trxanalysis