
#trxanalysis
trxanalysis
33,247 Aufrufe
97 Kommentare
Hot
Zuletzt

Artikel
Übersetzung ansehen
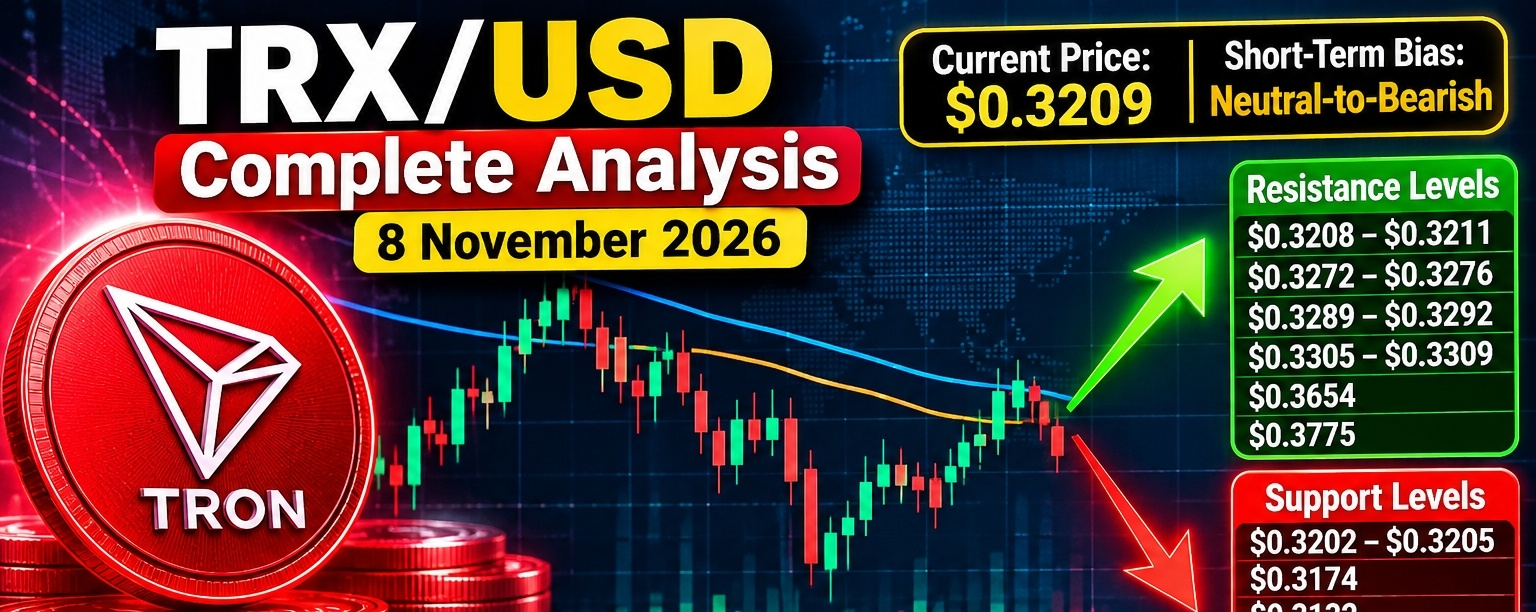
TRX/USD Complete Analysis — 8 November 2026$TRX /USD Complete Analysis — 8 November 2026
Current price: approximately $0.3209.
Short-term bias: 🟠 Neutral-to-bearish
Key point: $TRX is holding just above $0.3202–$0.3205, but the 4H and daily market structures remain bearish.
📊 Technical indicators
{spot}(TRXUSDT)
- RSI (14): ~58–62 → bullish momentum, but not yet overbought.
- MACD: Buy signal.
- ADX: ~34–37 → trend has reasonable strength.
- MA20: around $0.3201–$0.3203
- MA50: around $0.3192–$0.3197
- MA100: around $0.3193–$0.3196
- MA200: around $0.3180, although the 200-EMA is near $0.3207.
The interesting part is the conflict between indicators and structure: short-term indicators are mostly positive, while the 4H/daily structure remains bearish. That means confirmation is important before chasing a breakout.
🟢 Important support levels
Level Importance
$0.3202–$0.3205 Immediate support
$0.3174 Strong daily support
$0.3132 Weekly support
$0.3020 Major downside support
$0.2890 Major lower support
The $0.3202–$0.3205 zone is the immediate battleground. A failure there would make $0.3174 the next important test.
🔴 Resistance levels
Level Importance
$0.3208–$0.3211 Immediate resistance
$0.3272–$0.3276 Major 4H resistance
$0.3289–$0.3292 Strong resistance
$0.3305–$0.3309 Breakout zone
$0.3654 Major higher resistance
$0.3775 Major swing high
The first real bullish test is $0.3272–$0.3276. A clean break above that area would improve the structure considerably.
📈 Bullish scenario
If $TRX continues holding $0.3202–$0.3205 and breaks $0.3276, momentum could extend toward:
$0.3290 → $0.3305 → $0.3350 → $0.3450
A sustained move above $0.3309 would be a stronger confirmation that the bearish 4H structure is reversing.
For a larger trend reversal, $0.3654 is the major level to watch.
📉 Bearish scenario
If TRX loses $0.3202, the next targets become:
$0.3174 → $0.3132 → $0.3020 → $0.2890
A daily close below $0.3132 would substantially strengthen the bearish case.
🏦 Fundamental outlook
TRON's fundamentals remain relatively strong. Q3 2026 data showed approximately $2.21 trillion in stablecoin settlement, around 3.7 million daily active addresses, and more than $92.7 billion of USDT on TRON at its Q3 peak. TRON also gained additional institutional access through the Canary Staked TRX ETF, launched in September.
This gives TRX a stronger utility narrative than price action alone suggests. However, strong network activity does not automatically mean the token must rise, so technical confirmation remains important.
🎯 Trading setup
Aggressive long:
$0.3205–$0.3210 after a confirmed bullish reaction
Targets: $0.3275 → $0.3305 → $0.3350
Safer long:
Wait for a breakout above $0.3276, preferably followed by a successful retest.
Bearish setup:
Confirmed break below $0.3202
Targets: $0.3174 → $0.3132 → $0.3020
Bullish invalidation: sustained weakness below $0.3174.
Bearish invalidation: strong breakout and acceptance above $0.3309.
🔥 Overall view
Short term: 🟠 Neutral/Bearish
Medium term: 🟠 Neutral-to-bullish if $0.3174 holds
Long term: 🟢 Fundamentally constructive
Most important levels:
➡️ Above $0.3276 = bullish momentum
➡️ Above $0.3309 = stronger breakout confirmation
➡️ Below $0.3202 = downside risk increases
➡️ Below $0.3132 = bearish structure becomes much stronger
This is technical market analysis, not financial advice. Crypto prices can move rapidly, so use appropriate risk management.
#TRX #TRX/USDT❤️ #TrendingPredictions #trxanalysis
TRX/USD Complete Analysis — 8 November 2026
$TRX /USD Complete Analysis — 8 November 2026
Current price: approximately $0.3209.
Short-term bias: 🟠 Neutral-to-bearish
Key point: $TRX is holding just above $0.3202–$0.3205, but the 4H and daily market structures remain bearish.
📊 Technical indicators
- RSI (14): ~58–62 → bullish momentum, but not yet overbought.
- MACD: Buy signal.
- ADX: ~34–37 → trend has reasonable strength.
- MA20: around $0.3201–$0.3203
- MA50: around $0.3192–$0.3197
- MA100: around $0.3193–$0.3196
- MA200: around $0.3180, although the 200-EMA is near $0.3207.
The interesting part is the conflict between indicators and structure: short-term indicators are mostly positive, while the 4H/daily structure remains bearish. That means confirmation is important before chasing a breakout.
🟢 Important support levels
Level Importance
$0.3202–$0.3205 Immediate support
$0.3174 Strong daily support
$0.3132 Weekly support
$0.3020 Major downside support
$0.2890 Major lower support
The $0.3202–$0.3205 zone is the immediate battleground. A failure there would make $0.3174 the next important test.
🔴 Resistance levels
Level Importance
$0.3208–$0.3211 Immediate resistance
$0.3272–$0.3276 Major 4H resistance
$0.3289–$0.3292 Strong resistance
$0.3305–$0.3309 Breakout zone
$0.3654 Major higher resistance
$0.3775 Major swing high
The first real bullish test is $0.3272–$0.3276. A clean break above that area would improve the structure considerably.
📈 Bullish scenario
If $TRX continues holding $0.3202–$0.3205 and breaks $0.3276, momentum could extend toward:
$0.3290 → $0.3305 → $0.3350 → $0.3450
A sustained move above $0.3309 would be a stronger confirmation that the bearish 4H structure is reversing.
For a larger trend reversal, $0.3654 is the major level to watch.
📉 Bearish scenario
If TRX loses $0.3202, the next targets become:
$0.3174 → $0.3132 → $0.3020 → $0.2890
A daily close below $0.3132 would substantially strengthen the bearish case.
🏦 Fundamental outlook
TRON's fundamentals remain relatively strong. Q3 2026 data showed approximately $2.21 trillion in stablecoin settlement, around 3.7 million daily active addresses, and more than $92.7 billion of USDT on TRON at its Q3 peak. TRON also gained additional institutional access through the Canary Staked TRX ETF, launched in September.
This gives TRX a stronger utility narrative than price action alone suggests. However, strong network activity does not automatically mean the token must rise, so technical confirmation remains important.
🎯 Trading setup
Aggressive long:
$0.3205–$0.3210 after a confirmed bullish reaction
Targets: $0.3275 → $0.3305 → $0.3350
Safer long:
Wait for a breakout above $0.3276, preferably followed by a successful retest.
Bearish setup:
Confirmed break below $0.3202
Targets: $0.3174 → $0.3132 → $0.3020
Bullish invalidation: sustained weakness below $0.3174.
Bearish invalidation: strong breakout and acceptance above $0.3309.
🔥 Overall view
Short term: 🟠 Neutral/Bearish
Medium term: 🟠 Neutral-to-bullish if $0.3174 holds
Long term: 🟢 Fundamentally constructive
Most important levels:
➡️ Above $0.3276 = bullish momentum
➡️ Above $0.3309 = stronger breakout confirmation
➡️ Below $0.3202 = downside risk increases
➡️ Below $0.3132 = bearish structure becomes much stronger
This is technical market analysis, not financial advice. Crypto prices can move rapidly, so use appropriate risk management.
#TRX #TRX/USDT❤️ #TrendingPredictions #trxanalysis
Current price: approximately $0.3209.
Short-term bias: 🟠 Neutral-to-bearish
Key point: $TRX is holding just above $0.3202–$0.3205, but the 4H and daily market structures remain bearish.
📊 Technical indicators
- RSI (14): ~58–62 → bullish momentum, but not yet overbought.
- MACD: Buy signal.
- ADX: ~34–37 → trend has reasonable strength.
- MA20: around $0.3201–$0.3203
- MA50: around $0.3192–$0.3197
- MA100: around $0.3193–$0.3196
- MA200: around $0.3180, although the 200-EMA is near $0.3207.
The interesting part is the conflict between indicators and structure: short-term indicators are mostly positive, while the 4H/daily structure remains bearish. That means confirmation is important before chasing a breakout.
🟢 Important support levels
Level Importance
$0.3202–$0.3205 Immediate support
$0.3174 Strong daily support
$0.3132 Weekly support
$0.3020 Major downside support
$0.2890 Major lower support
The $0.3202–$0.3205 zone is the immediate battleground. A failure there would make $0.3174 the next important test.
🔴 Resistance levels
Level Importance
$0.3208–$0.3211 Immediate resistance
$0.3272–$0.3276 Major 4H resistance
$0.3289–$0.3292 Strong resistance
$0.3305–$0.3309 Breakout zone
$0.3654 Major higher resistance
$0.3775 Major swing high
The first real bullish test is $0.3272–$0.3276. A clean break above that area would improve the structure considerably.
📈 Bullish scenario
If $TRX continues holding $0.3202–$0.3205 and breaks $0.3276, momentum could extend toward:
$0.3290 → $0.3305 → $0.3350 → $0.3450
A sustained move above $0.3309 would be a stronger confirmation that the bearish 4H structure is reversing.
For a larger trend reversal, $0.3654 is the major level to watch.
📉 Bearish scenario
If TRX loses $0.3202, the next targets become:
$0.3174 → $0.3132 → $0.3020 → $0.2890
A daily close below $0.3132 would substantially strengthen the bearish case.
🏦 Fundamental outlook
TRON's fundamentals remain relatively strong. Q3 2026 data showed approximately $2.21 trillion in stablecoin settlement, around 3.7 million daily active addresses, and more than $92.7 billion of USDT on TRON at its Q3 peak. TRON also gained additional institutional access through the Canary Staked TRX ETF, launched in September.
This gives TRX a stronger utility narrative than price action alone suggests. However, strong network activity does not automatically mean the token must rise, so technical confirmation remains important.
🎯 Trading setup
Aggressive long:
$0.3205–$0.3210 after a confirmed bullish reaction
Targets: $0.3275 → $0.3305 → $0.3350
Safer long:
Wait for a breakout above $0.3276, preferably followed by a successful retest.
Bearish setup:
Confirmed break below $0.3202
Targets: $0.3174 → $0.3132 → $0.3020
Bullish invalidation: sustained weakness below $0.3174.
Bearish invalidation: strong breakout and acceptance above $0.3309.
🔥 Overall view
Short term: 🟠 Neutral/Bearish
Medium term: 🟠 Neutral-to-bullish if $0.3174 holds
Long term: 🟢 Fundamentally constructive
Most important levels:
➡️ Above $0.3276 = bullish momentum
➡️ Above $0.3309 = stronger breakout confirmation
➡️ Below $0.3202 = downside risk increases
➡️ Below $0.3132 = bearish structure becomes much stronger
This is technical market analysis, not financial advice. Crypto prices can move rapidly, so use appropriate risk management.
#TRX #TRX/USDT❤️ #TrendingPredictions #trxanalysis
9


·
--
Das $TRX Setup macht mich vorsichtig wegen dieser schweren Verkaufswände, aber ich überwache auch $SPCXB für korrelierte Bewegungen.
🔥 Tiefe Marktinformationen
💎 Orderbuch: Schwere Verkaufswände (0.65x)
💎 1H Offene Interessen: Rückläufig (-)
💎 Wale L/S: 40.8% Long
💎 Taker Flow: 0.42x
💎
🎯 $TRX MACRO BREAKOUT 📈
💎 Einstieg Zone: 0.31057 - 0.31530
💎 🎯 Ziel 1: 0.31845
💎 🎯 Ziel 2: 0.32161
💎 🎯 Ziel 3: 0.32539
💎 🛑 Ungültigkeit (SL): 0.30679
🔥 Tiefe Marktinformationen
💎 Orderbuch: Schwere Verkaufswände (0.30x)
💎 1H Offene Interessen: Rückläufig (-)
💎 Wale L/S: 61.9% Long
💎 Taker Flow: 1.03x 📊
#TRXAnalysis #SPCXB
Das $TRX Setup macht mich vorsichtig wegen dieser schweren Verkaufswände, aber ich überwache auch $SPCXB für korrelierte Bewegungen.
🔥 Tiefe Marktinformationen
💎 Orderbuch: Schwere Verkaufswände (0.65x)
💎 1H Offene Interessen: Rückläufig (-)
💎 Wale L/S: 40.8% Long
💎 Taker Flow: 0.42x
💎
🎯 $TRX MACRO BREAKOUT 📈
💎 Einstieg Zone: 0.31057 - 0.31530
💎 🎯 Ziel 1: 0.31845
💎 🎯 Ziel 2: 0.32161
💎 🎯 Ziel 3: 0.32539
💎 🛑 Ungültigkeit (SL): 0.30679
🔥 Tiefe Marktinformationen
💎 Orderbuch: Schwere Verkaufswände (0.30x)
💎 1H Offene Interessen: Rückläufig (-)
💎 Wale L/S: 61.9% Long
💎 Taker Flow: 1.03x 📊
#TRXAnalysis #SPCXB
🔥 Tiefe Marktinformationen
💎 Orderbuch: Schwere Verkaufswände (0.65x)
💎 1H Offene Interessen: Rückläufig (-)
💎 Wale L/S: 40.8% Long
💎 Taker Flow: 0.42x
💎
🎯 $TRX MACRO BREAKOUT 📈
💎 Einstieg Zone: 0.31057 - 0.31530
💎 🎯 Ziel 1: 0.31845
💎 🎯 Ziel 2: 0.32161
💎 🎯 Ziel 3: 0.32539
💎 🛑 Ungültigkeit (SL): 0.30679
🔥 Tiefe Marktinformationen
💎 Orderbuch: Schwere Verkaufswände (0.30x)
💎 1H Offene Interessen: Rückläufig (-)
💎 Wale L/S: 61.9% Long
💎 Taker Flow: 1.03x 📊
#TRXAnalysis #SPCXB
2
600

🔥 $TRX - Wo stehen wir jetzt?
TRON befindet sich derzeit im Bereich von $0.3692.
TRX liefert weiterhin ab! TRON verarbeitet täglich Millionen von Transaktionen mit ultraniedrigen Gebühren. Eine der meistgenutzten Blockchains weltweit! 💪
📌 Wichtige Level, die man im Auge behalten sollte:
Unterstützung: $0.34 - $0.36 Bereich 👀
Widerstand: $0.40 - $0.42 Bereich
Glaubst du, dass $TRX bald $0.50 erreichen wird?
Schreib deine Gedanken in die Kommentare! 👇🚀
$TRX $BTC $ETH
#TRON #TRX #Krypto #BinanceSquare #trxanalysis
🔥 $TRX - Wo stehen wir jetzt?
TRON befindet sich derzeit im Bereich von $0.3692.
TRX liefert weiterhin ab! TRON verarbeitet täglich Millionen von Transaktionen mit ultraniedrigen Gebühren. Eine der meistgenutzten Blockchains weltweit! 💪
📌 Wichtige Level, die man im Auge behalten sollte:
Unterstützung: $0.34 - $0.36 Bereich 👀
Widerstand: $0.40 - $0.42 Bereich
Glaubst du, dass $TRX bald $0.50 erreichen wird?
Schreib deine Gedanken in die Kommentare! 👇🚀
$TRX $BTC $ETH
#TRON #TRX #Krypto #BinanceSquare #trxanalysis
TRON befindet sich derzeit im Bereich von $0.3692.
TRX liefert weiterhin ab! TRON verarbeitet täglich Millionen von Transaktionen mit ultraniedrigen Gebühren. Eine der meistgenutzten Blockchains weltweit! 💪
📌 Wichtige Level, die man im Auge behalten sollte:
Unterstützung: $0.34 - $0.36 Bereich 👀
Widerstand: $0.40 - $0.42 Bereich
Glaubst du, dass $TRX bald $0.50 erreichen wird?
Schreib deine Gedanken in die Kommentare! 👇🚀
$TRX $BTC $ETH
#TRON #TRX #Krypto #BinanceSquare #trxanalysis
34

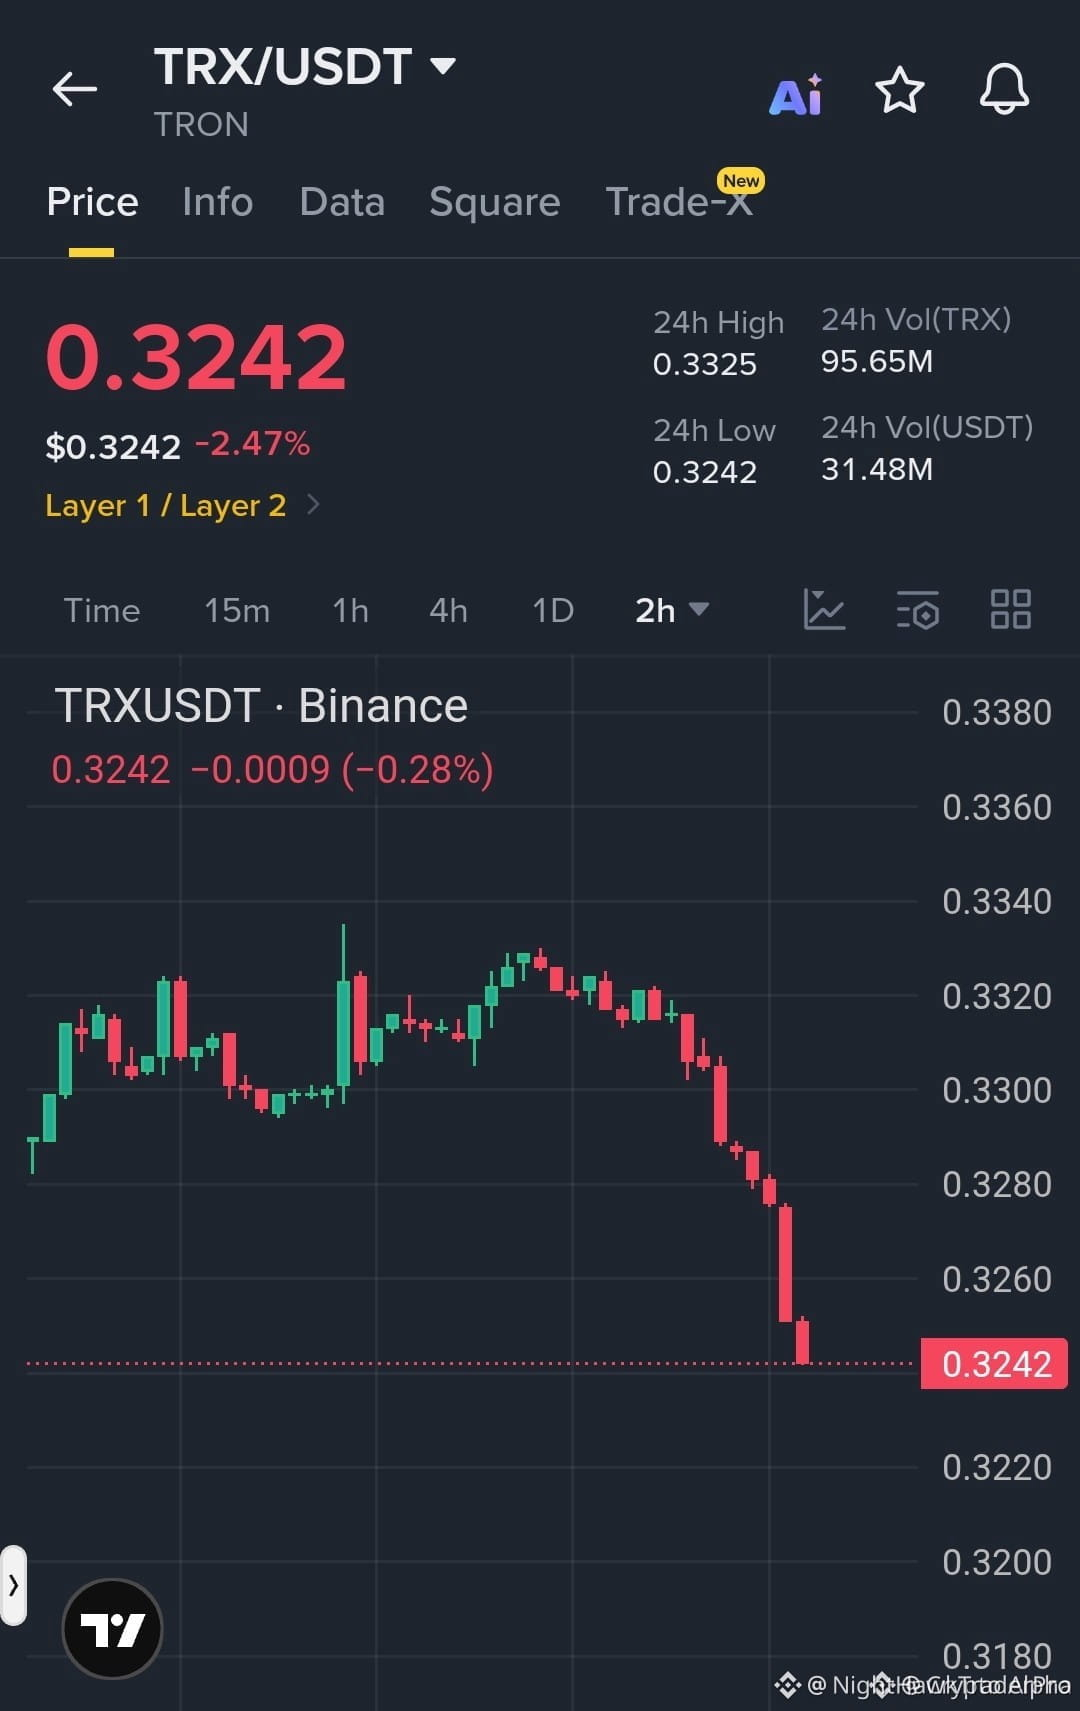
$TRX BREAKING DOWN — VERKÄUFER SENKEN DAS HAMMER 💥🔴
Einstieg: $0.3240 – $0.3250 ⚡
Ziel 1: $0.3200 🎯
Ziel 2: $0.3175 💥
Stop Loss: $0.3275 ⚠️
📉 Die Struktur bricht in Echtzeit zusammen. Jede Zurückweisung bei $0.3275 ist schärfer geworden, mit stark steigendem Volumen bei jeder roten Kerze. 🐻 Verkäufer stapeln Orders unterhalb—das ist kein Dip, das ist ein Liquidity-Grab in die Leere. 🔴 Das tägliche Momentum ist ins Negative gekippt, und niedrigere Hochs türmen sich auf wie Dominosteine.
💡 Das Chance-Risiko-Verhältnis bei diesem Breakdown ist eng, wenn du den Einstieg nahe am Widerstand timst. Bären behandeln jedes Comeback wie ein Geschenk. 💬 Gehst du short beim Retest oder wartest du auf eine vollständige Bestätigung des Breakdowns unter $0.3200? 👇
⚠️ Keine Finanzberatung. Immer dein Risiko steuern. 🛡️
🏷️ #TRX #ShortSetup #Breakdown #Crypto #TRXAnalysis
🎯 🐻
$TRX BREAKING DOWN — VERKÄUFER SENKEN DAS HAMMER 💥🔴
Einstieg: $0.3240 – $0.3250 ⚡
Ziel 1: $0.3200 🎯
Ziel 2: $0.3175 💥
Stop Loss: $0.3275 ⚠️
📉 Die Struktur bricht in Echtzeit zusammen. Jede Zurückweisung bei $0.3275 ist schärfer geworden, mit stark steigendem Volumen bei jeder roten Kerze. 🐻 Verkäufer stapeln Orders unterhalb—das ist kein Dip, das ist ein Liquidity-Grab in die Leere. 🔴 Das tägliche Momentum ist ins Negative gekippt, und niedrigere Hochs türmen sich auf wie Dominosteine.
💡 Das Chance-Risiko-Verhältnis bei diesem Breakdown ist eng, wenn du den Einstieg nahe am Widerstand timst. Bären behandeln jedes Comeback wie ein Geschenk. 💬 Gehst du short beim Retest oder wartest du auf eine vollständige Bestätigung des Breakdowns unter $0.3200? 👇
⚠️ Keine Finanzberatung. Immer dein Risiko steuern. 🛡️
🏷️ #TRX #ShortSetup #Breakdown #Crypto #TRXAnalysis
🎯 🐻
Einstieg: $0.3240 – $0.3250 ⚡
Ziel 1: $0.3200 🎯
Ziel 2: $0.3175 💥
Stop Loss: $0.3275 ⚠️
📉 Die Struktur bricht in Echtzeit zusammen. Jede Zurückweisung bei $0.3275 ist schärfer geworden, mit stark steigendem Volumen bei jeder roten Kerze. 🐻 Verkäufer stapeln Orders unterhalb—das ist kein Dip, das ist ein Liquidity-Grab in die Leere. 🔴 Das tägliche Momentum ist ins Negative gekippt, und niedrigere Hochs türmen sich auf wie Dominosteine.
💡 Das Chance-Risiko-Verhältnis bei diesem Breakdown ist eng, wenn du den Einstieg nahe am Widerstand timst. Bären behandeln jedes Comeback wie ein Geschenk. 💬 Gehst du short beim Retest oder wartest du auf eine vollständige Bestätigung des Breakdowns unter $0.3200? 👇
⚠️ Keine Finanzberatung. Immer dein Risiko steuern. 🛡️
🏷️ #TRX #ShortSetup #Breakdown #Crypto #TRXAnalysis
🎯 🐻
40

·
--
Bärisch
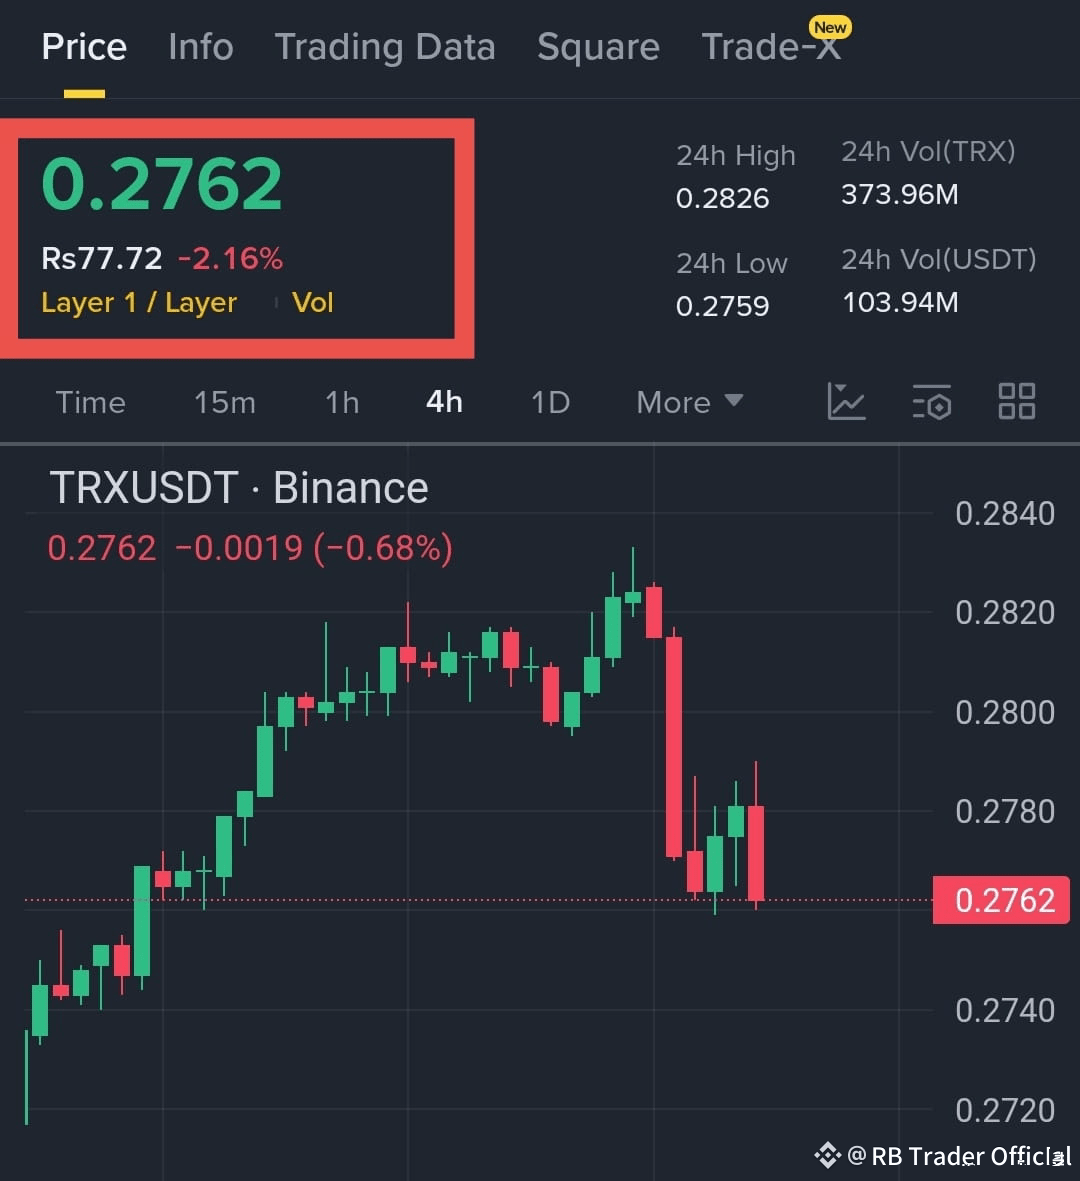
$TRX SHORT TRADE SETUP
$TRX zeigt eine klare Ablehnung von dem jüngsten Anstieg in Richtung 0.2820, und die letzten vier 4H-Kerzen bestätigen, dass der Verkaufsdruck erneut die Kontrolle übernimmt. Der Preis konnte nicht über der Unterstützung bleiben und rutschte zurück in die untere Zone, was darauf hindeutet, dass die Bären an Momentum gewinnen.
Die Marktstruktur wird mit jedem niedrigeren Hoch schwächer, und der aktuelle Rückzug sieht aus wie eine typische bärische Fortsetzung. Wenn TRX unterhalb der Ablehnungszone bleibt, ist eine weitere Abwärtsbewegung sehr wahrscheinlich.
Einstiegszone
0.2760 – 0.2775
Ziele
TP1: 0.2725
TP2: 0.2690
Stop Loss
0.2810
#TRXAnalysis #CryptoTrades
$TRX SHORT TRADE SETUP
$TRX zeigt eine klare Ablehnung von dem jüngsten Anstieg in Richtung 0.2820, und die letzten vier 4H-Kerzen bestätigen, dass der Verkaufsdruck erneut die Kontrolle übernimmt. Der Preis konnte nicht über der Unterstützung bleiben und rutschte zurück in die untere Zone, was darauf hindeutet, dass die Bären an Momentum gewinnen.
Die Marktstruktur wird mit jedem niedrigeren Hoch schwächer, und der aktuelle Rückzug sieht aus wie eine typische bärische Fortsetzung. Wenn TRX unterhalb der Ablehnungszone bleibt, ist eine weitere Abwärtsbewegung sehr wahrscheinlich.
Einstiegszone
0.2760 – 0.2775
Ziele
TP1: 0.2725
TP2: 0.2690
Stop Loss
0.2810
#TRXAnalysis #CryptoTrades
$TRX zeigt eine klare Ablehnung von dem jüngsten Anstieg in Richtung 0.2820, und die letzten vier 4H-Kerzen bestätigen, dass der Verkaufsdruck erneut die Kontrolle übernimmt. Der Preis konnte nicht über der Unterstützung bleiben und rutschte zurück in die untere Zone, was darauf hindeutet, dass die Bären an Momentum gewinnen.
Die Marktstruktur wird mit jedem niedrigeren Hoch schwächer, und der aktuelle Rückzug sieht aus wie eine typische bärische Fortsetzung. Wenn TRX unterhalb der Ablehnungszone bleibt, ist eine weitere Abwärtsbewegung sehr wahrscheinlich.
Einstiegszone
0.2760 – 0.2775
Ziele
TP1: 0.2725
TP2: 0.2690
Stop Loss
0.2810
#TRXAnalysis #CryptoTrades
1
122

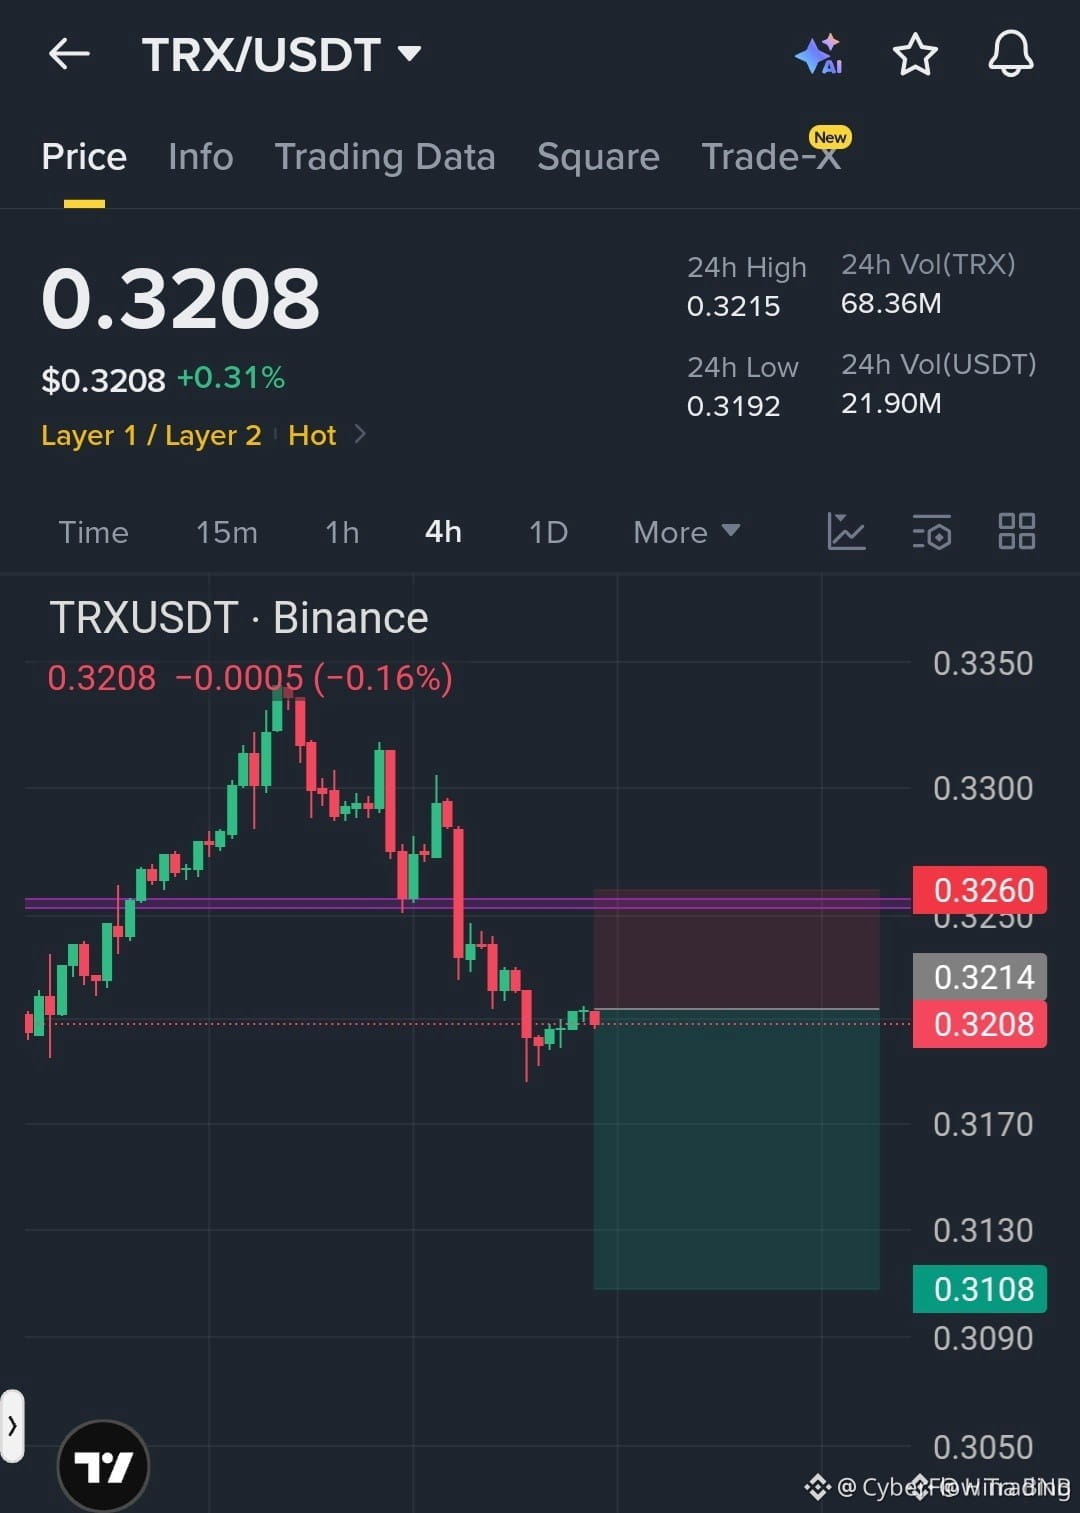
$TRX HAT DIE UNTERSTÜTZUNG VERLOREN – KURZER DRUCK AUFBAUEND 🚨
Einstieg: 0.3205 🔥
Ziel: 0.3170 🚀
Stop Loss: 0.3260 ⚠️
TRX ist hart aus dem Widerstand nach unten ausgebrochen und handelt jetzt unter einer wichtigen Zone, die ich die ganze Woche im Blick hatte. Die Struktur ist auf bärisch gedreht und Verkäufer halten das Bid fest. Das Volumen zieht auf dem 1H an, und solange der Kurs unter der Stop-Loss-Marke bleibt, ist der Weg des geringsten Widerstands nach unten.
Das Chance-Risiko-Verhältnis für das erste Ziel allein ist stark, und mit mehreren darunter gestapelten Gewinnzonen hat dieses Setup noch Potenzial. Shortest du das, oder wartest du auf einen Re-Test der Ausbruchsebene?
Keine Finanzberatung. Achte immer auf dein Risikomanagement.
#TRX #ShortSetup #Bearish #Crypto #TRXAnalysis
🚨
$TRX HAT DIE UNTERSTÜTZUNG VERLOREN – KURZER DRUCK AUFBAUEND 🚨
Einstieg: 0.3205 🔥
Ziel: 0.3170 🚀
Stop Loss: 0.3260 ⚠️
TRX ist hart aus dem Widerstand nach unten ausgebrochen und handelt jetzt unter einer wichtigen Zone, die ich die ganze Woche im Blick hatte. Die Struktur ist auf bärisch gedreht und Verkäufer halten das Bid fest. Das Volumen zieht auf dem 1H an, und solange der Kurs unter der Stop-Loss-Marke bleibt, ist der Weg des geringsten Widerstands nach unten.
Das Chance-Risiko-Verhältnis für das erste Ziel allein ist stark, und mit mehreren darunter gestapelten Gewinnzonen hat dieses Setup noch Potenzial. Shortest du das, oder wartest du auf einen Re-Test der Ausbruchsebene?
Keine Finanzberatung. Achte immer auf dein Risikomanagement.
#TRX #ShortSetup #Bearish #Crypto #TRXAnalysis
🚨
Einstieg: 0.3205 🔥
Ziel: 0.3170 🚀
Stop Loss: 0.3260 ⚠️
TRX ist hart aus dem Widerstand nach unten ausgebrochen und handelt jetzt unter einer wichtigen Zone, die ich die ganze Woche im Blick hatte. Die Struktur ist auf bärisch gedreht und Verkäufer halten das Bid fest. Das Volumen zieht auf dem 1H an, und solange der Kurs unter der Stop-Loss-Marke bleibt, ist der Weg des geringsten Widerstands nach unten.
Das Chance-Risiko-Verhältnis für das erste Ziel allein ist stark, und mit mehreren darunter gestapelten Gewinnzonen hat dieses Setup noch Potenzial. Shortest du das, oder wartest du auf einen Re-Test der Ausbruchsebene?
Keine Finanzberatung. Achte immer auf dein Risikomanagement.
#TRX #ShortSetup #Bearish #Crypto #TRXAnalysis
🚨
31
Anmelden und weiter Inhalte entdecken
Krypto-Nutzer weltweit auf Binance Square kennenlernen
⚡️ Bleib in Sachen Krypto stets am Puls.
💬 Die weltgrößte Kryptobörse vertraut darauf.
👍 Erhalte verlässliche Einblicke von verifizierten Creators.
E-Mail-Adresse/Telefonnummer
Trendthemen
1
#NvidiaInvestigatesAfterHuang’sAffairApology
233,451 Aufrufe
1,886 Kommentare
2
#CPITestsDecemberRateOutlook
682,111 Aufrufe
2,958 Kommentare
3
#AnthropicRejectsIPODelayValuationinQuestion
52,534 Aufrufe
503 Kommentare
4
#US-IranTalksFuelStrongStockMarketRebound
998 Aufrufe
45 Kommentare
5
#BitcoinFiveWeeklyLosses
258,754 Aufrufe
2,285 Kommentare
6
#AIChipSlumpNasdaq
144,807 Aufrufe
1,400 Kommentare
7
#CryptoLiquidationsReach$1.16BIn24Hours
18,658 Aufrufe
54 Kommentare
8
#StrategyBuys1037BTCLastWeek
1,238 Aufrufe
33 Kommentare
9
#NYSEToUseAvalancheToSettleTokenizedStocks
460 Aufrufe
23 Kommentare
10
#TradFiForBeginners
372,644 Aufrufe
2,650 Kommentare