🚀 $TIA /USDT Bulls Defend Demand Zone — Breakout Pressure Building Above $0.45
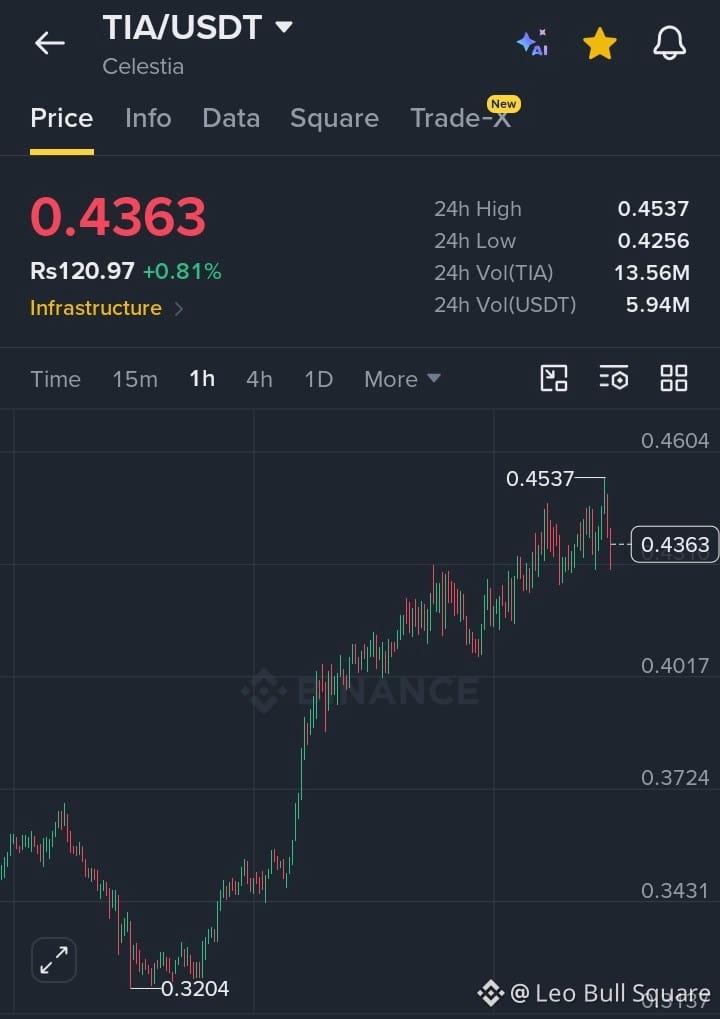
$TIA /USDT is showing a strong market structure recovery after sweeping the lower liquidity zone near $0.4256 and bouncing back toward $0.4363. The 1H chart reflects a clear bullish reclaim, with buyers defending the recent demand area and maintaining higher-low formation. The key resistance zone to watch is $0.4537–$0.4600; a confirmed breakout with volume could trigger the next momentum wave toward higher levels. On the downside, $0.4250–$0.4300 remains the critical support zone, and losing this area may bring another liquidity hunt. Current volume around 5.94M USDT shows active participation, but traders should wait for breakout confirmation or a clean pullback entry instead of chasing candles. Trade the structure, follow the liquidity, and let price action confirm the next move. 📈
Potential Setup:
Entry: $0.4300–$0.4360 (pullback zone)
TP1: $0.4537
TP2: $0.4600
TP3: $0.4800
SL: Below $0.4250
#tia
$TIA /USDT is showing a strong market structure recovery after sweeping the lower liquidity zone near $0.4256 and bouncing back toward $0.4363. The 1H chart reflects a clear bullish reclaim, with buyers defending the recent demand area and maintaining higher-low formation. The key resistance zone to watch is $0.4537–$0.4600; a confirmed breakout with volume could trigger the next momentum wave toward higher levels. On the downside, $0.4250–$0.4300 remains the critical support zone, and losing this area may bring another liquidity hunt. Current volume around 5.94M USDT shows active participation, but traders should wait for breakout confirmation or a clean pullback entry instead of chasing candles. Trade the structure, follow the liquidity, and let price action confirm the next move. 📈
Potential Setup:
Entry: $0.4300–$0.4360 (pullback zone)
TP1: $0.4537
TP2: $0.4600
TP3: $0.4800
SL: Below $0.4250
#tia