$SOL
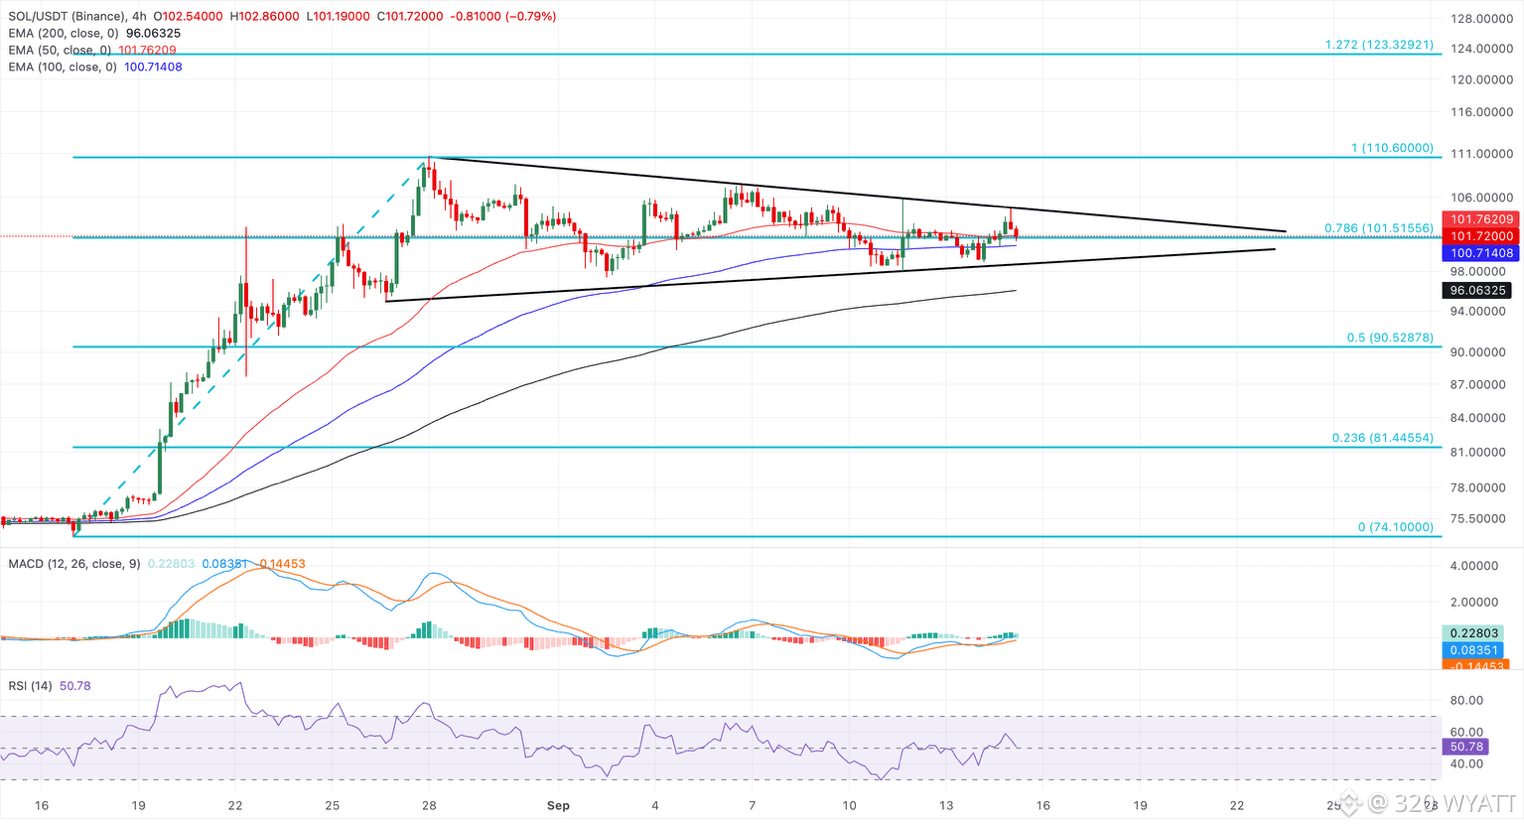
Solana trades around $101 on Tuesday, holding its mild 3% gains from the previous day. SOL hovers marginally above the 50-period and 100-period Exponential Moving Averages (EMAs) on the four-hour chart near $101.72 and $100.71, suggesting a neutral yet slightly constructive bias as buyers defend the $100 handle.
Solana struggles to decisively reclaim short-term trend control but remains well above the 200-period EMA at $96.06. The Fibonacci retracement from $74.10 to $110.60 highlights the 78.6% retracement level at $101.51 acting as the near-term support, while price remains capped between two converging trendlines, forming a symmetrical triangle pattern.
Momentum remains neutral on the four-hour chart, with the Moving Average Convergence Divergence (MACD) holding marginally above its signal line and rising toward the zero line. At the same time, the Relative Strength Index (RSI) hovers close to 51, hinting at modest bullish momentum.
On the topside, immediate resistance is at the overhead trendline, which earlier capped the day's high near $104.82, followed by the $110.60 swing high. A confirmed breakout above this level could target the 127.2% Fibonacci extension level at $123.32, projecting nearly 20% upside potential.
#solana320 #solana #mr320 #WriteToEarn2026 #FedHikeOddsRiseTo89%
Solana trades around $101 on Tuesday, holding its mild 3% gains from the previous day. SOL hovers marginally above the 50-period and 100-period Exponential Moving Averages (EMAs) on the four-hour chart near $101.72 and $100.71, suggesting a neutral yet slightly constructive bias as buyers defend the $100 handle.
Solana struggles to decisively reclaim short-term trend control but remains well above the 200-period EMA at $96.06. The Fibonacci retracement from $74.10 to $110.60 highlights the 78.6% retracement level at $101.51 acting as the near-term support, while price remains capped between two converging trendlines, forming a symmetrical triangle pattern.
Momentum remains neutral on the four-hour chart, with the Moving Average Convergence Divergence (MACD) holding marginally above its signal line and rising toward the zero line. At the same time, the Relative Strength Index (RSI) hovers close to 51, hinting at modest bullish momentum.
On the topside, immediate resistance is at the overhead trendline, which earlier capped the day's high near $104.82, followed by the $110.60 swing high. A confirmed breakout above this level could target the 127.2% Fibonacci extension level at $123.32, projecting nearly 20% upside potential.
#solana320 #solana #mr320 #WriteToEarn2026 #FedHikeOddsRiseTo89%