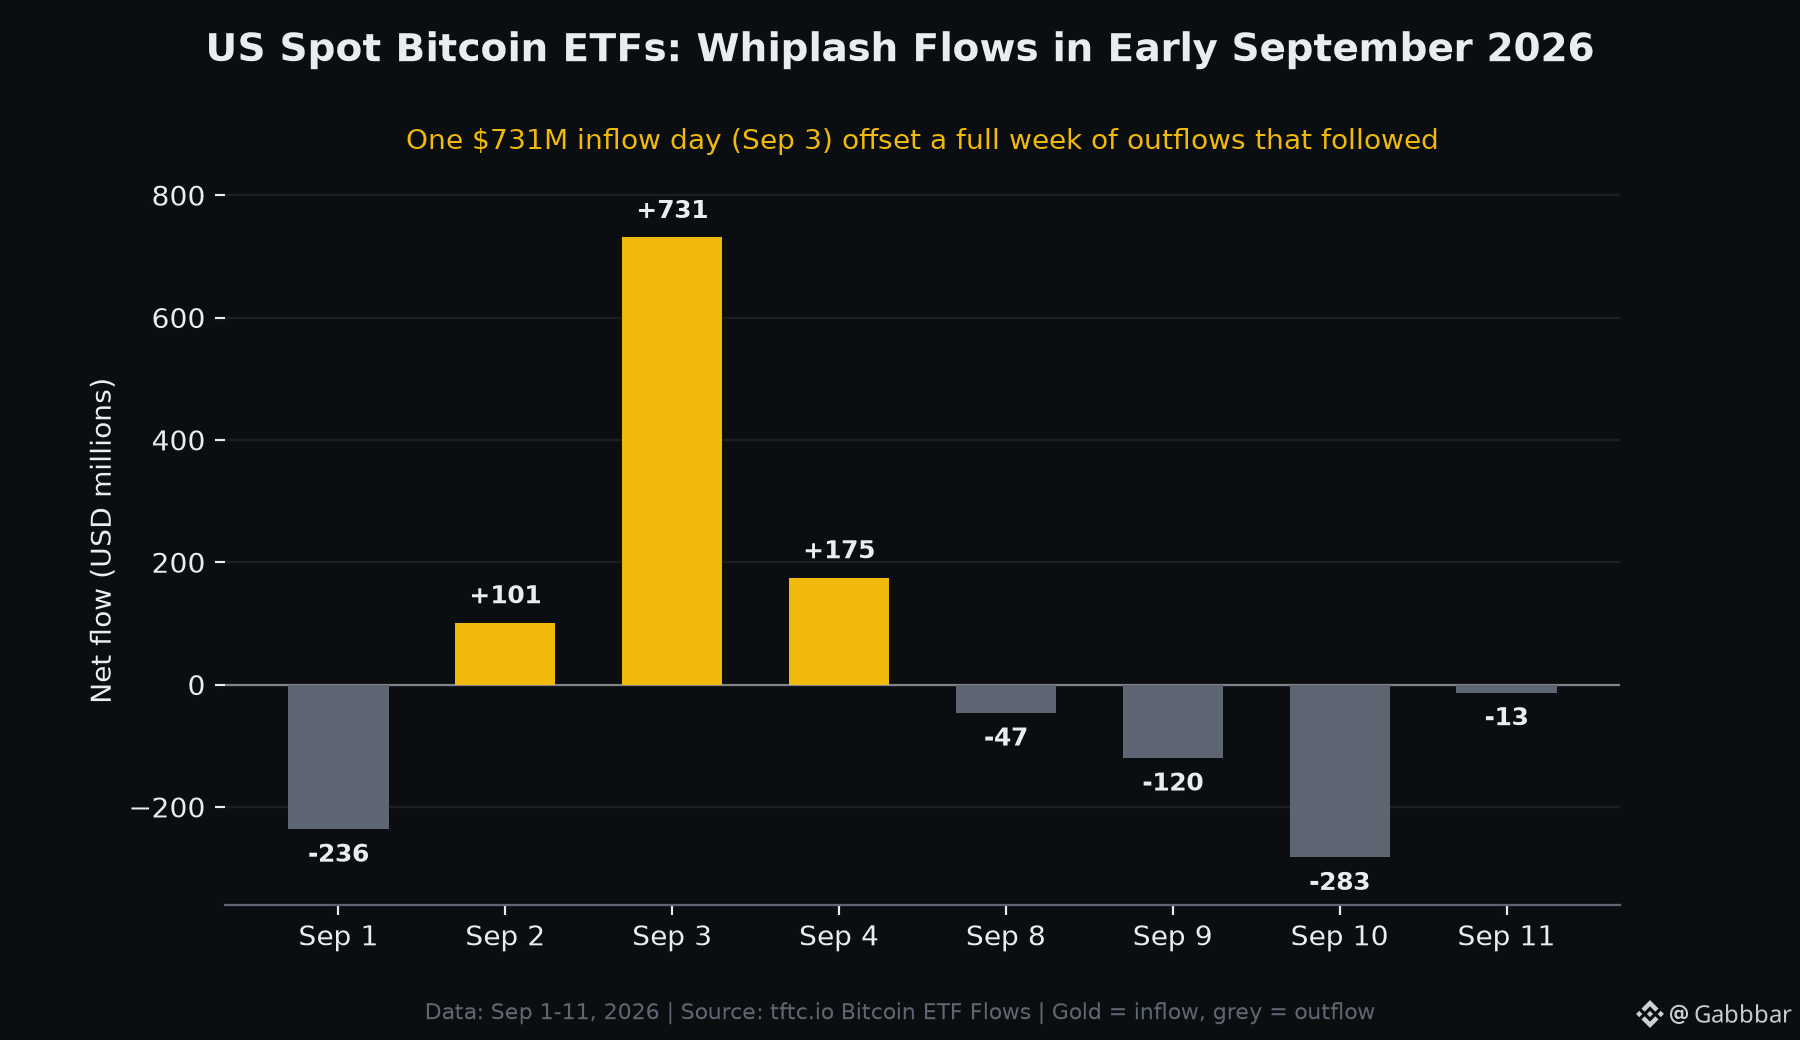
One record day did most of the work. On September 3, 2026, US spot Bitcoin ETFs pulled in $730.9 million in a single session -- their largest daily net inflow since January 2026. But zoom out to the eleven days around it and the picture is far messier than one green bar suggests.
Here is the full early-September sequence (net flows, USD):
- Sep 1: -$236.5M (outflow)
- Sep 2: +$101.1M
- Sep 3: +$730.9M
- Sep 4: +$174.6M
- Sep 8: -$46.6M
- Sep 9: -$120.2M
- Sep 10: -$282.6M
- Sep 11: -$13.3M
Add it up and the eight trading days net to roughly +$307M. In other words, the entire stretch was positive only because of that one Sep 3 spike -- every session that followed it saw money leave.
A concentration detail worth noting: on Sep 3, BlackRock's IBIT alone captured about $454M, more than 60% of all money entering the sector that day, with ARKB (~$138M) and FBTC (~$74M) taking most of the rest. Single-day totals are increasingly driven by one or two funds.
For context, combined US Bitcoin ETF net assets sat near $103.34 billion as of early September 2026 -- roughly 6.3% of Bitcoin's total market cap.
The takeaway isn't direction, it's dispersion: daily ETF flow headlines can swing from record inflow to week-long outflow within days. When you see a single-day flow number, what's the right window to judge institutional demand -- a day, a week, or a month?
#Bitcoin #BitcoinETF #CryptoNews
Here is the full early-September sequence (net flows, USD):
- Sep 1: -$236.5M (outflow)
- Sep 2: +$101.1M
- Sep 3: +$730.9M
- Sep 4: +$174.6M
- Sep 8: -$46.6M
- Sep 9: -$120.2M
- Sep 10: -$282.6M
- Sep 11: -$13.3M
Add it up and the eight trading days net to roughly +$307M. In other words, the entire stretch was positive only because of that one Sep 3 spike -- every session that followed it saw money leave.
A concentration detail worth noting: on Sep 3, BlackRock's IBIT alone captured about $454M, more than 60% of all money entering the sector that day, with ARKB (~$138M) and FBTC (~$74M) taking most of the rest. Single-day totals are increasingly driven by one or two funds.
For context, combined US Bitcoin ETF net assets sat near $103.34 billion as of early September 2026 -- roughly 6.3% of Bitcoin's total market cap.
The takeaway isn't direction, it's dispersion: daily ETF flow headlines can swing from record inflow to week-long outflow within days. When you see a single-day flow number, what's the right window to judge institutional demand -- a day, a week, or a month?
#Bitcoin #BitcoinETF #CryptoNews