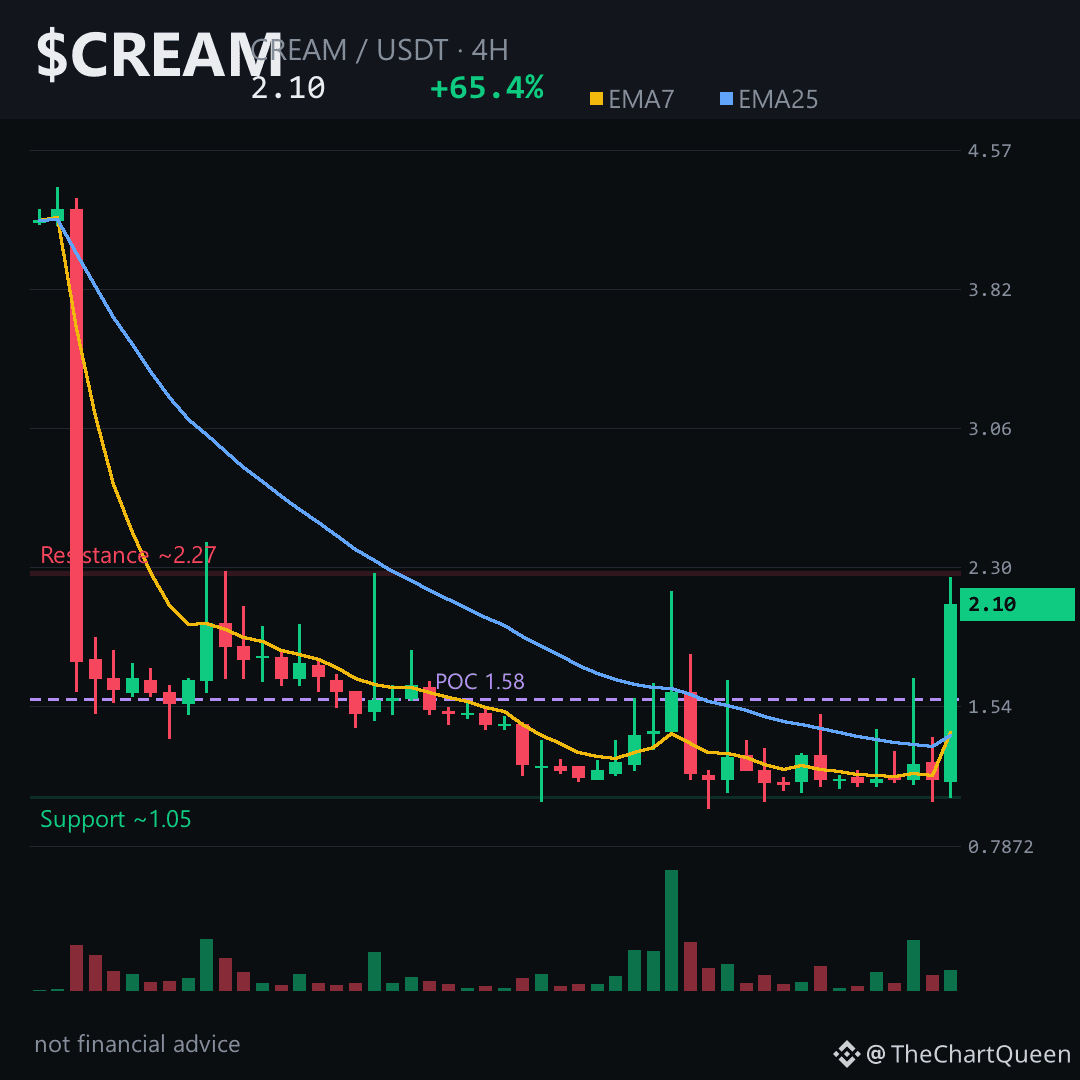
The $2.14‑$2.15 band that just rescued $CREAM from a 65% surge is now the next make‑or‑break point.
Don’t miss the hidden trap 👇
Price looks bullish on the 4‑hour chart, but the daily EMA spread and a bearish FVG whisper a pull‑back.
RSI in the low‑30s signals that the rally may be running out of steam.
On the 1‑day picture $CREAM is hovering just below the ~2.14 zone. A close under that area would open the path toward the ~1.80 objective, while a bounce back above the ~2.31 invalidation would nullify the bearish case. Tap $CREAM to pull up the chart and see these zones yourself.
I see the daily structure pointing to a downside move if the ~2.14 support fails.
Follow me for a quick update when price tests the 1.80 region – you’ll catch the next move before it’s obvious.
Where do you think CREAM will hold first, around 2.1 or under 2.0? 👇
⚠️ Not financial advice. DYOR.
#CREAM #DeFi #Crypto #BinanceSquare
Don’t miss the hidden trap 👇
Price looks bullish on the 4‑hour chart, but the daily EMA spread and a bearish FVG whisper a pull‑back.
RSI in the low‑30s signals that the rally may be running out of steam.
On the 1‑day picture $CREAM is hovering just below the ~2.14 zone. A close under that area would open the path toward the ~1.80 objective, while a bounce back above the ~2.31 invalidation would nullify the bearish case. Tap $CREAM to pull up the chart and see these zones yourself.
I see the daily structure pointing to a downside move if the ~2.14 support fails.
Follow me for a quick update when price tests the 1.80 region – you’ll catch the next move before it’s obvious.
Where do you think CREAM will hold first, around 2.1 or under 2.0? 👇
⚠️ Not financial advice. DYOR.
#CREAM #DeFi #Crypto #BinanceSquare