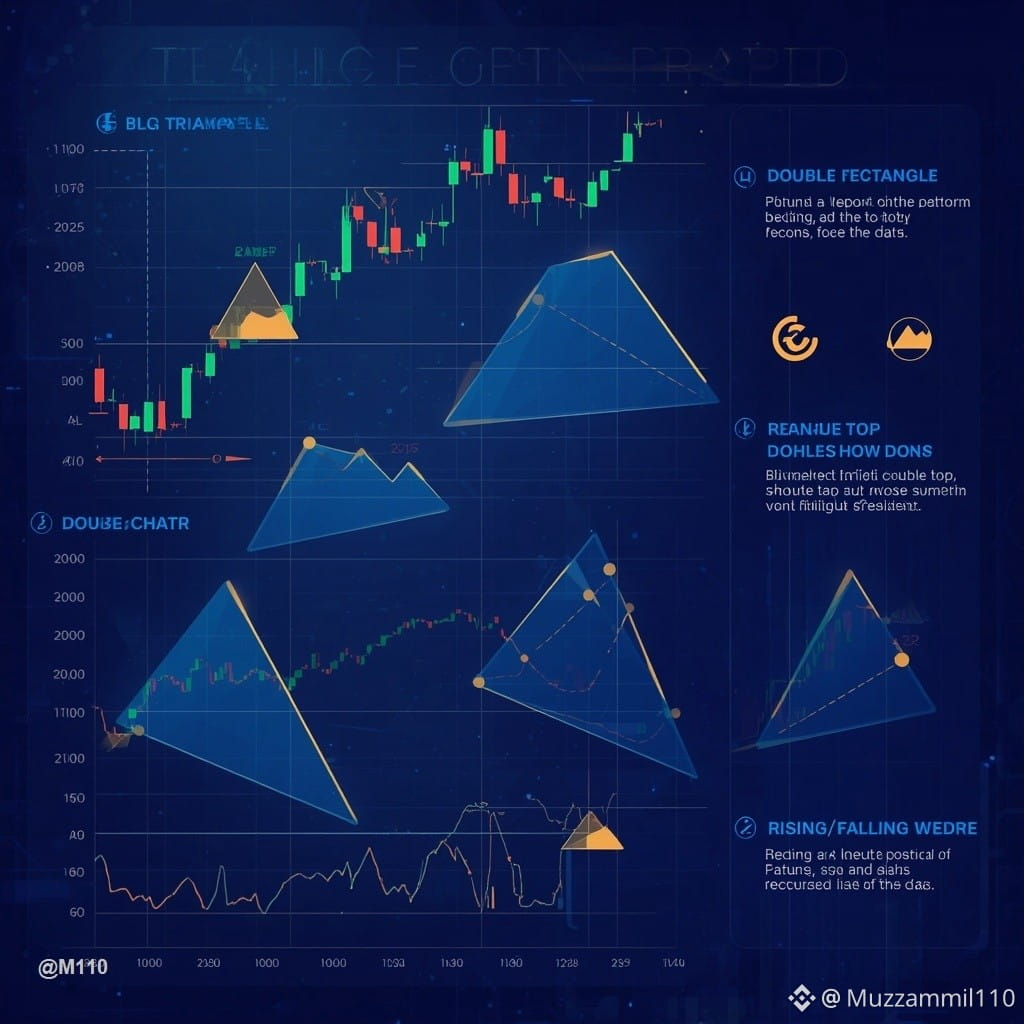
Common Chart Patterns Explained Simply
Chart patterns can help traders organize what price is doing—but no pattern guarantees what happens next.
Here are some common patterns beginners should understand:
🔺 1. Triangle
Price moves within a narrowing range as buyers and sellers become more balanced. A breakout can occur in either direction.
🟦 2. Rectangle
Price moves between relatively clear support and resistance areas, creating a consolidation range.
🔄 3. Double Top
Price tests a similar resistance area twice and fails to break through. Confirmation matters before interpreting it as a reversal pattern.
🔄 4. Double Bottom
Price tests a similar support area twice and fails to move lower. Again, confirmation is important.
📈 5. Head & Shoulders
A three-peak structure where the middle peak is higher than the others. Traders often watch the neckline for confirmation.
📉 6. Falling / Rising Wedge
Price moves within converging trendlines. These patterns can provide useful context, but the eventual breakout direction should not simply be assumed.
🧠 Remember
A chart pattern is not a prediction machine.
Before acting on any pattern, consider:
📊 Market structure
📈 Volume
💧 Liquidity
🎯 Key support/resistance
🧠 Overall market sentiment
The same pattern can produce different outcomes depending on the broader market environment.
Learn the pattern first. Then learn how to confirm it.
Which chart pattern do you find easiest to understand?
Educational content only. Not financial advice.
Follow for daily crypto insights 📊
#BinanceSquare #cryptoeducation #chartpatterns #TechnicalAnalysis #priceaction
Chart patterns can help traders organize what price is doing—but no pattern guarantees what happens next.
Here are some common patterns beginners should understand:
🔺 1. Triangle
Price moves within a narrowing range as buyers and sellers become more balanced. A breakout can occur in either direction.
🟦 2. Rectangle
Price moves between relatively clear support and resistance areas, creating a consolidation range.
🔄 3. Double Top
Price tests a similar resistance area twice and fails to break through. Confirmation matters before interpreting it as a reversal pattern.
🔄 4. Double Bottom
Price tests a similar support area twice and fails to move lower. Again, confirmation is important.
📈 5. Head & Shoulders
A three-peak structure where the middle peak is higher than the others. Traders often watch the neckline for confirmation.
📉 6. Falling / Rising Wedge
Price moves within converging trendlines. These patterns can provide useful context, but the eventual breakout direction should not simply be assumed.
🧠 Remember
A chart pattern is not a prediction machine.
Before acting on any pattern, consider:
📊 Market structure
📈 Volume
💧 Liquidity
🎯 Key support/resistance
🧠 Overall market sentiment
The same pattern can produce different outcomes depending on the broader market environment.
Learn the pattern first. Then learn how to confirm it.
Which chart pattern do you find easiest to understand?
Educational content only. Not financial advice.
Follow for daily crypto insights 📊
#BinanceSquare #cryptoeducation #chartpatterns #TechnicalAnalysis #priceaction