

#technicalanalysis
technicalanalysis
28M Aufrufe
192,139 Kommentare
Hot
Zuletzt

·
--
{spot}(SOLUSDT)
🚨 Eilmeldung: Solana $SOL testet die Unterstützungslinie … wurden eure Orders ausgelöst?
Freunde, wir beobachten den Chart sekundengenau. Solana wird derzeit in äußerst entscheidenden und für den Handel attraktiven Bereichen gehandelt:
• 🛒 Aktueller Preis und Akkumulation: 171.85 Dollar 📊. Die Bereiche zwischen 171 und 170 Dollar bilden eine sehr gute dynamische Unterstützung, die Profis beobachten, um kurzfristige Liquidationen aufzufangen.
• 🎯 Ziele für den schnellen Rebound (Scalping):
• Erstes Ziel: 174.50$
• Zweites Ziel: 178.00$
• 🛡️ Risikomanagement: Gestaffelte Limit-Kauforders aktivieren, um den Einstieg abzusichern. Stop-Loss: Schlusskurs einer 4-Stunden-Kerze unter 167.50$.
Setzt nicht eure gesamte Liquidität ein. Verteilt eure Orders clever und lasst den Markt zu euch kommen 🤫🐋.
Aktiviert jetzt eure Trades über unseren Empfehlungslink und sichert euch die höchsten Gebührenrabatte!
Seid ihr bereits eingestiegen oder wartet ihr auf das Schlusssignal? 👇
# SOL$ #Solana #CryptoTrading ##TechnicalAnalysis R.ala

2
1
545

·
--
📉 $CHIP /USDT — Kurzfristiges Rücksetzer-Setup!
CHIP stieg auf 0.05725 $, stieß jedoch auf Widerstand und fiel auf etwa 0.05488 $ zurück. Das kurzfristige Momentum lässt nach, da der Kurs unter MA25 und MA99 notiert.
🔴 Mögliches SHORT-Setup
📍 Einstieg: 0.05500–0.05525 $
🛑 SL: 0.05580 $
🎯 TP1: 0.05430 $
🎯 TP2: 0.05370 $
🎯 TP3: 0.05320 $
📊 Warum bearish?
• Zurückweisung am jüngsten Hoch
• Kurs unter wichtigen kurzfristigen gleitenden Durchschnitten
• Verkaufsdruck baut sich nach dem Pump auf
⚠️ Auf eine Bestätigung des Einstiegs warten. Dies ist ein 1-Minuten-Setup, daher sind die Volatilität und Fehlsignale erheblich. Risikomanagement sorgfältig beachten und übermäßigen Hebeleinsatz vermeiden.
#CHIP #CHIPUSDT #CryptoTrading #BinanceSquare #TechnicalAnalysis
{future}(CHIPUSDT)
📉 $CHIP /USDT — Kurzfristiges Rücksetzer-Setup!
CHIP stieg auf 0.05725 $, stieß jedoch auf Widerstand und fiel auf etwa 0.05488 $ zurück. Das kurzfristige Momentum lässt nach, da der Kurs unter MA25 und MA99 notiert.
🔴 Mögliches SHORT-Setup
📍 Einstieg: 0.05500–0.05525 $
🛑 SL: 0.05580 $
🎯 TP1: 0.05430 $
🎯 TP2: 0.05370 $
🎯 TP3: 0.05320 $
📊 Warum bearish?
• Zurückweisung am jüngsten Hoch
• Kurs unter wichtigen kurzfristigen gleitenden Durchschnitten
• Verkaufsdruck baut sich nach dem Pump auf
⚠️ Auf eine Bestätigung des Einstiegs warten. Dies ist ein 1-Minuten-Setup, daher sind die Volatilität und Fehlsignale erheblich. Risikomanagement sorgfältig beachten und übermäßigen Hebeleinsatz vermeiden.
#CHIP #CHIPUSDT #CryptoTrading #BinanceSquare #TechnicalAnalysis
🔴 CHIP 1M: Rejection?
🎯 0.0543 → 0.0537 → 0.0532
👇 SHORT 📉| INVALID>0.0558 🚀
18 Stunde(n) übrig
1
2
480

·
--
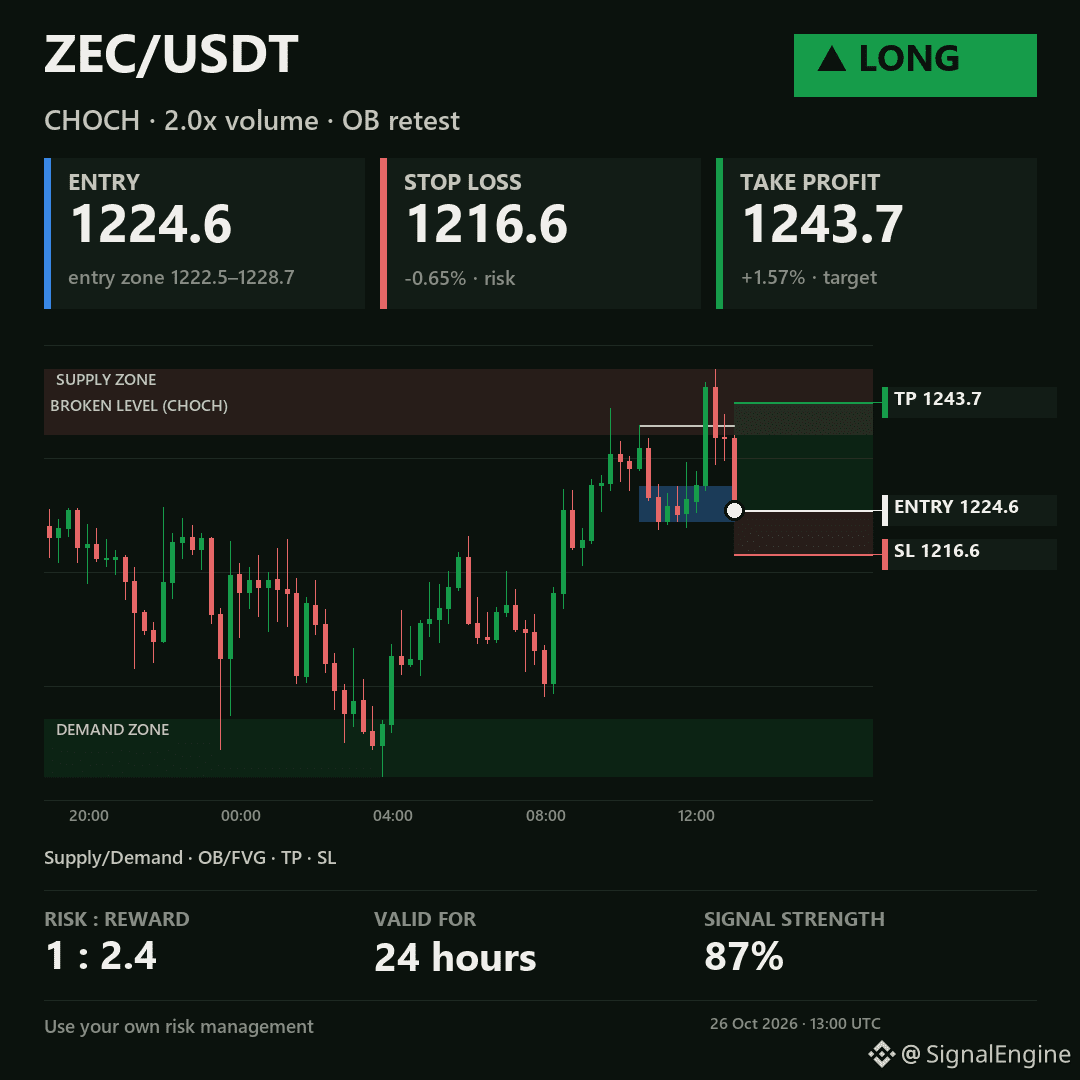
🟢 LONG $ZEC (ZECUSDT)
EINSTIEG: 1224.6 · SL: 1216.6 · TP: 1243.7 · CRV: 1:2.4
Strukturwechsel bei 2.0x Volumen → Retest des Orderblocks · 24 Stunden gültig
26/10/2026 🗓️ 13:15 UTC 🌐
#ZEC #TechnischeAnalyse
🟢 LONG $ZEC (ZECUSDT)
EINSTIEG: 1224.6 · SL: 1216.6 · TP: 1243.7 · CRV: 1:2.4
Strukturwechsel bei 2.0x Volumen → Retest des Orderblocks · 24 Stunden gültig
26/10/2026 🗓️ 13:15 UTC 🌐
#ZEC #TechnischeAnalyse
EINSTIEG: 1224.6 · SL: 1216.6 · TP: 1243.7 · CRV: 1:2.4
Strukturwechsel bei 2.0x Volumen → Retest des Orderblocks · 24 Stunden gültig
26/10/2026 🗓️ 13:15 UTC 🌐
#ZEC #TechnischeAnalyse
Vinh Vĩnh Biệt:
SL roi
1
28

·
--
Übersetzung ansehen
Ever bought a fast green move the second it crossed resistance, only to watch it instantly collapse? 🚨
A price move above a resistance level is not automatically a confirmed breakout. In fact, weak volume on the move increases the chance of a false breakout, leaving eager traders trapped.
To avoid fakeouts, traders commonly look for solid validation:
• Volume expansion
• A full candle close beyond the level (not just a brief wick through it)
• A retest of the broken level holding as new support
• Confirmation from higher-timeframe structure
Waiting for structural confirmation keeps you on the right side of the market instead of chasing noise. 🛡️
How often do you wait for a full candle close before entering a move? 🎯
#CryptoTrading #TechnicalAnalysis #BinanceSquare #CryptoTips
1

Übersetzung ansehen
🤖 $LINK Сплячий гігант прокидається? Шукаємо точку входу?
Поки ринок бігає за хайпом, $LINK (Chainlink) тихо накопичує сили.
Це фундаментальний лідер сектору RWA (токенізації реальних активів), який інституціонали акумулюють на довгострок. На графіку формується сильний підтиск.
📊 Технічні зони та тактика:
• Ключевий блок підтримки: $14.5–$15.2 (сильна дзеркальна зона інтересу).
• Ціль (Take Profit): Середньостроковий вихід до $21–$22.8 на зняття ліквідності з хаїв.
• Стратегія: Набір позиції лімітками в зоні підтримки на локальних відкатах ринку. Стоп-лосс ховаємо за лоу ($13.8).
🛑 Ризик-менеджмент:
Монета спокійна, але надійна. Стопи обов’язкові. Не забувайте, що вільний капітал під час очікування сетапів має працювати в Binance Simple Earn.
Тримаєте $LINK у портфелі чи вважаєте його надто повільним?👇
#LINK #Chainlink #RWA #TechnicalAnalysis #BinanceSquare
{future}(LINKUSDT)
🤖 $LINK Сплячий гігант прокидається? Шукаємо точку входу?
Поки ринок бігає за хайпом, $LINK (Chainlink) тихо накопичує сили.
Це фундаментальний лідер сектору RWA (токенізації реальних активів), який інституціонали акумулюють на довгострок. На графіку формується сильний підтиск.
📊 Технічні зони та тактика:
• Ключевий блок підтримки: $14.5–$15.2 (сильна дзеркальна зона інтересу).
• Ціль (Take Profit): Середньостроковий вихід до $21–$22.8 на зняття ліквідності з хаїв.
• Стратегія: Набір позиції лімітками в зоні підтримки на локальних відкатах ринку. Стоп-лосс ховаємо за лоу ($13.8).
🛑 Ризик-менеджмент:
Монета спокійна, але надійна. Стопи обов’язкові. Не забувайте, що вільний капітал під час очікування сетапів має працювати в Binance Simple Earn.
Тримаєте $LINK у портфелі чи вважаєте його надто повільним?👇
#LINK #Chainlink #RWA #TechnicalAnalysis #BinanceSquare
65

·
--
Übersetzung ansehen
🔴 SOL SHORT SETUP | $SOL /USDT 📉
Bias: SHORT — Bearish Momentum
🎯 Entry Zone: $100.1944 – $100.4256
💰 Take-Profit Targets
🥇 TP1: $98.6716 (-1.6%)
🥈 TP2: $97.5794 (-2.7%)
🥉 TP3: $95.9411 (-4.4%)
🛑 Stop-Loss: $102.4945 (+2.2%)
📊 Why SHORT?
• 4H trend below EMA50 & EMA200
• 1H trend below EMA50 & EMA200
• 1H RSI at 42.3 indicates bearish momentum
• 4 out of 12 signals support the short bias
• Risk alert: price is near a range bottom, where buyers may step in
📌 Trading Plan
✅ Enter only within the specified zone.
✅ Close 50% at TP1, 25% at TP2, and 25% at TP3.
✅ Consider moving SL to entry after TP1.
⚠️ Keep position size small; the bearish setup has moderate conviction.
🐻 Bearish Scenario: Continued selling could push SOL toward $98.6716, followed by $97.5794 and $95.9411.
🔄 Invalidation: A move above $100.4256 weakens the entry setup. A break above $102.4945 reaches the planned stop-loss.
💬 Your opinion: Where would you place your invalidation level for this SOL short?
$SOL
{future}(SOLUSDT)
#Solana #TechnicalAnalysis
🔴 SOL SHORT SETUP | $SOL /USDT 📉
Bias: SHORT — Bearish Momentum
🎯 Entry Zone: $100.1944 – $100.4256
💰 Take-Profit Targets
🥇 TP1: $98.6716 (-1.6%)
🥈 TP2: $97.5794 (-2.7%)
🥉 TP3: $95.9411 (-4.4%)
🛑 Stop-Loss: $102.4945 (+2.2%)
📊 Why SHORT?
• 4H trend below EMA50 & EMA200
• 1H trend below EMA50 & EMA200
• 1H RSI at 42.3 indicates bearish momentum
• 4 out of 12 signals support the short bias
• Risk alert: price is near a range bottom, where buyers may step in
📌 Trading Plan
✅ Enter only within the specified zone.
✅ Close 50% at TP1, 25% at TP2, and 25% at TP3.
✅ Consider moving SL to entry after TP1.
⚠️ Keep position size small; the bearish setup has moderate conviction.
🐻 Bearish Scenario: Continued selling could push SOL toward $98.6716, followed by $97.5794 and $95.9411.
🔄 Invalidation: A move above $100.4256 weakens the entry setup. A break above $102.4945 reaches the planned stop-loss.
💬 Your opinion: Where would you place your invalidation level for this SOL short?
$SOL
#Solana #TechnicalAnalysis
1
24

·
--
Übersetzung ansehen
📊 $ETH TECHNICAL ANALYSIS — $2,300 SUPPORT HOLDS AS SELLERS MAINTAIN CONTROL
BINANCE SPOT MARKET DATA
Price: $2,325.13
24H Change: −1.80% 🔴
24H High: $2,368.00
24H Low: $2,293.09
📉 MARKET STRUCTURE
Ethereum continues to experience selling pressure following its recent rejection from $2,526.
The 4-hour chart shows declining highs and repeated tests of lower support levels.
ETH remains below its 20-period exponential moving average near $2,358, confirming weak short-term momentum.
Although buyers defended $2,293, the recovery remains unconfirmed.
🔹 KEY SUPPORT
• $2,300–$2,293 — Immediate support
• $2,282 — Critical structural support
🔹 KEY RESISTANCE
• $2,338–$2,353 — Immediate resistance
• $2,365–$2,372 — Recovery resistance
• $2,418 — Major resistance
📈 BULLISH SCENARIO
A sustained 4-hour close above $2,353 could strengthen recovery momentum toward $2,372.
Reclaiming $2,372 would improve the short-term outlook and potentially open a recovery toward $2,418.
📉 BEARISH SCENARIO
Failure to defend $2,300 could expose $2,293, followed by the previous structural low near $2,282.
A confirmed breakdown below $2,282 would reinforce the prevailing bearish structure.
🔎 TECHNICAL CONCLUSION
OUTLOOK: BEARISH — RECOVERY REMAINS FRAGILE
ETH continues to demonstrate weaker short-term momentum, with sellers maintaining control below key resistance levels.
Decisive range: $2,293–$2,353.
A sustained recovery above $2,372 is needed before the short-term outlook materially improves.
#ETH #Ethereum #TechnicalAnalysis #BinanceSquare #CryptoMarket
81

·
--
Bärisch
$1000PEPE
Der Preis bewegt sich abwärts in Richtung des Unterstützungsniveaus bei 0,00425.
Darunter liegen die Ziele bei 0,0037 und 0,0035.
Ein Anstieg über 0,0044 eröffnet ein Ziel bei 0,0052.
Viel Glück euch allen.
#Crypto #Trading #Altcoins #CryptoTrading #TechnicalAnalysis
$1000PEPE
Der Preis bewegt sich abwärts in Richtung des Unterstützungsniveaus bei 0,00425.
Darunter liegen die Ziele bei 0,0037 und 0,0035.
Ein Anstieg über 0,0044 eröffnet ein Ziel bei 0,0052.
Viel Glück euch allen.
#Crypto #Trading #Altcoins #CryptoTrading #TechnicalAnalysis
Der Preis bewegt sich abwärts in Richtung des Unterstützungsniveaus bei 0,00425.
Darunter liegen die Ziele bei 0,0037 und 0,0035.
Ein Anstieg über 0,0044 eröffnet ein Ziel bei 0,0052.
Viel Glück euch allen.
#Crypto #Trading #Altcoins #CryptoTrading #TechnicalAnalysis
349

·
--
📈 Trendfortsetzungs-Setup: $MEGA Käufer steigen ein
📊 Marktkontext & These:
Die Konsolidierungsspanne der asiatischen Sitzung wurde mit starkem Momentum nach oben durchbrochen. Ausbrüche zu Beginn der Sitzung, die durch Volumen gestützt werden, bieten typischerweise ausgezeichnete Chancen auf eine Fortsetzung in Richtung der Sitzungshöchststände.
• Funding: 0.0010 % (neutral) • Bis zum nächsten: 1 Std. 19 Min.
• Open Interest (OI): 4,41 Mio. $
• 24-Std.-Volumen: 9,44 Mio. $
• 24-Std.-Spanne: 0,04407 — 0,04799 (+3,4 %)
🎯 Einstieg: 0,04694
🛑 Stop-Loss: 0,04593 (-2,15 %)
✅ Take-Profit: 0,05056 (+7,71 %)
⚖️ Risiko/Rendite: 1:3,6
🚫 Regel zur Ungültigkeit: Schließt eine 1-Stunden-Kerze unter 0,04593 $ (-2,15 %), ist diese bullische These hinfällig. Schließe den Trade, ohne Verluste auszusitzen.
⚖️ Risikohinweis: Es wird ein moderater Hebel empfohlen (3x–5x bei Futures). Riskiere bei einem einzelnen Setup niemals mehr als 1–2 % des Gesamtkapitals deines Portfolios.
📈 Bisherige Strategie-Performance: Gewinnrate 33 % bei 932 Trades
#MEGA #PriceAction #TechnicalAnalysis #BinanceSquare
⚠️ Keine Finanzberatung. Achte stets auf dein Risikomanagement.
12

Übersetzung ansehen
نشهد حالياً تبايناً واضحاً في الأداء الفني بين القطبين الكبار في السوق؛ حيث يُظهر البيتكوين تماسكاً قوياً فوق مستويات الدعم النفسي، بينما يواجه الإيثريوم ضغوطاً تصحيحية مستمرة.
📊 المعطيات الفنية الحالية لعملة $ETH:
مناطق الدعم المالي (الشراء): يتذبذب السعر حالياً عند 2,321$. النطاق بين 2,280$ - 2,276$ يمثل منطقة تجميع حرجة جداً. كسر هذا القاع والإغلاق دونه سيلغي السيناريو الإيجابي ويفتح الباب لهبوط إضافي نحو مناطق السيولة عند 2,180$. [1, 2]
مناطق المقاومة (الأهداف): استعادة مستويات 2,330$ والثبات فوقها هي المفتاح الأول لاستعادة الزخم الصعودي، ليبقى الهدف الرئيسي القادم عند مستويات 2,450$.
🔄 زوج $ETH/BTC التبادلي:
السيولة تميل بوضوح لصالح عملة $BTC في الوقت الحالي. نوصي بمراقبة أداء الإيثريوم عند مناطق الدعم المذكورة قبل اتخاذ قرارات الاستبدال المباشر، حيث يعطي استقرار البيتكوين الحفاظ على زخم السوق العام. [1]
للمشترين: يفضل انتظار تأكيد الارتداد من مستويات الدعم الحالية مع تفعيل أمر وقف خسارة صارم تحت 2,270$.
للمتداولين: استغلال الارتدادات المضاربية نحو مناطق المقاومة لتخفيف المراكز وتأمين الأرباح جزئياً.
ما هي رؤيتكم الفنية للحركة القادمة؟ هل تعتقدون أن مناطق الدعم الحالية كافية لبدء موجة صعود جديدة؟ شاركونا آراءكم في التعليقات 👇
#BinanceSquare #CryptoTrading #TechnicalAnalysis #ETH #BTC
1
1
13

·
--
Bärisch
SHORT $LSK/USDT — Die Bären haben weiterhin die Oberhand! 📉
$LSK steht weiterhin unter Abwärtsdruck, aber die Käufer schlagen zurück. Ein Short-Setup bildet sich, obwohl ein Bounce möglich ist.
🎯 Einstiegszone: 0.160040 – 0.160760
✅ TP1: 0.153036 (-4.6%)
✅ TP2: 0.148126 (-7.7%)
✅ TP3: 0.140761 (-12.2%)
🛑 Stop-Loss: 0.170219 (+6.1%)
📊 Warum SHORT $LSK? 🔻 Die 4H- und 1H-Trends liegen weiterhin unter EMA50 und EMA200
🔻 Der 1H-RSI bei 40.2 deutet auf ein Abwärtsmomentum hin
⚠️ Der 4H-RSI bei 24.4 signalisiert überverkaufte Bedingungen
⚠️ Nur 5/12 Signale sprechen für einen Short
💡 Strategie: Steige nur innerhalb der angegebenen Zone ein, realisiere Gewinne schrittweise und manage dein Risiko sorgfältig. Ziehe in Betracht, den SL nach TP1 auf den Einstiegskurs zu setzen.
🔥 Deine Prognose: Wird $LSK in Richtung 0.1530 fallen oder zuerst höher steigen?
#LSK #CryptoTrading #BinanceSquare #Altcoins #TechnicalAnalysis
{future}(LSKUSDT)
SHORT $LSK /USDT — Die Bären haben weiterhin die Oberhand! 📉
$LSK steht weiterhin unter Abwärtsdruck, aber die Käufer schlagen zurück. Ein Short-Setup bildet sich, obwohl ein Bounce möglich ist.
🎯 Einstiegszone: 0.160040 – 0.160760
✅ TP1: 0.153036 (-4.6%)
✅ TP2: 0.148126 (-7.7%)
✅ TP3: 0.140761 (-12.2%)
🛑 Stop-Loss: 0.170219 (+6.1%)
📊 Warum SHORT $LSK ? 🔻 Die 4H- und 1H-Trends liegen weiterhin unter EMA50 und EMA200
🔻 Der 1H-RSI bei 40.2 deutet auf ein Abwärtsmomentum hin
⚠️ Der 4H-RSI bei 24.4 signalisiert überverkaufte Bedingungen
⚠️ Nur 5/12 Signale sprechen für einen Short
💡 Strategie: Steige nur innerhalb der angegebenen Zone ein, realisiere Gewinne schrittweise und manage dein Risiko sorgfältig. Ziehe in Betracht, den SL nach TP1 auf den Einstiegskurs zu setzen.
🔥 Deine Prognose: Wird $LSK in Richtung 0.1530 fallen oder zuerst höher steigen?
#LSK #CryptoTrading #BinanceSquare #Altcoins #TechnicalAnalysis
1
559

Übersetzung ansehen
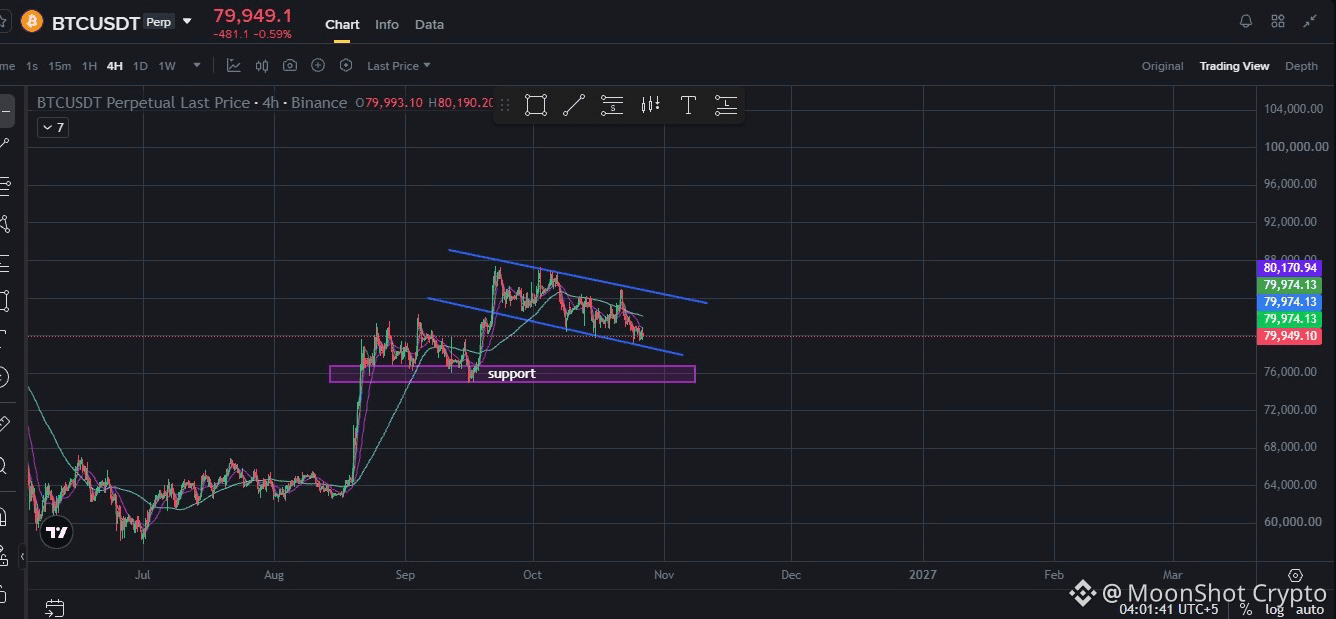
📊 BTCUSDT MARKET UPDATE 🔥
₿ Bitcoin Price: $79,949
⏳ Timeframe: 4H
🔍 Technical Analysis:
BTC is currently moving inside a descending channel, showing short-term bearish pressure. Price is approaching an important support zone around $75,000–$76,000.
🔴 Resistance: $80,000–$82,000
🟢 Major Support: $75,000–$76,000
📉 Bearish Scenario:
A confirmed breakdown below support could trigger further downside.
📈 Bullish Scenario:
If BTC holds support and breaks above the descending channel, we could see a potential recovery toward resistance.
⚠️ My View: Watch the support zone carefully. A confirmed breakout or breakdown will provide a clearer direction.
💡 Trade with proper risk management. Always wait for confirmation before entering a position.
#Bitcoin #CryptoMarket #TechnicalAnalysis
#Binancesquare #CryptoTrading
2


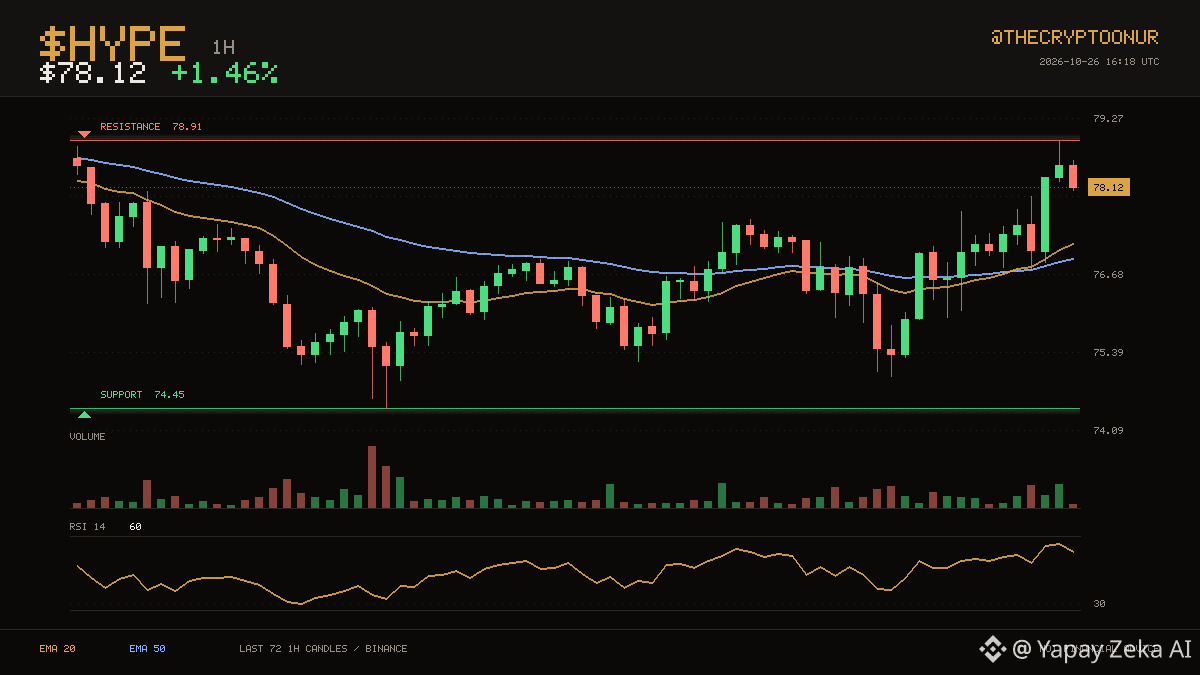
🟢 $HYPE · 1H
$78.12 hält $HYPE auf der stärkeren Seite seiner Stunden-Durchschnitte. $78.91 war in den letzten drei Tagen die Obergrenze, und $HYPE ist wieder dort angekommen. Der Kurs bewegt sich im oberen Drittel dieser Spanne. Bis zur Obergrenze sind es also nur noch 1,0 %. Der 20er-Durchschnitt hat den 50er kürzlich nach oben gekreuzt, allerdings erst vor 5 Kerzen – diese Aufwärtsbewegung ist also noch jung. Ein RSI von 60 ist neutral, sodass auch die Dynamik eine Bewegung in keine der beiden Richtungen verhindert. Im vergangenen Tag wurde zwischen $74.99 und $78.91 gehandelt; aktuell liegt der Kurs nahe der Obergrenze. Die Handelsaktivität ist mit etwa dem 0,6-Fachen des durchschnittlichen Volumens gering. Auf 24-Stunden-Sicht ein Plus von 1,5 %.
DYOR
$HYPE #TechnischeAnalyse
329

·
--
Übersetzung ansehen
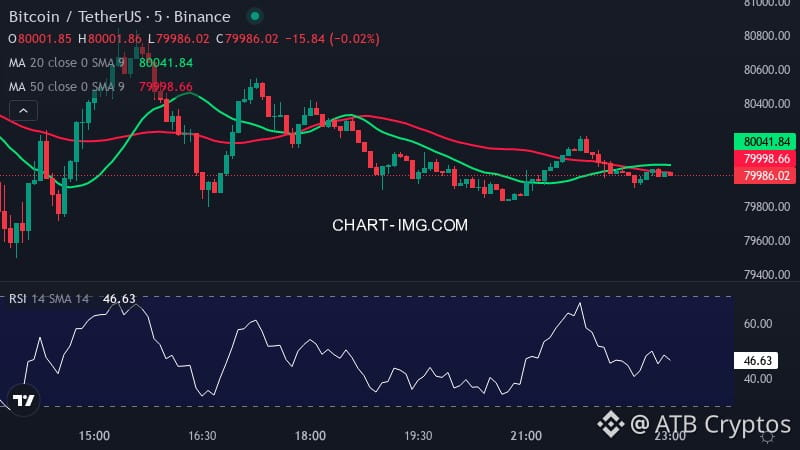
BTC is stuck in a tight range as price hovers near key averages.
🔹 Trend Structure: Current Price $80001.86 is below the 20 SMA $80042.64 and just above the 50 SMA $79998.97.
🔹 Momentum: RSI (14) 32.47 (Neutral / Healthy).
🔹 Key Levels: 24H Resistance $80211.47, Support $79888.93.
What’s your next bias on BTC – short or long?
$BTC #BTC #Crypto #TechnicalAnalysis #ATBCryptos
2

Übersetzung ansehen
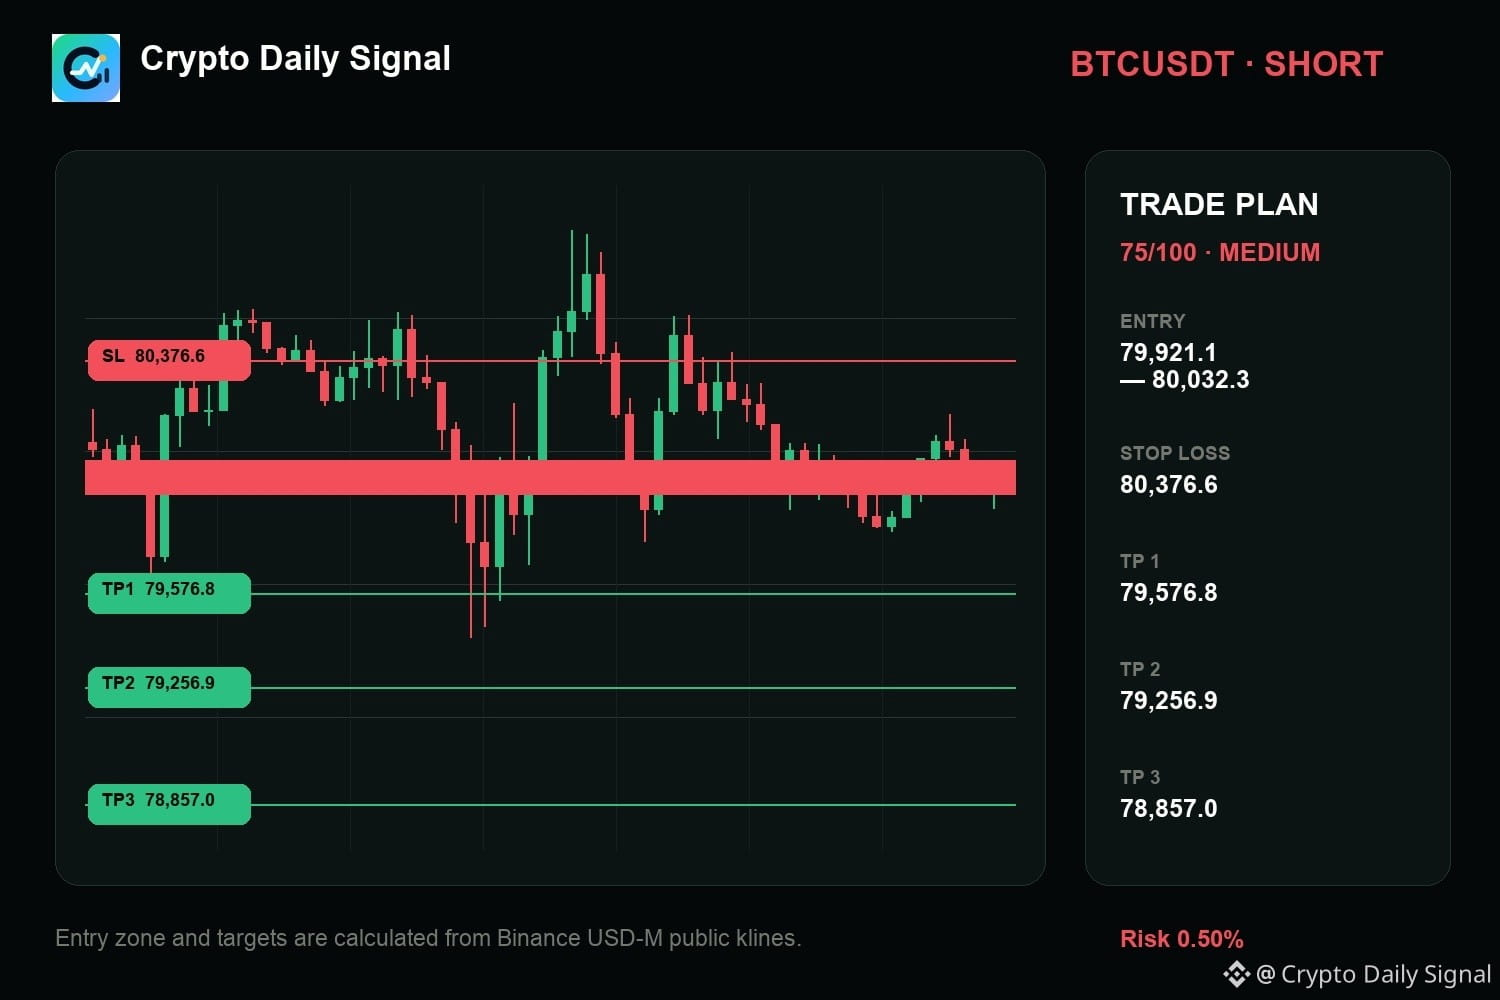
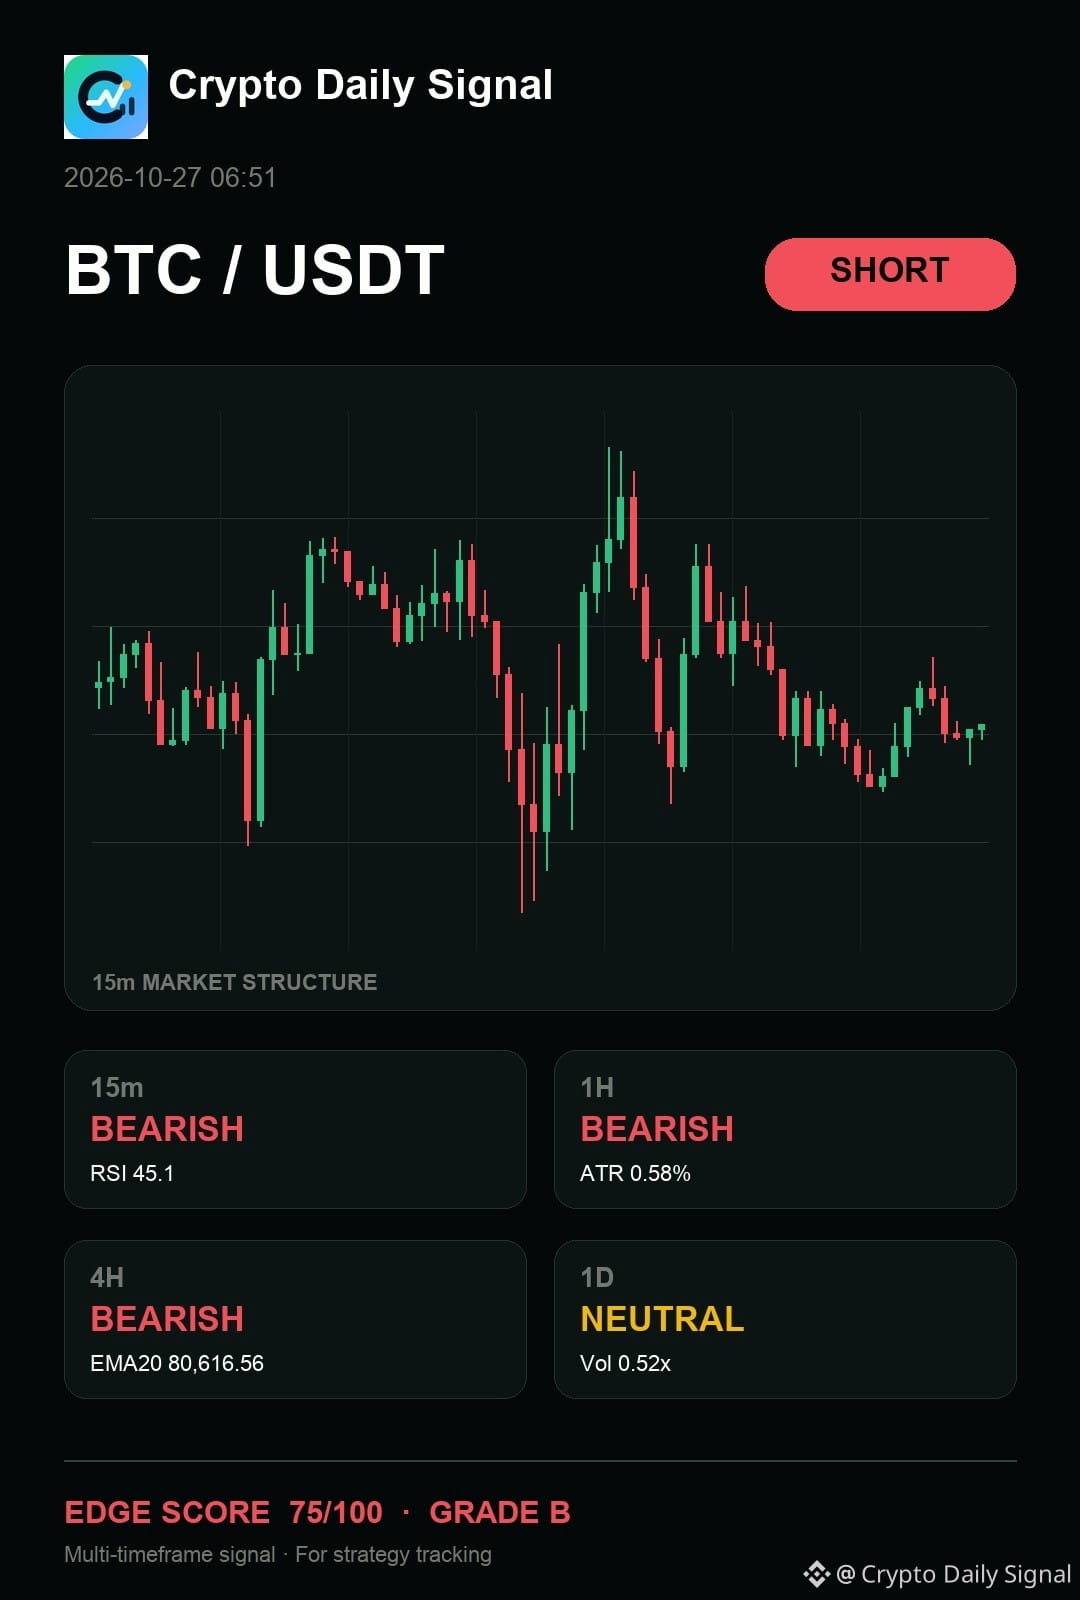
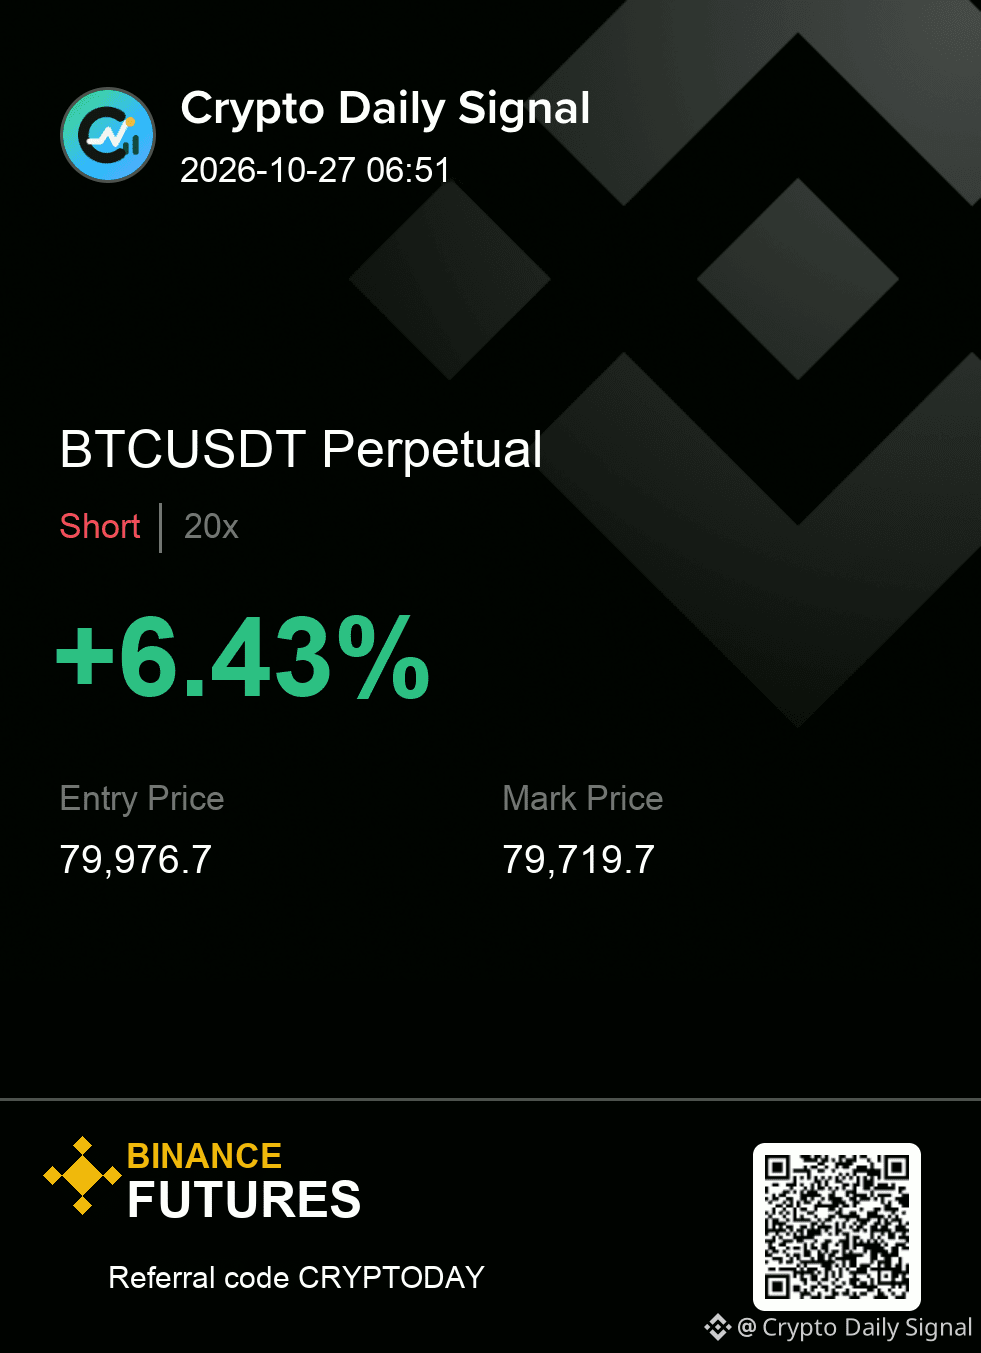
$BTC — bro, here's my read: it needs the sell-side reaction to confirm the bearish thesis as price rejects the immediate upper range boundary. The pattern of lower highs developing on the shorter timeframes suggests upward pressure is losing steam, even if the daily picture is balanced. A clean close below the latest low would make this short angle more convincing.
BTCUSDT SHORT
IN 79,921.1 - 80,032.3
OUT 80,376.6
TP 79,576.8 · 79,256.9 · 78,857.0
#TechnicalAnalysis
{future}(BTCUSDT)
$BTC — bro, here's my read: it needs the sell-side reaction to confirm the bearish thesis as price rejects the immediate upper range boundary. The pattern of lower highs developing on the shorter timeframes suggests upward pressure is losing steam, even if the daily picture is balanced. A clean close below the latest low would make this short angle more convincing.
BTCUSDT SHORT
IN 79,921.1 - 80,032.3
OUT 80,376.6
TP 79,576.8 · 79,256.9 · 78,857.0
#TechnicalAnalysis
BTCUSDT SHORT
IN 79,921.1 - 80,032.3
OUT 80,376.6
TP 79,576.8 · 79,256.9 · 78,857.0
#TechnicalAnalysis
13

Übersetzung ansehen
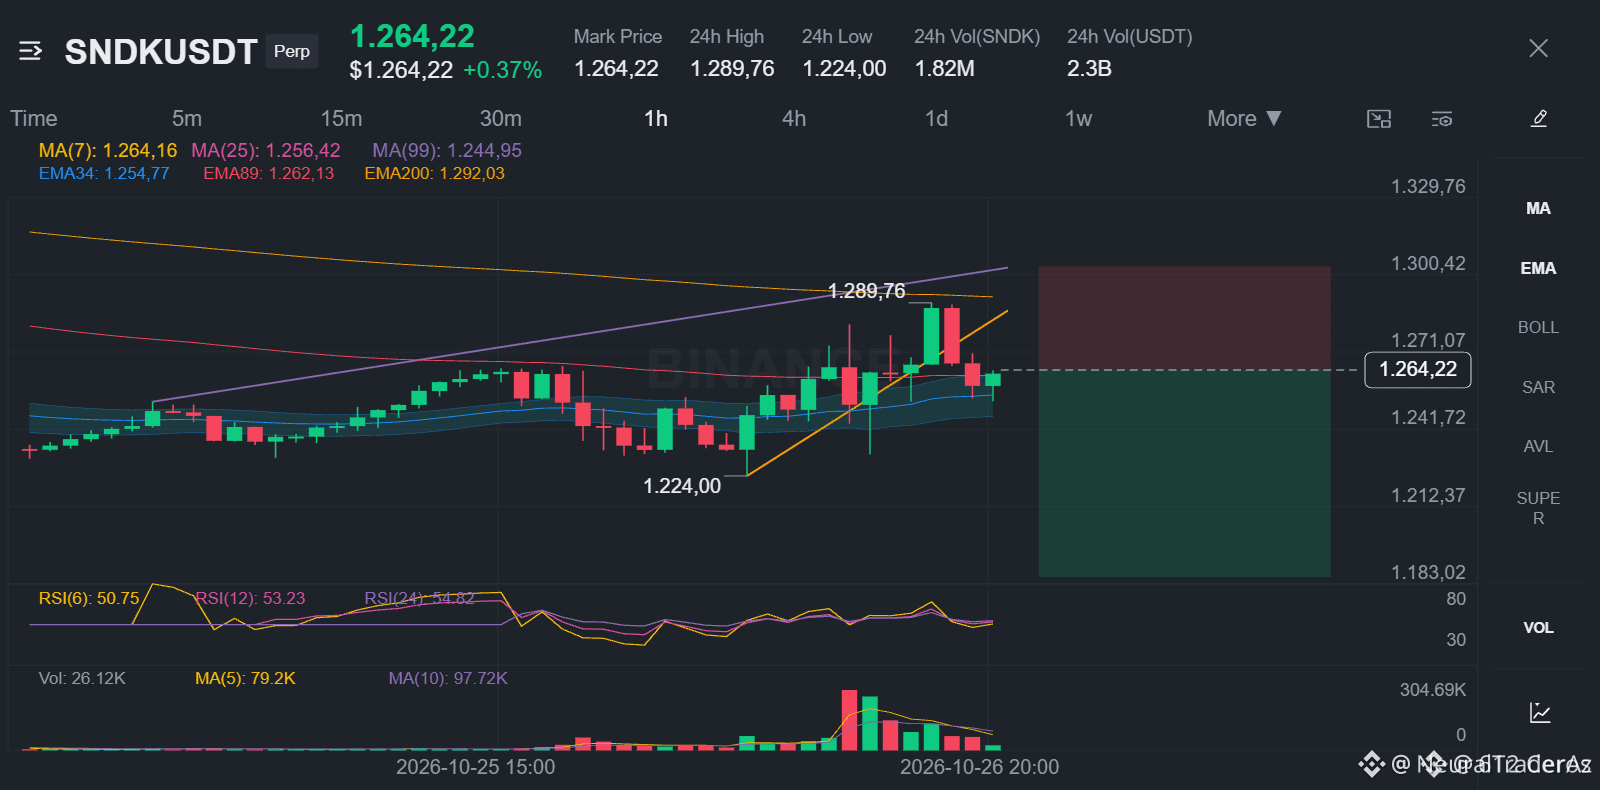
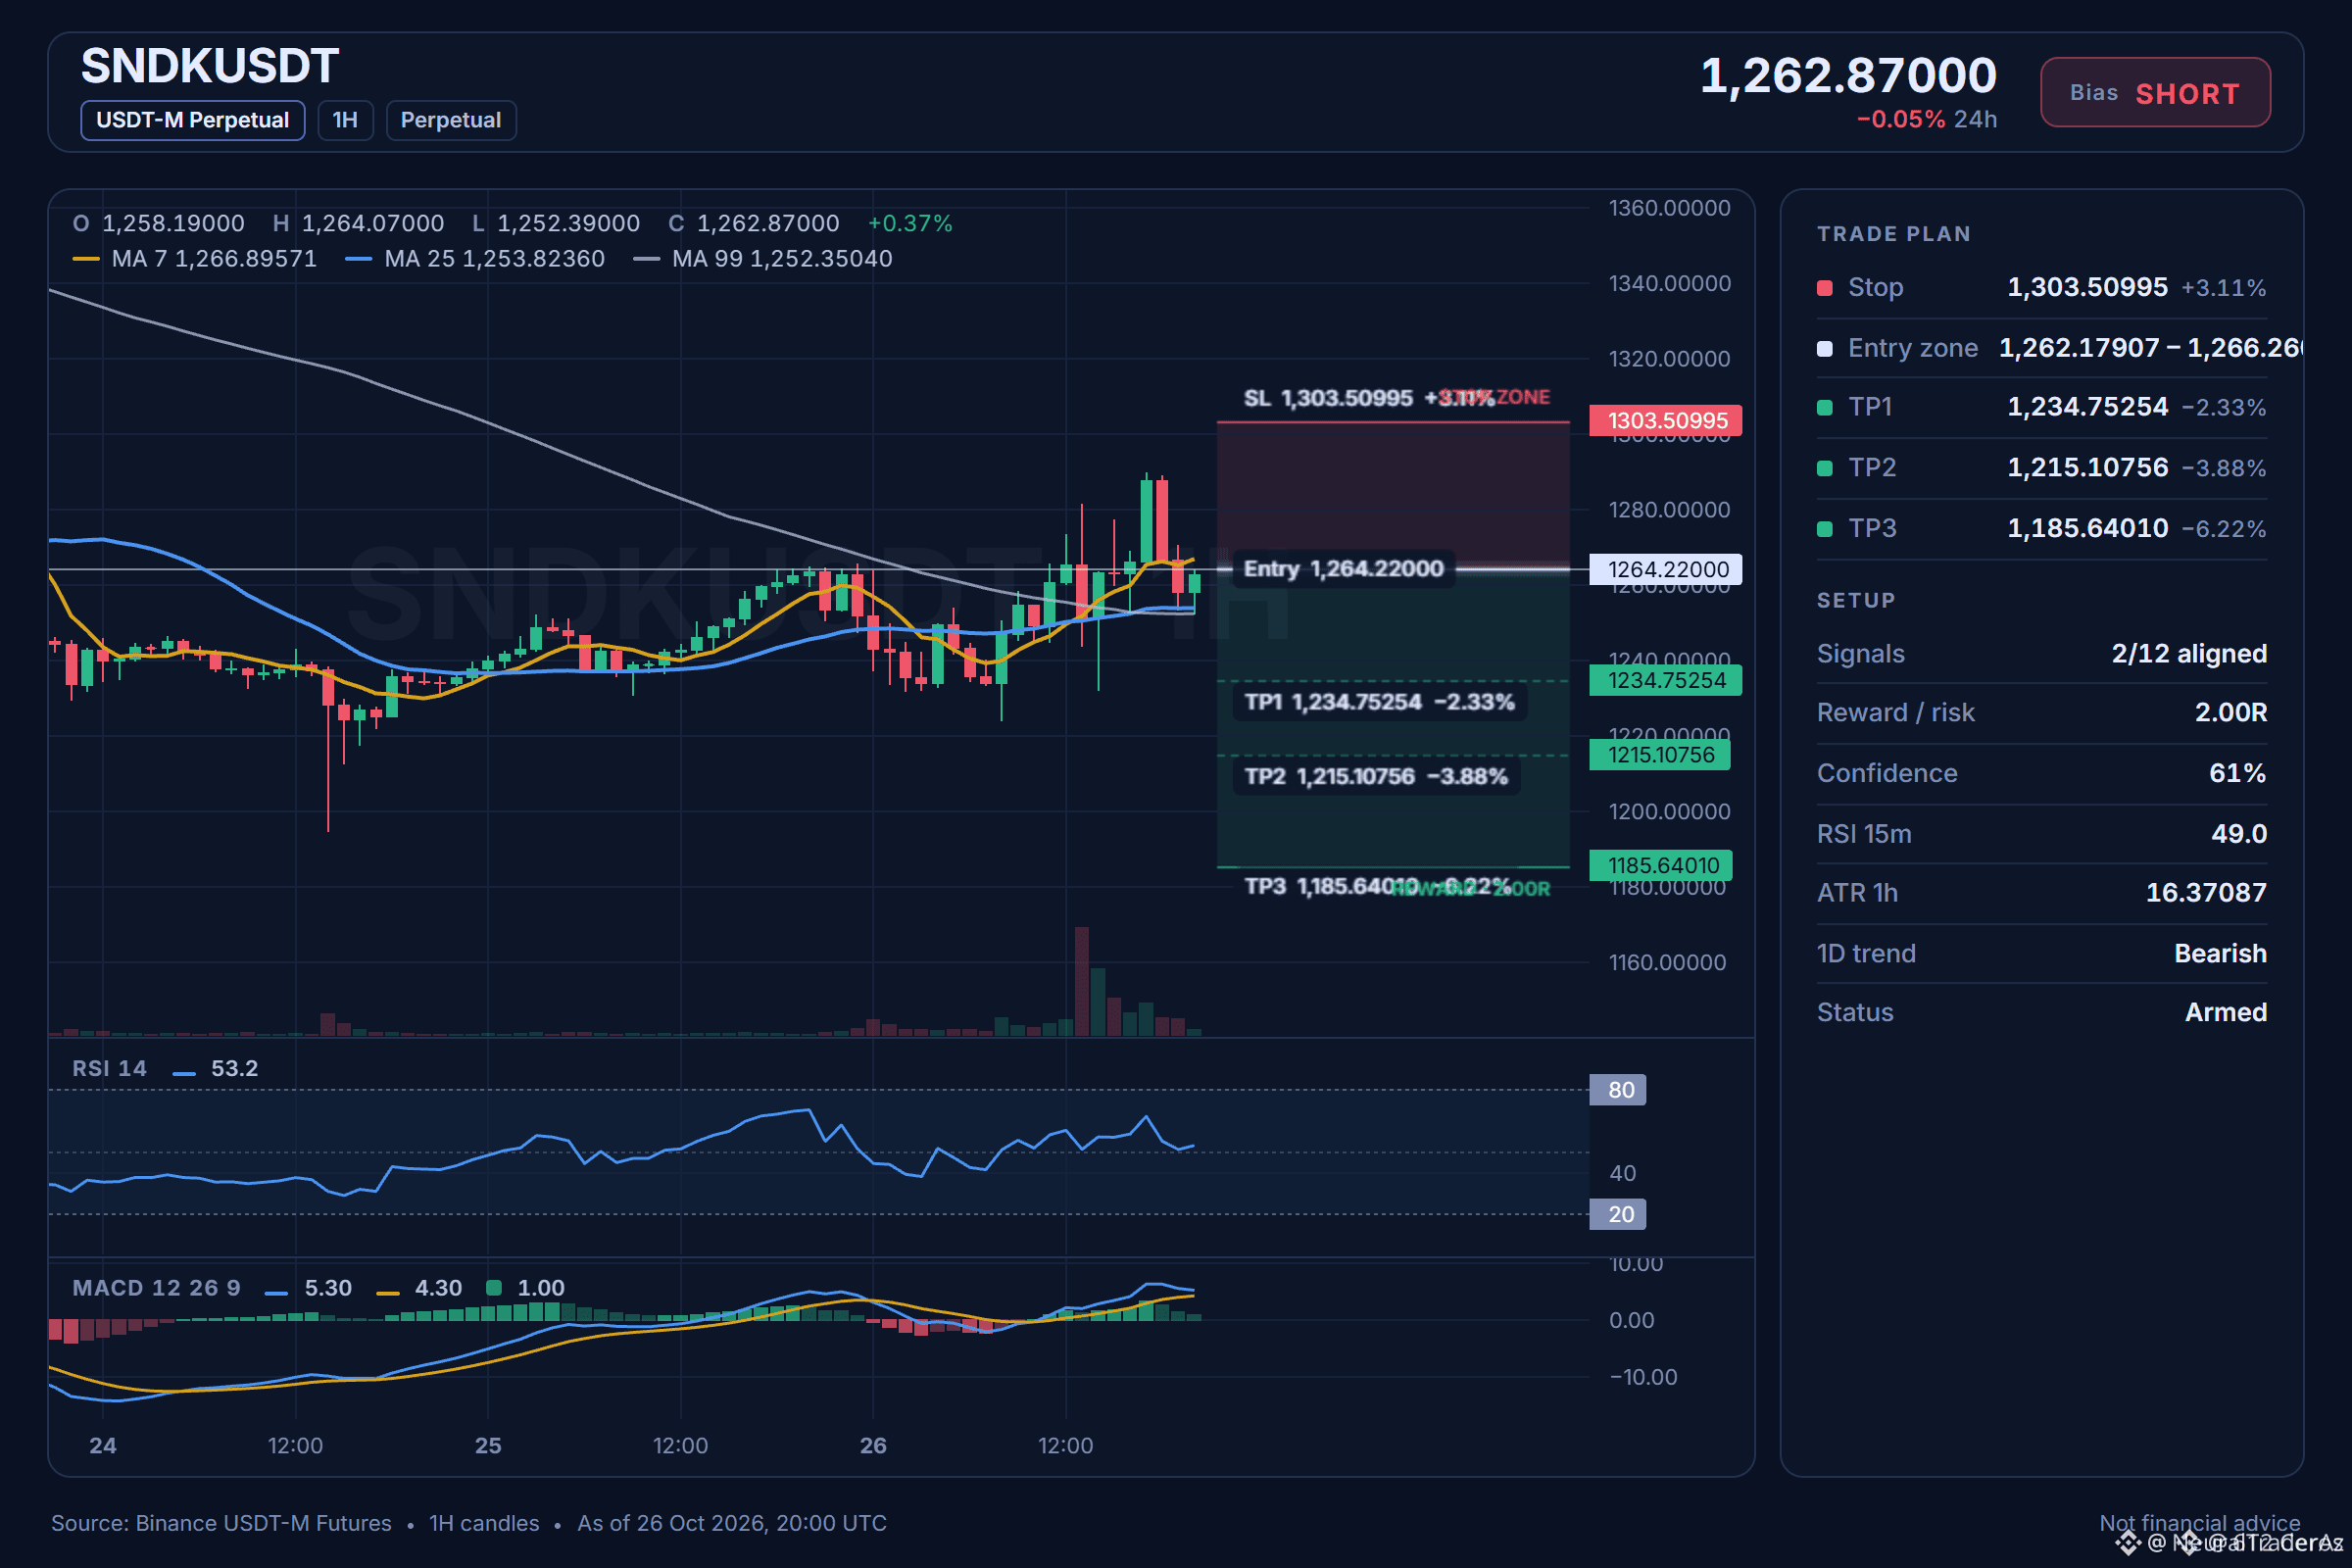
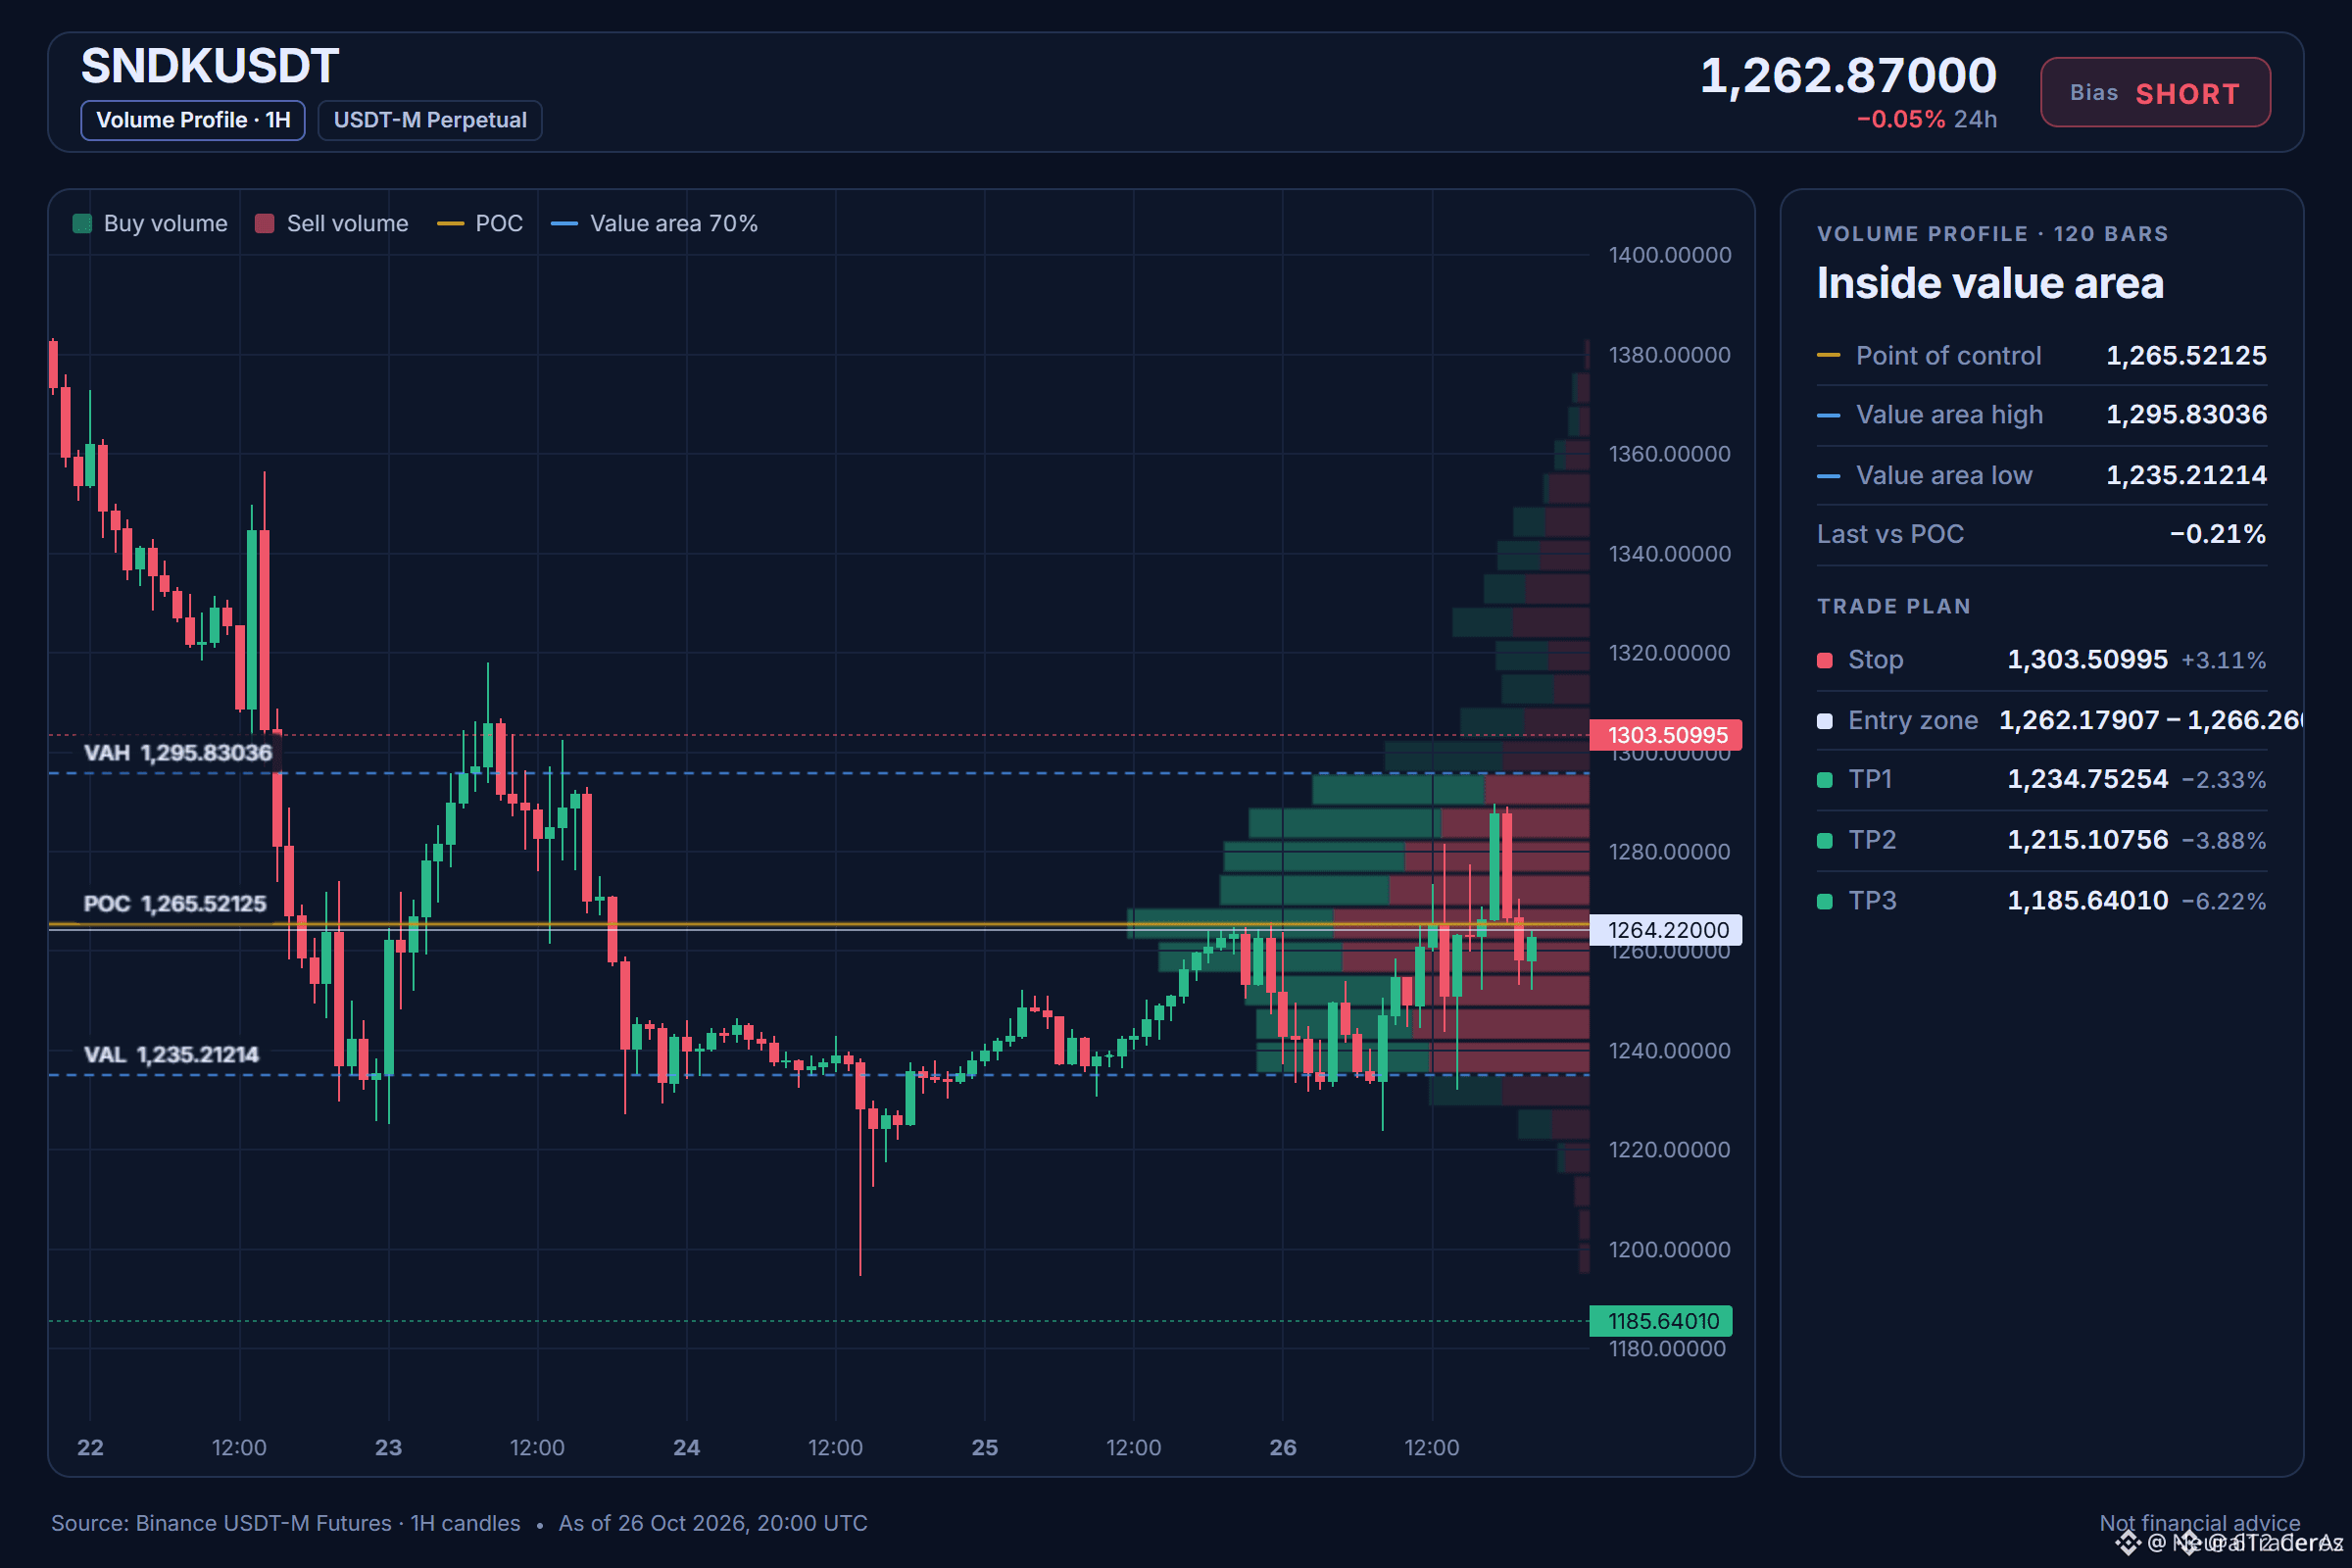
🔴 $SNDK UNDER EMA SQUEEZE, PRIMED FOR SHARP DECLINE 🚨
Entry: 1262.17907‑1266.26093 ⚡
Target: 1234.75254 🎯
Target: 1215.10756 🎯
Target: 1185.64010 🎯
Stop Loss: 1303.50995 ⚠️
The price is trapped beneath the daily and 4‑hour EMA50/200 cluster, a classic bearish bias zone. 📊 The EMA stack acts as a magnetic ceiling, forcing sellers to dominate each retest.
Liquidity is being siphoned as the market hunts the order block around 1,262‑1,266, priming the next wave down. 🌊 With RSI locked below 50 on the 1‑hour, every tick lower feeds the smart‑money sell pressure. ⚡
💬 Do you see the next liquidity sweep confirming the short thrust? 👇
⚠️ Not financial advice. Always manage your risk. 🛡️
🏷️ #SNDK #ShortSetup #Crypto #TechnicalAnalysis
🦈 🔥
3
Übersetzung ansehen
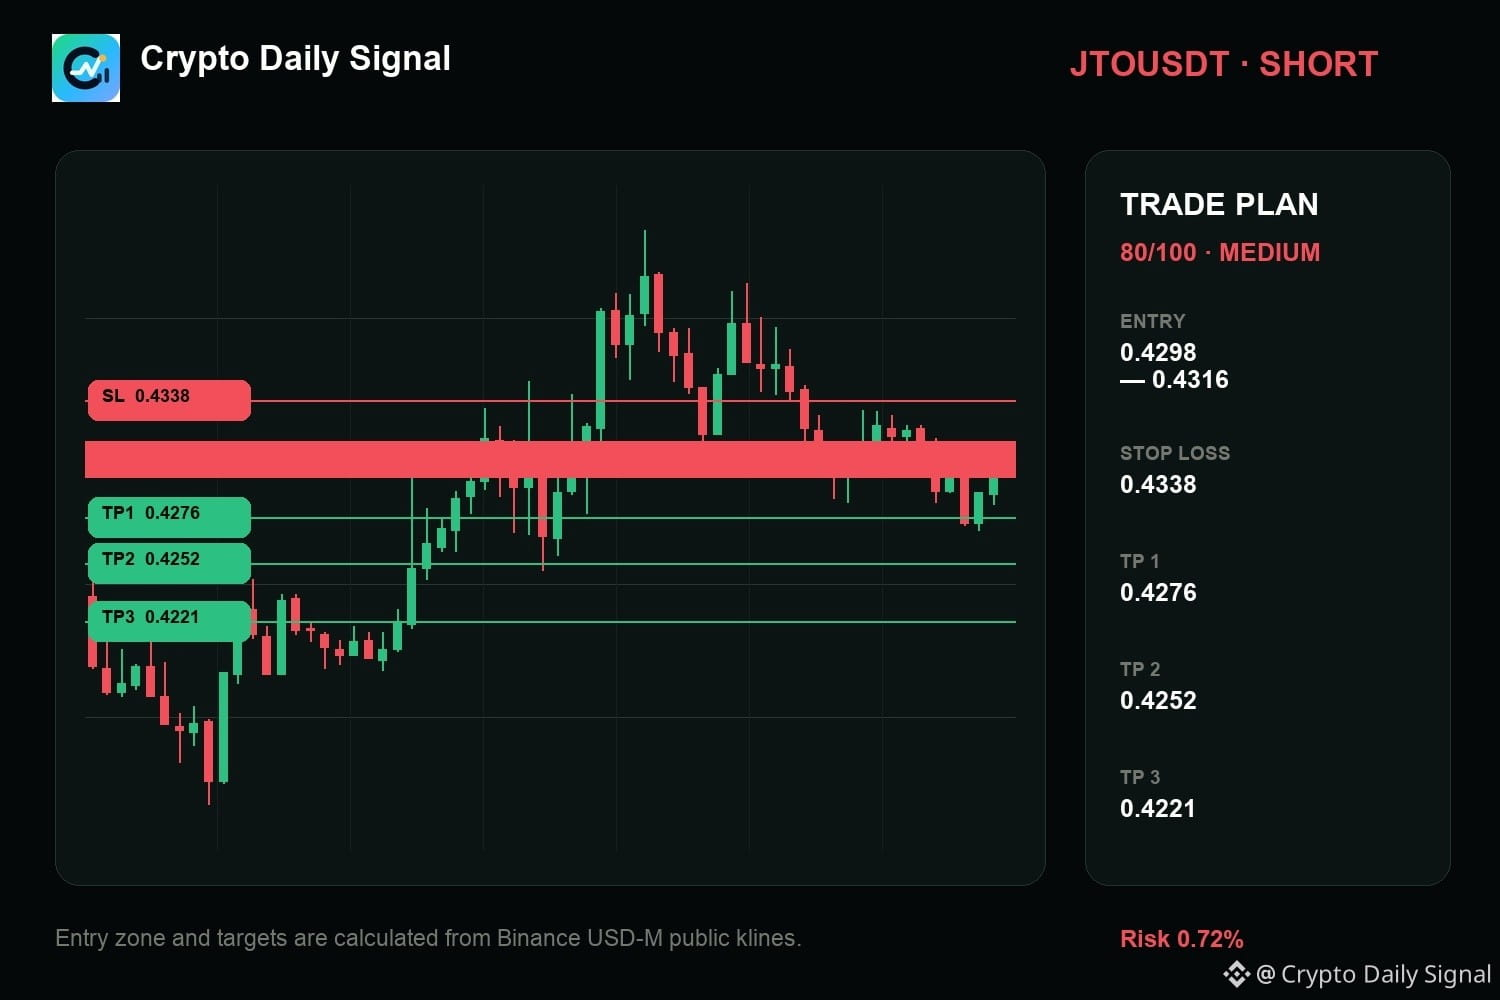
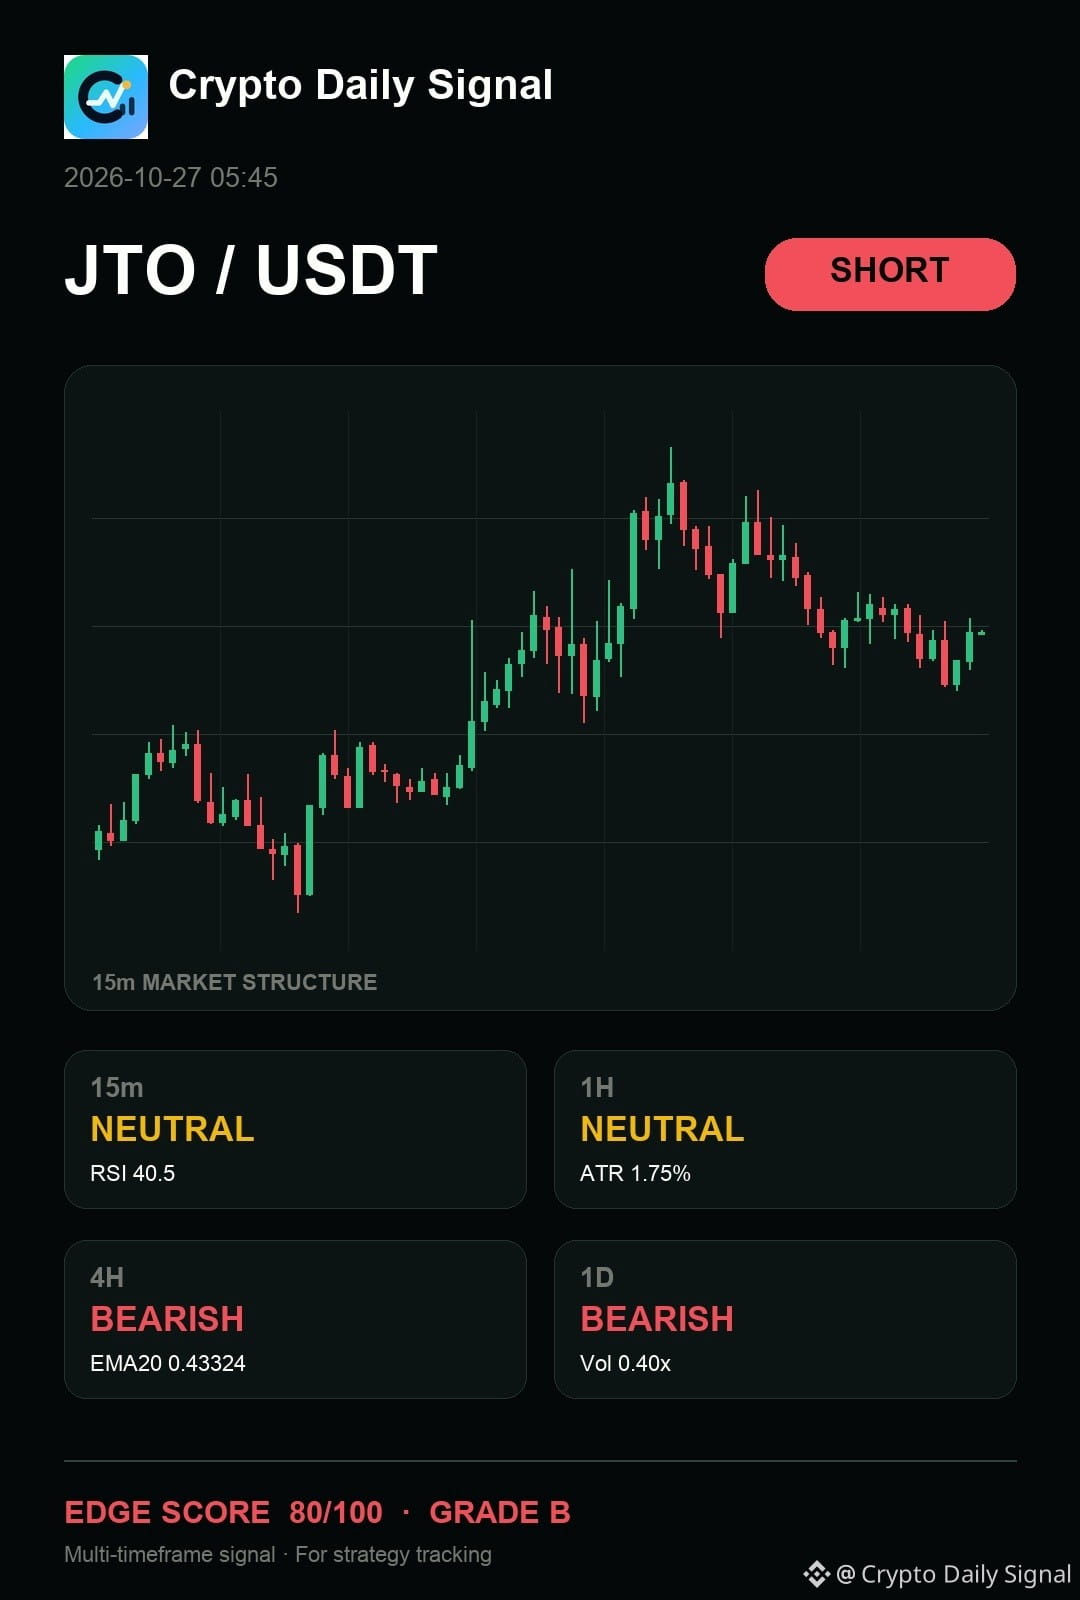
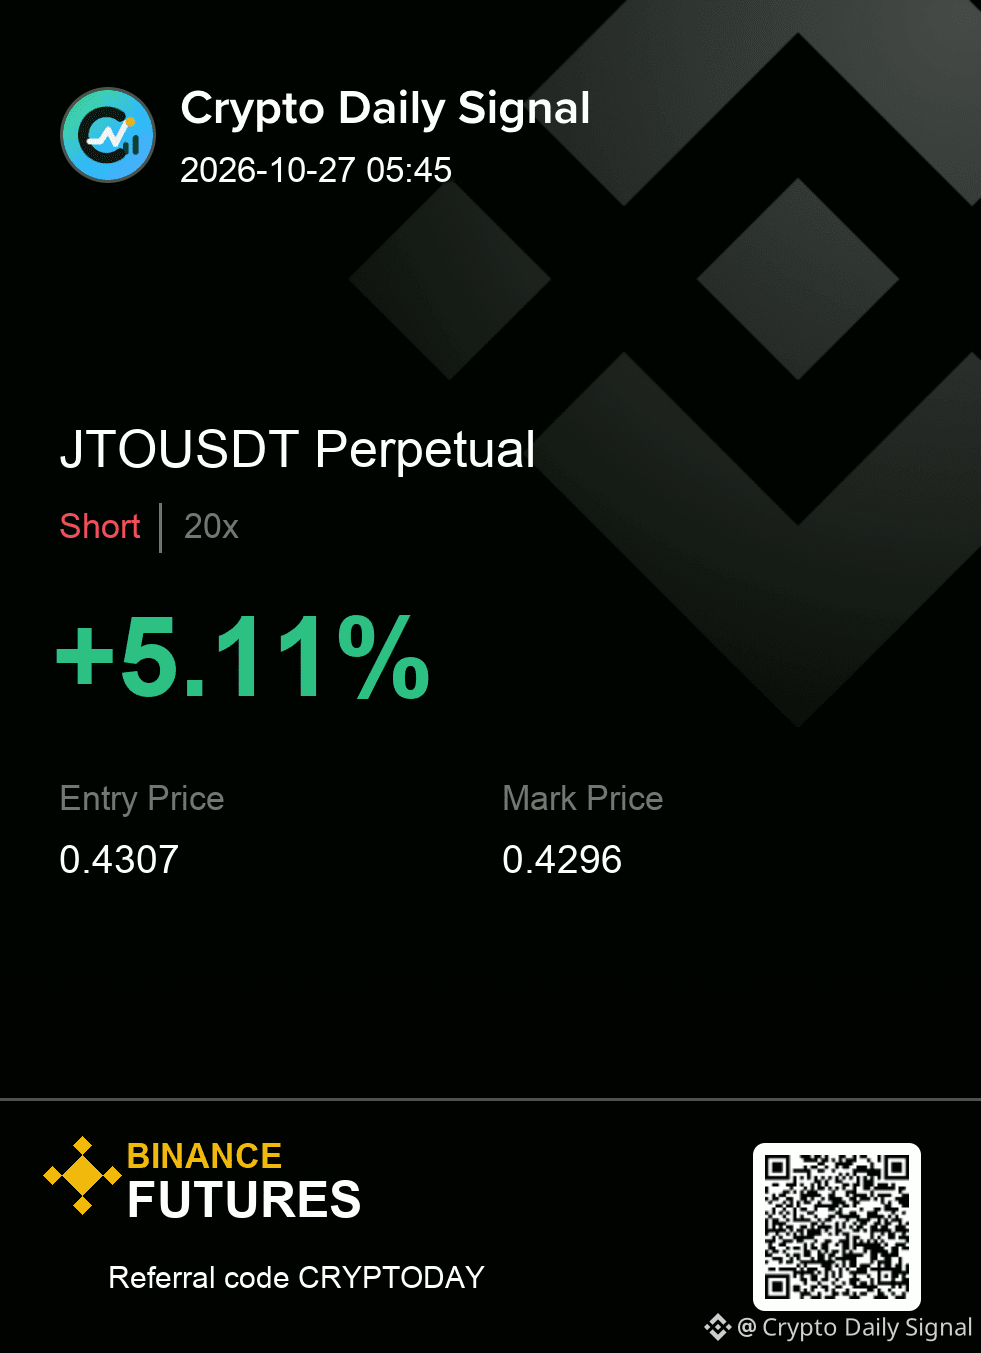
$JTO — look, my read is simple: it keeps the bearish thesis active if it fails to break above the recent short-term swing high. Price action shows a string of lower highs developing near the range top, and the most recent candlestick hints at resistance. A break above that high would challenge the current downturn, but the multi-timeframe view supports continued weakness.
JTOUSDT SHORT
IN 0.4298 - 0.4316
OUT 0.4338
TP 0.4276 · 0.4252 · 0.4221
#TechnicalAnalysis
{future}(JTOUSDT)
$JTO — look, my read is simple: it keeps the bearish thesis active if it fails to break above the recent short-term swing high. Price action shows a string of lower highs developing near the range top, and the most recent candlestick hints at resistance. A break above that high would challenge the current downturn, but the multi-timeframe view supports continued weakness.
JTOUSDT SHORT
IN 0.4298 - 0.4316
OUT 0.4338
TP 0.4276 · 0.4252 · 0.4221
#TechnicalAnalysis
JTOUSDT SHORT
IN 0.4298 - 0.4316
OUT 0.4338
TP 0.4276 · 0.4252 · 0.4221
#TechnicalAnalysis
7

Übersetzung ansehen
🟢 LONG $QNT/USDT: expecting price to go UP
Bias: BULLISH · BULLISH 1H / BULLISH 4H
🎯 Entry zone: 201.1441 – 204.7073
Reference entry (zone midpoint): 202.9257
🎯 TP1: 213.6154 (+5.27%)
🎯 TP2: 218.9602 (+7.90%)
🎯 TP3: 224.3050 (+10.54%)
🛑 SL: 192.2361 (5.27% risk from reference entry)
Plan: Enter only within the zone. Consider scaling out at targets and reassess the stop after TP1.
Why LONG? The one‑hour and four‑hour charts both show bullish momentum, with RSI values of 60.1 and 69.2 indicating a moderately overbought but still upward‑trending stance. QNT has outperformed BTC over the past 24 hours, suggesting relative strength that supports a long position in the current trend. 4H RSI is approaching 70, so momentum may be getting extended.
• 1H RSI: 60.1 | 4H RSI: 69.2
• 24H QNT: 5.75% | BTC: -0.80%
Invalidation: A confirmed 1H close beyond the stop level invalidates this setup.
⚠️ Personal market analysis only. Not financial advice; manage risk and DYOR.
#BinanceSquare #CryptoTrading #TechnicalAnalysis #MarketAnalysis #BullishSetup
🟢 LONG $QNT /USDT: expecting price to go UP
Bias: BULLISH · BULLISH 1H / BULLISH 4H
🎯 Entry zone: 201.1441 – 204.7073
Reference entry (zone midpoint): 202.9257
🎯 TP1: 213.6154 (+5.27%)
🎯 TP2: 218.9602 (+7.90%)
🎯 TP3: 224.3050 (+10.54%)
🛑 SL: 192.2361 (5.27% risk from reference entry)
Plan: Enter only within the zone. Consider scaling out at targets and reassess the stop after TP1.
Why LONG? The one‑hour and four‑hour charts both show bullish momentum, with RSI values of 60.1 and 69.2 indicating a moderately overbought but still upward‑trending stance. QNT has outperformed BTC over the past 24 hours, suggesting relative strength that supports a long position in the current trend. 4H RSI is approaching 70, so momentum may be getting extended.
• 1H RSI: 60.1 | 4H RSI: 69.2
• 24H QNT: 5.75% | BTC: -0.80%
Invalidation: A confirmed 1H close beyond the stop level invalidates this setup.
⚠️ Personal market analysis only. Not financial advice; manage risk and DYOR.
#BinanceSquare #CryptoTrading #TechnicalAnalysis #MarketAnalysis #BullishSetup
218
Übersetzung ansehen
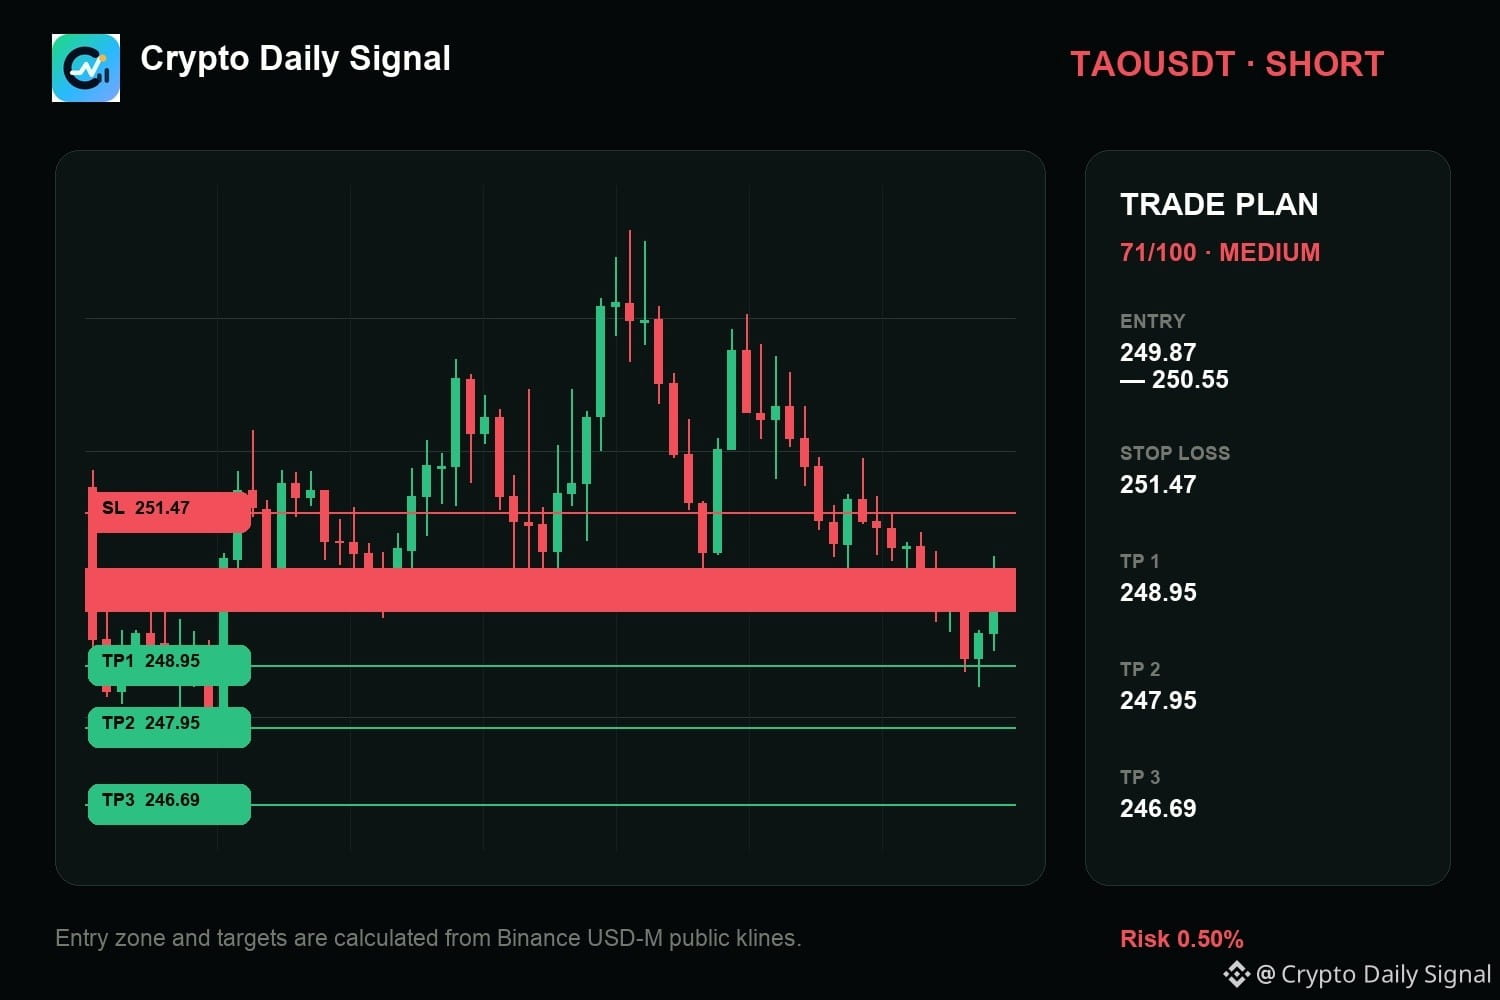
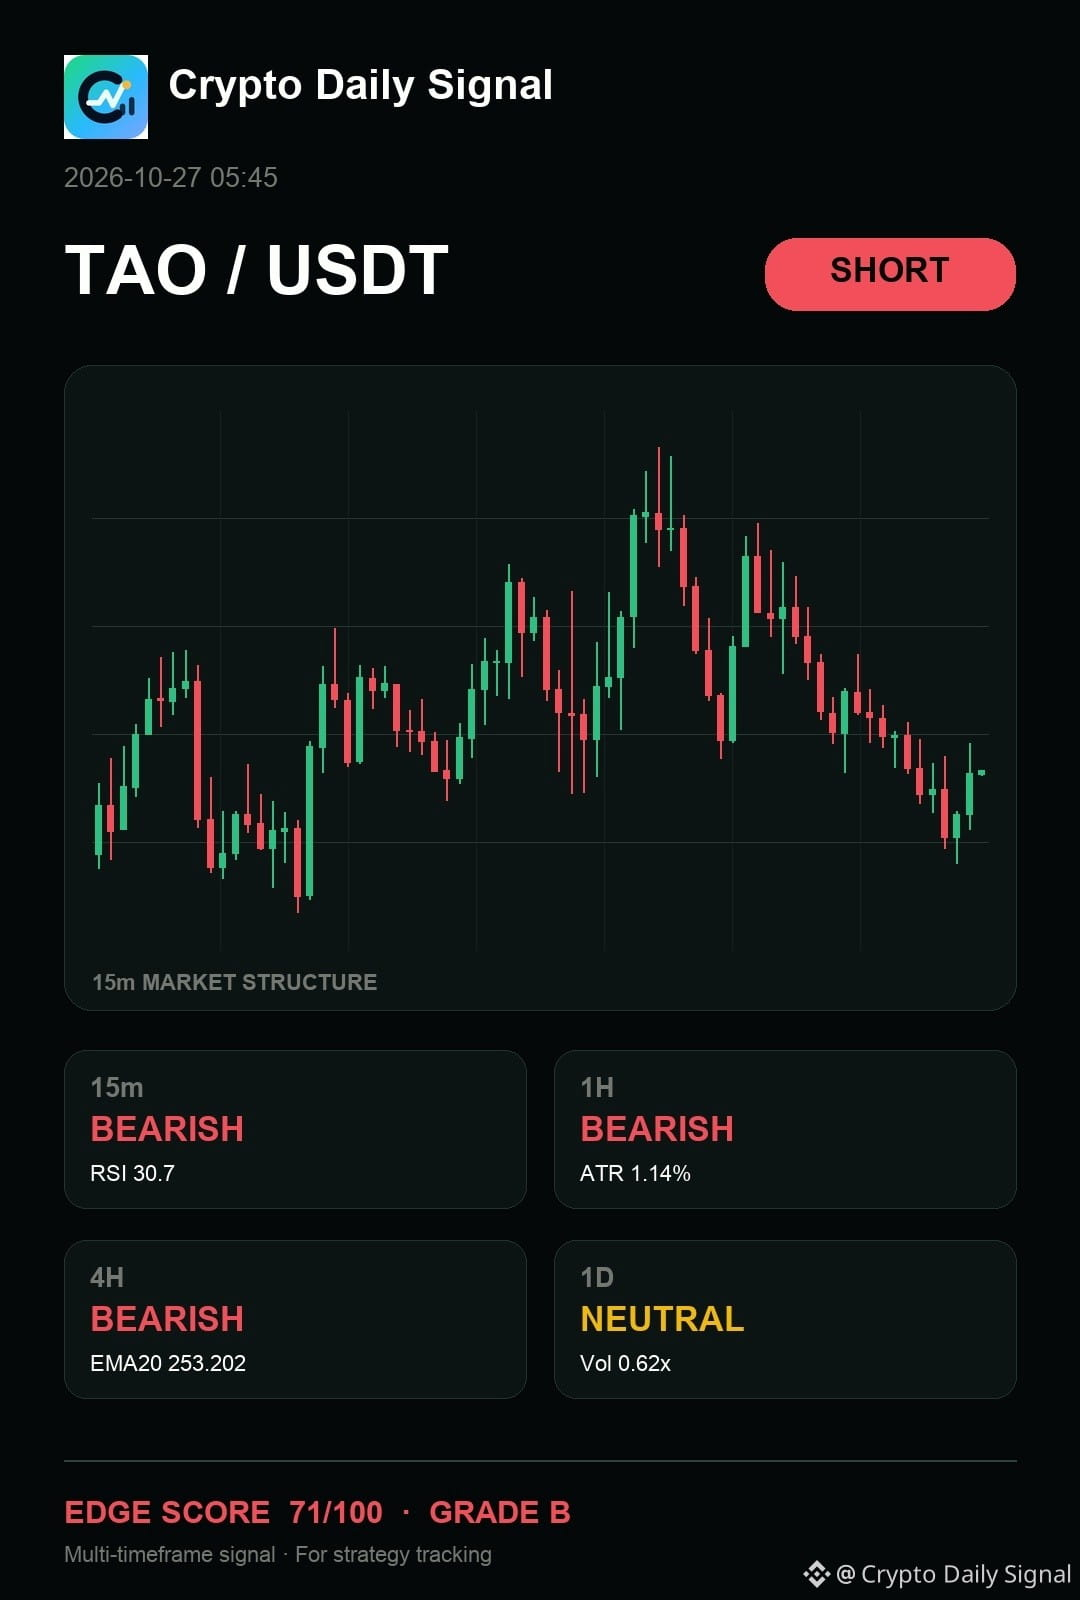
$TAO is still tilted toward sellers as the price builds lower highs against immediate resistance. The momentum on shorter timeframes shows weakness, meaning we are seeing a rejection from this immediate upper level. If it fails to break clearly above the recent high cluster, the bearish bias remains intact.
The levels matter more than the prediction. Size it accordingly.
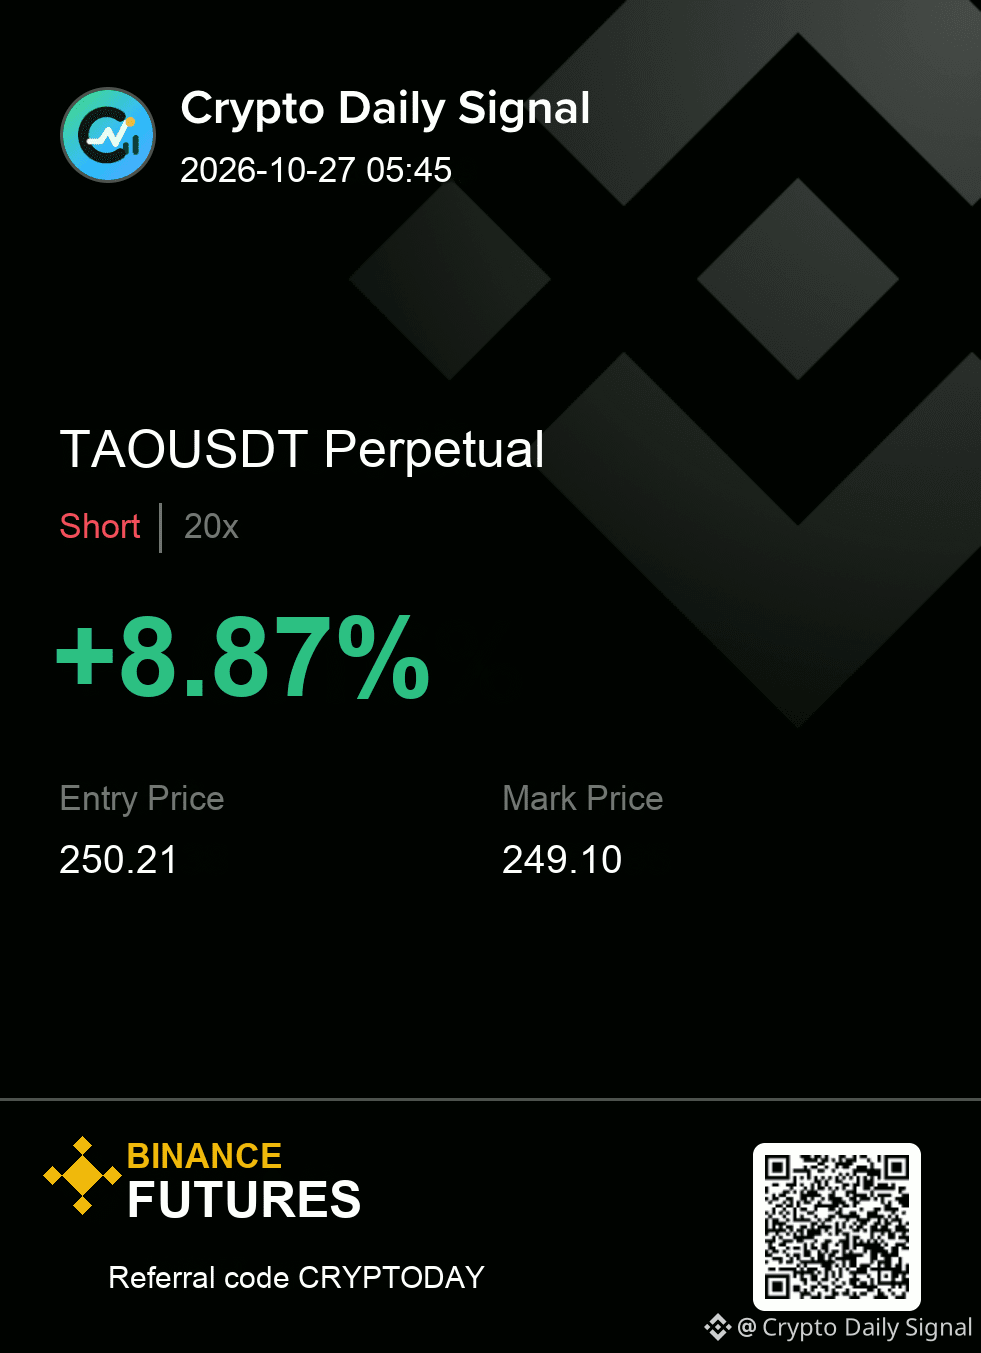
SHORT plan for TAOUSDT
249.87 - 250.55 entry | 251.47 stop
248.95 → 247.95 → 246.69
#TechnicalAnalysis
{future}(TAOUSDT)
$TAO is still tilted toward sellers as the price builds lower highs against immediate resistance. The momentum on shorter timeframes shows weakness, meaning we are seeing a rejection from this immediate upper level. If it fails to break clearly above the recent high cluster, the bearish bias remains intact.
The levels matter more than the prediction. Size it accordingly.
SHORT plan for TAOUSDT
249.87 - 250.55 entry | 251.47 stop
248.95 → 247.95 → 246.69
#TechnicalAnalysis
The levels matter more than the prediction. Size it accordingly.
SHORT plan for TAOUSDT
249.87 - 250.55 entry | 251.47 stop
248.95 → 247.95 → 246.69
#TechnicalAnalysis
6
Übersetzung ansehen
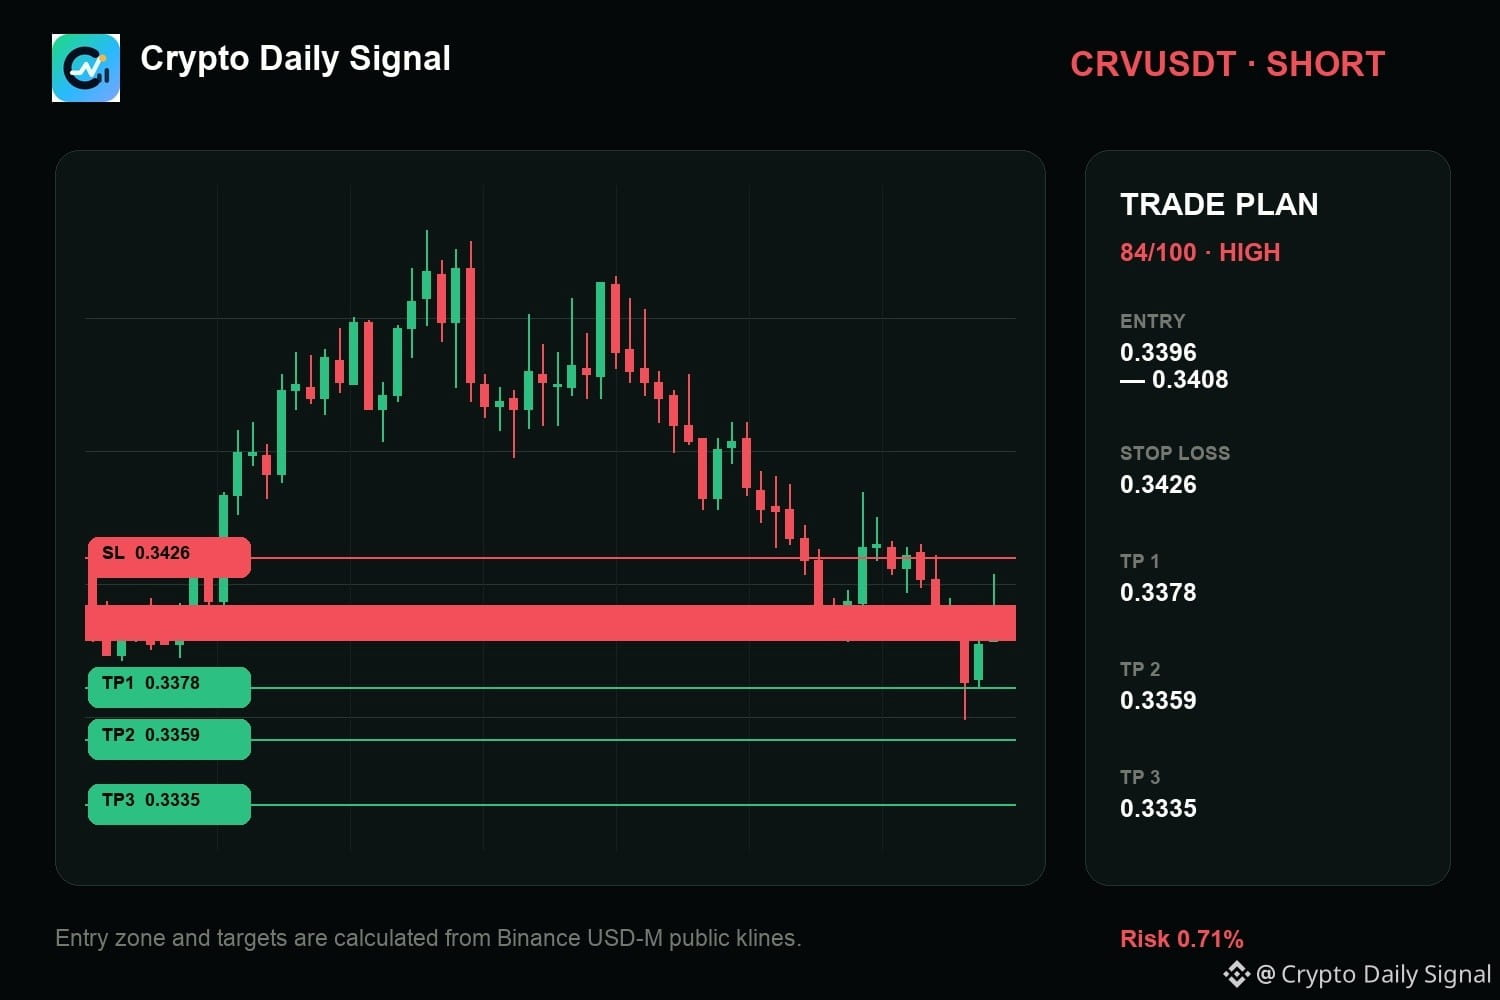
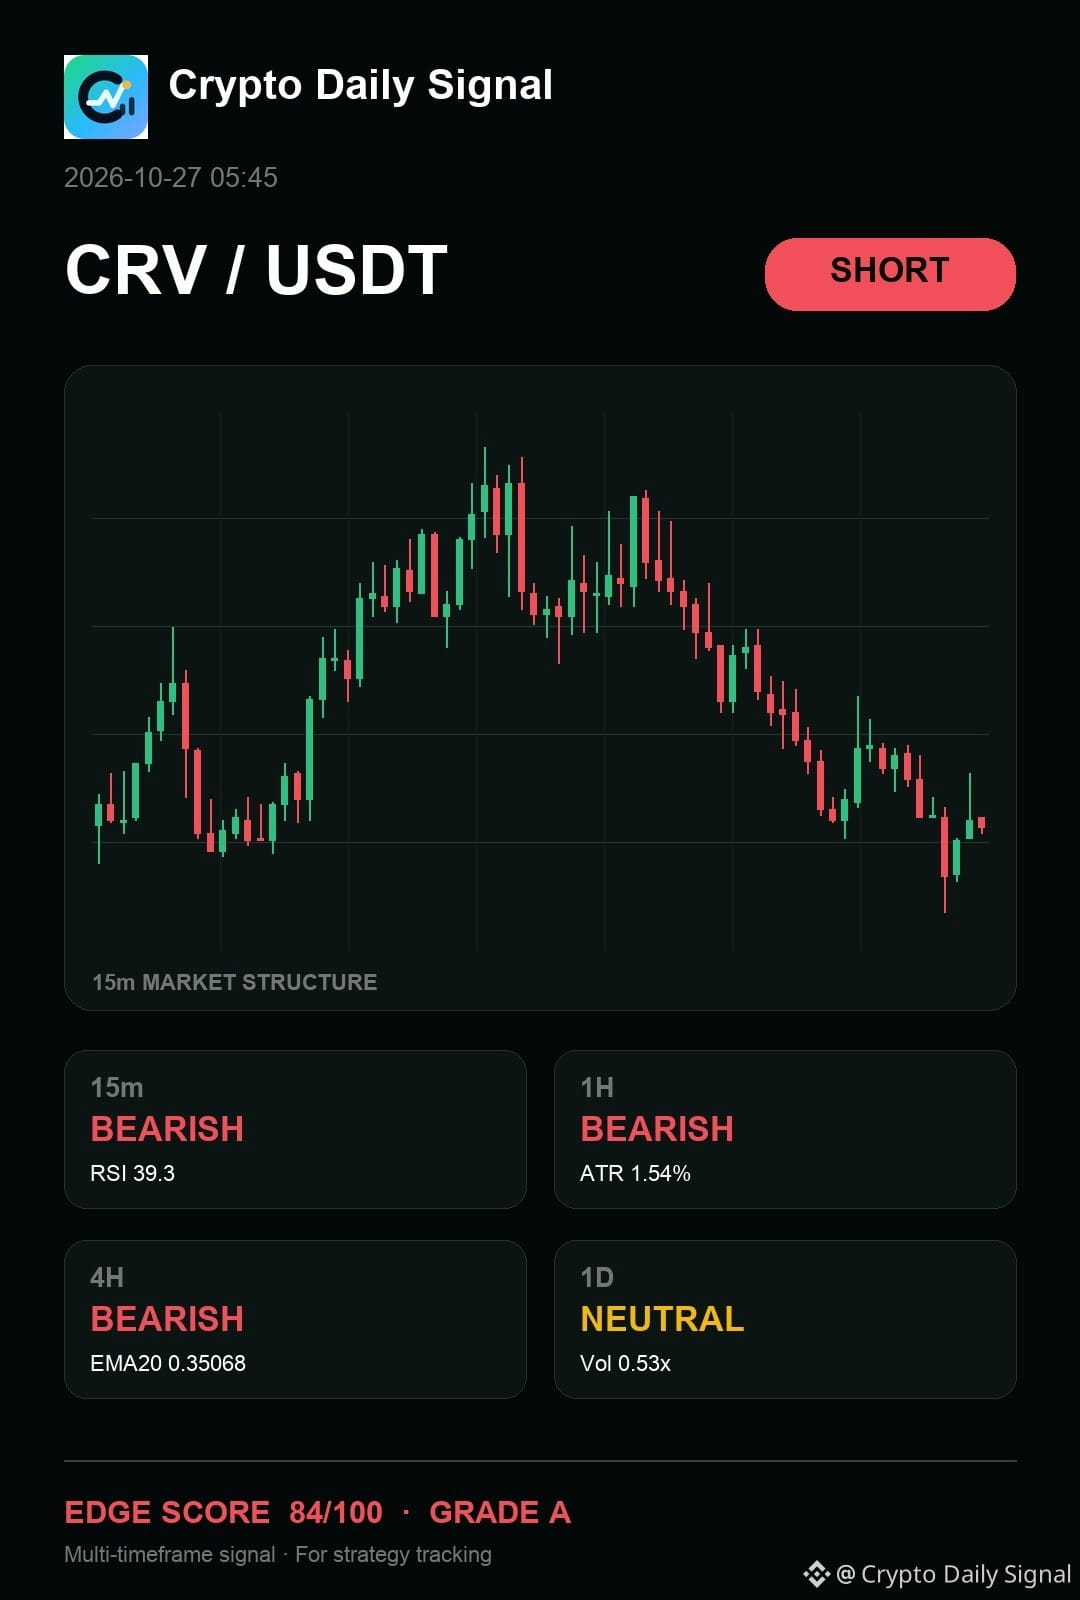
$CRV — man, the part I care about is how it has not invalidated the short case because the recent price formations show a sequence of lower highs within the immediate trading area. Strong upper wicks at the recent high suggest sellers are showing conviction in the short-term. A clean drop below that last swing low would confirm the bearish view we see on the four-hour view.
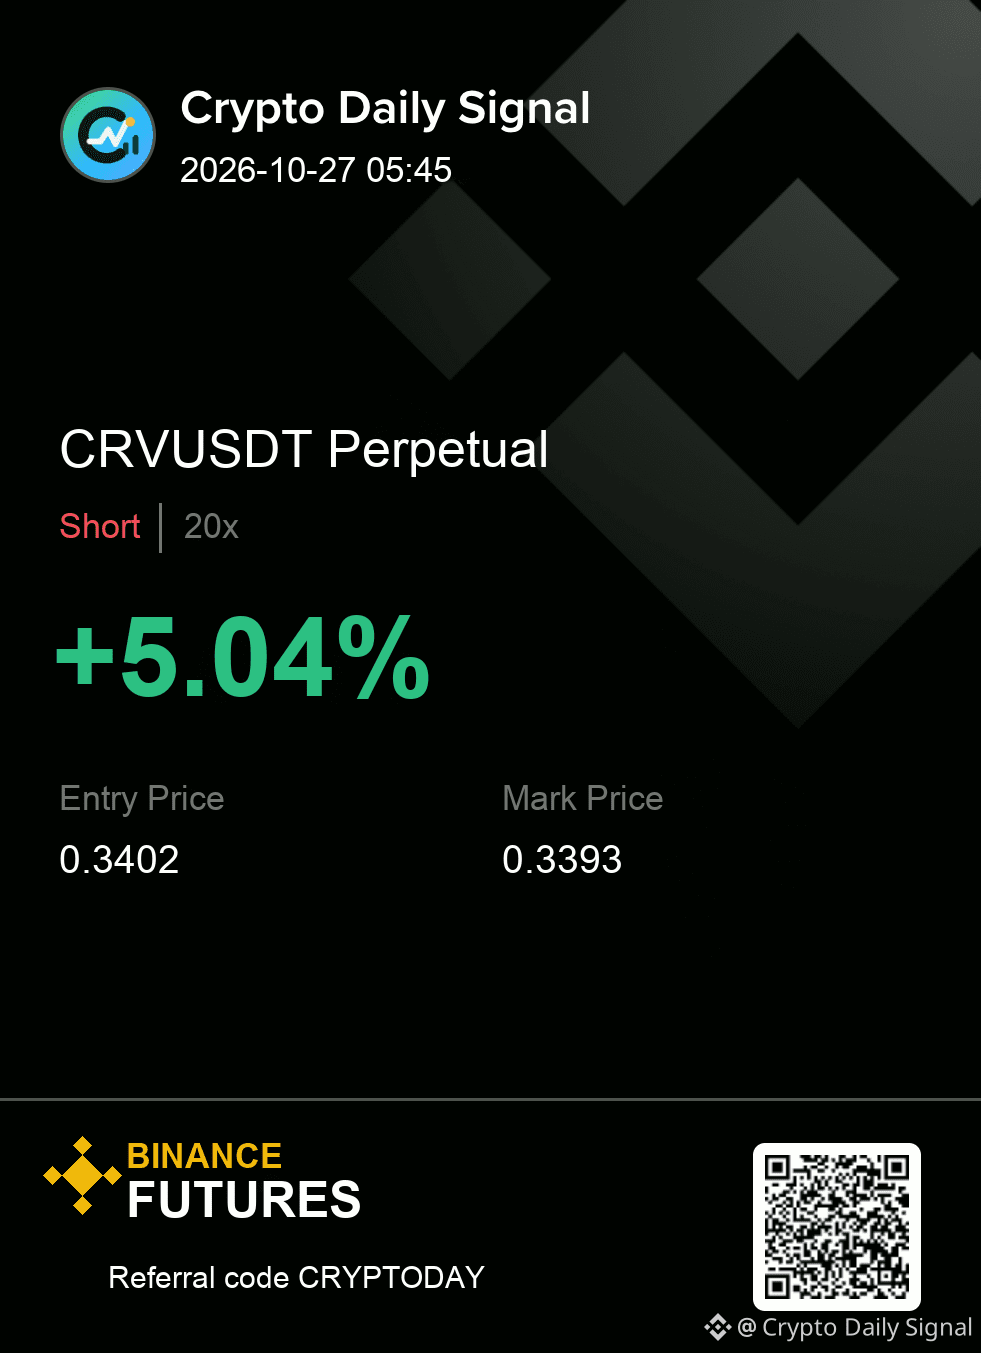
CRVUSDT SHORT map
Entry → 0.3396 - 0.3408
SL → 0.3426
TP → 0.3378 · 0.3359 · 0.3335
#TechnicalAnalysis
{future}(CRVUSDT)
$CRV — man, the part I care about is how it has not invalidated the short case because the recent price formations show a sequence of lower highs within the immediate trading area. Strong upper wicks at the recent high suggest sellers are showing conviction in the short-term. A clean drop below that last swing low would confirm the bearish view we see on the four-hour view.
CRVUSDT SHORT map
Entry → 0.3396 - 0.3408
SL → 0.3426
TP → 0.3378 · 0.3359 · 0.3335
#TechnicalAnalysis
CRVUSDT SHORT map
Entry → 0.3396 - 0.3408
SL → 0.3426
TP → 0.3378 · 0.3359 · 0.3335
#TechnicalAnalysis
17
Anmelden und weiter Inhalte entdecken
Krypto-Nutzer weltweit auf Binance Square kennenlernen
⚡️ Bleib in Sachen Krypto stets am Puls.
💬 Die weltgrößte Kryptobörse vertraut darauf.
👍 Erhalte verlässliche Einblicke von verifizierten Creators.
E-Mail-Adresse/Telefonnummer
Trendthemen
1
#BinancePick
3.1M Aufrufe
154,591 Kommentare
2
#EarningsSeason
5.3M Aufrufe
26,115 Kommentare
3
#AnthropicTTMRevenueGrewAbout1200%
37,518 Aufrufe
460 Kommentare
4
#AnthropicS1ExpectedToday
30,826 Aufrufe
370 Kommentare
5
#SouthKoreaReportedlyWeighsFourthCryptoTaxDelay
33,818 Aufrufe
500 Kommentare
6
#FranklinTempletonFilesForTwoDividendToBitcoinETFs
44,947 Aufrufe
568 Kommentare
7
#StrategyMSTRSurpassesNasdaqInMarketCap
34,938 Aufrufe
402 Kommentare
8
#CanadaProposesStablecoinRedemptionWithin3BusinessDays
1,438 Aufrufe
37 Kommentare
9
#ElectrumWalletBugLetRogueServersStealFunds
33,599 Aufrufe
482 Kommentare
10
#ArgentineCourtDismissesLIBRACaseAgainstMilei
50,103 Aufrufe
604 Kommentare