

#aketrade
aketrade
15,768 Aufrufe
75 Kommentare
Hot
Zuletzt

·
--
Bärisch
$MUBARAK gerade einen Gewinn von 2000% erzielt !!
$AKE hat gerade einen Gewinn von 2400% erzielt !!
Deshalb musst du diesem Profil folgen und dem kostenlosen Gruppenchat auf Binance Chat beitreten, um die neuesten Trades und Updates zu bevorstehenden Trades zu erhalten !!
#MUBARAK
#AKETRADE
#AKETRADING
{future}(AKEUSDT)
{future}(MUBARAKUSDT)
$MUBARAK gerade einen Gewinn von 2000% erzielt !!
$AKE hat gerade einen Gewinn von 2400% erzielt !!
Deshalb musst du diesem Profil folgen und dem kostenlosen Gruppenchat auf Binance Chat beitreten, um die neuesten Trades und Updates zu bevorstehenden Trades zu erhalten !!
#MUBARAK
#AKETRADE
#AKETRADING
$AKE hat gerade einen Gewinn von 2400% erzielt !!
Deshalb musst du diesem Profil folgen und dem kostenlosen Gruppenchat auf Binance Chat beitreten, um die neuesten Trades und Updates zu bevorstehenden Trades zu erhalten !!
#MUBARAK
#AKETRADE
#AKETRADING
392

·
--
Basierend auf dem 1D-Chart in deinem Screenshot zeigt AKEUSDT einen bullischen Trend mit einem kurzfristigen Rücksetzer/Konsolidierung.
📈 Trendanalyse — AKEUSDT
Aktueller Preis: ~0.05454
24H-Hoch: 0.06420
24H-Tief: 0.03620
MA(7): 0.04620
EMA(7): 0.04770
EMA(25): 0.02858
EMA(99): 0.01233
Warum der Trend bullisch ist:
Der Preis liegt immer noch deutlich über den gleitenden Durchschnitten der letzten 7, 25 und 99 Tage. Die MA/EMA-Struktur ist zudem stark nach oben gerichtet, was zeigt, dass der übergeordnete tägliche Momentum weiterhin positiv ist.
Wichtige Kursmarken
Level Bedeutung
0.0642 Unmittelbarer Widerstand / jüngstes Hoch
0.0718 Nächster Widerstand, falls ein Ausbruch erfolgt
0.0545 Aktueller Preis
0.047–0.046 Wichtige kurzfristige Unterstützung
0.0383 Stärkere Unterstützung
0.0285 Wichtige EMA-25-Unterstützung
🔎 Worauf ich achten würde
Bullisches Szenario:
Wenn AKE ausbricht und einen täglichen Kerzenschluss über 0.0642 schafft, würde das auf neuen Aufwärts-Momentum hinweisen. Der nächste zu beobachtende Chartbereich liegt bei etwa 0.0718.
Rücksetzer-Szenario:
Wenn der Preis in Richtung 0.047–0.046 fällt und dort hält, bleibt die bullische Struktur relativ intakt.
Bärische Warnung:
Ein klarer täglicher Schluss unter 0.046 würde den kurzfristigen Trend schwächen; unter 0.0383 wäre eine deutlich stärkere Verschlechterung.
⚠️ Da es sich bei AKEUSDT um ein Perpetual handelt, nutze den 24H +31%-Move nicht als Grund, um einem Long hinterherzulaufen. Nach einem starken Anstieg kann die Volatilität extrem werden und der Leverage kann Positionen schnell liquidieren.
Gesamtstruktur im Chart: 🟢 Bullisch → aktuell konsolidierend/zurücksetzend.
Für einen sichereren Einstieg würde ich beobachten, wie sich der Preis um 0.047–0.046 verhält, oder auf einen bestätigten Ausbruch über 0.0642 warten, statt einzusteigen, nur weil der Preis steigt.#AKEUpdate #AKETRADE #InvestSmart
Basierend auf dem 1D-Chart in deinem Screenshot zeigt AKEUSDT einen bullischen Trend mit einem kurzfristigen Rücksetzer/Konsolidierung.
📈 Trendanalyse — AKEUSDT
Aktueller Preis: ~0.05454
24H-Hoch: 0.06420
24H-Tief: 0.03620
MA(7): 0.04620
EMA(7): 0.04770
EMA(25): 0.02858
EMA(99): 0.01233
Warum der Trend bullisch ist:
Der Preis liegt immer noch deutlich über den gleitenden Durchschnitten der letzten 7, 25 und 99 Tage. Die MA/EMA-Struktur ist zudem stark nach oben gerichtet, was zeigt, dass der übergeordnete tägliche Momentum weiterhin positiv ist.
Wichtige Kursmarken
Level Bedeutung
0.0642 Unmittelbarer Widerstand / jüngstes Hoch
0.0718 Nächster Widerstand, falls ein Ausbruch erfolgt
0.0545 Aktueller Preis
0.047–0.046 Wichtige kurzfristige Unterstützung
0.0383 Stärkere Unterstützung
0.0285 Wichtige EMA-25-Unterstützung
🔎 Worauf ich achten würde
Bullisches Szenario:
Wenn AKE ausbricht und einen täglichen Kerzenschluss über 0.0642 schafft, würde das auf neuen Aufwärts-Momentum hinweisen. Der nächste zu beobachtende Chartbereich liegt bei etwa 0.0718.
Rücksetzer-Szenario:
Wenn der Preis in Richtung 0.047–0.046 fällt und dort hält, bleibt die bullische Struktur relativ intakt.
Bärische Warnung:
Ein klarer täglicher Schluss unter 0.046 würde den kurzfristigen Trend schwächen; unter 0.0383 wäre eine deutlich stärkere Verschlechterung.
⚠️ Da es sich bei AKEUSDT um ein Perpetual handelt, nutze den 24H +31%-Move nicht als Grund, um einem Long hinterherzulaufen. Nach einem starken Anstieg kann die Volatilität extrem werden und der Leverage kann Positionen schnell liquidieren.
Gesamtstruktur im Chart: 🟢 Bullisch → aktuell konsolidierend/zurücksetzend.
Für einen sichereren Einstieg würde ich beobachten, wie sich der Preis um 0.047–0.046 verhält, oder auf einen bestätigten Ausbruch über 0.0642 warten, statt einzusteigen, nur weil der Preis steigt.#AKEUpdate #AKETRADE #InvestSmart
📈 Trendanalyse — AKEUSDT
Aktueller Preis: ~0.05454
24H-Hoch: 0.06420
24H-Tief: 0.03620
MA(7): 0.04620
EMA(7): 0.04770
EMA(25): 0.02858
EMA(99): 0.01233
Warum der Trend bullisch ist:
Der Preis liegt immer noch deutlich über den gleitenden Durchschnitten der letzten 7, 25 und 99 Tage. Die MA/EMA-Struktur ist zudem stark nach oben gerichtet, was zeigt, dass der übergeordnete tägliche Momentum weiterhin positiv ist.
Wichtige Kursmarken
Level Bedeutung
0.0642 Unmittelbarer Widerstand / jüngstes Hoch
0.0718 Nächster Widerstand, falls ein Ausbruch erfolgt
0.0545 Aktueller Preis
0.047–0.046 Wichtige kurzfristige Unterstützung
0.0383 Stärkere Unterstützung
0.0285 Wichtige EMA-25-Unterstützung
🔎 Worauf ich achten würde
Bullisches Szenario:
Wenn AKE ausbricht und einen täglichen Kerzenschluss über 0.0642 schafft, würde das auf neuen Aufwärts-Momentum hinweisen. Der nächste zu beobachtende Chartbereich liegt bei etwa 0.0718.
Rücksetzer-Szenario:
Wenn der Preis in Richtung 0.047–0.046 fällt und dort hält, bleibt die bullische Struktur relativ intakt.
Bärische Warnung:
Ein klarer täglicher Schluss unter 0.046 würde den kurzfristigen Trend schwächen; unter 0.0383 wäre eine deutlich stärkere Verschlechterung.
⚠️ Da es sich bei AKEUSDT um ein Perpetual handelt, nutze den 24H +31%-Move nicht als Grund, um einem Long hinterherzulaufen. Nach einem starken Anstieg kann die Volatilität extrem werden und der Leverage kann Positionen schnell liquidieren.
Gesamtstruktur im Chart: 🟢 Bullisch → aktuell konsolidierend/zurücksetzend.
Für einen sichereren Einstieg würde ich beobachten, wie sich der Preis um 0.047–0.046 verhält, oder auf einen bestätigten Ausbruch über 0.0642 warten, statt einzusteigen, nur weil der Preis steigt.#AKEUpdate #AKETRADE #InvestSmart
156

·
--
Bärisch
$AKE
Kurzfristige Einrichtung
Bias: 🔴 SHORT / bärisch unter $0.0630
Einstiegszone: $0.0555–$0.0625 bei Zurückweisung
TP1: $0.0500
TP2: $0.0453
TP3: $0.0418
Erweitertes Ziel: $0.0294
Stop Loss: $0.0665
🔑 Wichtige Niveaus
Widerstand
$0.0629 — Bollinger-Mitte
$0.0690–$0.0730 — Erholungswiderstand
$0.0810 — oberer Bollinger-Bereich
$0.1647 — jüngstes Spike-Hoch
Support
$0.0500
$0.0453 — aktuelles Chart-Tief
$0.0418 — breiterer Support
$0.0294 — tieferer Support
⚠️ Wichtige Warnung
Dies ist eine extrem volatile Konstellation. Die enorme Dochtbildung bis $0.1647 gefolgt vom Zusammenbruch bedeutet, dass Liquidations-/Slippage-Risiken ungewöhnlich hoch sind. Außerdem berichtet Phemex, dass nur ungefähr 22–23% des AKE-Gesamtangebots von 100B Mitte September im Umlauf waren, wodurch künftige Unlocks ein wichtiges Risiko darstellen. �
Phemex +1
Bullische Invalidierung: Eine anhaltende 1H-Erholung über $0.063–$0.066 würde die kurzfristige Short-Setupschwäche verringern; das Rückerobern von $0.073–$0.081 würde auf deutlich stärkeren Erholungsmomentum hindeuten.
{future}(AKEUSDT)
#AKEUSD
#AKEUpdate
#AKEUADT
#AKETRADE
$AKE
Kurzfristige Einrichtung
Bias: 🔴 SHORT / bärisch unter $0.0630
Einstiegszone: $0.0555–$0.0625 bei Zurückweisung
TP1: $0.0500
TP2: $0.0453
TP3: $0.0418
Erweitertes Ziel: $0.0294
Stop Loss: $0.0665
🔑 Wichtige Niveaus
Widerstand
$0.0629 — Bollinger-Mitte
$0.0690–$0.0730 — Erholungswiderstand
$0.0810 — oberer Bollinger-Bereich
$0.1647 — jüngstes Spike-Hoch
Support
$0.0500
$0.0453 — aktuelles Chart-Tief
$0.0418 — breiterer Support
$0.0294 — tieferer Support
⚠️ Wichtige Warnung
Dies ist eine extrem volatile Konstellation. Die enorme Dochtbildung bis $0.1647 gefolgt vom Zusammenbruch bedeutet, dass Liquidations-/Slippage-Risiken ungewöhnlich hoch sind. Außerdem berichtet Phemex, dass nur ungefähr 22–23% des AKE-Gesamtangebots von 100B Mitte September im Umlauf waren, wodurch künftige Unlocks ein wichtiges Risiko darstellen. �
Phemex +1
Bullische Invalidierung: Eine anhaltende 1H-Erholung über $0.063–$0.066 würde die kurzfristige Short-Setupschwäche verringern; das Rückerobern von $0.073–$0.081 würde auf deutlich stärkeren Erholungsmomentum hindeuten.
#AKEUSD
#AKEUpdate
#AKEUADT
#AKETRADE
Kurzfristige Einrichtung
Bias: 🔴 SHORT / bärisch unter $0.0630
Einstiegszone: $0.0555–$0.0625 bei Zurückweisung
TP1: $0.0500
TP2: $0.0453
TP3: $0.0418
Erweitertes Ziel: $0.0294
Stop Loss: $0.0665
🔑 Wichtige Niveaus
Widerstand
$0.0629 — Bollinger-Mitte
$0.0690–$0.0730 — Erholungswiderstand
$0.0810 — oberer Bollinger-Bereich
$0.1647 — jüngstes Spike-Hoch
Support
$0.0500
$0.0453 — aktuelles Chart-Tief
$0.0418 — breiterer Support
$0.0294 — tieferer Support
⚠️ Wichtige Warnung
Dies ist eine extrem volatile Konstellation. Die enorme Dochtbildung bis $0.1647 gefolgt vom Zusammenbruch bedeutet, dass Liquidations-/Slippage-Risiken ungewöhnlich hoch sind. Außerdem berichtet Phemex, dass nur ungefähr 22–23% des AKE-Gesamtangebots von 100B Mitte September im Umlauf waren, wodurch künftige Unlocks ein wichtiges Risiko darstellen. �
Phemex +1
Bullische Invalidierung: Eine anhaltende 1H-Erholung über $0.063–$0.066 würde die kurzfristige Short-Setupschwäche verringern; das Rückerobern von $0.073–$0.081 würde auf deutlich stärkeren Erholungsmomentum hindeuten.
#AKEUSD
#AKEUpdate
#AKEUADT
#AKETRADE
284

·
--
Bullisch
🤔 Wird es eine Wiederholung der Bewegungen vom Tag 09/09 sein oder wird es jetzt endlich anfangen zu fallen? $AKE
schau dir den Graphen und die 4h unten an, die ich gerade als Screenshot gemacht habe
{future}(AKEUSDT)
Und was denkt ihr darüber ???
1. Wiederholung der Bewegung vom Tag 09/09 👨💻
2. wird endlich fallen – speichert es, falls wer kann 🔽😭
schreibt in die Kommentare und mal sehen, wer das in den nächsten Stunden entschlüsselt
#AKETRADE #AnalyseCrypto #strategy #analysis #BinanceSquareTalks
🤔 Wird es eine Wiederholung der Bewegungen vom Tag 09/09 sein oder wird es jetzt endlich anfangen zu fallen? $AKE
schau dir den Graphen und die 4h unten an, die ich gerade als Screenshot gemacht habe
Und was denkt ihr darüber ???
1. Wiederholung der Bewegung vom Tag 09/09 👨💻
2. wird endlich fallen – speichert es, falls wer kann 🔽😭
schreibt in die Kommentare und mal sehen, wer das in den nächsten Stunden entschlüsselt
#AKETRADE #AnalyseCrypto #strategy #analysis #BinanceSquareTalks
schau dir den Graphen und die 4h unten an, die ich gerade als Screenshot gemacht habe
Und was denkt ihr darüber ???
1. Wiederholung der Bewegung vom Tag 09/09 👨💻
2. wird endlich fallen – speichert es, falls wer kann 🔽😭
schreibt in die Kommentare und mal sehen, wer das in den nächsten Stunden entschlüsselt
#AKETRADE #AnalyseCrypto #strategy #analysis #BinanceSquareTalks
1
6
158
·
--
Bullisch
$AKE
Handels-Setup — LONG
Einstieg: $0.0565–$0.0610 bei kontrolliertem Pullback
Breakout-Einstieg: Oberhalb von $0.0730 mit starkem Volumen
TP1: $0.0690
TP2: $0.0730
TP3: $0.0800
TP4: $0.0900+
Stop-Loss: Unter $0.0540
Bias: LONG, aber das Hinterherjagen bei $0.064+ birgt ein erhöhtes Volatilitätsrisiko. Ein Pullback/Retest oder ein bestätigter Breakout ist technisch sauberer als ein Einstieg nach einer vertikalen Bewegung.
Der Screenshot zeigt, dass die Bollinger-Bänder das mittlere Band bei ca. $0.0567 und das obere Band bei ca. $0.0731 liegen; das stützt diese Zonen. AKEDO ist ein KI-/Game-Creation-Projekt auf BNB Chain, wobei AKE innerhalb seines Ökosystems verwendet wird. �
BitMart +1
⚠️ Risiko: AKE hat mehrere ähnlich benannte Tokens/Contracts. Daher vor dem Trading den BNB-Chain-Contract verifizieren; aktuelle Quellen nennen 0x2c3a...12f7db als den kanonischen Contract. �
{future}(AKEUSDT)
#AKE
#AKEUpdate
#AKEUADT
#AKETRADE
$AKE
Handels-Setup — LONG
Einstieg: $0.0565–$0.0610 bei kontrolliertem Pullback
Breakout-Einstieg: Oberhalb von $0.0730 mit starkem Volumen
TP1: $0.0690
TP2: $0.0730
TP3: $0.0800
TP4: $0.0900+
Stop-Loss: Unter $0.0540
Bias: LONG, aber das Hinterherjagen bei $0.064+ birgt ein erhöhtes Volatilitätsrisiko. Ein Pullback/Retest oder ein bestätigter Breakout ist technisch sauberer als ein Einstieg nach einer vertikalen Bewegung.
Der Screenshot zeigt, dass die Bollinger-Bänder das mittlere Band bei ca. $0.0567 und das obere Band bei ca. $0.0731 liegen; das stützt diese Zonen. AKEDO ist ein KI-/Game-Creation-Projekt auf BNB Chain, wobei AKE innerhalb seines Ökosystems verwendet wird. �
BitMart +1
⚠️ Risiko: AKE hat mehrere ähnlich benannte Tokens/Contracts. Daher vor dem Trading den BNB-Chain-Contract verifizieren; aktuelle Quellen nennen 0x2c3a...12f7db als den kanonischen Contract. �
#AKE
#AKEUpdate
#AKEUADT
#AKETRADE
Handels-Setup — LONG
Einstieg: $0.0565–$0.0610 bei kontrolliertem Pullback
Breakout-Einstieg: Oberhalb von $0.0730 mit starkem Volumen
TP1: $0.0690
TP2: $0.0730
TP3: $0.0800
TP4: $0.0900+
Stop-Loss: Unter $0.0540
Bias: LONG, aber das Hinterherjagen bei $0.064+ birgt ein erhöhtes Volatilitätsrisiko. Ein Pullback/Retest oder ein bestätigter Breakout ist technisch sauberer als ein Einstieg nach einer vertikalen Bewegung.
Der Screenshot zeigt, dass die Bollinger-Bänder das mittlere Band bei ca. $0.0567 und das obere Band bei ca. $0.0731 liegen; das stützt diese Zonen. AKEDO ist ein KI-/Game-Creation-Projekt auf BNB Chain, wobei AKE innerhalb seines Ökosystems verwendet wird. �
BitMart +1
⚠️ Risiko: AKE hat mehrere ähnlich benannte Tokens/Contracts. Daher vor dem Trading den BNB-Chain-Contract verifizieren; aktuelle Quellen nennen 0x2c3a...12f7db als den kanonischen Contract. �
#AKE
#AKEUpdate
#AKEUADT
#AKETRADE
202



·
--
Bullisch
$AKE
Der Momentum-Impuls ist stark, und das Halten nahe den Hochs ist nun der nächste Test.
$AKE wird bei 0.044846 USD gehandelt, ein Plus von 110.39% in 24 Stunden, nach einem starken Anstieg auf dem 15-Minuten-Chart. Der Kurs bleibt über Supertrend und SAR, wodurch das kurzfristige Bild bullisch bleibt; das jüngste Hoch bei 0.046660 muss jedoch noch durchbrochen werden. Das Volumen hat sich seit dem Breakout-Impuls beruhigt, daher würde ich erneutes Kaufinteresse erwarten, bevor ich einem weiteren Vorstoß nach oben vertraue.
Nach so einer schnellen Bewegung würde ich den nächsten wenigen Kerzen Zeit geben, sich zu entwickeln. Können Käufer diese Gewinne halten, während die Handelsaktivität abkühlt?
#AKETRADE #AKEUpdate #AKETalk #akeToMoon #AKETRADING
{future}(AKEUSDT)
$AKE
Der Momentum-Impuls ist stark, und das Halten nahe den Hochs ist nun der nächste Test.
$AKE wird bei 0.044846 USD gehandelt, ein Plus von 110.39% in 24 Stunden, nach einem starken Anstieg auf dem 15-Minuten-Chart. Der Kurs bleibt über Supertrend und SAR, wodurch das kurzfristige Bild bullisch bleibt; das jüngste Hoch bei 0.046660 muss jedoch noch durchbrochen werden. Das Volumen hat sich seit dem Breakout-Impuls beruhigt, daher würde ich erneutes Kaufinteresse erwarten, bevor ich einem weiteren Vorstoß nach oben vertraue.
Nach so einer schnellen Bewegung würde ich den nächsten wenigen Kerzen Zeit geben, sich zu entwickeln. Können Käufer diese Gewinne halten, während die Handelsaktivität abkühlt?
#AKETRADE #AKEUpdate #AKETalk #akeToMoon #AKETRADING
Der Momentum-Impuls ist stark, und das Halten nahe den Hochs ist nun der nächste Test.
$AKE wird bei 0.044846 USD gehandelt, ein Plus von 110.39% in 24 Stunden, nach einem starken Anstieg auf dem 15-Minuten-Chart. Der Kurs bleibt über Supertrend und SAR, wodurch das kurzfristige Bild bullisch bleibt; das jüngste Hoch bei 0.046660 muss jedoch noch durchbrochen werden. Das Volumen hat sich seit dem Breakout-Impuls beruhigt, daher würde ich erneutes Kaufinteresse erwarten, bevor ich einem weiteren Vorstoß nach oben vertraue.
Nach so einer schnellen Bewegung würde ich den nächsten wenigen Kerzen Zeit geben, sich zu entwickeln. Können Käufer diese Gewinne halten, während die Handelsaktivität abkühlt?
#AKETRADE #AKEUpdate #AKETalk #akeToMoon #AKETRADING
1
569

·
--
Bullisch
$AKE
LANG-Setup
Einstieg: 0,0275–0,0285 bei einem Pullback
TP1: 0,0313
TP2: 0,0340
TP3: 0,0370
Stop-Loss: 0,0257
Alternativer Breakout-Einstieg: Über 0,0300 nach einem bestätigten 1H-Close, mit Invalidation zurück unter ~0,0280.
⚠️ AKE bewegt sich derzeit sehr rasant, daher sind Volatilität und Liquidationsrisiko hoch. Positionsgröße und Leverage sind entscheidend; dies sind chartbasierte Levels, keine garantierten Ergebnisse.
{future}(AKEUSDT)
#AKEUS
#AKEUADT
#AKETRADE
#AKEUSDT
$AKE
LANG-Setup
Einstieg: 0,0275–0,0285 bei einem Pullback
TP1: 0,0313
TP2: 0,0340
TP3: 0,0370
Stop-Loss: 0,0257
Alternativer Breakout-Einstieg: Über 0,0300 nach einem bestätigten 1H-Close, mit Invalidation zurück unter ~0,0280.
⚠️ AKE bewegt sich derzeit sehr rasant, daher sind Volatilität und Liquidationsrisiko hoch. Positionsgröße und Leverage sind entscheidend; dies sind chartbasierte Levels, keine garantierten Ergebnisse.
#AKEUS
#AKEUADT
#AKETRADE
#AKEUSDT
LANG-Setup
Einstieg: 0,0275–0,0285 bei einem Pullback
TP1: 0,0313
TP2: 0,0340
TP3: 0,0370
Stop-Loss: 0,0257
Alternativer Breakout-Einstieg: Über 0,0300 nach einem bestätigten 1H-Close, mit Invalidation zurück unter ~0,0280.
⚠️ AKE bewegt sich derzeit sehr rasant, daher sind Volatilität und Liquidationsrisiko hoch. Positionsgröße und Leverage sind entscheidend; dies sind chartbasierte Levels, keine garantierten Ergebnisse.
#AKEUS
#AKEUADT
#AKETRADE
#AKEUSDT
144

·
--
$AKE Der Kryptomarkt und dezentrale Technologien ziehen weiterhin sowohl das Interesse von Investoren als auch von Entwicklern auf sich. Dabei streben junge, spezialisierte Projekte – wie das Projekt der AKE-Münze – danach, innovative Lösungen in den Bereichen Blockchain und dezentrale Anwendungen (dApps) bereitzustellen.
Die Attraktivität und anhaltende Relevanz der AKE-Münze auf dem Markt stützen sich auf mehrere zentrale Säulen, die das grundlegende Gerüst für die Bewertung ihrer zukünftigen Performance bilden:
Technische Architektur und Innovationsaspekte: Der Wert der Münze basiert vor allem darauf, wie stark ihr Protokoll ist, wie schnell Transaktionen verarbeitet werden, wie gut es skaliert und inwieweit es mit anderen Netzwerken verbunden werden kann.
Das wirtschaftliche Modell des Tokens (Tokenomics): Die Höhe des gesamten Angebots und der Cashflow sowie Mechanismen zum Verbrennen oder zu Belohnungen (Staking) spielen eine entscheidende Rolle bei der Bestimmung der Angebots- und Nachfragewerte und der Preisstabilität über lange Zeiträume.
Liquidität und Marktverbreitung: Die Notierung der Münze auf wichtigen Handelsplattformen und das Ansteigen der täglichen Handelsvolumen tragen dazu bei, das Vertrauen der Investoren zu stärken und extreme Schwankungsraten zu reduzieren.
$AKE #AKE #AKETRADE #AKESetup #AKESUDT
{alpha}(560x2c3a8ee94ddd97244a93bc48298f97d2c412f7db)
{future}(AKEUSDT)
$AKE Der Kryptomarkt und dezentrale Technologien ziehen weiterhin sowohl das Interesse von Investoren als auch von Entwicklern auf sich. Dabei streben junge, spezialisierte Projekte – wie das Projekt der AKE-Münze – danach, innovative Lösungen in den Bereichen Blockchain und dezentrale Anwendungen (dApps) bereitzustellen.
Die Attraktivität und anhaltende Relevanz der AKE-Münze auf dem Markt stützen sich auf mehrere zentrale Säulen, die das grundlegende Gerüst für die Bewertung ihrer zukünftigen Performance bilden:
Technische Architektur und Innovationsaspekte: Der Wert der Münze basiert vor allem darauf, wie stark ihr Protokoll ist, wie schnell Transaktionen verarbeitet werden, wie gut es skaliert und inwieweit es mit anderen Netzwerken verbunden werden kann.
Das wirtschaftliche Modell des Tokens (Tokenomics): Die Höhe des gesamten Angebots und der Cashflow sowie Mechanismen zum Verbrennen oder zu Belohnungen (Staking) spielen eine entscheidende Rolle bei der Bestimmung der Angebots- und Nachfragewerte und der Preisstabilität über lange Zeiträume.
Liquidität und Marktverbreitung: Die Notierung der Münze auf wichtigen Handelsplattformen und das Ansteigen der täglichen Handelsvolumen tragen dazu bei, das Vertrauen der Investoren zu stärken und extreme Schwankungsraten zu reduzieren.
$AKE #AKE #AKETRADE #AKESetup #AKESUDT
Die Attraktivität und anhaltende Relevanz der AKE-Münze auf dem Markt stützen sich auf mehrere zentrale Säulen, die das grundlegende Gerüst für die Bewertung ihrer zukünftigen Performance bilden:
Technische Architektur und Innovationsaspekte: Der Wert der Münze basiert vor allem darauf, wie stark ihr Protokoll ist, wie schnell Transaktionen verarbeitet werden, wie gut es skaliert und inwieweit es mit anderen Netzwerken verbunden werden kann.
Das wirtschaftliche Modell des Tokens (Tokenomics): Die Höhe des gesamten Angebots und der Cashflow sowie Mechanismen zum Verbrennen oder zu Belohnungen (Staking) spielen eine entscheidende Rolle bei der Bestimmung der Angebots- und Nachfragewerte und der Preisstabilität über lange Zeiträume.
Liquidität und Marktverbreitung: Die Notierung der Münze auf wichtigen Handelsplattformen und das Ansteigen der täglichen Handelsvolumen tragen dazu bei, das Vertrauen der Investoren zu stärken und extreme Schwankungsraten zu reduzieren.
$AKE #AKE #AKETRADE #AKESetup #AKESUDT
166

·
--
Bullisch
*Eine weitere Welle von Short Squeezes trifft den Markt! 🚀*
*Der Schwung baut sich rasend schnell auf—das könnte der Start einer größeren Bewegung sein!*
$AKE
{future}(AKEUSDT)
🟢 LIQUIDITÄTSZONE GETROFFEN 🟢
Short-Liquidation entdeckt 🧨
5,8172K$ abgeräumt bei 0,00173$
Aufwärts-Liquidität abgefischt — REAGIERE JETZT oder beobachte, wie sich der Markt dreht 👀
🎯 TP-Ziele:
TP1: ~0,00175$
TP2: ~0,00178$
TP3: ~0,00181$
#AKETRADE
*Eine weitere Welle von Short Squeezes trifft den Markt! 🚀*
*Der Schwung baut sich rasend schnell auf—das könnte der Start einer größeren Bewegung sein!*
$AKE
🟢 LIQUIDITÄTSZONE GETROFFEN 🟢
Short-Liquidation entdeckt 🧨
5,8172K$ abgeräumt bei 0,00173$
Aufwärts-Liquidität abgefischt — REAGIERE JETZT oder beobachte, wie sich der Markt dreht 👀
🎯 TP-Ziele:
TP1: ~0,00175$
TP2: ~0,00178$
TP3: ~0,00181$
#AKETRADE
*Der Schwung baut sich rasend schnell auf—das könnte der Start einer größeren Bewegung sein!*
$AKE
🟢 LIQUIDITÄTSZONE GETROFFEN 🟢
Short-Liquidation entdeckt 🧨
5,8172K$ abgeräumt bei 0,00173$
Aufwärts-Liquidität abgefischt — REAGIERE JETZT oder beobachte, wie sich der Markt dreht 👀
🎯 TP-Ziele:
TP1: ~0,00175$
TP2: ~0,00178$
TP3: ~0,00181$
#AKETRADE
21

·
--
🔴 SELL SIGNAL – $AKE /USDT
📉 Bärischer Momentum baut sich auf. Warte auf einen bestätigten Breakdown, bevor du in einen Sell-Trade einsteigst.
🎯 Ziele:
✅ TP1 0.0010000
✅ TP2 0.0005000
✅ TP3 0.0002523
🛑 Stop Loss: Oberhalb des jüngsten Swing-High.
⚠️ Gehe mit deinem Risiko richtig um. Setze niemals mehr aufs Spiel, als du zu verlieren bereit bist.
#AKETRADE #crypto #sellsignal #CryptoSignals
🔴 SELL SIGNAL – $AKE /USDT
📉 Bärischer Momentum baut sich auf. Warte auf einen bestätigten Breakdown, bevor du in einen Sell-Trade einsteigst.
🎯 Ziele:
✅ TP1 0.0010000
✅ TP2 0.0005000
✅ TP3 0.0002523
🛑 Stop Loss: Oberhalb des jüngsten Swing-High.
⚠️ Gehe mit deinem Risiko richtig um. Setze niemals mehr aufs Spiel, als du zu verlieren bereit bist.
#AKETRADE #crypto #sellsignal #CryptoSignals
📉 Bärischer Momentum baut sich auf. Warte auf einen bestätigten Breakdown, bevor du in einen Sell-Trade einsteigst.
🎯 Ziele:
✅ TP1 0.0010000
✅ TP2 0.0005000
✅ TP3 0.0002523
🛑 Stop Loss: Oberhalb des jüngsten Swing-High.
⚠️ Gehe mit deinem Risiko richtig um. Setze niemals mehr aufs Spiel, als du zu verlieren bereit bist.
#AKETRADE #crypto #sellsignal #CryptoSignals
318


Arkema $AKE
{future}(AKEUSDT)
bleibt eine Aktie, die man im Blick behalten sollte, da sich die Kursentwicklung in der Nähe wichtiger technischer Levels entwickelt. Das Setup deutet auf eine vorsichtige bis neutrale Einschätzung hin; ein anhaltender Ausbruch über den Widerstand könnte die bullische Dynamik verbessern. Trader sollten auf das Volumen und die Bestätigung achten, bevor sie eine Position eingehen.
Ausblick: Neutral → Bullisch bei Ausbruch
Fokus: Widerstandsausbruch & Halt der Unterstützung
Risiko: Volatilität bleibt möglich. #AKE #AKEtoken #AKETRADE #Binance
Arkema $AKE
bleibt eine Aktie, die man im Blick behalten sollte, da sich die Kursentwicklung in der Nähe wichtiger technischer Levels entwickelt. Das Setup deutet auf eine vorsichtige bis neutrale Einschätzung hin; ein anhaltender Ausbruch über den Widerstand könnte die bullische Dynamik verbessern. Trader sollten auf das Volumen und die Bestätigung achten, bevor sie eine Position eingehen.
Ausblick: Neutral → Bullisch bei Ausbruch
Fokus: Widerstandsausbruch & Halt der Unterstützung
Risiko: Volatilität bleibt möglich. #AKE #AKEtoken #AKETRADE #Binance
bleibt eine Aktie, die man im Blick behalten sollte, da sich die Kursentwicklung in der Nähe wichtiger technischer Levels entwickelt. Das Setup deutet auf eine vorsichtige bis neutrale Einschätzung hin; ein anhaltender Ausbruch über den Widerstand könnte die bullische Dynamik verbessern. Trader sollten auf das Volumen und die Bestätigung achten, bevor sie eine Position eingehen.
Ausblick: Neutral → Bullisch bei Ausbruch
Fokus: Widerstandsausbruch & Halt der Unterstützung
Risiko: Volatilität bleibt möglich. #AKE #AKEtoken #AKETRADE #Binance
389
·
--
Bullisch
Teilweise korrekt
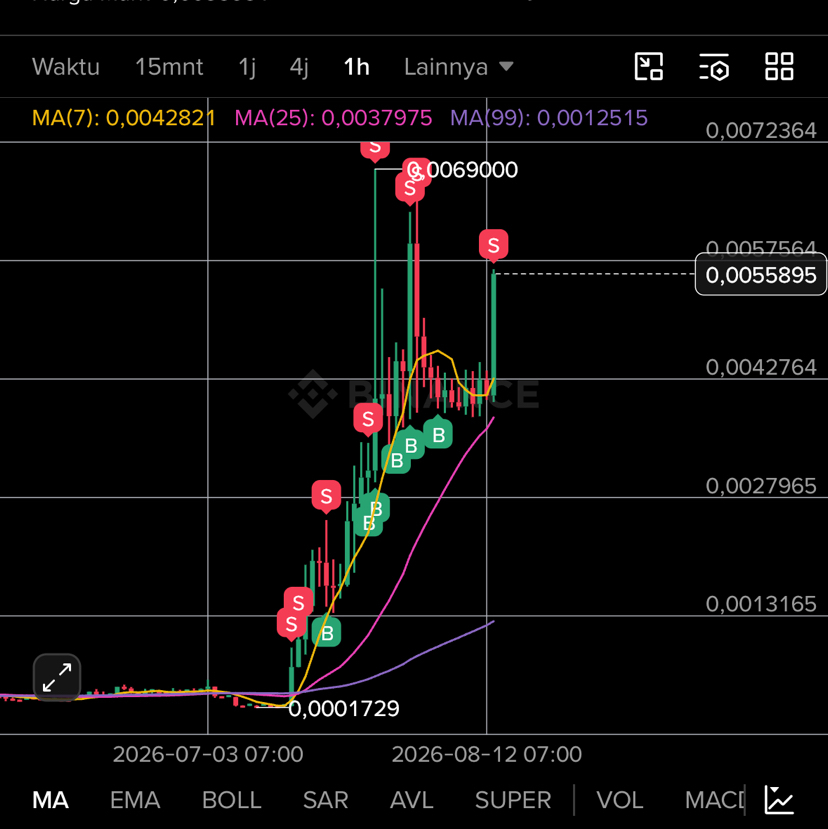
Nach den Ereignissen des Token-Unlocks von Akedo (AKE) in Höhe von ungefähr 2,13 Milliarden AKE (≈ 9,3 % des umlaufenden Angebots) am 21. Juli 2026 zeigt die AKE-Koin-Lage eine interessante Dynamik:
1. Preisleistung & Marktreaktion
Starker Rückprall (Rebound): Obwohl es potenziellen Verkaufsdruck durch eine Erhöhung des Angebots (Supply Dilution) geben könnte, verzeichnete der AKE-Preis stattdessen in der kurzfristigen Perspektive einen kräftigen Anstieg.
7-Tage-Trend: AKE meldet einen deutlichen Anstieg (mehr als 170 %–220 % in den letzten 7 Tagen), erholt sich von seinem lokalen Tiefpunkt Mitte Juli.
Handelsvolumen: Das tägliche Handelsvolumen von AKE an der wichtigsten Börse Kuc** Gec** steigt stark an, was auf eine relativ hohe Käufernachfrage (buying demand) hindeutet, um das neue, durch den Unlock freigesetzte Angebot zu absorbieren.
2. Die wichtigsten Treiber
Triebkraft: KI- & Game-Sektor (Vibe Coding): Akedo als KI-gestützte (AI-powered) Gaming-Engine-Ökosystem nutzt weiterhin den positiven Sentiment-Trend im KI- und Web3-Gaming-Sektor, wodurch Spekulationen und Akkumulationen bei Tradern gefördert werden.
Effektive Absorption des Angebots: Der Verkaufsdruck durch die Freigabe gesperrter Tokens (unlock) konnte durch die Marktlage-Liquidität absorbiert werden, sodass es nicht zu einer tiefen Preiskorrektur (Dump) kommt.
3. Worauf zu achten ist
Hohe Volatilität: Der starke Anstieg nach dem Unlock geht häufig mit Gewinnmitnahmen (profit taking) von frühen Investoren oder Tages-Tradern einher.
Nächster Unlock-Zeitplan: Beobachten Sie den Zeitplan für die folgenden, schrittweisen Token-Freigaben, um potenzielle Wellen neuen Angebots auf dem Markt vorwegzunehmen.
$AKE #AKE #AKETRADE
{future}(AKEUSDT)
Nach den Ereignissen des Token-Unlocks von Akedo (AKE) in Höhe von ungefähr 2,13 Milliarden AKE (≈ 9,3 % des umlaufenden Angebots) am 21. Juli 2026 zeigt die AKE-Koin-Lage eine interessante Dynamik:
1. Preisleistung & Marktreaktion
Starker Rückprall (Rebound): Obwohl es potenziellen Verkaufsdruck durch eine Erhöhung des Angebots (Supply Dilution) geben könnte, verzeichnete der AKE-Preis stattdessen in der kurzfristigen Perspektive einen kräftigen Anstieg.
7-Tage-Trend: AKE meldet einen deutlichen Anstieg (mehr als 170 %–220 % in den letzten 7 Tagen), erholt sich von seinem lokalen Tiefpunkt Mitte Juli.
Handelsvolumen: Das tägliche Handelsvolumen von AKE an der wichtigsten Börse Kuc** Gec** steigt stark an, was auf eine relativ hohe Käufernachfrage (buying demand) hindeutet, um das neue, durch den Unlock freigesetzte Angebot zu absorbieren.
2. Die wichtigsten Treiber
Triebkraft: KI- & Game-Sektor (Vibe Coding): Akedo als KI-gestützte (AI-powered) Gaming-Engine-Ökosystem nutzt weiterhin den positiven Sentiment-Trend im KI- und Web3-Gaming-Sektor, wodurch Spekulationen und Akkumulationen bei Tradern gefördert werden.
Effektive Absorption des Angebots: Der Verkaufsdruck durch die Freigabe gesperrter Tokens (unlock) konnte durch die Marktlage-Liquidität absorbiert werden, sodass es nicht zu einer tiefen Preiskorrektur (Dump) kommt.
3. Worauf zu achten ist
Hohe Volatilität: Der starke Anstieg nach dem Unlock geht häufig mit Gewinnmitnahmen (profit taking) von frühen Investoren oder Tages-Tradern einher.
Nächster Unlock-Zeitplan: Beobachten Sie den Zeitplan für die folgenden, schrittweisen Token-Freigaben, um potenzielle Wellen neuen Angebots auf dem Markt vorwegzunehmen.
$AKE #AKE #AKETRADE
1. Preisleistung & Marktreaktion
Starker Rückprall (Rebound): Obwohl es potenziellen Verkaufsdruck durch eine Erhöhung des Angebots (Supply Dilution) geben könnte, verzeichnete der AKE-Preis stattdessen in der kurzfristigen Perspektive einen kräftigen Anstieg.
7-Tage-Trend: AKE meldet einen deutlichen Anstieg (mehr als 170 %–220 % in den letzten 7 Tagen), erholt sich von seinem lokalen Tiefpunkt Mitte Juli.
Handelsvolumen: Das tägliche Handelsvolumen von AKE an der wichtigsten Börse Kuc** Gec** steigt stark an, was auf eine relativ hohe Käufernachfrage (buying demand) hindeutet, um das neue, durch den Unlock freigesetzte Angebot zu absorbieren.
2. Die wichtigsten Treiber
Triebkraft: KI- & Game-Sektor (Vibe Coding): Akedo als KI-gestützte (AI-powered) Gaming-Engine-Ökosystem nutzt weiterhin den positiven Sentiment-Trend im KI- und Web3-Gaming-Sektor, wodurch Spekulationen und Akkumulationen bei Tradern gefördert werden.
Effektive Absorption des Angebots: Der Verkaufsdruck durch die Freigabe gesperrter Tokens (unlock) konnte durch die Marktlage-Liquidität absorbiert werden, sodass es nicht zu einer tiefen Preiskorrektur (Dump) kommt.
3. Worauf zu achten ist
Hohe Volatilität: Der starke Anstieg nach dem Unlock geht häufig mit Gewinnmitnahmen (profit taking) von frühen Investoren oder Tages-Tradern einher.
Nächster Unlock-Zeitplan: Beobachten Sie den Zeitplan für die folgenden, schrittweisen Token-Freigaben, um potenzielle Wellen neuen Angebots auf dem Markt vorwegzunehmen.
$AKE #AKE #AKETRADE
3
1.1k

·
--
$AKE
{future}(AKEUSDT)
$AKE Coin zeigt derzeit eine gemischte Dynamik. Der Kursverlauf wirkt unentschlossen: Käufer versuchen, den Support zu halten, während Verkäufer in der Nähe der Widerstandszonen noch aktiv sind. Wenn das Volumen nach oben zunimmt, könnte AKE versuchen, einen kurzfristigen Ausbruch zu wagen. Wenn jedoch der Support bricht, könnte der Preis erneut nach unten rutschen, bevor es zur Erholung kommt.
Trend: Neutral bis leicht bullisch
Support-Zone: Käufer könnten hier die tieferen Kursniveaus verteidigen
Widerstands-Zone: Der Preis könnte Schwierigkeiten haben, diese Zone nach oben zu durchbrechen
Risiko: Die Volatilität bleibt hoch, daher ist Bestätigung wichtig, bevor man einen Trade eingeht
Trading-Idee:
Warte auf einen klaren Ausbruch mit Volumen für einen sichereren Long-Einstieg
Wenn der Preis unter den Support fällt, nicht hinterherrennen, sondern auf Stabilisierung warten
Nutze den Stop-Loss sorgfältig, da Low-Cap-Coins sich stark bewegen können
Kurzfassung: AKE Coin ist möglicherweise handelbar, aber es wird eine Bestätigung benötigt. Ein Ausbruch über den Widerstand könnte einen bullischen Impuls auslösen, während ein Breakdown unter dem Support zu mehr Verkaufsdruck führen kann.#AKE #AKETRADE #ake #AkashNetwork
$AKE
$AKE Coin zeigt derzeit eine gemischte Dynamik. Der Kursverlauf wirkt unentschlossen: Käufer versuchen, den Support zu halten, während Verkäufer in der Nähe der Widerstandszonen noch aktiv sind. Wenn das Volumen nach oben zunimmt, könnte AKE versuchen, einen kurzfristigen Ausbruch zu wagen. Wenn jedoch der Support bricht, könnte der Preis erneut nach unten rutschen, bevor es zur Erholung kommt.
Trend: Neutral bis leicht bullisch
Support-Zone: Käufer könnten hier die tieferen Kursniveaus verteidigen
Widerstands-Zone: Der Preis könnte Schwierigkeiten haben, diese Zone nach oben zu durchbrechen
Risiko: Die Volatilität bleibt hoch, daher ist Bestätigung wichtig, bevor man einen Trade eingeht
Trading-Idee:
Warte auf einen klaren Ausbruch mit Volumen für einen sichereren Long-Einstieg
Wenn der Preis unter den Support fällt, nicht hinterherrennen, sondern auf Stabilisierung warten
Nutze den Stop-Loss sorgfältig, da Low-Cap-Coins sich stark bewegen können
Kurzfassung: AKE Coin ist möglicherweise handelbar, aber es wird eine Bestätigung benötigt. Ein Ausbruch über den Widerstand könnte einen bullischen Impuls auslösen, während ein Breakdown unter dem Support zu mehr Verkaufsdruck führen kann.#AKE #AKETRADE #ake #AkashNetwork
$AKE Coin zeigt derzeit eine gemischte Dynamik. Der Kursverlauf wirkt unentschlossen: Käufer versuchen, den Support zu halten, während Verkäufer in der Nähe der Widerstandszonen noch aktiv sind. Wenn das Volumen nach oben zunimmt, könnte AKE versuchen, einen kurzfristigen Ausbruch zu wagen. Wenn jedoch der Support bricht, könnte der Preis erneut nach unten rutschen, bevor es zur Erholung kommt.
Trend: Neutral bis leicht bullisch
Support-Zone: Käufer könnten hier die tieferen Kursniveaus verteidigen
Widerstands-Zone: Der Preis könnte Schwierigkeiten haben, diese Zone nach oben zu durchbrechen
Risiko: Die Volatilität bleibt hoch, daher ist Bestätigung wichtig, bevor man einen Trade eingeht
Trading-Idee:
Warte auf einen klaren Ausbruch mit Volumen für einen sichereren Long-Einstieg
Wenn der Preis unter den Support fällt, nicht hinterherrennen, sondern auf Stabilisierung warten
Nutze den Stop-Loss sorgfältig, da Low-Cap-Coins sich stark bewegen können
Kurzfassung: AKE Coin ist möglicherweise handelbar, aber es wird eine Bestätigung benötigt. Ein Ausbruch über den Widerstand könnte einen bullischen Impuls auslösen, während ein Breakdown unter dem Support zu mehr Verkaufsdruck führen kann.#AKE #AKETRADE #ake #AkashNetwork
309

DIVERGENZ-Flash auf $AKE Der Preis macht neue Hochs, während der RSI das nicht mitmacht.
KURZ
Trading-Plan:
Einstieg: 0.0018500 – 0.0019692
SL: 0.0021500
TP1: 0.0015000
TP2: 0.0010000
TP3: 0.0005000
Warum dieses Setup?
Das RSI-Panel zeigt eine lehrbuchmäßige bullische Divergenz, zweimal direkt im Chart markiert: Jedes neue Preis-Hoch seit dem Breakout wurde von einem niedrigeren RSI-Peak begleitet, selbst wenn der RSI noch bei 73.11 im überkauften Bereich hoch bleibt.
Der Preis ist deutlich über der ehemaligen Widerstandsbox (0.0010–0.0015) gelaufen, die nun als erste Unterstützungszone darunter liegt, mit der roten Linie bei 0.0010 und der blauen Linie nahe 0.0005 als tiefere strukturelle Levels.
Der Momentum-Impuls ist klar überdehnt, und das Abflauen der RSI-Peaks neben der anhaltenden Preis-Ausweitung ist eine klassische frühe Warnung dafür, dass die Kaufkraft nachlässt, während der Preis weiter nach oben drückt. Ein Stopp oder eine Umkehr von hier aus würde sich wahrscheinlich zunächst zurück in die gebrochene Widerstandszone ziehen, bevor frische Nachfrage gefunden wird.
#AKETRADE #Crypto
Hier klicken, um zu handeln 👇
{future}(AKEUSDT)
DIVERGENZ-Flash auf $AKE Der Preis macht neue Hochs, während der RSI das nicht mitmacht.
KURZ
Trading-Plan:
Einstieg: 0.0018500 – 0.0019692
SL: 0.0021500
TP1: 0.0015000
TP2: 0.0010000
TP3: 0.0005000
Warum dieses Setup?
Das RSI-Panel zeigt eine lehrbuchmäßige bullische Divergenz, zweimal direkt im Chart markiert: Jedes neue Preis-Hoch seit dem Breakout wurde von einem niedrigeren RSI-Peak begleitet, selbst wenn der RSI noch bei 73.11 im überkauften Bereich hoch bleibt.
Der Preis ist deutlich über der ehemaligen Widerstandsbox (0.0010–0.0015) gelaufen, die nun als erste Unterstützungszone darunter liegt, mit der roten Linie bei 0.0010 und der blauen Linie nahe 0.0005 als tiefere strukturelle Levels.
Der Momentum-Impuls ist klar überdehnt, und das Abflauen der RSI-Peaks neben der anhaltenden Preis-Ausweitung ist eine klassische frühe Warnung dafür, dass die Kaufkraft nachlässt, während der Preis weiter nach oben drückt. Ein Stopp oder eine Umkehr von hier aus würde sich wahrscheinlich zunächst zurück in die gebrochene Widerstandszone ziehen, bevor frische Nachfrage gefunden wird.
#AKETRADE #Crypto
Hier klicken, um zu handeln 👇
KURZ
Trading-Plan:
Einstieg: 0.0018500 – 0.0019692
SL: 0.0021500
TP1: 0.0015000
TP2: 0.0010000
TP3: 0.0005000
Warum dieses Setup?
Das RSI-Panel zeigt eine lehrbuchmäßige bullische Divergenz, zweimal direkt im Chart markiert: Jedes neue Preis-Hoch seit dem Breakout wurde von einem niedrigeren RSI-Peak begleitet, selbst wenn der RSI noch bei 73.11 im überkauften Bereich hoch bleibt.
Der Preis ist deutlich über der ehemaligen Widerstandsbox (0.0010–0.0015) gelaufen, die nun als erste Unterstützungszone darunter liegt, mit der roten Linie bei 0.0010 und der blauen Linie nahe 0.0005 als tiefere strukturelle Levels.
Der Momentum-Impuls ist klar überdehnt, und das Abflauen der RSI-Peaks neben der anhaltenden Preis-Ausweitung ist eine klassische frühe Warnung dafür, dass die Kaufkraft nachlässt, während der Preis weiter nach oben drückt. Ein Stopp oder eine Umkehr von hier aus würde sich wahrscheinlich zunächst zurück in die gebrochene Widerstandszone ziehen, bevor frische Nachfrage gefunden wird.
#AKETRADE #Crypto
Hier klicken, um zu handeln 👇
1
239
·
--
Bärisch
$AKE Alart dump here.....
Preissenkung :0.0016500 auf 0.0013//12
Risikomanagement
Höheres Volumen
{future}(AKEUSDT)
#KoreanTradersCutLeverageToThreeMonthLow #IranPresidentSaysFullScaleWarWithUS #AKETRADE Bitcoin erreicht den höchsten Stand eines Monats bei 65700 $ und fällt dann wieder zurück
$AKE Alart dump here.....
Preissenkung :0.0016500 auf 0.0013//12
Risikomanagement
Höheres Volumen
#KoreanTradersCutLeverageToThreeMonthLow #IranPresidentSaysFullScaleWarWithUS #AKETRADE Bitcoin erreicht den höchsten Stand eines Monats bei 65700 $ und fällt dann wieder zurück
Preissenkung :0.0016500 auf 0.0013//12
Risikomanagement
Höheres Volumen
#KoreanTradersCutLeverageToThreeMonthLow #IranPresidentSaysFullScaleWarWithUS #AKETRADE Bitcoin erreicht den höchsten Stand eines Monats bei 65700 $ und fällt dann wieder zurück
2
388

·
--
$AKE gehört zu den derzeit stärkst performenden Altcoins und steigt in den letzten 24 Stunden ungefähr um 24–36%, je nach Börse.
Long-Einstieg: 0,0020–0,0022
Ziel 1: 0,0025
Ziel 2: 0,0030
Ziel 3: 0,0036
Stop-Loss: Unter 0,0019
Short-Position:
Ein Short-Trade ist derzeit nicht ideal, solange der Trend weiterhin bullisch ist.
Ein Short-Setup wird erst dann sinnvoller, wenn AKE die Unterstützung bei 0,0020 mit starkem Verkaufsvolumen verliert.
Für heute ist es sicherer, bei einem Dip zu kaufen (Long), statt dem Kurs hinterherzulaufen. Gehe nicht nach einer großen grünen Kerze in den Trade, da Gewinnmitnahmen einen scharfen Rücksetzer auslösen könnten.
#AKE #AKETRADE #bank
$AKE
{future}(AKEUSDT)
$BANK
{future}(BANKUSDT)
$AKE gehört zu den derzeit stärkst performenden Altcoins und steigt in den letzten 24 Stunden ungefähr um 24–36%, je nach Börse.
Long-Einstieg: 0,0020–0,0022
Ziel 1: 0,0025
Ziel 2: 0,0030
Ziel 3: 0,0036
Stop-Loss: Unter 0,0019
Short-Position:
Ein Short-Trade ist derzeit nicht ideal, solange der Trend weiterhin bullisch ist.
Ein Short-Setup wird erst dann sinnvoller, wenn AKE die Unterstützung bei 0,0020 mit starkem Verkaufsvolumen verliert.
Für heute ist es sicherer, bei einem Dip zu kaufen (Long), statt dem Kurs hinterherzulaufen. Gehe nicht nach einer großen grünen Kerze in den Trade, da Gewinnmitnahmen einen scharfen Rücksetzer auslösen könnten.
#AKE #AKETRADE #bank
$AKE
$BANK
Long-Einstieg: 0,0020–0,0022
Ziel 1: 0,0025
Ziel 2: 0,0030
Ziel 3: 0,0036
Stop-Loss: Unter 0,0019
Short-Position:
Ein Short-Trade ist derzeit nicht ideal, solange der Trend weiterhin bullisch ist.
Ein Short-Setup wird erst dann sinnvoller, wenn AKE die Unterstützung bei 0,0020 mit starkem Verkaufsvolumen verliert.
Für heute ist es sicherer, bei einem Dip zu kaufen (Long), statt dem Kurs hinterherzulaufen. Gehe nicht nach einer großen grünen Kerze in den Trade, da Gewinnmitnahmen einen scharfen Rücksetzer auslösen könnten.
#AKE #AKETRADE #bank
$AKE
$BANK
2
408

·
--
$AKE Coin zeigt gemischten Momentum-Verlauf, da der Kryptomarkt weiterhin volatil bleibt. Wenn das Kaufvolumen zunimmt und das Projekt sich weiterentwickelt, könnte AKE einen kurzfristigen Aufwärtsschub sehen. Schwaches Markt-Stimmungsbild oder geringere Handelsaktivität könnten jedoch zu einem Preisrückgang führen.
{future}(AKEUSDT)
#AKE #FootballSeason2026 #AKETRADE
$AKE Coin zeigt gemischten Momentum-Verlauf, da der Kryptomarkt weiterhin volatil bleibt. Wenn das Kaufvolumen zunimmt und das Projekt sich weiterentwickelt, könnte AKE einen kurzfristigen Aufwärtsschub sehen. Schwaches Markt-Stimmungsbild oder geringere Handelsaktivität könnten jedoch zu einem Preisrückgang führen.
#AKE #FootballSeason2026 #AKETRADE
#AKE #FootballSeason2026 #AKETRADE
153
Anmelden und weiter Inhalte entdecken
Krypto-Nutzer weltweit auf Binance Square kennenlernen
⚡️ Bleib in Sachen Krypto stets am Puls.
💬 Die weltgrößte Kryptobörse vertraut darauf.
👍 Erhalte verlässliche Einblicke von verifizierten Creators.
E-Mail-Adresse/Telefonnummer
Trendthemen
1
#DeepSeekReleasesUpdatedAIModel
2,798 Aufrufe
40 Kommentare
2
#CelestiaRises16%To2026High
216,891 Aufrufe
1,309 Kommentare
3
#NasdaqDowWeeklyGapWidestSinceJuly2002
108,318 Aufrufe
968 Kommentare
4
#Nasdaq100Falls5.5%InWorstWeekIn18Months
55,854 Aufrufe
727 Kommentare
5
#StrategySharesFall9%OnFriday
72,134 Aufrufe
677 Kommentare
6
#USPPIRises6.3%YearOverYear
111,436 Aufrufe
868 Kommentare
7
#CelestiaLaunchesEdenToTestAIAgentTrading
65,337 Aufrufe
804 Kommentare
8
#ETHDropsBelow2400USDT
128,412 Aufrufe
1,149 Kommentare
9
#CircleReports$1.4BInH1Revenue
5,620 Aufrufe
35 Kommentare
10
#BrentHits$110ForFirstTimeSinceMay
8,302 Aufrufe
49 Kommentare