
#tradingtips
tradingtips
9.8M Aufrufe
22,836 Kommentare
Hot
Zuletzt

·
--
Übersetzung ansehen
Your stop on $STRK is probably too tight. It’s at $0.02727, but the 24h low is $0.02608.
A stop below $0.02608 is where you’d be proven wrong.
Anything above that gets clipped by normal noise.
The 1h ATR is 1.6% of price that’s about $0.00044 of swing.
So placing a stop at $0.02680? That’s just feeding the market.
Tap $STRK and look at the last 24 hourly candles, the level is right there.
Place your stop below the last clear 24h swing low. Not a round number. Not a percentage.
What’s your stop rule?
Binance data as of 16 Sep 22:00 UTC. Not financial advice.
#STRK #TradingTips
Your stop on $STRK is probably too tight. It’s at $0.02727, but the 24h low is $0.02608.
A stop below $0.02608 is where you’d be proven wrong.
Anything above that gets clipped by normal noise.
The 1h ATR is 1.6% of price that’s about $0.00044 of swing.
So placing a stop at $0.02680? That’s just feeding the market.
Tap $STRK and look at the last 24 hourly candles, the level is right there.
Place your stop below the last clear 24h swing low. Not a round number. Not a percentage.
What’s your stop rule?
Binance data as of 16 Sep 22:00 UTC. Not financial advice.
#STRK #TradingTips
A stop below $0.02608 is where you’d be proven wrong.
Anything above that gets clipped by normal noise.
The 1h ATR is 1.6% of price that’s about $0.00044 of swing.
So placing a stop at $0.02680? That’s just feeding the market.
Tap $STRK and look at the last 24 hourly candles, the level is right there.
Place your stop below the last clear 24h swing low. Not a round number. Not a percentage.
What’s your stop rule?
Binance data as of 16 Sep 22:00 UTC. Not financial advice.
#STRK #TradingTips
15

·
--
Bullisch
Übersetzung ansehen
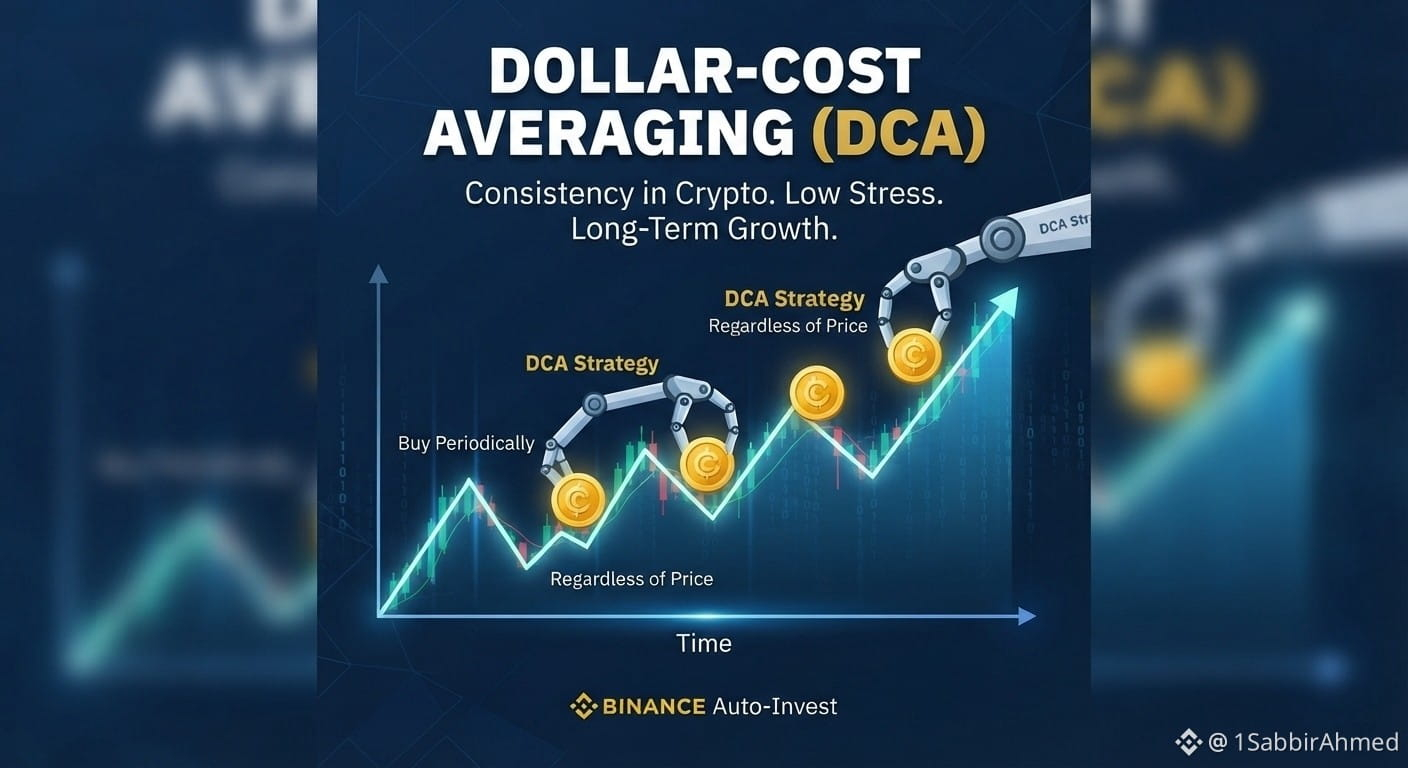
#FedRateWatch FedRateWatch Want to Grow Your Crypto Without Stress? Try DCA! 📈
Timing the market is hard. Instead of trying to buy the perfect dip, use Dollar-Cost Averaging (DCA).
🔍 What is DCA?
Investing a fixed amount of money at regular intervals (e.g., $10 every week), no matter the price.
📊 Why it works:
• No Stress: You don't have to watch charts 24/7.
• Lower Risk: It lowers your average buying cost over time.
• Automated: You can use Binance Auto-Invest to do it automatically for top coins like $BTC, $ETH, or $BNB.
Start small, stay consistent, and let compound interest do the work! 🚀
What is your favorite coin to accumulate? Drop a comment below! 👇
#CryptoInvesting #TradingTips #BinanceAutoInvest 🤩
#FedRateWatch FedRateWatch Want to Grow Your Crypto Without Stress? Try DCA! 📈
Timing the market is hard. Instead of trying to buy the perfect dip, use Dollar-Cost Averaging (DCA).
🔍 What is DCA?
Investing a fixed amount of money at regular intervals (e.g., $10 every week), no matter the price.
📊 Why it works:
• No Stress: You don't have to watch charts 24/7.
• Lower Risk: It lowers your average buying cost over time.
• Automated: You can use Binance Auto-Invest to do it automatically for top coins like $BTC, $ETH, or $BNB.
Start small, stay consistent, and let compound interest do the work! 🚀
What is your favorite coin to accumulate? Drop a comment below! 👇
#CryptoInvesting #TradingTips #BinanceAutoInvest 🤩
Timing the market is hard. Instead of trying to buy the perfect dip, use Dollar-Cost Averaging (DCA).
🔍 What is DCA?
Investing a fixed amount of money at regular intervals (e.g., $10 every week), no matter the price.
📊 Why it works:
• No Stress: You don't have to watch charts 24/7.
• Lower Risk: It lowers your average buying cost over time.
• Automated: You can use Binance Auto-Invest to do it automatically for top coins like $BTC, $ETH, or $BNB.
Start small, stay consistent, and let compound interest do the work! 🚀
What is your favorite coin to accumulate? Drop a comment below! 👇
#CryptoInvesting #TradingTips #BinanceAutoInvest 🤩
92

·
--
Übersetzung ansehen
🧠 The Best Trade Can Be No Trade
When the market becomes highly volatile, patience becomes a strategy.
Don't enter because everyone is shouting “BUY.”
Don't short because everyone is shouting “DUMP.”
Wait for your setup.
Set your risk.
Follow your plan.
What's your biggest trading rule? 👇
#CryptoTrading #Bitcoin #Binance #TradingTips
{spot}(BTCUSDT)
🧠 The Best Trade Can Be No Trade
When the market becomes highly volatile, patience becomes a strategy.
Don't enter because everyone is shouting “BUY.”
Don't short because everyone is shouting “DUMP.”
Wait for your setup.
Set your risk.
Follow your plan.
What's your biggest trading rule? 👇
#CryptoTrading #Bitcoin #Binance #TradingTips
When the market becomes highly volatile, patience becomes a strategy.
Don't enter because everyone is shouting “BUY.”
Don't short because everyone is shouting “DUMP.”
Wait for your setup.
Set your risk.
Follow your plan.
What's your biggest trading rule? 👇
#CryptoTrading #Bitcoin #Binance #TradingTips
9

5 Krypto-Trading-Fehler, die Anfänger immer wieder machen
Die meisten Anfänger verlieren kein Geld, weil sie zu wenig Indikatoren kennen.
Sie verlieren wegen einfacher Fehler.
Einstieg aus FOMO
Mit zu hohem Leverage handeln
Keinen Exit-Plan haben
Pumps hinterherjagen, nachdem die Bewegung schon passiert ist
Geld riskieren, das sie sich nicht leisten können zu verlieren
Der Markt muss dich nicht schlagen.
Manchmal schlagen dich deine eigenen Trading-Entscheidungen.
Welchen dieser Fehler hast du am häufigsten gesehen?
Hashtags:
#cryptotrading #TradingTips #CryptoEducation #RiskManagement
$JUP
{future}(JUPUSDT)
$ENA
{future}(ENAUSDT)
$UNI
{future}(UNIUSDT)
5 Krypto-Trading-Fehler, die Anfänger immer wieder machen
Die meisten Anfänger verlieren kein Geld, weil sie zu wenig Indikatoren kennen.
Sie verlieren wegen einfacher Fehler.
Einstieg aus FOMO
Mit zu hohem Leverage handeln
Keinen Exit-Plan haben
Pumps hinterherjagen, nachdem die Bewegung schon passiert ist
Geld riskieren, das sie sich nicht leisten können zu verlieren
Der Markt muss dich nicht schlagen.
Manchmal schlagen dich deine eigenen Trading-Entscheidungen.
Welchen dieser Fehler hast du am häufigsten gesehen?
Hashtags:
#cryptotrading #TradingTips #CryptoEducation #RiskManagement
$JUP
$ENA
$UNI
Die meisten Anfänger verlieren kein Geld, weil sie zu wenig Indikatoren kennen.
Sie verlieren wegen einfacher Fehler.
Einstieg aus FOMO
Mit zu hohem Leverage handeln
Keinen Exit-Plan haben
Pumps hinterherjagen, nachdem die Bewegung schon passiert ist
Geld riskieren, das sie sich nicht leisten können zu verlieren
Der Markt muss dich nicht schlagen.
Manchmal schlagen dich deine eigenen Trading-Entscheidungen.
Welchen dieser Fehler hast du am häufigsten gesehen?
Hashtags:
#cryptotrading #TradingTips #CryptoEducation #RiskManagement
$JUP
$ENA
$UNI

98

·
--
Artikel
Übersetzung ansehen
3 Errores comunes que te hacen perder dinero en Cripto (¡y cómo evitarlos hoy!) 🛑El mercado de las criptomonedas se mueve rápido, y es normal cometer errores cuando estás empezando. Sin embargo, la diferencia entre un inversor que gana dinero y uno que lo pierde todo está en la educación.Si quieres proteger tu capital en este ciclo de mercado con monedas como $BTC , ETH o SOL , asegúrate de evitar estos tres errores fundamentales:
1. Operar por FOMO (Miedo a quedarse fuera) 📈
Ver que una criptomoneda sube un 50% en un día y comprar desesperadamente por miedo a perderte la subida es el error más clásico. Por lo general, cuando compras en verde intenso, estás comprando en la cima y los inversores experimentados aprovechan para venderte.
👉 Regla de oro: Compra en los días rojos (correcciones) y mantén la calma en los días verdes.
2. No tener un plan de salida (Tomar ganancias)
💰Ver tu billetera crecer se siente genial, pero las ganancias no son reales hasta que no vendes. Muchos inversores ven su portafolio subir un 300% y, por avaricia, no venden esperando que suba más, solo para ver el mercado caer de golpe después.
👉 Regla de oro: Fija metas. Si tu moneda sube, retira tu inversión inicial o toma ganancias parciales en monedas estables como USDC.
3. Arriesgar dinero que necesitas para vivir⚠️
El mercado cripto es altamente volátil. Nunca inviertas el dinero del alquiler, de la comida o tus ahorros de emergencia. Invierte solo capital que, en el peor de los casos, puedas permitirte mantener bloqueado o perder sin afectar tu calidad de vida.
💬 ¡Quiero leerte en los comentarios!
¿Cuál de estos tres errores has cometido alguna vez o cuál crees que es el más peligroso? Déjamelo saber abajo para debatir.👇💡 Recuerda seguir mi perfil para no perderte los próximos análisis de mercado y guías educativas. ¡Dale like y comparte si te sirvió!
(Descargo de responsabilidad: Esto no es un consejo financiero. Siempre haz tu propia investigación / DYOR).
#CryptoInvesting #tradingtips #dyor #BinanceSquare $SOL $BITCOIN $ETH
{spot}(SOLUSDT)
3 Errores comunes que te hacen perder dinero en Cripto (¡y cómo evitarlos hoy!) 🛑
El mercado de las criptomonedas se mueve rápido, y es normal cometer errores cuando estás empezando. Sin embargo, la diferencia entre un inversor que gana dinero y uno que lo pierde todo está en la educación.Si quieres proteger tu capital en este ciclo de mercado con monedas como $BTC , ETH o SOL , asegúrate de evitar estos tres errores fundamentales:
1. Operar por FOMO (Miedo a quedarse fuera) 📈
Ver que una criptomoneda sube un 50% en un día y comprar desesperadamente por miedo a perderte la subida es el error más clásico. Por lo general, cuando compras en verde intenso, estás comprando en la cima y los inversores experimentados aprovechan para venderte.
👉 Regla de oro: Compra en los días rojos (correcciones) y mantén la calma en los días verdes.
2. No tener un plan de salida (Tomar ganancias)
💰Ver tu billetera crecer se siente genial, pero las ganancias no son reales hasta que no vendes. Muchos inversores ven su portafolio subir un 300% y, por avaricia, no venden esperando que suba más, solo para ver el mercado caer de golpe después.
👉 Regla de oro: Fija metas. Si tu moneda sube, retira tu inversión inicial o toma ganancias parciales en monedas estables como USDC.
3. Arriesgar dinero que necesitas para vivir⚠️
El mercado cripto es altamente volátil. Nunca inviertas el dinero del alquiler, de la comida o tus ahorros de emergencia. Invierte solo capital que, en el peor de los casos, puedas permitirte mantener bloqueado o perder sin afectar tu calidad de vida.
💬 ¡Quiero leerte en los comentarios!
¿Cuál de estos tres errores has cometido alguna vez o cuál crees que es el más peligroso? Déjamelo saber abajo para debatir.👇💡 Recuerda seguir mi perfil para no perderte los próximos análisis de mercado y guías educativas. ¡Dale like y comparte si te sirvió!
(Descargo de responsabilidad: Esto no es un consejo financiero. Siempre haz tu propia investigación / DYOR).
#CryptoInvesting #tradingtips #dyor #BinanceSquare $SOL $BITCOIN $ETH
1. Operar por FOMO (Miedo a quedarse fuera) 📈
Ver que una criptomoneda sube un 50% en un día y comprar desesperadamente por miedo a perderte la subida es el error más clásico. Por lo general, cuando compras en verde intenso, estás comprando en la cima y los inversores experimentados aprovechan para venderte.
👉 Regla de oro: Compra en los días rojos (correcciones) y mantén la calma en los días verdes.
2. No tener un plan de salida (Tomar ganancias)
💰Ver tu billetera crecer se siente genial, pero las ganancias no son reales hasta que no vendes. Muchos inversores ven su portafolio subir un 300% y, por avaricia, no venden esperando que suba más, solo para ver el mercado caer de golpe después.
👉 Regla de oro: Fija metas. Si tu moneda sube, retira tu inversión inicial o toma ganancias parciales en monedas estables como USDC.
3. Arriesgar dinero que necesitas para vivir⚠️
El mercado cripto es altamente volátil. Nunca inviertas el dinero del alquiler, de la comida o tus ahorros de emergencia. Invierte solo capital que, en el peor de los casos, puedas permitirte mantener bloqueado o perder sin afectar tu calidad de vida.
💬 ¡Quiero leerte en los comentarios!
¿Cuál de estos tres errores has cometido alguna vez o cuál crees que es el más peligroso? Déjamelo saber abajo para debatir.👇💡 Recuerda seguir mi perfil para no perderte los próximos análisis de mercado y guías educativas. ¡Dale like y comparte si te sirvió!
(Descargo de responsabilidad: Esto no es un consejo financiero. Siempre haz tu propia investigación / DYOR).
#CryptoInvesting #tradingtips #dyor #BinanceSquare $SOL $BITCOIN $ETH
102

·
--
Übersetzung ansehen
If you have seen position sizing used and nodded along, here it is properly.
Sizing is how much of your account a single trade can cost you.
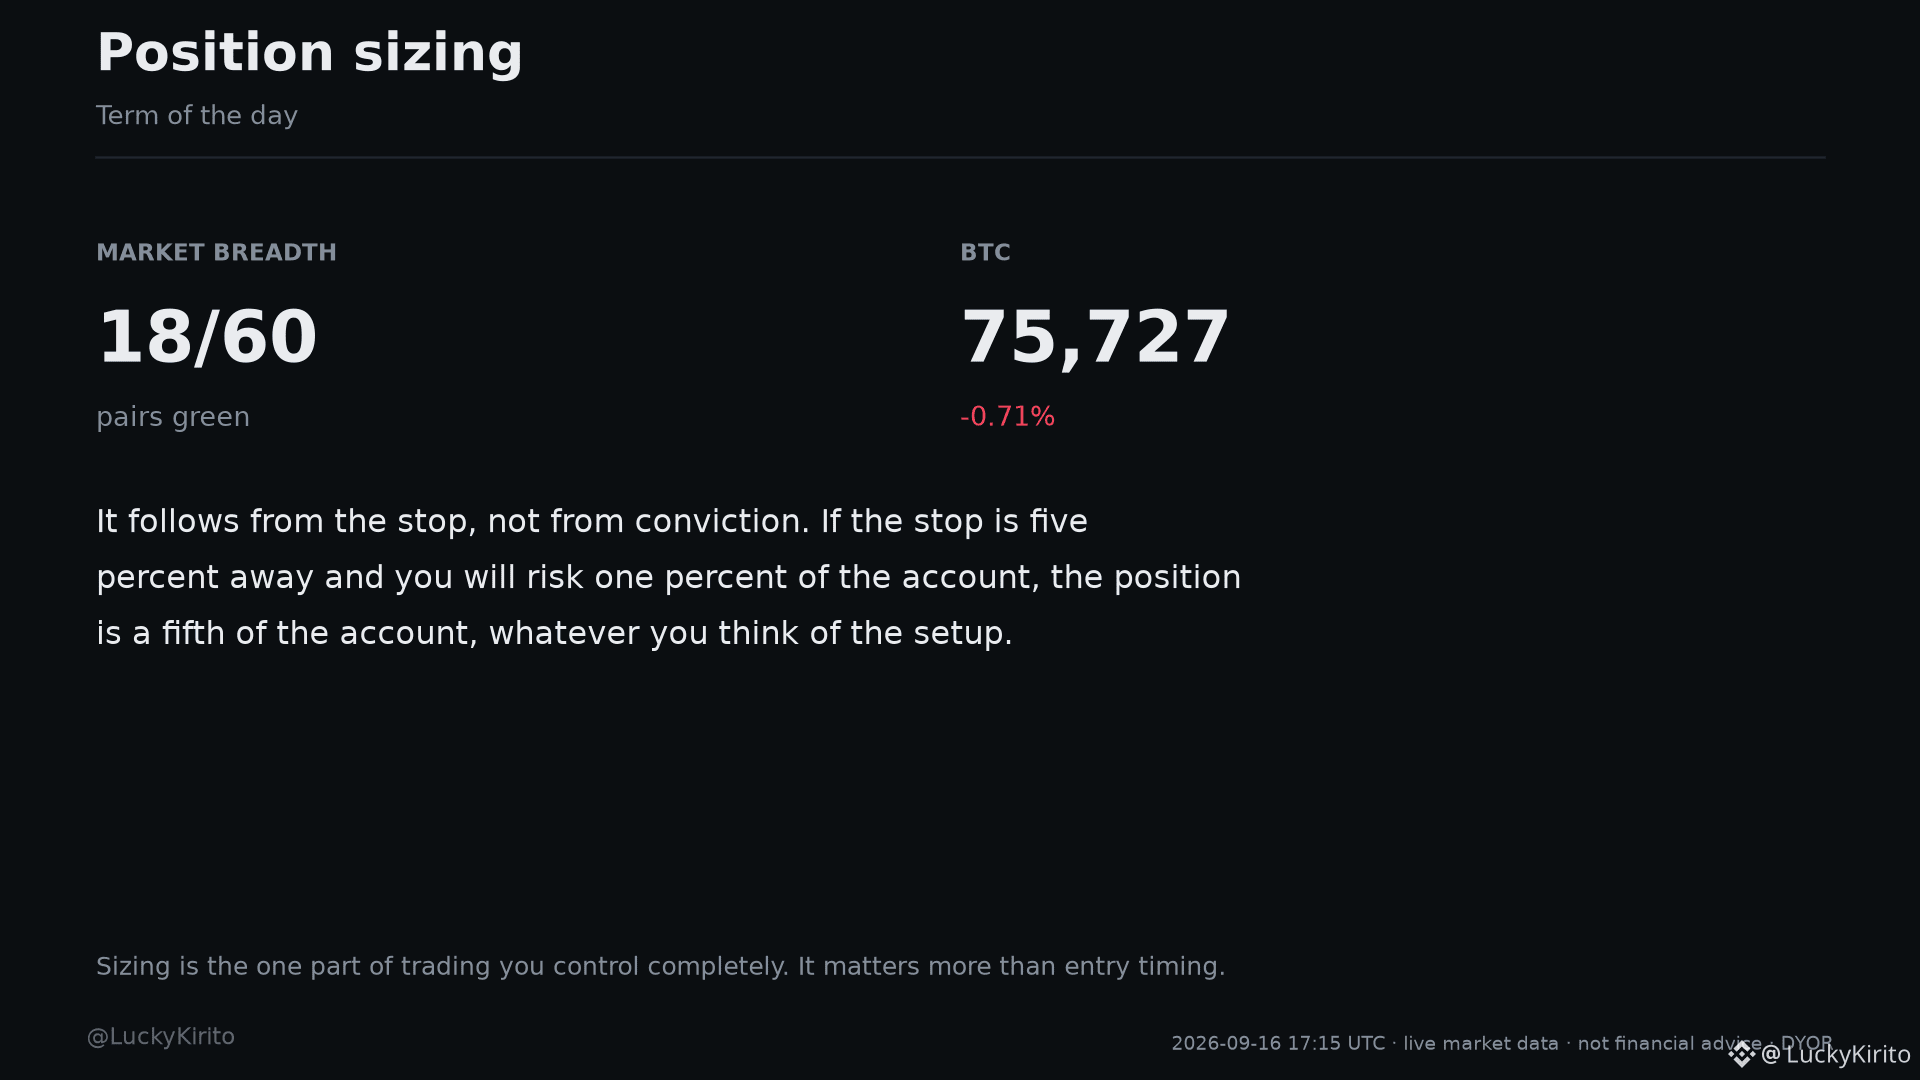
It follows from the stop, not from conviction. If the stop is five percent away and you will risk one percent of the account, the position is a fifth of the account, whatever you think of the setup.
Sizing is the one part of trading you control completely. It matters more than entry timing.
Right now: BTC at 75,727 (-0.71%), 18 of 60 liquid pairs green, SYN leading at +103.1%.
#Write2Earn #TradingTips #RiskManagement #TradingBasics
Automated technical analysis, not financial advice. I am not responsible for your trades. DYOR.
If you have seen position sizing used and nodded along, here it is properly.
Sizing is how much of your account a single trade can cost you.
It follows from the stop, not from conviction. If the stop is five percent away and you will risk one percent of the account, the position is a fifth of the account, whatever you think of the setup.
Sizing is the one part of trading you control completely. It matters more than entry timing.
Right now: BTC at 75,727 (-0.71%), 18 of 60 liquid pairs green, SYN leading at +103.1%.
#Write2Earn #TradingTips #RiskManagement #TradingBasics
Automated technical analysis, not financial advice. I am not responsible for your trades. DYOR.
Sizing is how much of your account a single trade can cost you.
It follows from the stop, not from conviction. If the stop is five percent away and you will risk one percent of the account, the position is a fifth of the account, whatever you think of the setup.
Sizing is the one part of trading you control completely. It matters more than entry timing.
Right now: BTC at 75,727 (-0.71%), 18 of 60 liquid pairs green, SYN leading at +103.1%.
#Write2Earn #TradingTips #RiskManagement #TradingBasics
Automated technical analysis, not financial advice. I am not responsible for your trades. DYOR.
45
·
--
$ZEC bewegt sich stündlich um 2,2 %. Die meisten sehen das wie einen Stablecoin.
Ein $1000-Konto kann bei einem einzelnen Trade nur $10 riskieren.
Das ist der maximale Verlust, falls der Stop ausgelöst wird.
Der 1h-ATR beträgt 2,2 % von $1269,25 = $27,92.
Du kannst also nur einen Stop in einem Abstand von $27,92 platzieren.
Tippe $ZEC und schau dir die letzten 24 stündlichen Kerzen an, das Niveau ist genau da.
Bemesse deine Position so, dass 2,2 % des Einstiegs 1 % deines Kontos entsprechen.
Was ist deine Positionsgrößen-Regel für volatile Coins?
Binance-Daten Stand 16. Sep 17:00 UTC. Keine Finanzberatung.
#ZEC #TradingTips
$ZEC bewegt sich stündlich um 2,2 %. Die meisten sehen das wie einen Stablecoin.
Ein $1000-Konto kann bei einem einzelnen Trade nur $10 riskieren.
Das ist der maximale Verlust, falls der Stop ausgelöst wird.
Der 1h-ATR beträgt 2,2 % von $1269,25 = $27,92.
Du kannst also nur einen Stop in einem Abstand von $27,92 platzieren.
Tippe $ZEC und schau dir die letzten 24 stündlichen Kerzen an, das Niveau ist genau da.
Bemesse deine Position so, dass 2,2 % des Einstiegs 1 % deines Kontos entsprechen.
Was ist deine Positionsgrößen-Regel für volatile Coins?
Binance-Daten Stand 16. Sep 17:00 UTC. Keine Finanzberatung.
#ZEC #TradingTips
Ein $1000-Konto kann bei einem einzelnen Trade nur $10 riskieren.
Das ist der maximale Verlust, falls der Stop ausgelöst wird.
Der 1h-ATR beträgt 2,2 % von $1269,25 = $27,92.
Du kannst also nur einen Stop in einem Abstand von $27,92 platzieren.
Tippe $ZEC und schau dir die letzten 24 stündlichen Kerzen an, das Niveau ist genau da.
Bemesse deine Position so, dass 2,2 % des Einstiegs 1 % deines Kontos entsprechen.
Was ist deine Positionsgrößen-Regel für volatile Coins?
Binance-Daten Stand 16. Sep 17:00 UTC. Keine Finanzberatung.
#ZEC #TradingTips
169
·
--
Übersetzung ansehen
$SYN volume is 67.0x its weekly average. Most traders ignore this and chase price instead.
Volume this high isn’t noise it’s conviction.
The price moved from $0.079 to $0.218 in 24 hours.
That’s a 175% swing.
But without volume, it’s just a flicker.
With this volume? It’s a market deciding to move.
Tap $SYN and look at the last 24 hourly candles, the level is right there.
Never trust a breakout unless volume is 5x or more above its 7-day average.
What’s your volume rule?
Binance data as of 16 Sep 16:30 UTC. Not financial advice.
#SYN #TradingTips
$SYN volume is 67.0x its weekly average. Most traders ignore this and chase price instead.
Volume this high isn’t noise it’s conviction.
The price moved from $0.079 to $0.218 in 24 hours.
That’s a 175% swing.
But without volume, it’s just a flicker.
With this volume? It’s a market deciding to move.
Tap $SYN and look at the last 24 hourly candles, the level is right there.
Never trust a breakout unless volume is 5x or more above its 7-day average.
What’s your volume rule?
Binance data as of 16 Sep 16:30 UTC. Not financial advice.
#SYN #TradingTips
Volume this high isn’t noise it’s conviction.
The price moved from $0.079 to $0.218 in 24 hours.
That’s a 175% swing.
But without volume, it’s just a flicker.
With this volume? It’s a market deciding to move.
Tap $SYN and look at the last 24 hourly candles, the level is right there.
Never trust a breakout unless volume is 5x or more above its 7-day average.
What’s your volume rule?
Binance data as of 16 Sep 16:30 UTC. Not financial advice.
#SYN #TradingTips
21

·
--
Übersetzung ansehen
Binance پر 3 بڑی غلطیاں جو نئے لوگ کرتے ہیں! 🚨
1. لیوریج کا زیادہ استعمال - ہائی لیوریج سے اکاؤنٹ چند منٹ میں صفر ہو سکتا ہے
2. سیکیورٹی نظر انداز کرنا - 2FA اور سیڈ فریز محفوظ نہ رکھنا = فنڈز کا خطرہ
3. FOMO میں انویسٹ - فومو میں خریداری نقصان کا سب سے بڑا سبب ہے
یاد رکھیں: Crypto میں صبر ہی سب سے بڑا منافع ہے 💰
آپ نے ان میں سے کون سی غلطی کی ہے؟ کمنٹ میں بتائیں 👇
#Binance #CryptoUrdu #Bitcoin #TradingTips
Binance پر 3 بڑی غلطیاں جو نئے لوگ کرتے ہیں! 🚨
1. لیوریج کا زیادہ استعمال - ہائی لیوریج سے اکاؤنٹ چند منٹ میں صفر ہو سکتا ہے
2. سیکیورٹی نظر انداز کرنا - 2FA اور سیڈ فریز محفوظ نہ رکھنا = فنڈز کا خطرہ
3. FOMO میں انویسٹ - فومو میں خریداری نقصان کا سب سے بڑا سبب ہے
یاد رکھیں: Crypto میں صبر ہی سب سے بڑا منافع ہے 💰
آپ نے ان میں سے کون سی غلطی کی ہے؟ کمنٹ میں بتائیں 👇
#Binance #CryptoUrdu #Bitcoin #TradingTips
1. لیوریج کا زیادہ استعمال - ہائی لیوریج سے اکاؤنٹ چند منٹ میں صفر ہو سکتا ہے
2. سیکیورٹی نظر انداز کرنا - 2FA اور سیڈ فریز محفوظ نہ رکھنا = فنڈز کا خطرہ
3. FOMO میں انویسٹ - فومو میں خریداری نقصان کا سب سے بڑا سبب ہے
یاد رکھیں: Crypto میں صبر ہی سب سے بڑا منافع ہے 💰
آپ نے ان میں سے کون سی غلطی کی ہے؟ کمنٹ میں بتائیں 👇
#Binance #CryptoUrdu #Bitcoin #TradingTips

69
·
--
Dein Stop bei $ORDI bei 3,80 $ wird von normalem Rauschen „zerlegt“.
Es geht nicht darum, was sich sicher anfühlt, sondern darum, wo man nachweislich widerlegt wird.
Das 24h-Tief des Swing liegt bei 3,8260 $.
Das ist die Ebene, die sagt, dass der Abwärtstrend noch Schwung hat.
Tippe $ORDI an und schau dir die letzten 24 stündlichen Kerzen an – die Ebene ist genau dort.
Ein 1,3%iger stündlicher Swing bedeutet: Alles unter 3,8260 $ ist nur Rauschen.
Dort setzen – nicht bei 3,80 $ oder 3,75 $.
Dein nächster Stop gehört unter das letzte klare Swing-Tief.
Was ist deine Regel, um einen Stop zu platzieren?
Binance-Daten (Stand 16. Sep, 15:30 UTC). Keine Finanzberatung.
#ORDI #TradingTips
Dein Stop bei $ORDI bei 3,80 $ wird von normalem Rauschen „zerlegt“.
Es geht nicht darum, was sich sicher anfühlt, sondern darum, wo man nachweislich widerlegt wird.
Das 24h-Tief des Swing liegt bei 3,8260 $.
Das ist die Ebene, die sagt, dass der Abwärtstrend noch Schwung hat.
Tippe $ORDI an und schau dir die letzten 24 stündlichen Kerzen an – die Ebene ist genau dort.
Ein 1,3%iger stündlicher Swing bedeutet: Alles unter 3,8260 $ ist nur Rauschen.
Dort setzen – nicht bei 3,80 $ oder 3,75 $.
Dein nächster Stop gehört unter das letzte klare Swing-Tief.
Was ist deine Regel, um einen Stop zu platzieren?
Binance-Daten (Stand 16. Sep, 15:30 UTC). Keine Finanzberatung.
#ORDI #TradingTips
Es geht nicht darum, was sich sicher anfühlt, sondern darum, wo man nachweislich widerlegt wird.
Das 24h-Tief des Swing liegt bei 3,8260 $.
Das ist die Ebene, die sagt, dass der Abwärtstrend noch Schwung hat.
Tippe $ORDI an und schau dir die letzten 24 stündlichen Kerzen an – die Ebene ist genau dort.
Ein 1,3%iger stündlicher Swing bedeutet: Alles unter 3,8260 $ ist nur Rauschen.
Dort setzen – nicht bei 3,80 $ oder 3,75 $.
Dein nächster Stop gehört unter das letzte klare Swing-Tief.
Was ist deine Regel, um einen Stop zu platzieren?
Binance-Daten (Stand 16. Sep, 15:30 UTC). Keine Finanzberatung.
#ORDI #TradingTips
79

·
--
3 einfache Regeln für Krypto-Trader: 💡
Setze einen Stop-Loss für $BTC
Handle nicht aus Emotionen
Investiere nie mehr, als du verlieren kannst
Handele klug! 🚀
#CryptoSafety #tradingtips
3 einfache Regeln für Krypto-Trader: 💡
Setze einen Stop-Loss für $BTC
Handle nicht aus Emotionen
Investiere nie mehr, als du verlieren kannst
Handele klug! 🚀
#CryptoSafety #tradingtips
Setze einen Stop-Loss für $BTC
Handle nicht aus Emotionen
Investiere nie mehr, als du verlieren kannst
Handele klug! 🚀
#CryptoSafety #tradingtips
56

·
--
🚨 $G wird als schneller Angriff verzeichnet — sichere dir den Deal aus der entscheidenden Support-Zone! ⚡
Öffne den Trade ( $G ) jetzt
Trade-Typ: Kauf (LONG) 📈
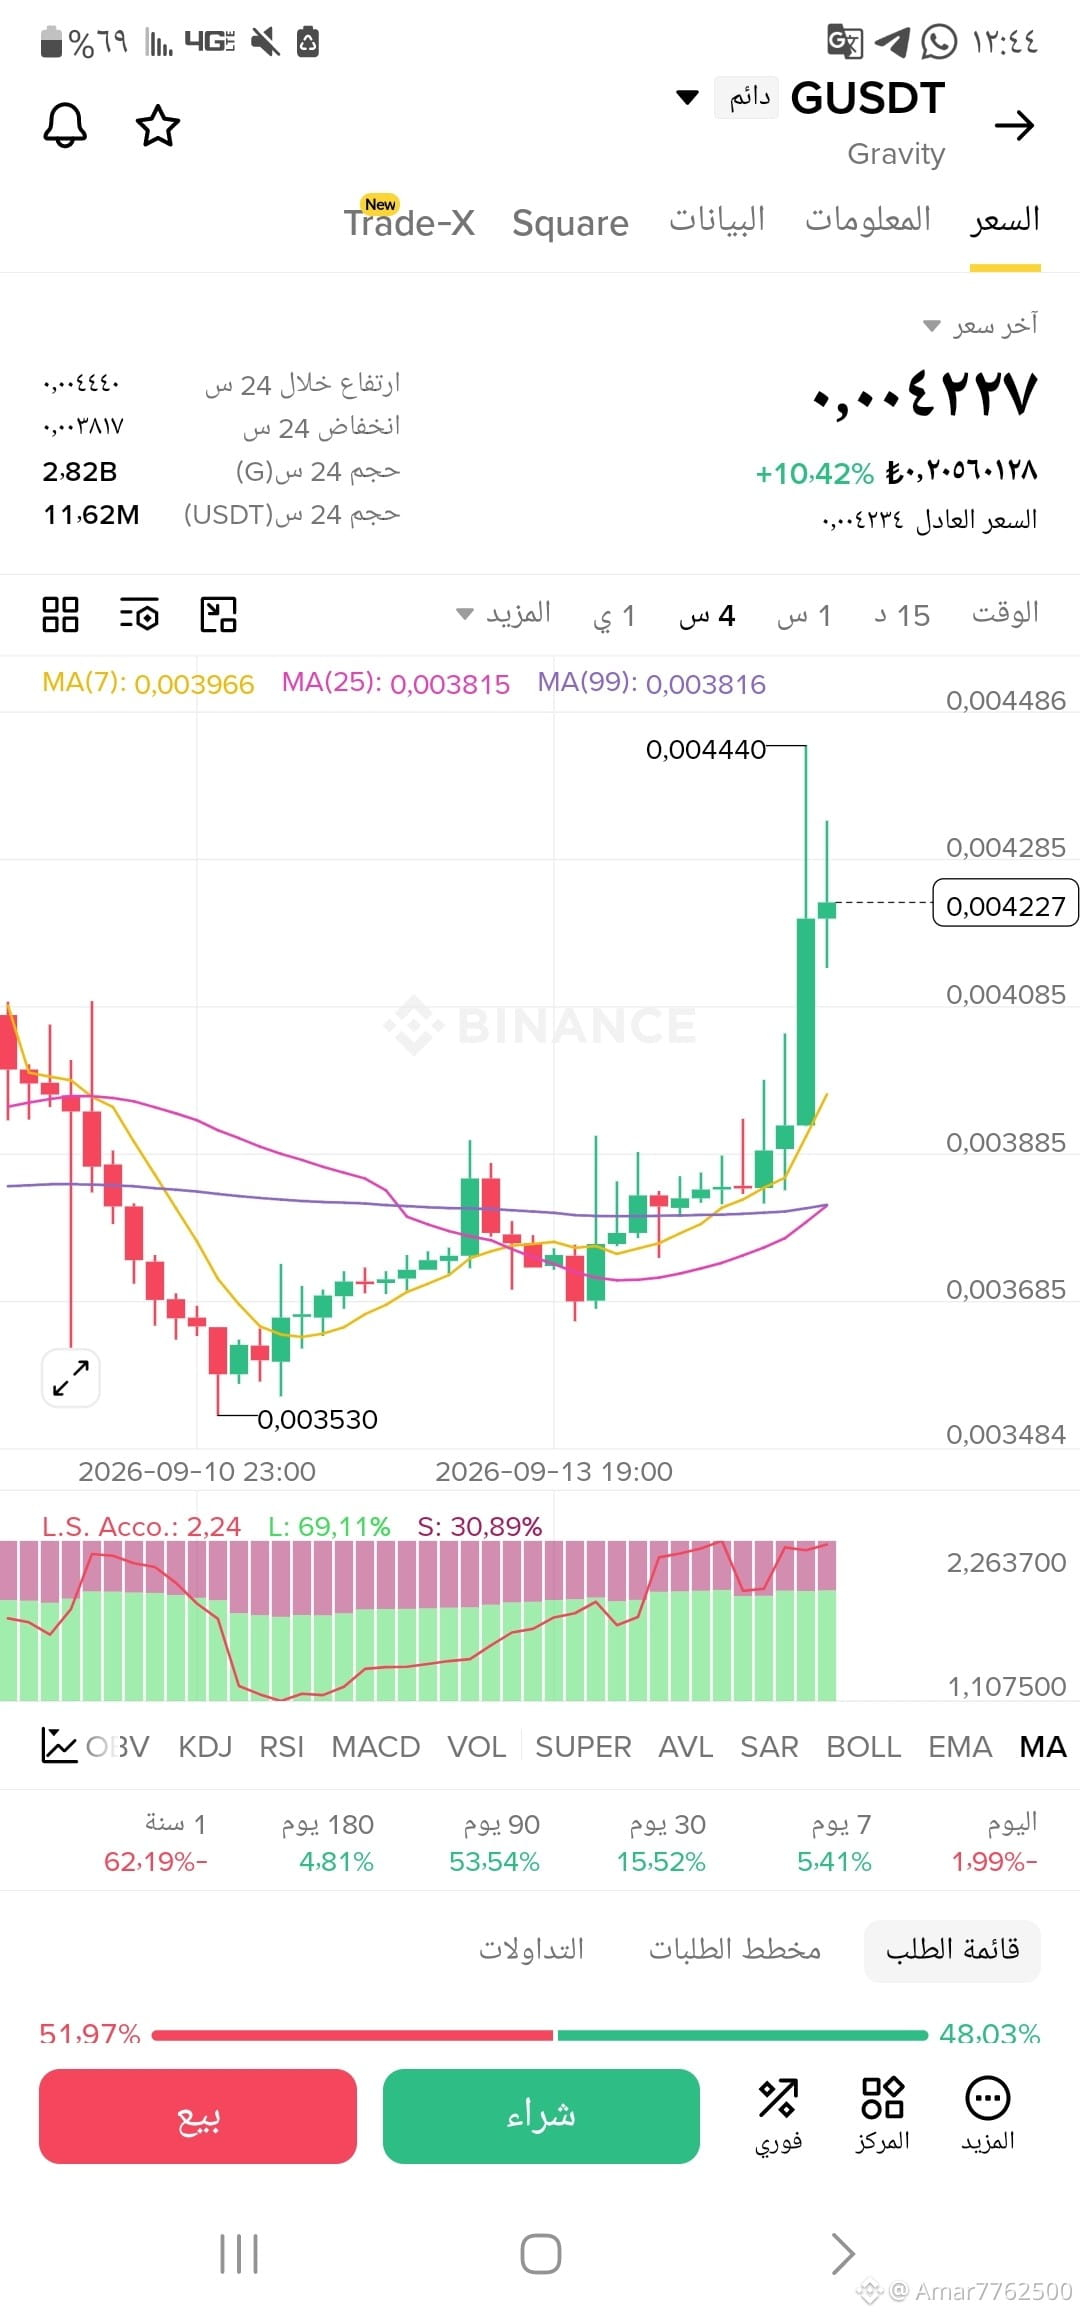
Einstieg bei: 0.00398 - 0.00410 (warte, bis sich der Kurs beruhigt und den Support MA7 testet)
Erstes Ziel: 0.00440 🎯
Zweites Ziel: 0.00470 🚀
Stop-Loss: 0.00378 🛑
$G
🔍 Analyse der Kursbewegung und Liquidität:
Wir haben gesehen, dass die Gravity-Münze ($G) starke Liquidität eingespeist hat, was zu einem Kursanstieg von über +10% führte und das Widerstandsniveau bei 0.004440 getestet wurde. Die aktuelle Bewegung sieht nach einer oberen Lunte (oberer Schatten) der Kerze aus, was auf schnelles Gewinnmitnehmen hindeutet. Daher ist die beste Strategie, auf einen Rücksetzer des Kurses in die Nachfragezone sowie auf den gleitenden Durchschnitt 0.003966 zu warten, um mit dem geringstmöglichen Risiko einzusteigen.
⚠️ Risikomanagement:
Verfolge keine grünen Kerzen, wenn der Kurs am Hoch ist. Halte dich an den festgelegten Einstiegspreis und setze den Stop-Loss unter den MA25, um dein Kapital zu schützen und die nächste Aufwärtswelle optimal zu nutzen.
💬 Erwartest du, dass der Impuls weitergeht und 0.00450 überschreitet — oder erleben wir eine längere Konsolidierung? Teile uns deine Analyse in den Kommentaren mit! 👇
#Gravity #CryptoTrading #cryptosignals #TradingTips
🚨 $G wird als schneller Angriff verzeichnet — sichere dir den Deal aus der entscheidenden Support-Zone! ⚡
Öffne den Trade ( $G ) jetzt
Trade-Typ: Kauf (LONG) 📈
Einstieg bei: 0.00398 - 0.00410 (warte, bis sich der Kurs beruhigt und den Support MA7 testet)
Erstes Ziel: 0.00440 🎯
Zweites Ziel: 0.00470 🚀
Stop-Loss: 0.00378 🛑
$G
🔍 Analyse der Kursbewegung und Liquidität:
Wir haben gesehen, dass die Gravity-Münze ($G ) starke Liquidität eingespeist hat, was zu einem Kursanstieg von über +10% führte und das Widerstandsniveau bei 0.004440 getestet wurde. Die aktuelle Bewegung sieht nach einer oberen Lunte (oberer Schatten) der Kerze aus, was auf schnelles Gewinnmitnehmen hindeutet. Daher ist die beste Strategie, auf einen Rücksetzer des Kurses in die Nachfragezone sowie auf den gleitenden Durchschnitt 0.003966 zu warten, um mit dem geringstmöglichen Risiko einzusteigen.
⚠️ Risikomanagement:
Verfolge keine grünen Kerzen, wenn der Kurs am Hoch ist. Halte dich an den festgelegten Einstiegspreis und setze den Stop-Loss unter den MA25, um dein Kapital zu schützen und die nächste Aufwärtswelle optimal zu nutzen.
💬 Erwartest du, dass der Impuls weitergeht und 0.00450 überschreitet — oder erleben wir eine längere Konsolidierung? Teile uns deine Analyse in den Kommentaren mit! 👇
#Gravity #CryptoTrading #cryptosignals #TradingTips
Öffne den Trade ( $G ) jetzt
Trade-Typ: Kauf (LONG) 📈
Einstieg bei: 0.00398 - 0.00410 (warte, bis sich der Kurs beruhigt und den Support MA7 testet)
Erstes Ziel: 0.00440 🎯
Zweites Ziel: 0.00470 🚀
Stop-Loss: 0.00378 🛑
$G
🔍 Analyse der Kursbewegung und Liquidität:
Wir haben gesehen, dass die Gravity-Münze ($G ) starke Liquidität eingespeist hat, was zu einem Kursanstieg von über +10% führte und das Widerstandsniveau bei 0.004440 getestet wurde. Die aktuelle Bewegung sieht nach einer oberen Lunte (oberer Schatten) der Kerze aus, was auf schnelles Gewinnmitnehmen hindeutet. Daher ist die beste Strategie, auf einen Rücksetzer des Kurses in die Nachfragezone sowie auf den gleitenden Durchschnitt 0.003966 zu warten, um mit dem geringstmöglichen Risiko einzusteigen.
⚠️ Risikomanagement:
Verfolge keine grünen Kerzen, wenn der Kurs am Hoch ist. Halte dich an den festgelegten Einstiegspreis und setze den Stop-Loss unter den MA25, um dein Kapital zu schützen und die nächste Aufwärtswelle optimal zu nutzen.
💬 Erwartest du, dass der Impuls weitergeht und 0.00450 überschreitet — oder erleben wir eine längere Konsolidierung? Teile uns deine Analyse in den Kommentaren mit! 👇
#Gravity #CryptoTrading #cryptosignals #TradingTips
1
265
·
--
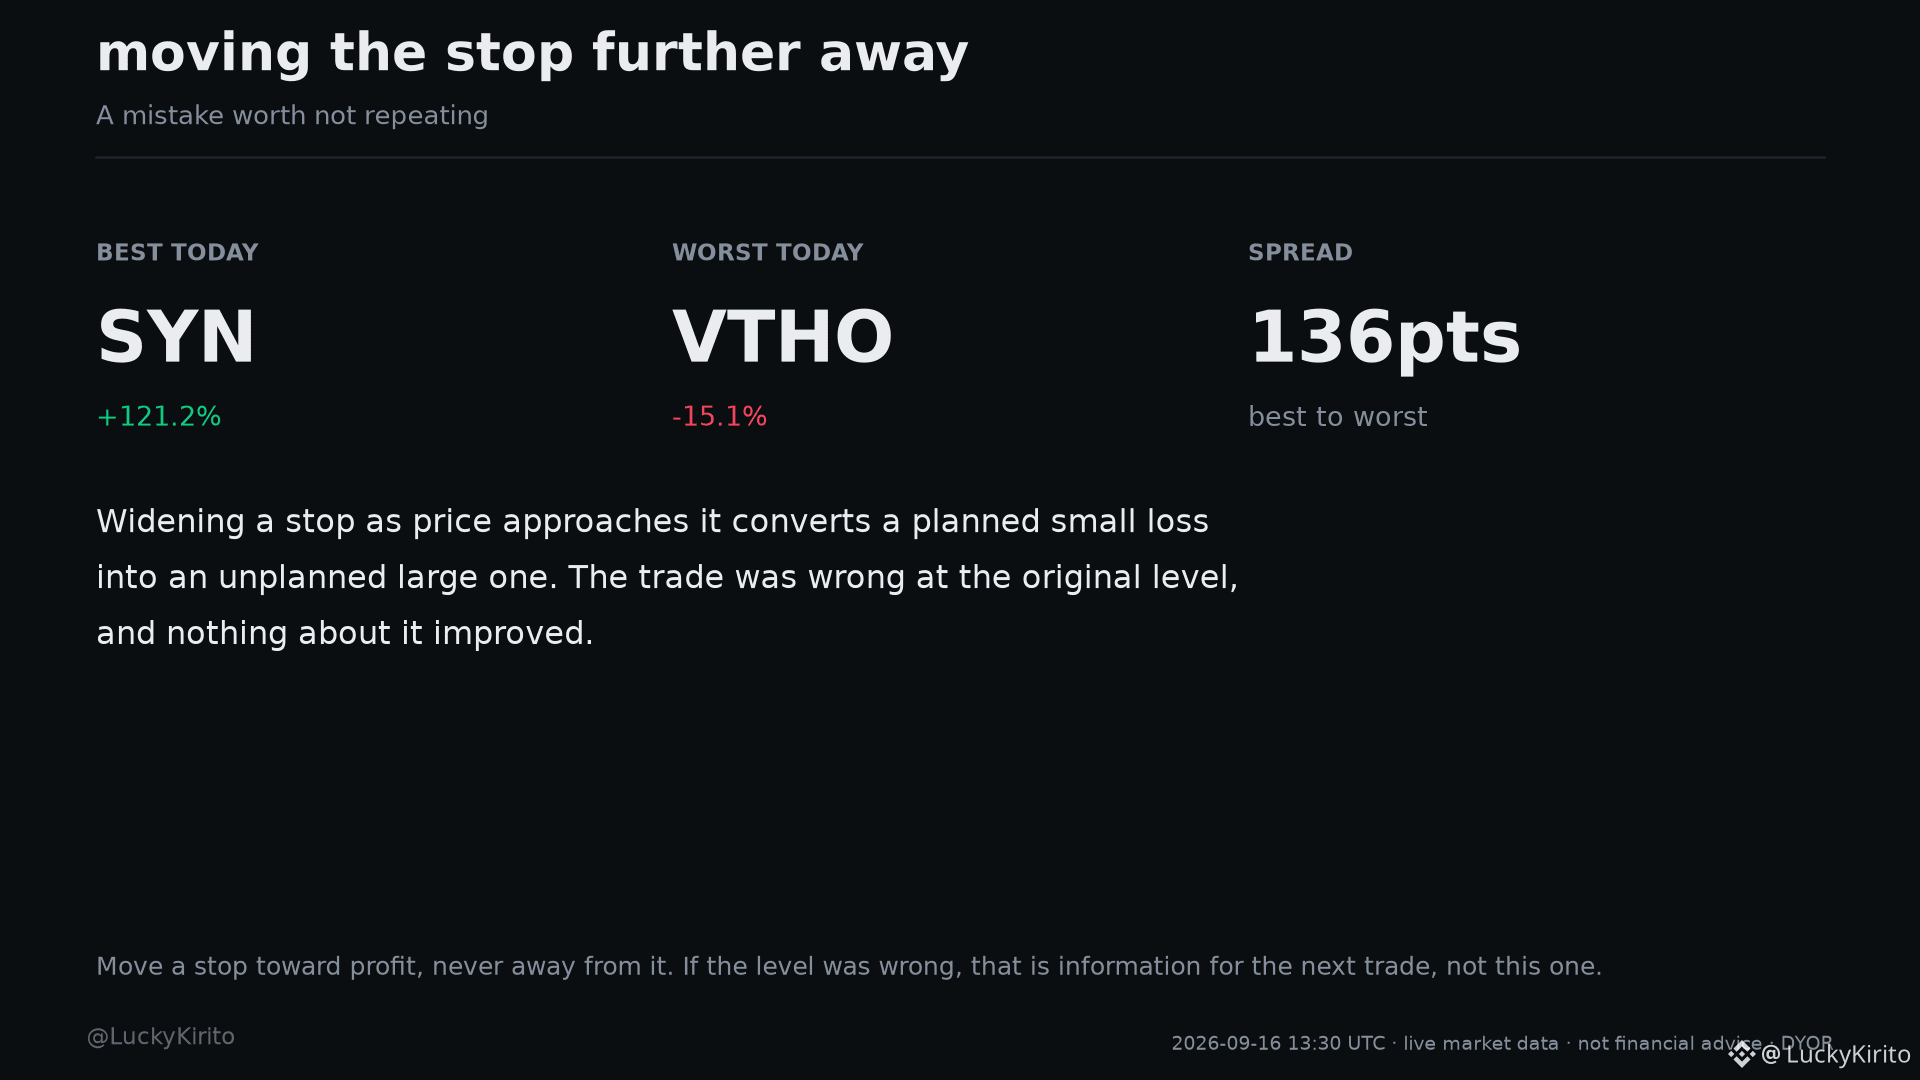
Ein Fehler, der echtes Geld kostet: den Stop weiter weg zu verlagern.
Einen Stop zu verbreitern, während der Preis sich ihm nähert, macht aus einem geplanten kleinen Verlust einen ungeplanten großen. Der Trade war bereits auf dem ursprünglichen Niveau falsch, und an der Sache hat sich nichts verbessert.
Einen Stop in Richtung Gewinn bewegen – niemals weg davon. Wenn das Niveau falsch war, ist das eine Information für den nächsten Trade, nicht für diesen.
Der heutige Markt macht den Punkt: SYN ist +121,2%, während VTHO -15,1% ist – eine Spanne von 136 Punkten über dieselben 60 liquiden Pairs am selben Tag.
#Write2Earn #TradingPsychology #CryptoBeginners #TradingTips
Automatisierte technische Analyse, keine Finanzberatung. Ich bin nicht verantwortlich für deine Trades. Informiere dich selbst (DYOR).
Ein Fehler, der echtes Geld kostet: den Stop weiter weg zu verlagern.
Einen Stop zu verbreitern, während der Preis sich ihm nähert, macht aus einem geplanten kleinen Verlust einen ungeplanten großen. Der Trade war bereits auf dem ursprünglichen Niveau falsch, und an der Sache hat sich nichts verbessert.
Einen Stop in Richtung Gewinn bewegen – niemals weg davon. Wenn das Niveau falsch war, ist das eine Information für den nächsten Trade, nicht für diesen.
Der heutige Markt macht den Punkt: SYN ist +121,2%, während VTHO -15,1% ist – eine Spanne von 136 Punkten über dieselben 60 liquiden Pairs am selben Tag.
#Write2Earn #TradingPsychology #CryptoBeginners #TradingTips
Automatisierte technische Analyse, keine Finanzberatung. Ich bin nicht verantwortlich für deine Trades. Informiere dich selbst (DYOR).
Einen Stop zu verbreitern, während der Preis sich ihm nähert, macht aus einem geplanten kleinen Verlust einen ungeplanten großen. Der Trade war bereits auf dem ursprünglichen Niveau falsch, und an der Sache hat sich nichts verbessert.
Einen Stop in Richtung Gewinn bewegen – niemals weg davon. Wenn das Niveau falsch war, ist das eine Information für den nächsten Trade, nicht für diesen.
Der heutige Markt macht den Punkt: SYN ist +121,2%, während VTHO -15,1% ist – eine Spanne von 136 Punkten über dieselben 60 liquiden Pairs am selben Tag.
#Write2Earn #TradingPsychology #CryptoBeginners #TradingTips
Automatisierte technische Analyse, keine Finanzberatung. Ich bin nicht verantwortlich für deine Trades. Informiere dich selbst (DYOR).
58

·
--
Kann jede Layer-1 im Moment wirklich mit dem Retail-Impuls von $SOL mithalten? ⚡
Transaktionen in Subsekunden, extrem niedrige Gebühren und enormes Volumen an dezentralen Börsen (DEX) halten Solana ganz im Zentrum des aktiven Retail-Handels.
⚠️ Erinnerung: Hohe Geschwindigkeit bringt starke Volatilität. Lass niemals Gier aus einem erfolgreichen Trade eine verlierende Position machen—sichere Gewinne systematisch!
Traded du aktiv $SOL oder hältst du langfristig auf höhere Ziele hin? Teile deine Strategie! 📈
#Solana #sol #Altcoins! #tradingtips
Kann jede Layer-1 im Moment wirklich mit dem Retail-Impuls von $SOL mithalten? ⚡
Transaktionen in Subsekunden, extrem niedrige Gebühren und enormes Volumen an dezentralen Börsen (DEX) halten Solana ganz im Zentrum des aktiven Retail-Handels.
⚠️ Erinnerung: Hohe Geschwindigkeit bringt starke Volatilität. Lass niemals Gier aus einem erfolgreichen Trade eine verlierende Position machen—sichere Gewinne systematisch!
Traded du aktiv $SOL oder hältst du langfristig auf höhere Ziele hin? Teile deine Strategie! 📈
#Solana #sol #Altcoins! #tradingtips
Transaktionen in Subsekunden, extrem niedrige Gebühren und enormes Volumen an dezentralen Börsen (DEX) halten Solana ganz im Zentrum des aktiven Retail-Handels.
⚠️ Erinnerung: Hohe Geschwindigkeit bringt starke Volatilität. Lass niemals Gier aus einem erfolgreichen Trade eine verlierende Position machen—sichere Gewinne systematisch!
Traded du aktiv $SOL oder hältst du langfristig auf höhere Ziele hin? Teile deine Strategie! 📈
#Solana #sol #Altcoins! #tradingtips
55
·
--
Krypto geht nicht nur darum, die nächste 10x-Coins zu finden. 🧠
Manchmal ist der größte Vorteil einfach, einen Plan zu haben: 📌 Kenne deinen Einstieg
📌 Kenne dein Risiko
📌 Vermeide emotionale Entscheidungen
📌 Schütze dein Kapital
Was ist die #1-Regel, die du beim Trading von Krypto befolgst?
#CryptoTrading #TradingTips #Binance #Bitcoin
{spot}(XRPUSDT)
Krypto geht nicht nur darum, die nächste 10x-Coins zu finden. 🧠
Manchmal ist der größte Vorteil einfach, einen Plan zu haben: 📌 Kenne deinen Einstieg
📌 Kenne dein Risiko
📌 Vermeide emotionale Entscheidungen
📌 Schütze dein Kapital
Was ist die #1-Regel, die du beim Trading von Krypto befolgst?
#CryptoTrading #TradingTips #Binance #Bitcoin
Manchmal ist der größte Vorteil einfach, einen Plan zu haben: 📌 Kenne deinen Einstieg
📌 Kenne dein Risiko
📌 Vermeide emotionale Entscheidungen
📌 Schütze dein Kapital
Was ist die #1-Regel, die du beim Trading von Krypto befolgst?
#CryptoTrading #TradingTips #Binance #Bitcoin
43
·
--
Übersetzung ansehen
$DOGE is down 3% and trading at 30% of its 24h range. Who’s selling to you here?
The last 24h high was $0.08341. The low was $0.07841.
Price is $0.07992 right near the bottom of that range.
That means most buyers who jumped in today are already underwater.
They’re the ones dumping now. Not smart money.
Tap $DOGE and look at the last 24 hourly candles, the level is right there.
Chasing top gainers means buying from the people who got in early and are now bailing.
What’s your rule for avoiding this trap?
Binance data as of 16 Sep 10:00 UTC. Not financial advice.
#DOGE #TradingTips
$DOGE is down 3% and trading at 30% of its 24h range. Who’s selling to you here?
The last 24h high was $0.08341. The low was $0.07841.
Price is $0.07992 right near the bottom of that range.
That means most buyers who jumped in today are already underwater.
They’re the ones dumping now. Not smart money.
Tap $DOGE and look at the last 24 hourly candles, the level is right there.
Chasing top gainers means buying from the people who got in early and are now bailing.
What’s your rule for avoiding this trap?
Binance data as of 16 Sep 10:00 UTC. Not financial advice.
#DOGE #TradingTips
The last 24h high was $0.08341. The low was $0.07841.
Price is $0.07992 right near the bottom of that range.
That means most buyers who jumped in today are already underwater.
They’re the ones dumping now. Not smart money.
Tap $DOGE and look at the last 24 hourly candles, the level is right there.
Chasing top gainers means buying from the people who got in early and are now bailing.
What’s your rule for avoiding this trap?
Binance data as of 16 Sep 10:00 UTC. Not financial advice.
#DOGE #TradingTips
4

·
--
Bullisch
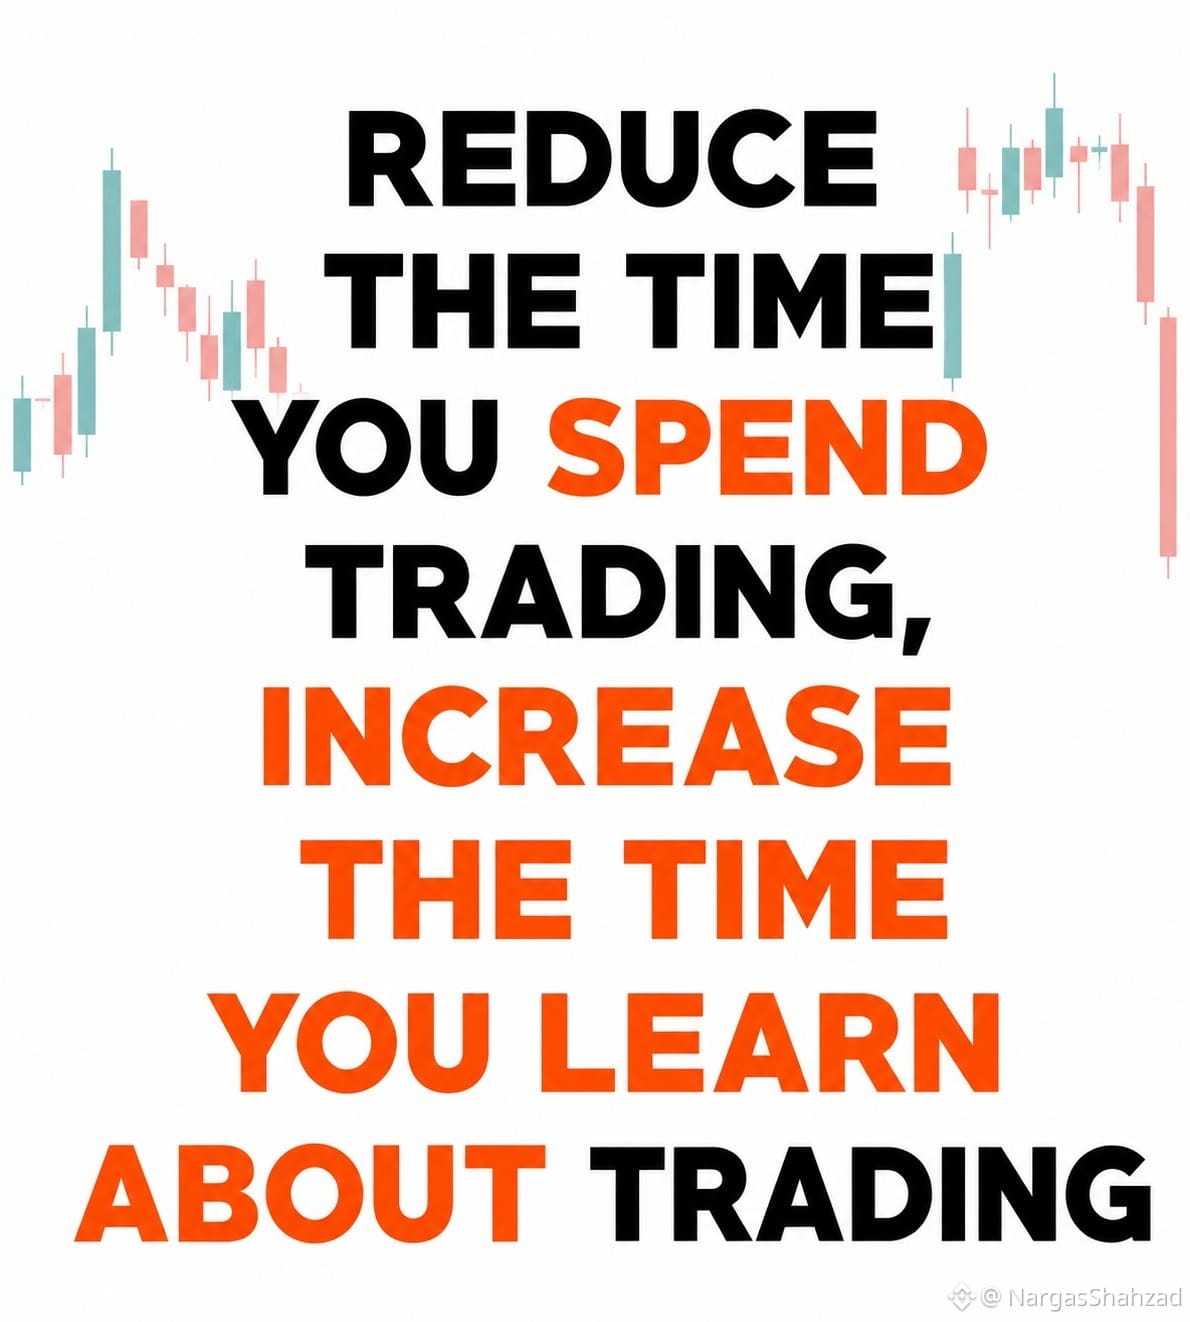
VERKÜRZEN SIE DIE ZEIT, DIE SIE MIT DEM TRADEN VERBRINGEN,
ERHÖHEN SIE DIE ZEIT, DIE SIE DAMIT VERBRINGEN, ÜBER TRADING ZU LERNEN 📈
Diese eine Zeile kann Ihr Portfolio retten! 💯
95 % der Trader verlieren, weil sie 12 Stunden lang auf Charts starren, aber 0 Stunden lernen.
Der Markt belohnt Geduld – nicht Overtrading.
Ich habe das auf die harte Tour gelernt – und was ist mit Ihnen?
$RIVER
{alpha}(560xda7ad9dea9397cffddae2f8a052b82f1484252b3)
$AAPLB
{spot}(AAPLBUSDT)
$NVDAB
{spot}(NVDABUSDT)
#TradingPsychology #CryptoTrading #BinanceSquare #tradingtips
VERKÜRZEN SIE DIE ZEIT, DIE SIE MIT DEM TRADEN VERBRINGEN,
ERHÖHEN SIE DIE ZEIT, DIE SIE DAMIT VERBRINGEN, ÜBER TRADING ZU LERNEN 📈
Diese eine Zeile kann Ihr Portfolio retten! 💯
95 % der Trader verlieren, weil sie 12 Stunden lang auf Charts starren, aber 0 Stunden lernen.
Der Markt belohnt Geduld – nicht Overtrading.
Ich habe das auf die harte Tour gelernt – und was ist mit Ihnen?
$RIVER
$AAPLB
$NVDAB
#TradingPsychology #CryptoTrading #BinanceSquare #tradingtips
ERHÖHEN SIE DIE ZEIT, DIE SIE DAMIT VERBRINGEN, ÜBER TRADING ZU LERNEN 📈
Diese eine Zeile kann Ihr Portfolio retten! 💯
95 % der Trader verlieren, weil sie 12 Stunden lang auf Charts starren, aber 0 Stunden lernen.
Der Markt belohnt Geduld – nicht Overtrading.
Ich habe das auf die harte Tour gelernt – und was ist mit Ihnen?
$RIVER
$AAPLB
$NVDAB
#TradingPsychology #CryptoTrading #BinanceSquare #tradingtips
1
441
·
--
Dein Stop auf $TUT bei $0.0192 ist nur Rauschen, das darauf wartet, getroffen zu werden.
📊 Die echte Kursmarke, die dich widerlegt, ist $0.01898. das 24h-Tief der Spanne.
🎯 Das ist keine runde Zahl. Genau dort hat der Kurs tatsächlich gedreht.
Tippe auf $TUT und sieh dir die letzten 24 stündlichen Kerzen an, die Marke ist genau dort.
🛑 Ein Stop enger als $0.01898 wird vom normalen stündlichen Swing von 2,9% erledigt.
✅ Setze deinen Stop unter das letzte Swing-Low. nicht unter einen Prozentsatz.
Was ist deine Regel dafür, wo du einen Stop platzierst?
Binance-Daten Stand 16. Sep 07:30 UTC. Keine finanzielle Beratung.
#TUT #TradingTips
Dein Stop auf $TUT bei $0.0192 ist nur Rauschen, das darauf wartet, getroffen zu werden.
📊 Die echte Kursmarke, die dich widerlegt, ist $0.01898. das 24h-Tief der Spanne.
🎯 Das ist keine runde Zahl. Genau dort hat der Kurs tatsächlich gedreht.
Tippe auf $TUT und sieh dir die letzten 24 stündlichen Kerzen an, die Marke ist genau dort.
🛑 Ein Stop enger als $0.01898 wird vom normalen stündlichen Swing von 2,9% erledigt.
✅ Setze deinen Stop unter das letzte Swing-Low. nicht unter einen Prozentsatz.
Was ist deine Regel dafür, wo du einen Stop platzierst?
Binance-Daten Stand 16. Sep 07:30 UTC. Keine finanzielle Beratung.
#TUT #TradingTips
📊 Die echte Kursmarke, die dich widerlegt, ist $0.01898. das 24h-Tief der Spanne.
🎯 Das ist keine runde Zahl. Genau dort hat der Kurs tatsächlich gedreht.
Tippe auf $TUT und sieh dir die letzten 24 stündlichen Kerzen an, die Marke ist genau dort.
🛑 Ein Stop enger als $0.01898 wird vom normalen stündlichen Swing von 2,9% erledigt.
✅ Setze deinen Stop unter das letzte Swing-Low. nicht unter einen Prozentsatz.
Was ist deine Regel dafür, wo du einen Stop platzierst?
Binance-Daten Stand 16. Sep 07:30 UTC. Keine finanzielle Beratung.
#TUT #TradingTips
74
·
--
Dein Stop bei $ARB um $0.145 ist nur Rauschen, das darauf wartet, zu treffen.
Das 24h-Swing-Low ist $0.13220 – dort wirst du bewiesenermaßen eines Besseren belehrt.
Ein 3,4% stündlicher Swing von $0.15220 liegt ungefähr bei $0.147, also wird bei allem, was enger ist, man durch normale Bewegung ausgeschüttelt.
Tippe $ARB an und schau dir die letzten 24 stündlichen Kerzen an – die Marke ist genau dort.
Ein Stop gehört unter die Marke, die dich eines Besseren belehrt, nicht an eine runde Zahl.
Wie lautet deine Regel zum Setzen von Stops?
Binance-Daten (Stand: 16. Sep 07:00 UTC). Keine Finanzberatung.
#ARB #TradingTips
Dein Stop bei $ARB um $0.145 ist nur Rauschen, das darauf wartet, zu treffen.
Das 24h-Swing-Low ist $0.13220 – dort wirst du bewiesenermaßen eines Besseren belehrt.
Ein 3,4% stündlicher Swing von $0.15220 liegt ungefähr bei $0.147, also wird bei allem, was enger ist, man durch normale Bewegung ausgeschüttelt.
Tippe $ARB an und schau dir die letzten 24 stündlichen Kerzen an – die Marke ist genau dort.
Ein Stop gehört unter die Marke, die dich eines Besseren belehrt, nicht an eine runde Zahl.
Wie lautet deine Regel zum Setzen von Stops?
Binance-Daten (Stand: 16. Sep 07:00 UTC). Keine Finanzberatung.
#ARB #TradingTips
Das 24h-Swing-Low ist $0.13220 – dort wirst du bewiesenermaßen eines Besseren belehrt.
Ein 3,4% stündlicher Swing von $0.15220 liegt ungefähr bei $0.147, also wird bei allem, was enger ist, man durch normale Bewegung ausgeschüttelt.
Tippe $ARB an und schau dir die letzten 24 stündlichen Kerzen an – die Marke ist genau dort.
Ein Stop gehört unter die Marke, die dich eines Besseren belehrt, nicht an eine runde Zahl.
Wie lautet deine Regel zum Setzen von Stops?
Binance-Daten (Stand: 16. Sep 07:00 UTC). Keine Finanzberatung.
#ARB #TradingTips
14
·
--
Übersetzung ansehen
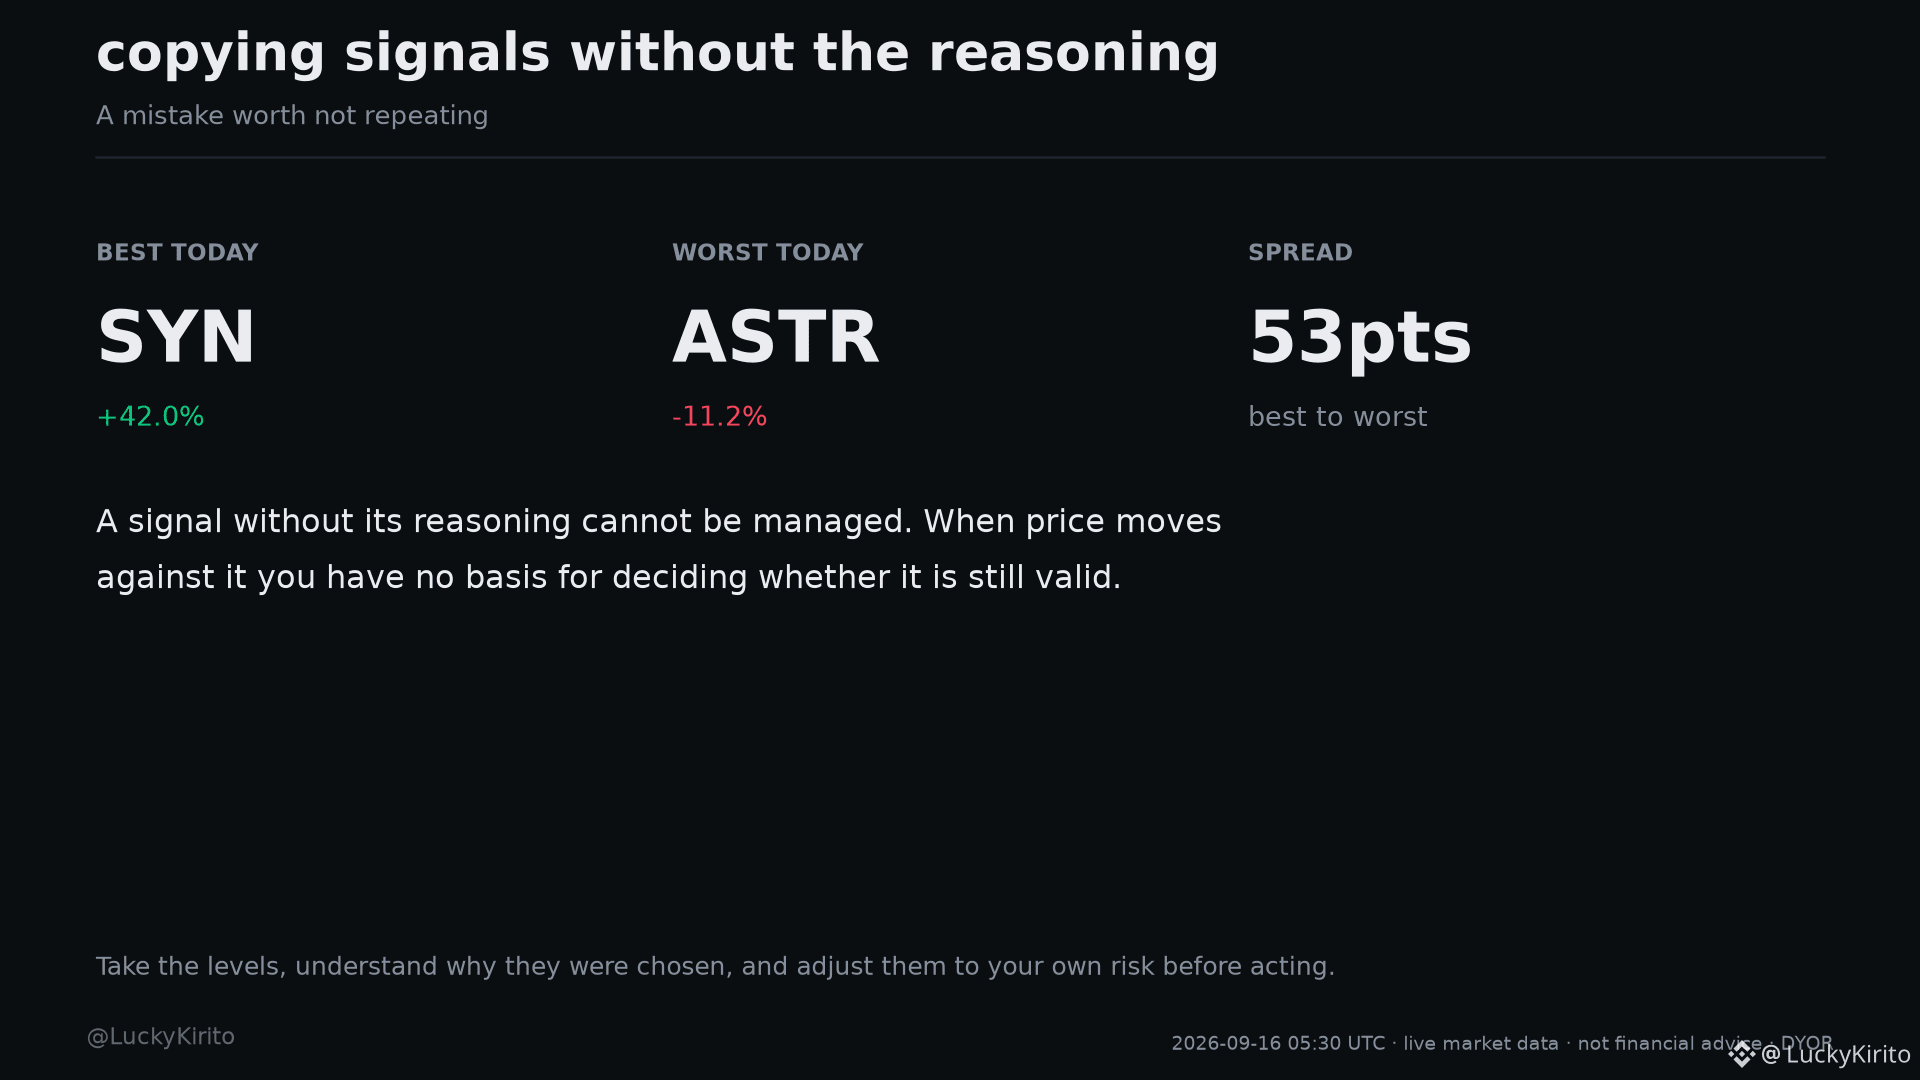
The habit to break: copying signals without the reasoning.
A signal without its reasoning cannot be managed. When price moves against it you have no basis for deciding whether it is still valid.
Take the levels, understand why they were chosen, and adjust them to your own risk before acting.
Today's market makes the point: SYN is +42.0% while ASTR is -11.2%, a spread of 53 points across the same 60 liquid pairs on the same day.
#Write2Earn #CryptoBeginners #TradingTips #RiskManagement
Automated technical analysis, not financial advice. I am not responsible for your trades. DYOR.
The habit to break: copying signals without the reasoning.
A signal without its reasoning cannot be managed. When price moves against it you have no basis for deciding whether it is still valid.
Take the levels, understand why they were chosen, and adjust them to your own risk before acting.
Today's market makes the point: SYN is +42.0% while ASTR is -11.2%, a spread of 53 points across the same 60 liquid pairs on the same day.
#Write2Earn #CryptoBeginners #TradingTips #RiskManagement
Automated technical analysis, not financial advice. I am not responsible for your trades. DYOR.
A signal without its reasoning cannot be managed. When price moves against it you have no basis for deciding whether it is still valid.
Take the levels, understand why they were chosen, and adjust them to your own risk before acting.
Today's market makes the point: SYN is +42.0% while ASTR is -11.2%, a spread of 53 points across the same 60 liquid pairs on the same day.
#Write2Earn #CryptoBeginners #TradingTips #RiskManagement
Automated technical analysis, not financial advice. I am not responsible for your trades. DYOR.
82
Anmelden und weiter Inhalte entdecken
Krypto-Nutzer weltweit auf Binance Square kennenlernen
⚡️ Bleib in Sachen Krypto stets am Puls.
💬 Die weltgrößte Kryptobörse vertraut darauf.
👍 Erhalte verlässliche Einblicke von verifizierten Creators.
E-Mail-Adresse/Telefonnummer
Trendthemen
1
#FedRateWatch
1.6M Aufrufe
6,911 Kommentare
2
#ZcashRises6%
67,242 Aufrufe
724 Kommentare
3
#XRPSinks10%
43,777 Aufrufe
475 Kommentare
4
#BitcoinETFsShed$450M
8,430 Aufrufe
101 Kommentare
5
#CircleOpensArcMainnet
20,008 Aufrufe
309 Kommentare
6
#ZcashHoldersBackNU7Upgrade
32,496 Aufrufe
473 Kommentare
7
#MSTRTradingVolumeSurpassesMorganStanley
29,434 Aufrufe
615 Kommentare
8
#BitcoinFalls4%
59,967 Aufrufe
965 Kommentare
9
#SKHynixInTalksToMakeMemoryChipsInUS
22,796 Aufrufe
372 Kommentare
10
#OpenAIDiscussesNewFundingAt$1.2TValuation
6,400 Aufrufe
61 Kommentare