
Key Summary
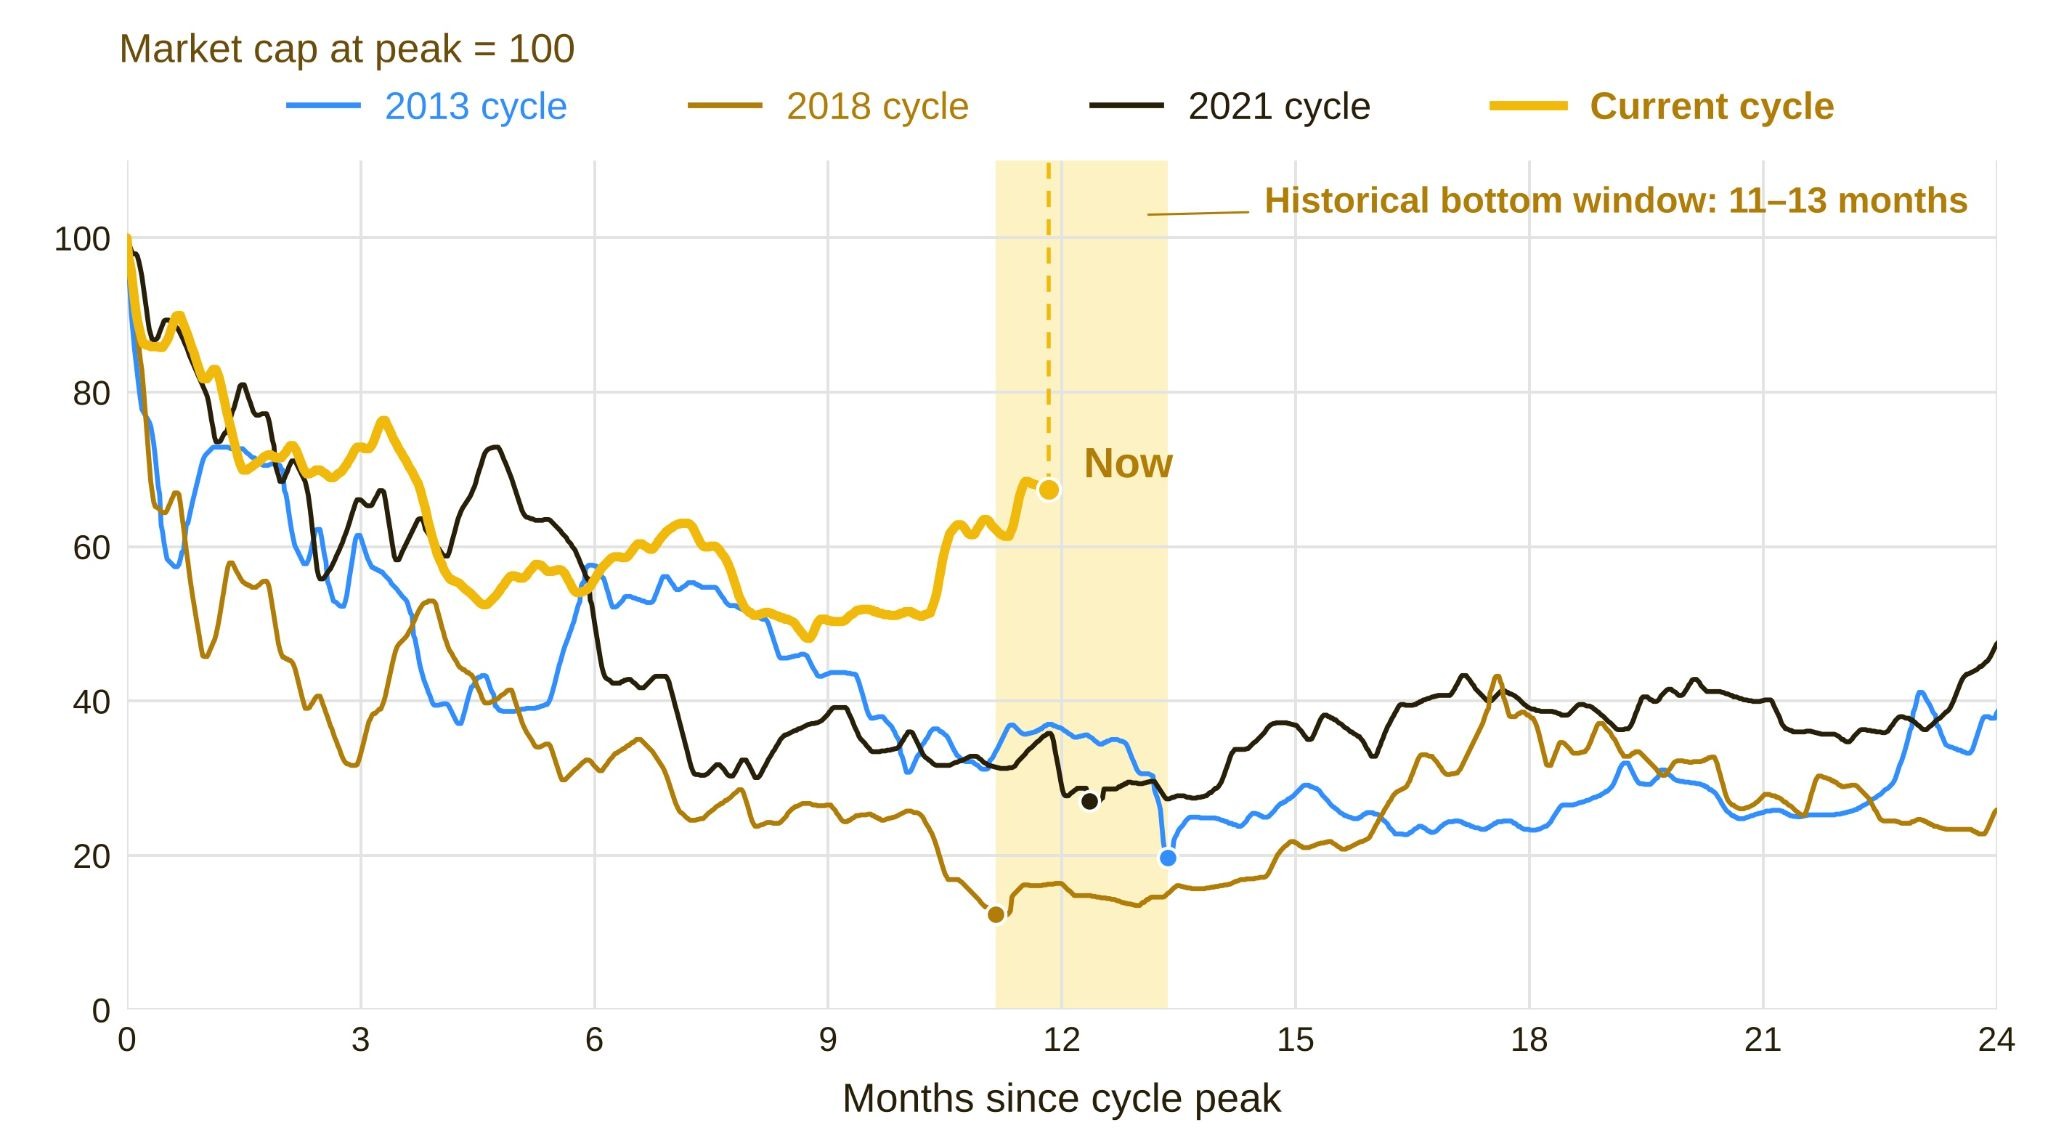
Time may have done most of the work. Total crypto market cap is 11.9 months past its peak, inside the historical 11 to 13 month bottom window, and its low so far came earlier and shallower, followed by a 44% rebound.
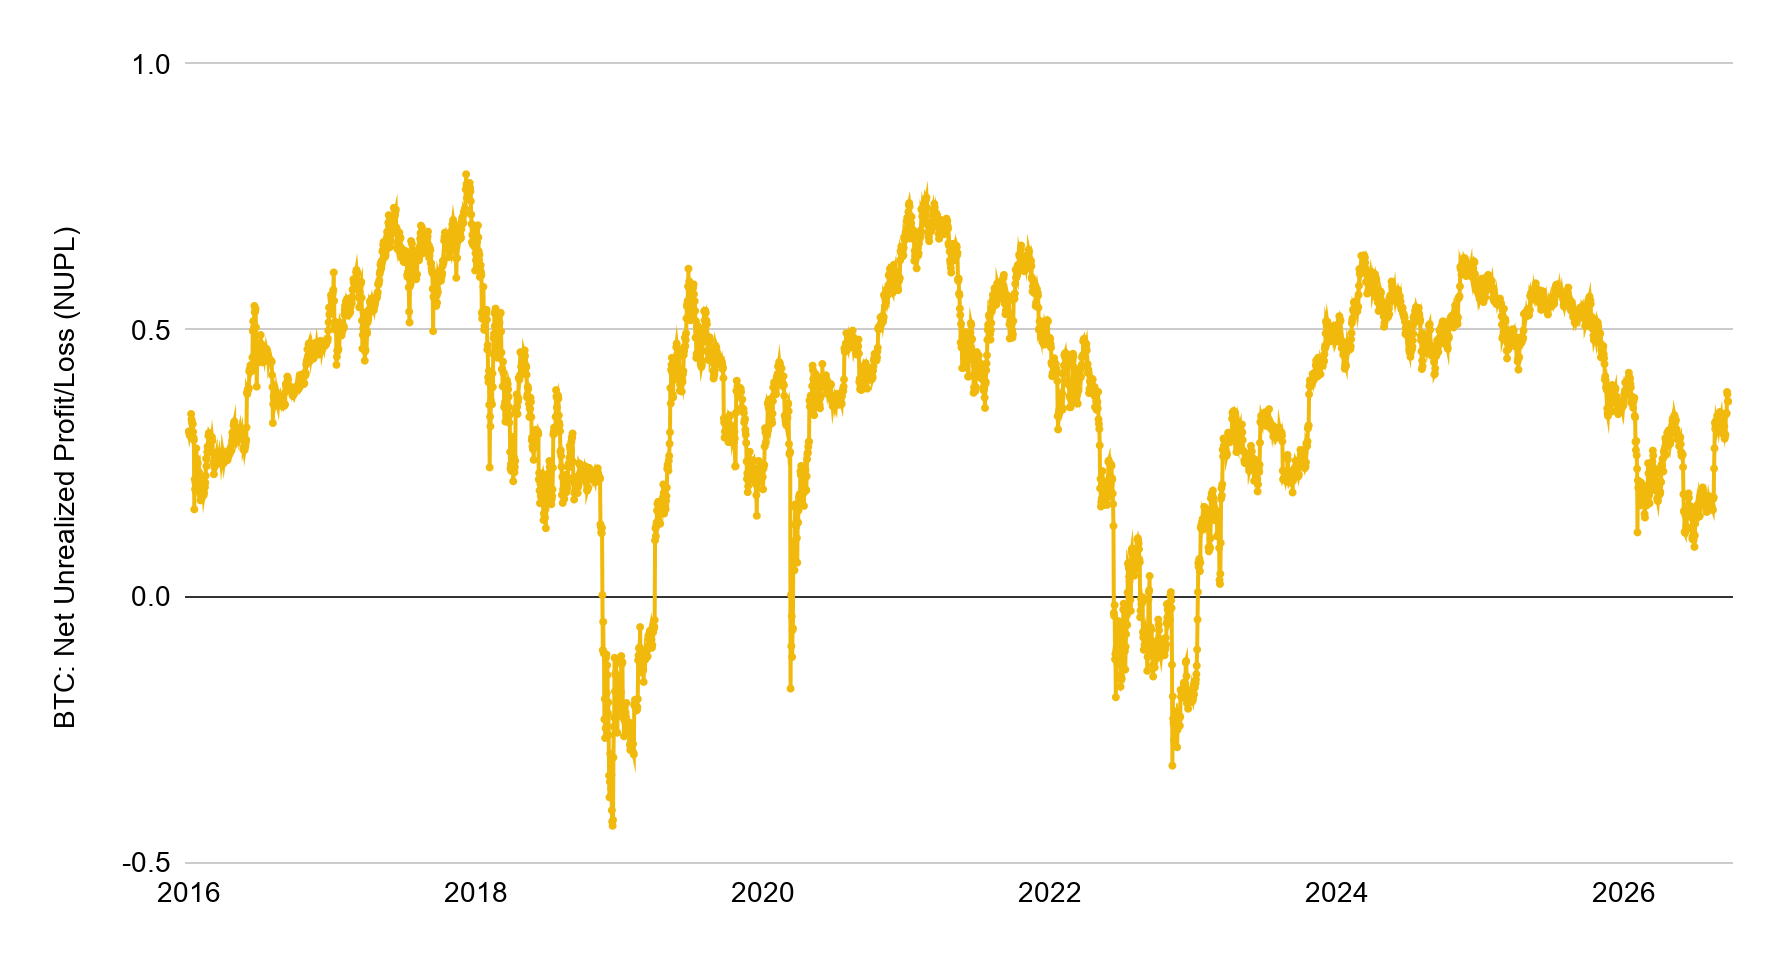
Capitulation may not have fully played out this cycle. Net Unrealized Profit/Loss (NUPL) bottomed at 0.09 versus -0.31 in 2022, even though the price shock was similar once adjusted for lower volatility. It remains to be seen whether this reflects a more resilient holder base or a low still to come.
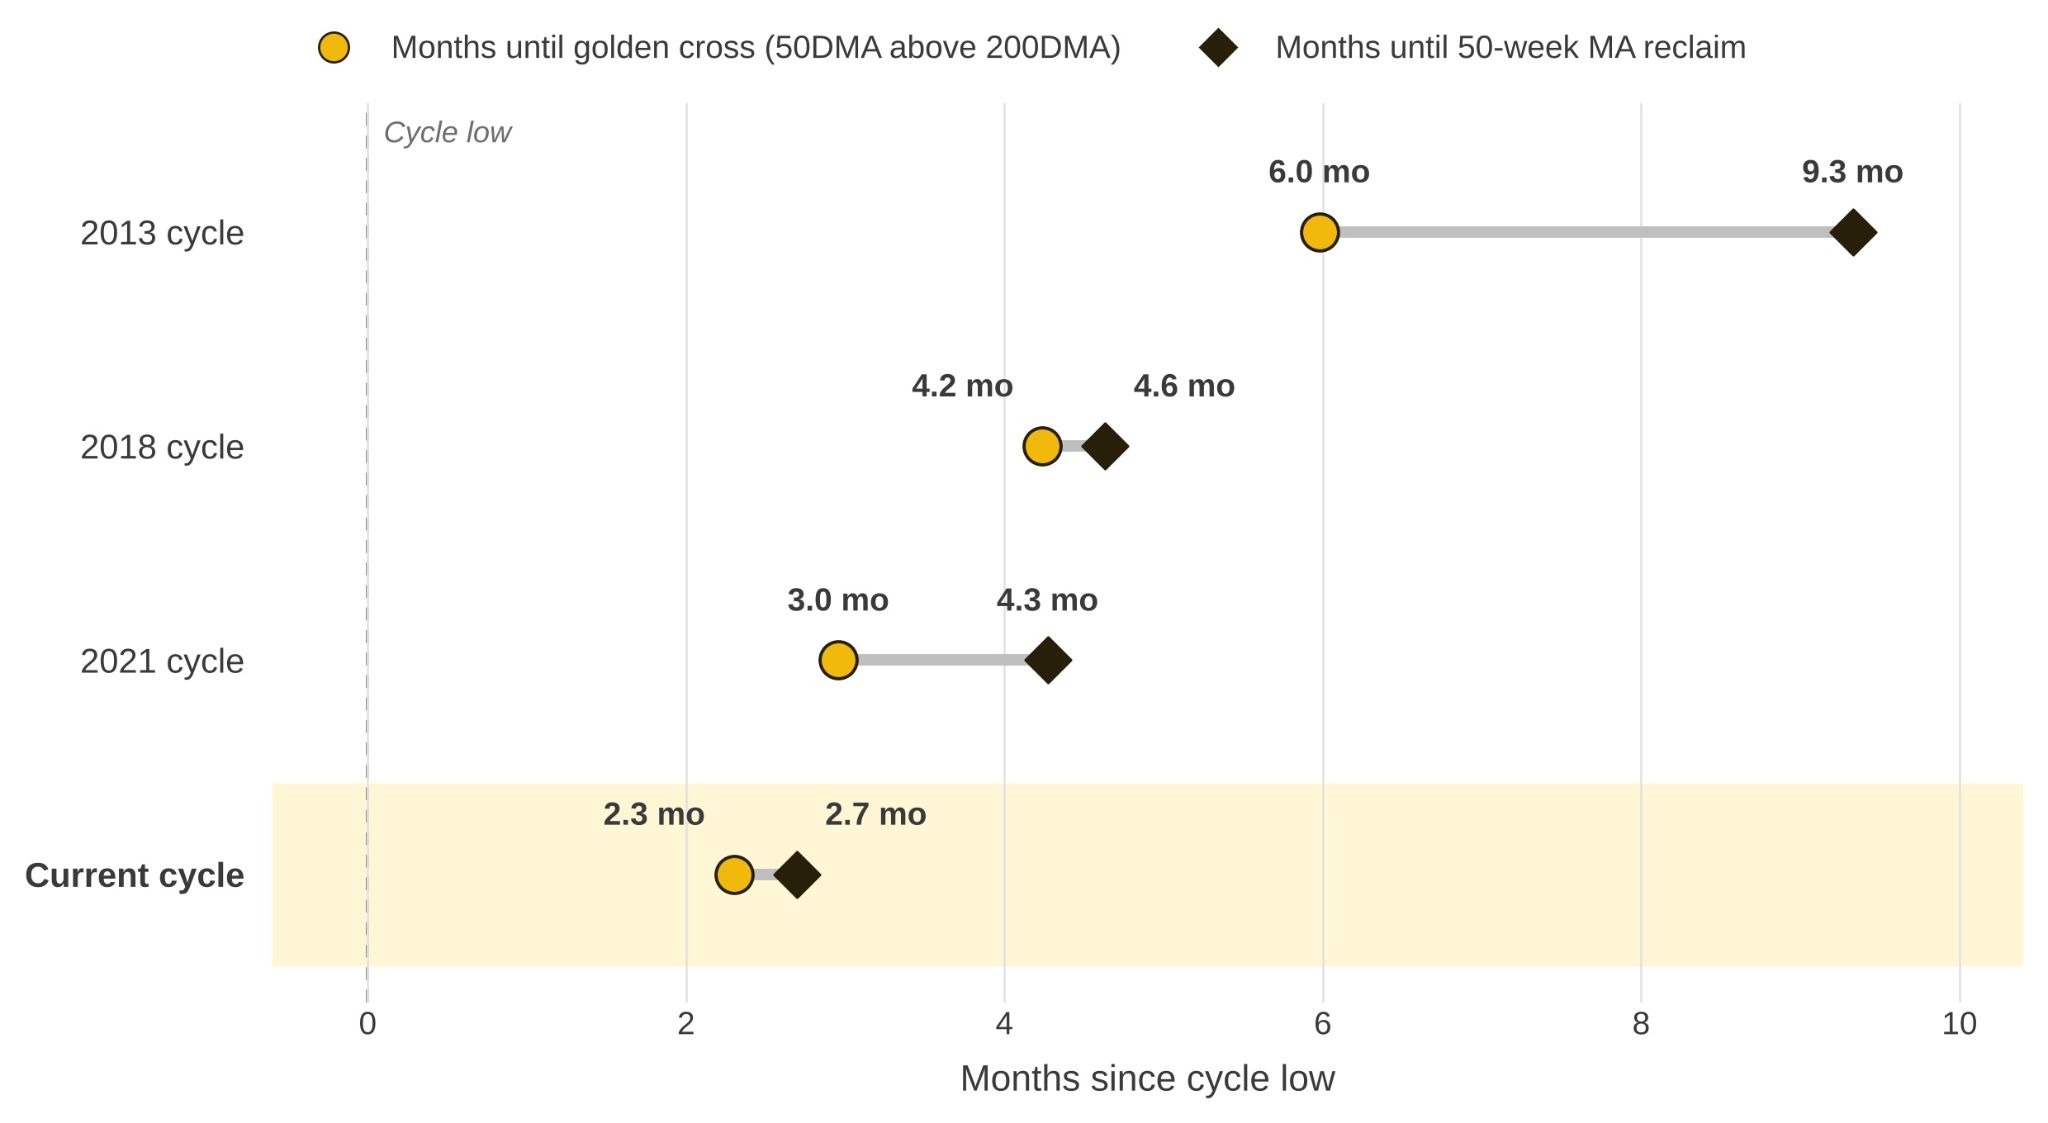
Trend signals are turning faster each cycle. The golden cross came 2.3 months after the low, as compared to 3 to 6 months before, and the 50-week average was reclaimed within three months, as compared to 4 to 9. The early signals reinforce the case for a recovery, but may also reflect a compressing cycle or a low still to come.

Time May Have Already Done Most of the Work
In the three completed cycles, total crypto market cap bottomed 11 to 13 months after the peak, 12.3 months on average. The current cycle is now 11.9 months past its peak and has entered that window. What differs is the path.
The low so far came on July 1, only 8.8 months after the peak and more than three months earlier than usual. It was also much shallower. Market cap retained about 48% of its peak value, compared with just 12% to 27% in past cycles. After a 44% rebound, it now stands at about 69% of its peak, nearly twice the level of the strongest past cycle at the same point.
An earlier and shallower low is consistent with a market that closely follows the four-year cycle and prices it in early. A broader holder base may have also absorbed selling sooner. Still, the July low cannot yet be confirmed as the cycle bottom. Three cycles may suggest a pattern, but not a rule, and a move below the July low would bring the historical timing back into focus.
Figure 1: This cycle's low so far came earlier than past bear markets
Source: Binance Research, CoinMarketCap. Market data as of Oct 2, 2026
Capitulation May Not Have Fully Played Out This Cycle
The 54% drawdown looks modest next to 77% last cycle, but Bitcoin now swings far less. Adjusted for volatility, the price shock is similar in size to past bear markets. What stands out is how holders responded.
In past cycles, market bottoms formed when the average holder was sitting on an unrealized loss. NUPL fell to -0.43 in 2018 and -0.31 in 2022, remaining below zero for 133 and 179 days. By contrast, this cycle bottomed at 0.09 and stayed in positive territory.
The realized price, which reflects the average cost of all coins, points to a similar conclusion. At the July 1 low, BTC remained about 10% above the realized price, while in 2022 it fell 22% below. The realized price itself has declined only 7% from its peak, as compared to 20% to 25% previously, suggesting fewer coins changed hands at low prices.
Some loss realization did occur, but it remained relatively mild. The 90-day SOPR dipped just under 1 to 0.993, slightly above the 0.987 low last cycle.
The absence of deeper capitulation so far points to greater holder conviction this cycle, though further volatility cannot be ruled out.
Figure 2: Bitcoin NUPL (Net Unrealized Profit/Loss) stayed in positive territory this cycle
Source: Binance Research, as of Oct 5, 2026
Trend Signals Are Turning Faster Each Cycle
The golden cross, when the 50-day moving average rises above the 200-day, and a reclaim of the 50-week average are two of the most watched signals that a bear trend may have reversed. Both have appeared progressively sooner each cycle. The golden cross took about six, four and three months to appear after the 2013, 2018 and 2021 cycle lows, respectively, and just 2.3 months this time. Similarly, the time required to reclaim the 50-week moving average shortened from around nine months to under three, with the intervening cycles taking roughly 4.5 and 4 months.
The faster turn largely reflects how close to trend this low sat. BTC bottomed about 22% below its 200-day average and 35% below its 50-week average, compared with 33% to 60% and 51% to 64% at the previous three lows. The rebound itself was no faster than in the 2018 and 2021 cycles, at roughly 13% to 15% a month, but a smaller one was enough to turn the averages.
This makes the signals easier to trigger and possibly less informative, as illustrated by the shallow April 2019 golden cross, which reversed after about six months. As with the earlier low and the absence of more severe capitulation, these early signals suggest a compressing cycle, while still leaving room for a final test of support. More broadly, this suggests that markers calibrated on past cycles may need to be reassessed.
Figure 3: Months from each cycle low to the golden cross and 50-week MA reclaim
Source: Binance Research, as of Oct 6, 2026
GENERAL DISCLOSURE: This material is prepared by Binance Research and is not intended to be relied upon as a forecast or investment advice, and is not a recommendation, offer or solicitation to buy or sell any trading products, cryptocurrencies or to adopt any investment strategy. The use of terminology and the views expressed are intended to promote understanding and the responsible development of the sector and should not be interpreted as definitive legal views or those of Binance. The opinions expressed are as of the date shown above and are the opinions of the writer, they may change as subsequent conditions vary. The information and opinions contained in this material are derived from proprietary and non-proprietary sources deemed by Binance Research to be reliable, are not necessarily all-inclusive and are not guaranteed as to accuracy. As such, no warranty of accuracy or reliability is given and no responsibility arising in any other way for errors and omissions (including responsibility to any person by reason of negligence) is accepted by Binance. This material may contain ’forward looking’ information that is not purely historical in nature. Such information may include, among other things, projections and forecasts. There is no guarantee that any forecasts made will come to pass. Reliance upon information in this material is at the sole discretion of the reader. This material is intended for information purposes only and does not constitute investment advice or an offer or solicitation to purchase or sell in any securities, cryptocurrencies or any investment strategy nor shall any securities or cryptocurrency be offered or sold to any person in any jurisdiction in which an offer, solicitation, purchase or sale would be unlawful under the laws of such jurisdiction. Investment involves risks. For more information, see our Terms of Use and Risk Warning.