
R3N 1
434 Posts

R3N 1
Web3 & crypto Analyst || Breaking down market moves || token updates daily ➪NFA!!!
0 Following
2 Followers
2 Liked
Posts
Strategy and BitMine are putting roughly $500M into $BTC and $ETH while the market is pulling back.
That’s worth paying attention to.
Strategy continues to build its Bitcoin treasury, while BitMine is aggressively accumulating ETH as part of its own long-term strategy.
But their buying doesn't mean BTC or ETH can't fall further.
These companies aren't trading the next 4H candle. Their thesis is measured in years, not days.
That's the key difference.
When prices fall, short-term traders see risk.
Long-term treasury companies can see an opportunity to increase their exposure at lower prices.
The bigger signal would be whether this accumulation continues even if market weakness persists.
If institutional treasury demand keeps growing while sentiment remains cautious, today's pullback could eventually look like another accumulation phase.
Are Strategy and BitMine early… or are they buying too soon? 👀
#BTC Price Analysis# #Macro Insights# #Meme Alpha#
That’s worth paying attention to.
Strategy continues to build its Bitcoin treasury, while BitMine is aggressively accumulating ETH as part of its own long-term strategy.
But their buying doesn't mean BTC or ETH can't fall further.
These companies aren't trading the next 4H candle. Their thesis is measured in years, not days.
That's the key difference.
When prices fall, short-term traders see risk.
Long-term treasury companies can see an opportunity to increase their exposure at lower prices.
The bigger signal would be whether this accumulation continues even if market weakness persists.
If institutional treasury demand keeps growing while sentiment remains cautious, today's pullback could eventually look like another accumulation phase.
Are Strategy and BitMine early… or are they buying too soon? 👀
#BTC Price Analysis# #Macro Insights# #Meme Alpha#

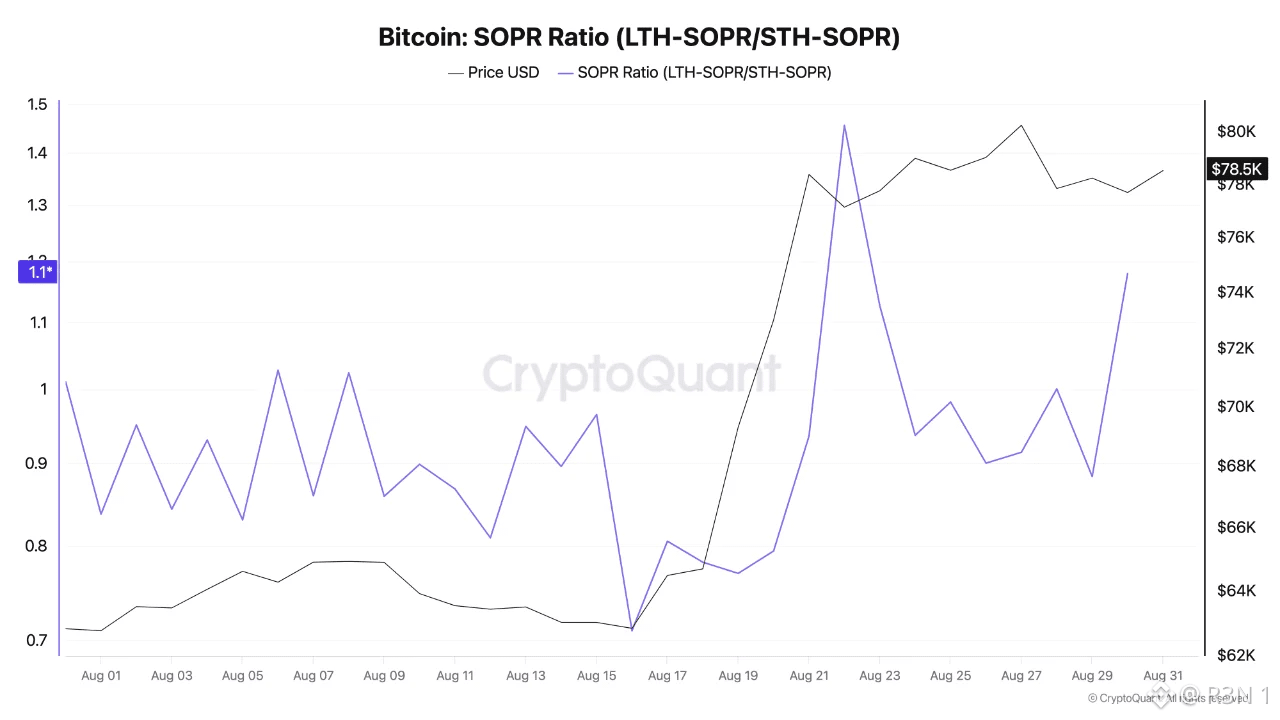
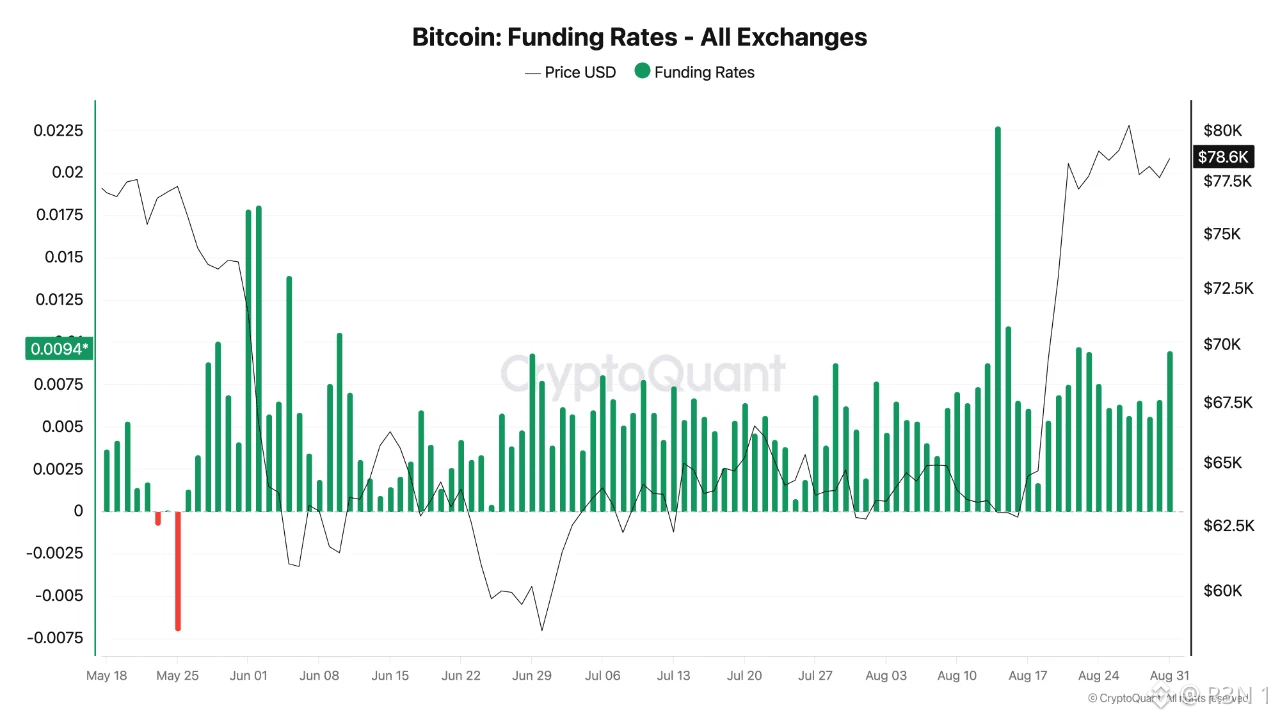
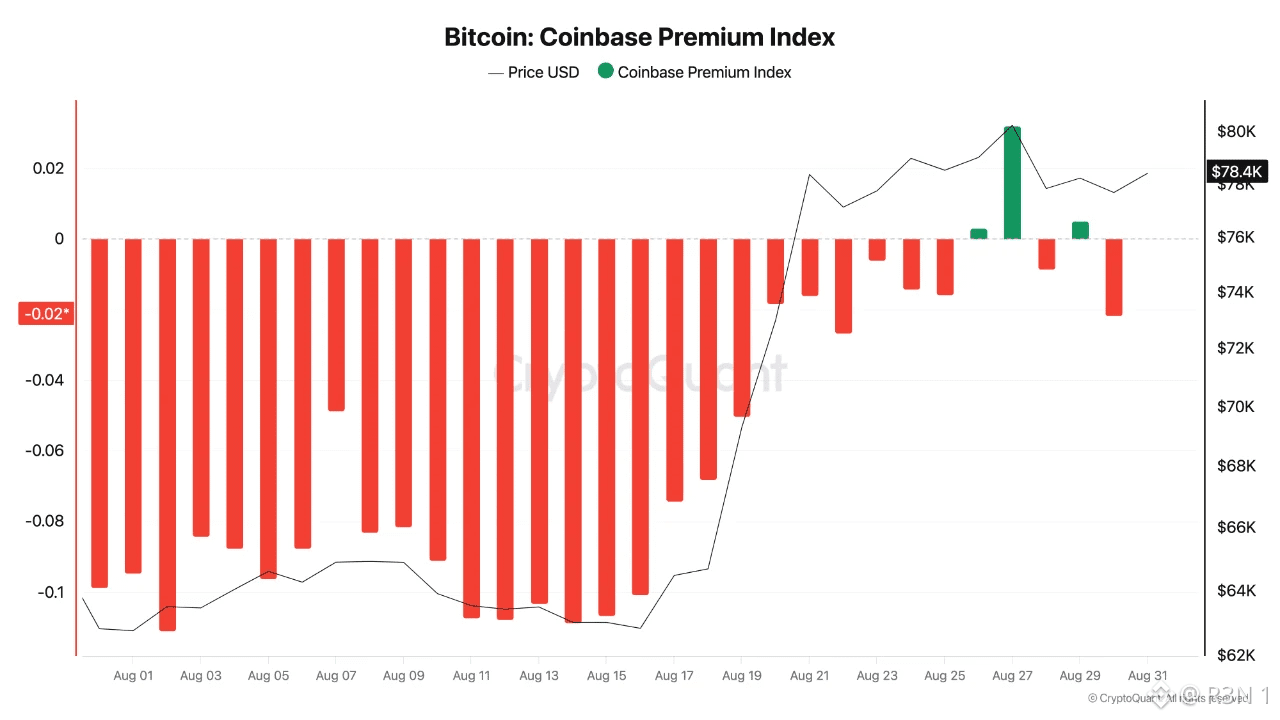
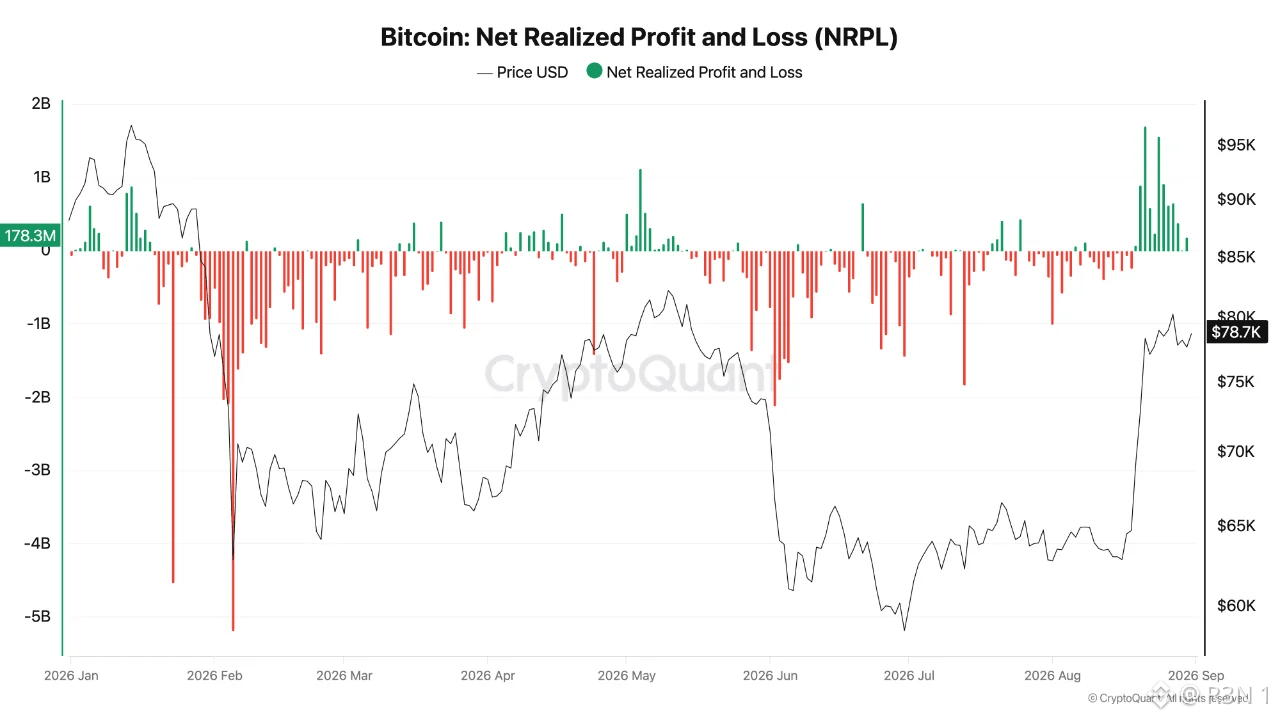
Bitcoin ran from $63K to $81.5K in two weeks, and on-chain data underneath tells a shakier story than price implies. NRPL hit two major peaks, ~$1.7B on August 21 and $1.6B on August 24, among the largest readings this year outside the Jan-Feb crash. No comparable spike followed, but the days after stayed positive at $400-650M daily. The pressure never cleared, it just shifted from acute to chronic. Coinbase Premium is the clearest demand tell. It briefly flipped positive August 26-27, hinting real US spot buying was back, but couldn't hold above zero before fading. Fresh demand tried to show up and didn't stick. Funding staying elevated here is worth worrying about. Rates hit a yearly extreme of 0.0225 mid-August, normally a sign of conviction. Paired with fading spot demand and heavy profit-taking, elevated funding looks more like exposed leverage than confidence, historically the setup that accelerates downside once support breaks. SOPR confirms a handoff between cohorts, but a shrinking one. It spiked 0.78 to 1.45 between August 19-22 as long-term holders led distribution, dropped to 0.94-0.98 as short-term holders took over near the second peak, then rebounded above 1.1 by August 29-31 even though $BTC only reached $78.5K, short of $80K. Last year's rally to $120K saw this ratio spike above 2, touching 2.8. A much smaller move now is producing near-record realized profit, meaning the low-cost supply pool sitting on the sidelines is large, and tolerance for absorbing it is thinner than it looks. The real question is which breaks first, fading spot demand or persistent profit-taking. Balance leans toward the latter. Watch Coinbase Premium and whether SOPR keeps climbing while price stalls. $XRP #BNBChain# #BTC Price Analysis#
I have used STONfi as my primary DeFi interface on TON for long enough now that I can see patterns in my own behavior that weren't visible when I was moving between platforms constantly. The first pattern is how much decision quality improves when the interface is familiar. When I know exactly where to find the pool APR versus the farm APR, where to check the 24-hour volume, where the price impact figure appears before confirmation — I spend that cognitive load on the analysis rather than on navigation. The interface stops being a thing I'm figuring out and becomes a tool I'm using. The second pattern is how the fee structure shapes what I'm willing to do. On TON through STONfi a swap costs approximately $0.06 to $0.13. This is low enough that I execute small adjustments that I wouldn't bother with on a chain where each transaction costs $3 to $8. The frequency of small corrections to positions is higher. The tendency to let a position run past its optimal point because rebalancing has a meaningful transaction cost is lower. Near-zero fees change behavior in ways I didn't fully anticipate. The third pattern is about the farming digest rhythm. Reading the pool board weekly as a consistent habit rather than checking it reactively when something catches my attention produces better decisions than reactive checking does. I see the changes week over week rather than just the current state. TONG/GRAM appearing one week with near-zero volume tells me something specific. STORM/GRAM maintaining consistent TVL across multiple weeks without deadline pressure tells me something different. The pattern is only visible if I'm checking consistently rather than occasionally. Consistency with one platform compounds in ways that switching between platforms doesn't. The familiarity, the fee-adjusted behavior, the weekly rhythm — these are the quiet advantages of staying in one place long enough to understand it properly. Explore @ston_fi → https://app.ston.fi/swap $XRP $ETH

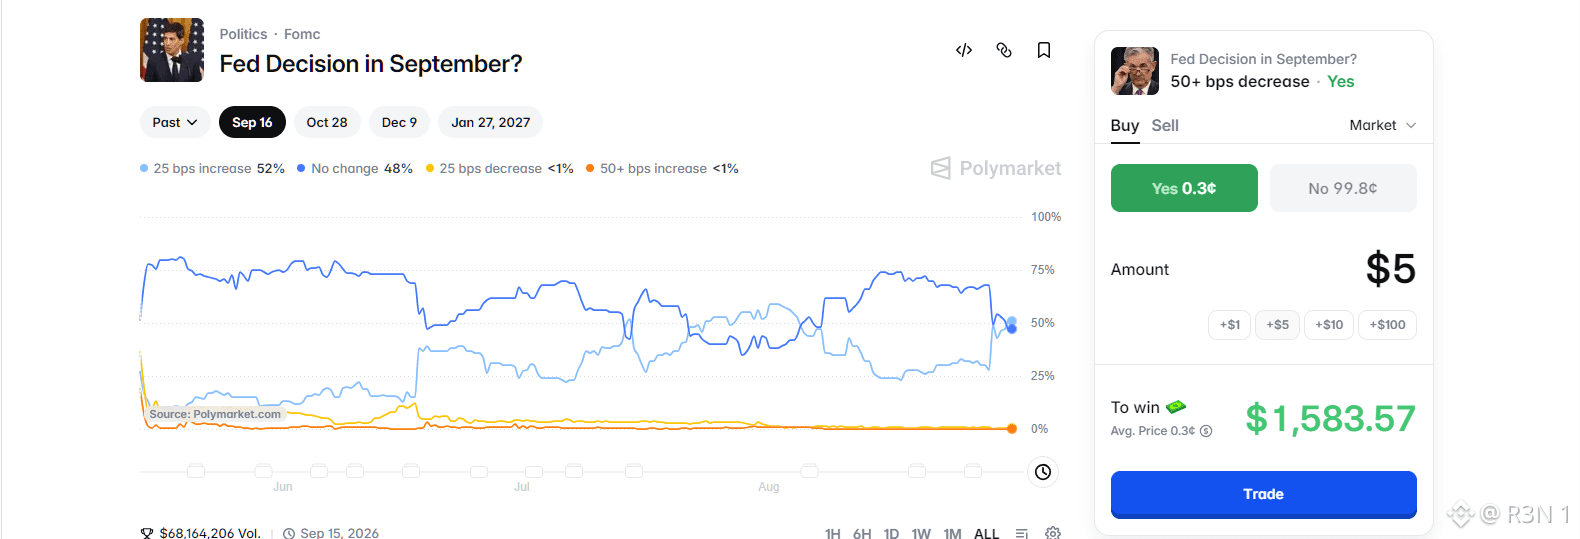
Polymarket has $68.16 million wagered on the September 16 Fed decision. The crowd is split almost exactly in half. 25 basis points increase at 52%. No change at 48%. A rate cut isn't meaningfully priced at all, the decrease options sit under 1% collectively. This market isn't pricing easing. It's debating whether the Fed hikes or holds. That's a meaningfully more hawkish backdrop than the "Fed pauses, risk assets rally" narrative that circulated after the July hold. The 52/48 split sitting this close to even odds this near the decision date means genuine data-dependency rather than settled conviction. When a prediction market is this tight this close to resolution it's telling you the incoming data between now and September 16, CPI, jobs, oil prices, has real power to move the outcome rather than confirming what's already decided. The small panel detail worth noting: 50 basis points decrease at 0.3 cents. A $5 position wins $1,583 if an aggressive cut materializes. That's what near-zero-probability tail exposure looks like in a prediction market,cheap lottery-ticket positioning on an outcome nobody expects but a few people are willing to pay almost nothing to cover. What this means practically: if the 52% hike scenario settles, tighter policy landing against fresh risk-on positioning in $BTC , $ETH , and DeFi is a real headwind. The July FOMC hold rally assumed the pause would persist. A September hike would revise that assumption sharply. For stablecoin farming positions on STONfi the macro read cuts both ways. A hike makes stablecoin yield more attractive relative to volatile asset exposure. A hold sustains the risk-on environment where DeFi capital inflows continue. Either scenario has a positioning implication worth thinking through before September 16. The 52/48 split is telling you not to assume either outcome is settled. Watch the data between now and then. Try Predict → https://t.me/ipredict/app
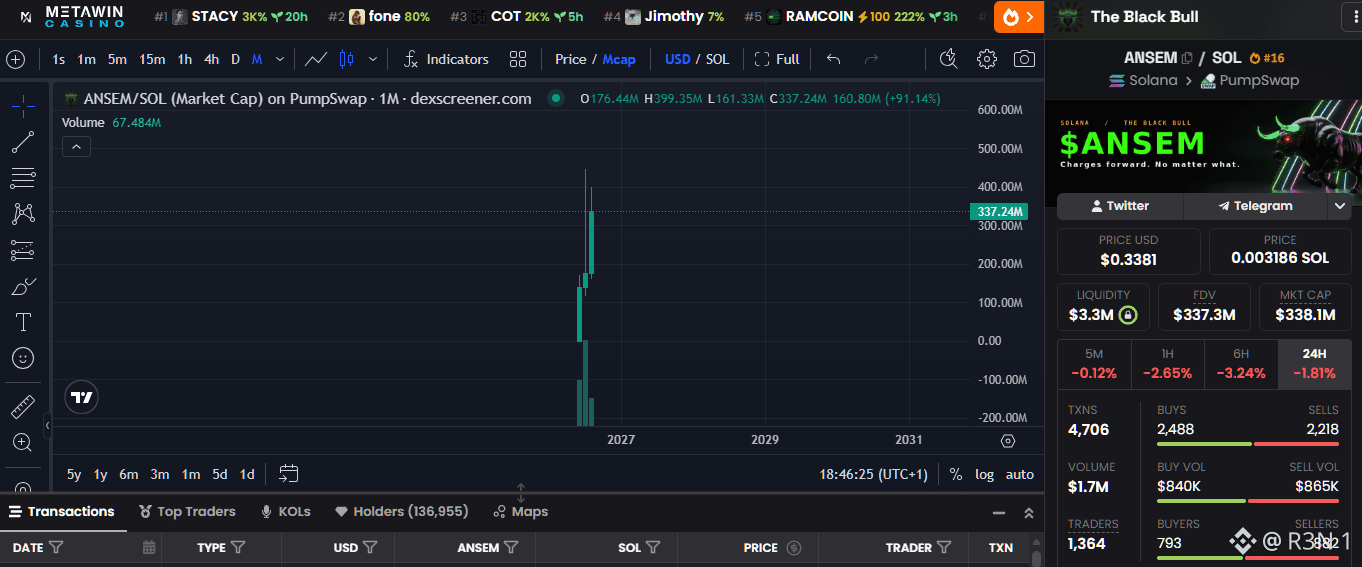
$ANSEM is a real reminder of how detached these meme narratives can get from anything resembling a project, and the supply concentration is the part worth actually reading before touching it. An anonymous developer created it in mid-June and airdropped roughly 60-65% of the total billion-token supply directly to Ansem's own wallet, a well known Solana trader with close to a million followers, without his involvement in building it. He didn't launch it, but he embraced it afterward and pledged to route his Pump.fun creator fees back to holders as airdrops. That single move, one influencer publicly adopting a coin he didn't create, is what took it from microcap to nearly 20,000% in a week, hitting an all time high near $0.121 on June 29 and single-handedly pulling Pump.fun 's overall activity out of a months-long slump. The mechanics behind that pump are worth being clear-eyed about. This has no product, no roadmap, no identifiable team beyond the anonymous creator, and its price moves almost entirely on attention. When Ansem posts about it, volume spikes. When he goes quiet, it fades. That's the entire demand model in one sentence. The concentration is the real risk sitting underneath the attention story. One wallet linked to Ansem was holding around 604 million tokens, over 60% of total supply, as of the last check. Liquidity is thin relative to the market cap it's traded at, meaning even moderately sized orders can move price sharply in either direction, and there are multiple copycat tokens using the same ANSEM name circulating, so verifying the actual contract address before doing anything is non-negotiable, not optional advice. Worth flagging too, this specific link goes to an Elfa AI insight page that didn't render its actual content for me, likely a JS-heavy interface, so I can't confirm what that particular analysis said. Everything above comes from independently verified reporting on the token itself, not that specific page.
Schiff's latest round is worth unpacking because it's actually three separate claims stacked together, and they don't all hold up the same way. The trigger was a comparison from crypto analyst Quinten Francois, pointing out gold's market is roughly 20 times bitcoin's size, equities about 100 times larger, real estate over 250 times larger, implicitly framing bitcoin as having room to grow into those categories. Schiff's response was blunt: bitcoin isn't a real asset, so its value has no relationship to gold, equities, or real estate at all. That's a definitional claim, not really an argument, it asserts bitcoin doesn't belong in the comparison rather than explaining why the market cap ratio itself is meaningless. His inflation hedge argument is more substantive. He's said directly he doesn't think bitcoin is an inflation hedge, and that people who believe otherwise are wrong, pointing investors toward gold and silver instead. That's a testable position, bitcoin's correlation with inflation prints has genuinely been inconsistent historically, unlike gold's longer track record in that role. Reasonable people disagree here, it's not a fringe take even among bitcoin holders. Harder to take at face value is his response to being asked about missing bitcoin's run. He said he's been better off not owning it over five years, and called holders who didn't sell the ones who left money on the table, an argument that only works if you already assume the price eventually goes to zero. Otherwise not selling an appreciating asset isn't leaving money on the table, it's the position working. He's also arguing AI is a threat to bitcoin rather than a complementary trend, the opposite of how some bitcoin proponents frame it. Worth noting, though the article doesn't lay out his reasoning in detail. #BTC Price Analysis# $BTC $XRP #Macro Insights#

Schiff's latest round is worth unpacking because it's actually three separate claims stacked together, and they don't all hold up the same way. The trigger was a comparison from crypto analyst Quinten Francois, pointing out gold's market is roughly 20 times bitcoin's size, equities about 100 times larger, real estate over 250 times larger, implicitly framing bitcoin as having room to grow into those categories. Schiff's response was blunt: bitcoin isn't a real asset, so its value has no relationship to gold, equities, or real estate at all. That's a definitional claim, not really an argument, it asserts #Bitcoin doesn't belong in the comparison rather than explaining why the market cap ratio itself is meaningless. His inflation hedge argument is more substantive and worth taking seriously on its own terms. He's said directly he doesn't think bitcoin is an inflation hedge and that people who believe otherwise are wrong, pointing investors toward gold and silver instead. That's a real, testable position, bitcoin's correlation with inflation prints has genuinely been inconsistent historically, unlike gold's longer track record in that specific role. Reasonable people disagree on this, and it's not a fringe take even among people who like bitcoin. Where it gets harder to take at face value is his response to being asked about missing bitcoin's run. He said he's been better off not owning it over the last five years, and called holders who didn't sell the ones who left money on the table, an argument that only works if you already assume the price eventually goes to zero, otherwise not selling an appreciating asset isn't leaving money on the table, it's the position working. He's also arguing AI is a threat to bitcoin rather than a complementary trend, the opposite of how some bitcoin proponents have tried to frame the relationship. Worth noting as another claim in the piece, though the article doesn't lay out his reasoning for it in any detail worth repeating here.

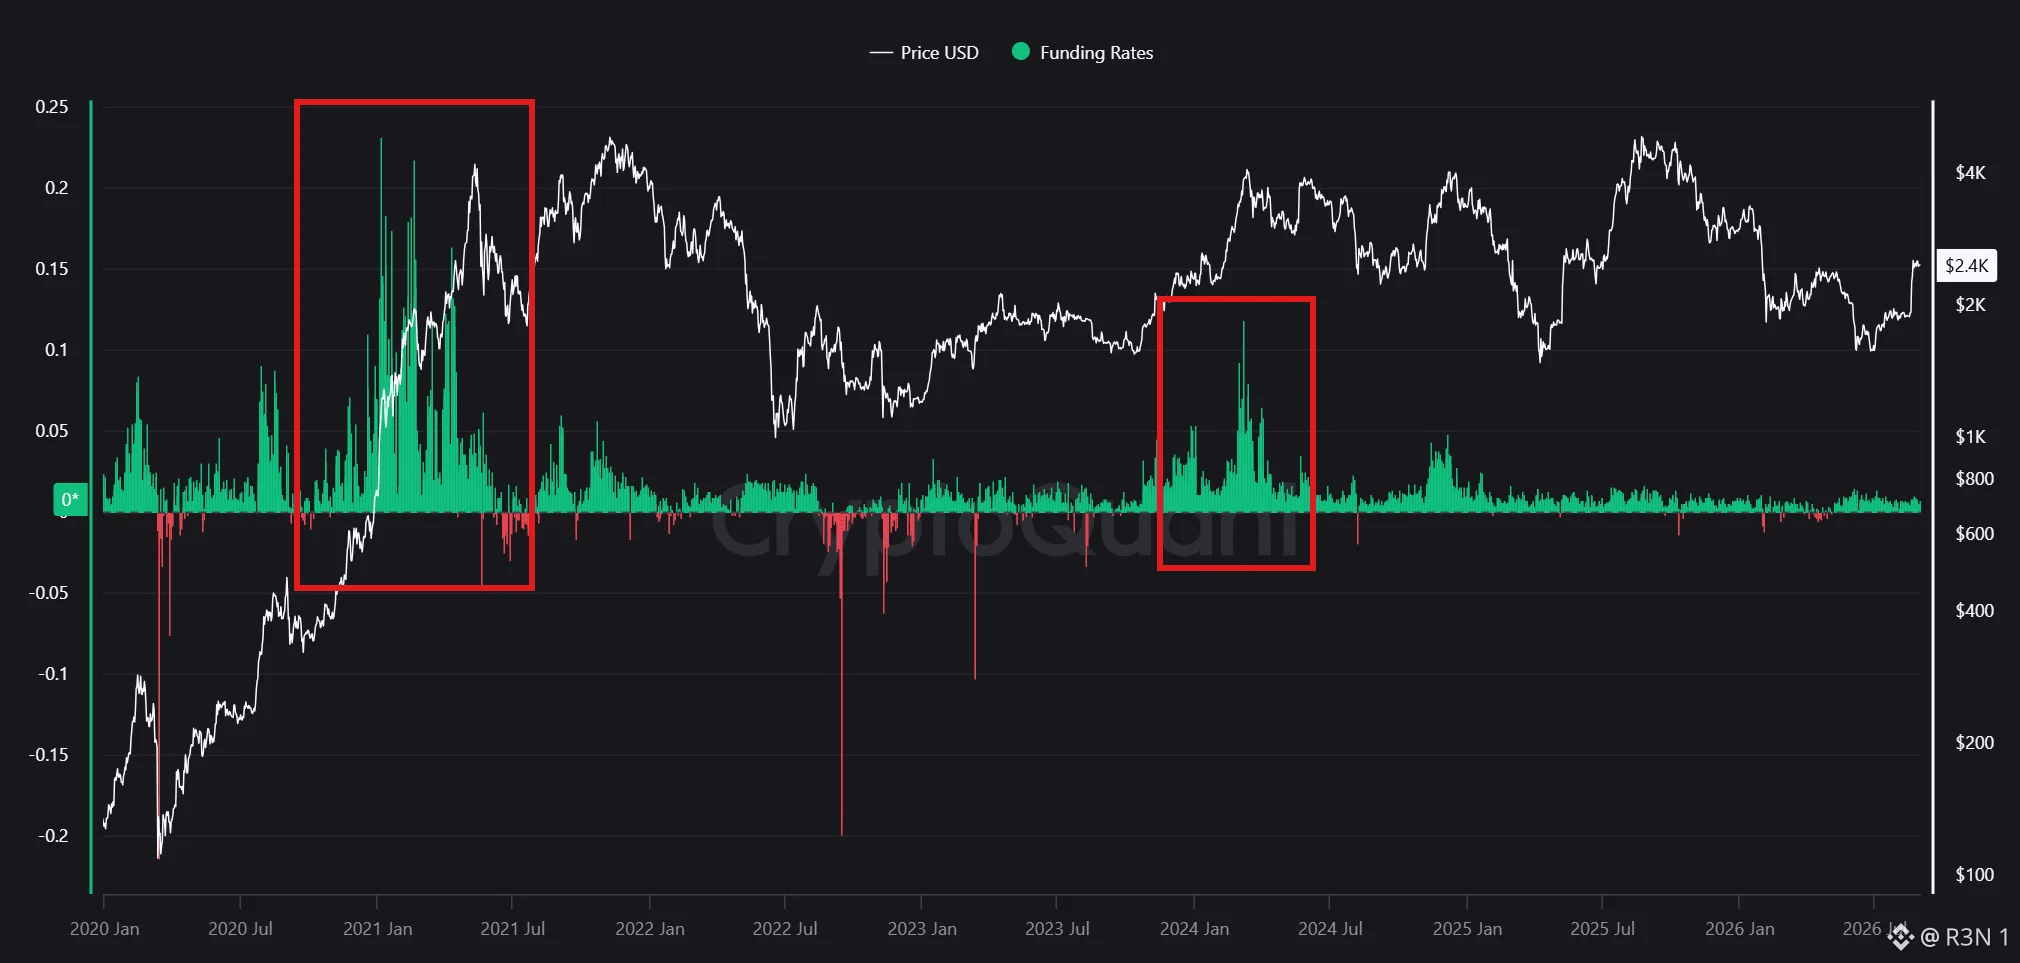
ETH just reclaimed $2,400 after a long grind, pulled back almost immediately, and everyone's asking if that's the downtrend reasserting itself. Funding rates say probably not, at least not yet. Every major $ETH crash on this chart shared the same setup beforehand. Early-to-mid 2021, funding spiked above 0.2 as longs got dangerously crowded, and that preceded a real correction. 2022 and 2023 showed the opposite extreme, sharp plunges to -0.05 and -0.1 as violent liquidation cascades tore through the market. Both directions represented the same underlying thing, a market that had gotten structurally unbalanced on leverage, and both times that imbalance resolved with a significant selloff. Right now funding's sitting in a stable, moderate green range, nowhere near either historical extreme. That matters because it means the market hasn't built up the kind of crowded leveraged long exposure that's shown up before every prior liquidation-driven crash on this chart. The current pullback looks more like a natural pause after a rally than the early stage of something structurally unwinding. Worth being honest about the limits here though. Funding is a lagging signal, it reflects positioning that's already built up, not positioning that's about to build. It can shift fast if sentiment turns quickly, and a sharp spike in either direction over the next few days would change this read entirely. Cross-checking exchange-level funding divergence and derivatives-to-spot volume ratios would round this out further before treating it as settled. But based on what's actually showing up in the data right now, this pullback is missing the overheating signature that preceded every prior major ETH crash. That's a real distinction, not a guarantee, and it's the difference between short-term consolidation and the start of something worse. #BTC Price Analysis# $ETH #Altcoin Season#

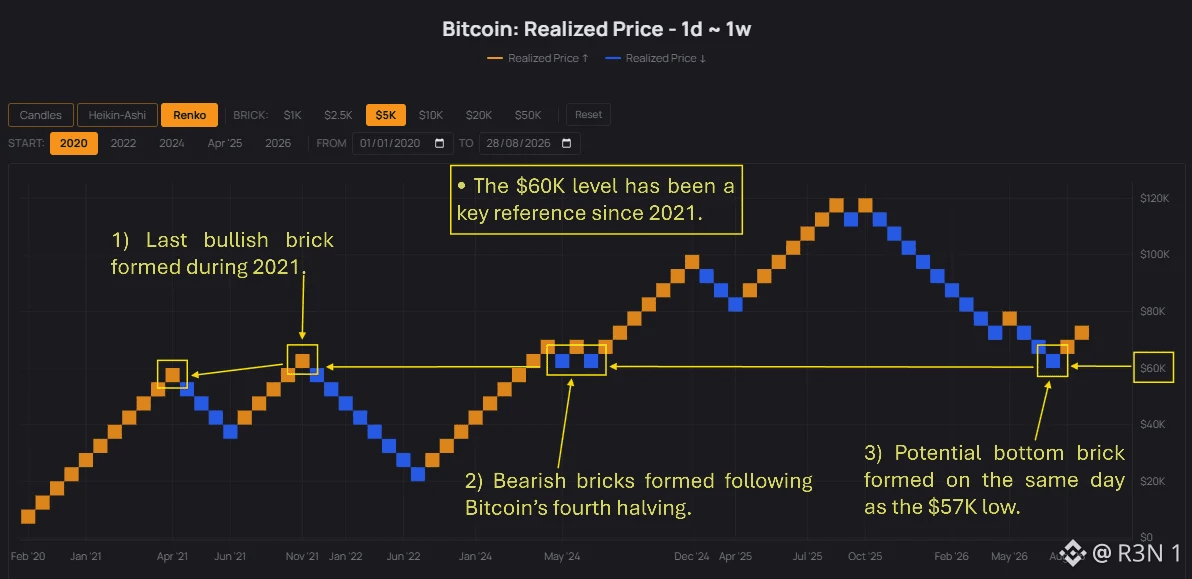
Bitcoin's realized price just flashed the same $60,000 level for the third time since 2021, and that's worth sitting with for a second. This isn't the spot price chart, it's realized price, the average cost basis of every coin that's ever moved on-chain. When it shifts, that's actual capital repositioning, not just trading noise. And the Renko view here strips out time entirely, bricks only print once price moves a fixed $5,000, so what's left is pure structure with the chop filtered out. Three points, same level, five years apart. The last bullish brick before the whole thing rolled over into the 2021-2022 bear market printed right at $60K. The bearish bricks that formed right after the 2024 halving pinned to that same $60K zone. And now, the potential bottom brick, forming the same day spot hit its recent $57K low, is sitting right back at $60K again. That's not a coincidence you wave off. A level showing up as a top once, a mid-cycle pivot once, and now a potential bottom, across three completely different market regimes, means enough of the market's aggregate cost basis clusters there that it keeps acting as gravity, whichever direction price is coming from. What it doesn't do is confirm anything yet. Renko only tells you a reversal happened after enough opposite bricks print. Right now there's one orange brick after a run of blue ones, that's a potential bottom, not a confirmed one. The actual tell is whether this turns into a sustained run of bullish bricks the way the last two touches at this level eventually resolved, or whether it just gets tagged and rejected again. $BTC #BTC Price Analysis# #Altcoin Season# #Meme Alpha#
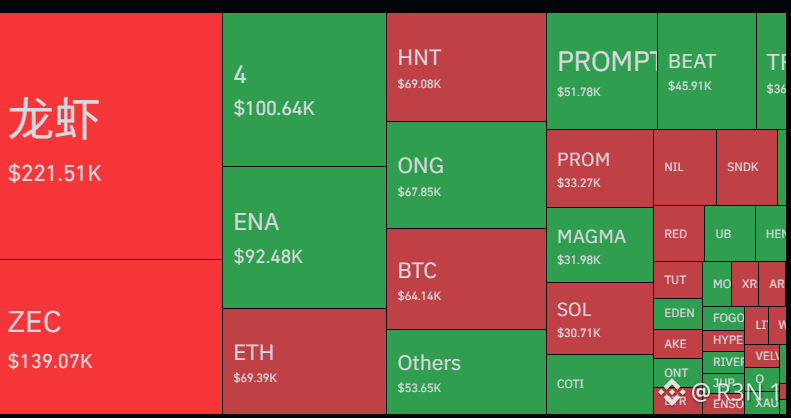
Coinglass's live liquidation panel confirms what the 90-day chart hinted at: this is a short squeeze, and thin-liquidity tokens are eating the worst of it. $龙虾 leads with $210.62K in short liquidations against just $10.88K long. ZEC shows $137.87K shorts wiped, zero longs touched. ETH and ENA follow the same lean, shorts taking the bulk of the damage, just at smaller size given deeper liquidity. HNT is the outlier, longs took more damage there. The pattern lines up with the 90-day liquidation chart's August 20 spike, nearly $3B in single-day liquidations, almost entirely short-side, right as BTC broke out of its two-month range and ran 27% in a week. Shorts that had been quietly winning through months of chop got caught leaning the wrong way the moment price actually moved. Thin books amplify this. Low-cap and meme-adjacent names like 龙虾ⁿ and $ZEC show liquidation totals rivaling or exceeding ETH, not because more capital is at risk, but because shallow liquidity means smaller positions cascade harder. Worth flagging: this hourly snapshot isn't confirmed to be the same event as the August 20 spike, it could be a fresh, smaller squeeze happening independently. The mechanism is identical either way, crowded shorts getting run over as price extends, but treat it as a recurring pattern rather than one continuous event until there's a clean timestamp connecting them. $龙虾 #Macro Insights# #Altcoin Season#

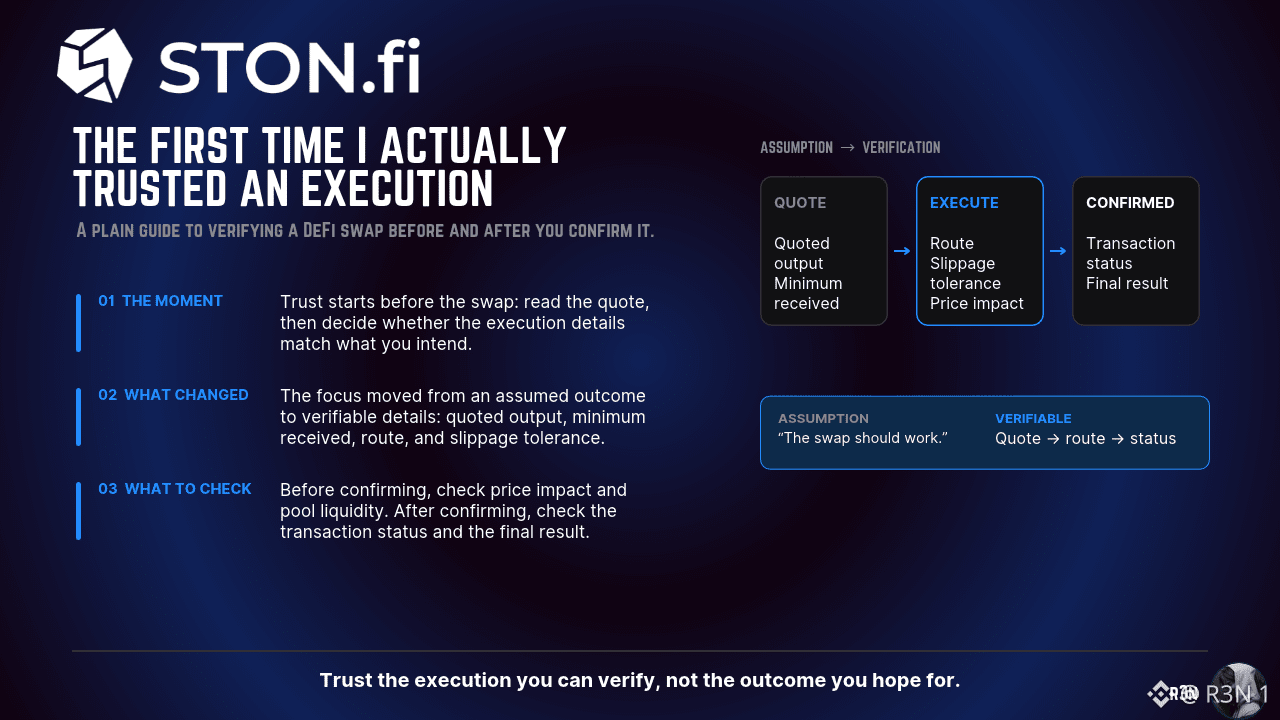
I spent a long time in DeFi with a specific background anxiety around execution. Not dramatic fear. Just a low-level expectation that the amount I saw on the confirmation screen and the amount that actually arrived would be different by some percentage I couldn't predict and couldn't control. Slippage settings helped. They didn't eliminate the uncertainty. They just moved the line. The anxiety came from enough experiences where the gap between expected and received was large enough to notice and small enough to not know whether to blame the market, the interface, or the route. The uncertainty about which variable was responsible made it impossible to address. What changed my default assumption was running cross-chain swaps through Omniston on @ston_fi repeatedly and noticing the same thing each time. The amount confirmed was the amount that arrived. Not approximately. Not within a tolerance I had set and accepted. The same figure. I understand mechanically why this happens. The resolver commits to delivering the quoted amount. The HTLC structure enforces that commitment or returns the original assets. The outcome is conditional on delivery rather than probabilistic around it. The architecture produces consistency that AMM-based execution can't guarantee under the same conditions. What I didn't expect was how much that consistency changed the way I think about execution quality as a variable. Once you've run enough swaps where the quote matches the result you start noticing how unusual that actually is compared to everything you used to accept as normal. The anxiety doesn't disappear entirely. But it moves from execution to analysis — which is where it belongs. Try cross-chain swaps → https://app.ston.fi/swap?mode=cross-chain #BTC Price Analysis# $SOL #TON ecosystem, here to discover the latest projects# $PI
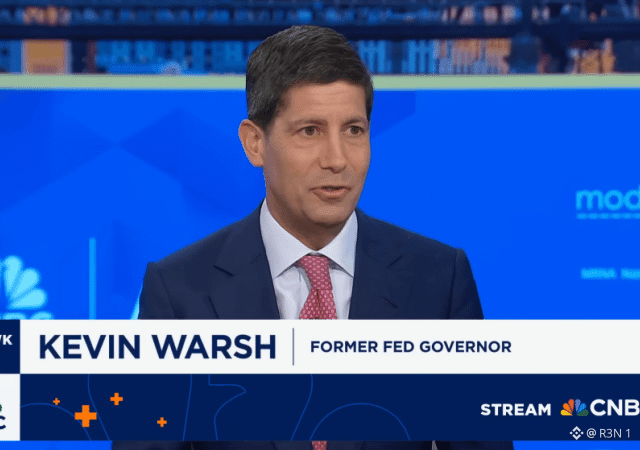
The whole rally from $64,000 to near $80,000 had one real driver, Treasury's expanded bond buyback program, which pushed yields and the dollar lower and revived the debasement trade that had crypto and gold running together. Warsh's speech was the test of whether the Fed would reinforce that setup or push back against it. It pushed back. He spoke in a genuinely hawkish tone, calling price stability the Fed's top priority, and said directly that he was "struggling to define the financial conditions as restrictive." That's a specific, deliberate signal, he's telling markets he doesn't see current conditions as tight enough to justify easing soon, even with encouraging summer inflation prints. He closed by saying he's "committed to a discipline, not to a decision," which keeps the door open either way but leans toward no predetermined rate cut path, data dependent rather than dovish. The market reaction lines up exactly with that framing. Bitcoin was trading around $79,000 heading into the speech and dropped to about $78,000 during and after it, a real but contained move, not a collapse. That's roughly consistent with a market that had priced in some probability of a more dovish tone getting a modestly hawkish surprise instead, enough to knock price down but not enough to break the broader structure that's held since the Treasury buyback news. I would say this didn't boost the rally, and it didn't end it either. It capped the immediate upside for now, since the Fed just declined to reinforce the Treasury-driven liquidity narrative that built this move in the first place. The $80,000-82,500 zone that already rejected #Bitcoin twice this month just got another reason to hold as resistance rather than a catalyst to break through it. $BTC
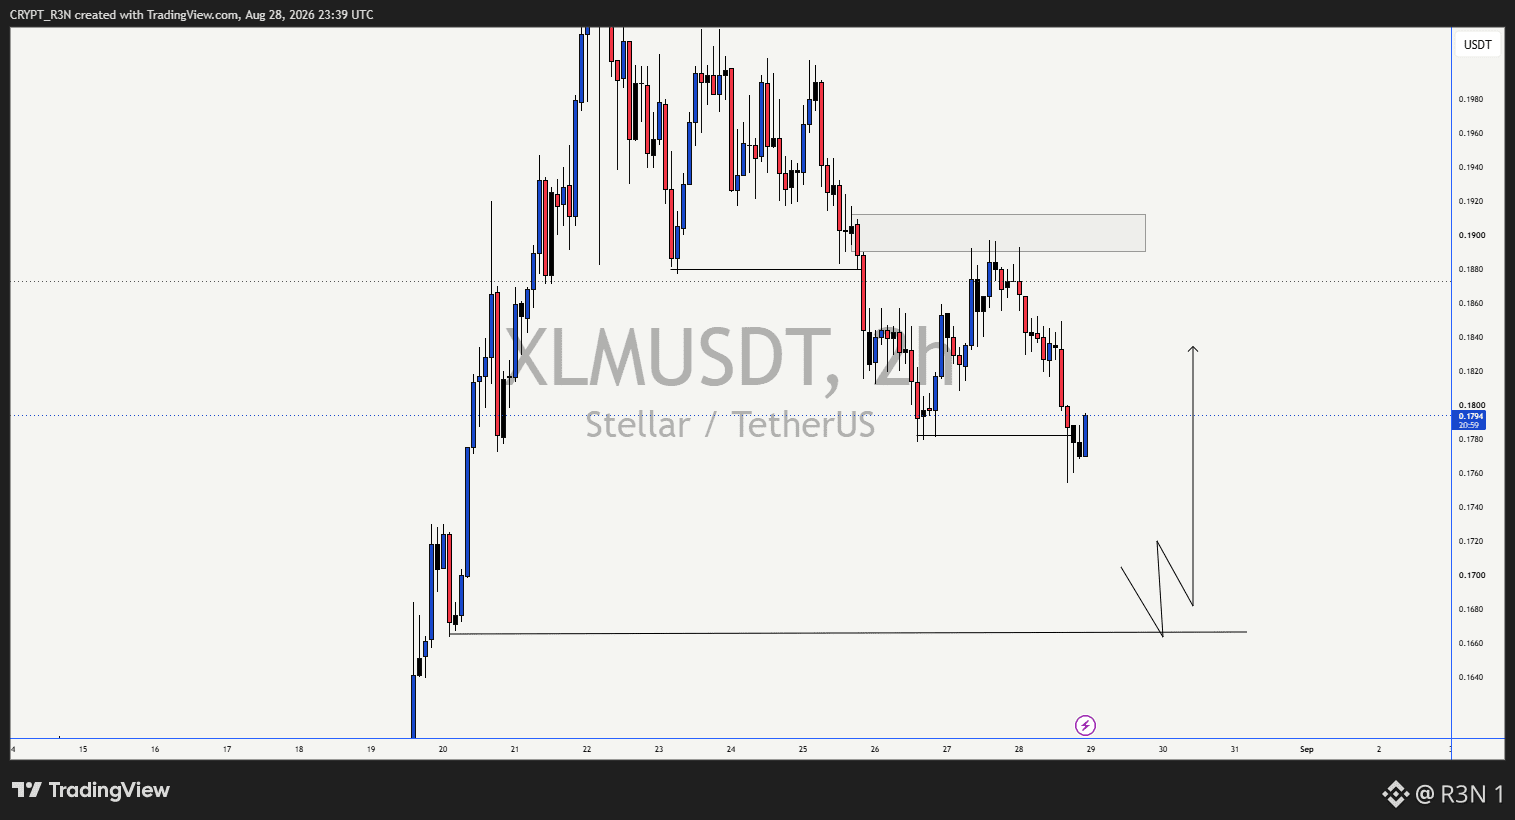
Stellar's carving out a textbook corrective structure right now, and it's worth walking through why the next leg down might actually be the setup, not the risk.
$XLM Price ran hard from around $0.166 up to nearly $0.199, then rolled over into a clean sequence of lower highs. First bounce came at $0.1880, second came lower at $0.178-0.180, and price is sitting right at $0.1794 now, testing that same shelf again. Each bounce in this correction has come from progressively lower ground than the one before it, which is the kind of pattern that usually resolves with one more flush before it actually turns.
If that holds, the level worth watching isn't here. It's the $0.166-0.170 zone underneath, the same area price launched its original impulsive rally from. A retest of that zone would put price back at the last spot committed buyers actually stepped in the first time, which tends to be a structurally sound place for a correction like this to terminate rather than just another number on the chart.
Worth being upfront that current price is already sitting on a level some are treating as legitimate support in its own right, with a deeper floor cited further down near $0.159. So there's a real chance this holds right here instead of extending lower. But given the sequence of lower highs and lower supports this correction has shown so far, the higher probability read is one more leg down into that $0.166-0.170 zone before any real reversal attempt, not a bounce off the level it's testing right now. #BTC Price Analysis# #Altcoin Season#
$XLM Price ran hard from around $0.166 up to nearly $0.199, then rolled over into a clean sequence of lower highs. First bounce came at $0.1880, second came lower at $0.178-0.180, and price is sitting right at $0.1794 now, testing that same shelf again. Each bounce in this correction has come from progressively lower ground than the one before it, which is the kind of pattern that usually resolves with one more flush before it actually turns.
If that holds, the level worth watching isn't here. It's the $0.166-0.170 zone underneath, the same area price launched its original impulsive rally from. A retest of that zone would put price back at the last spot committed buyers actually stepped in the first time, which tends to be a structurally sound place for a correction like this to terminate rather than just another number on the chart.
Worth being upfront that current price is already sitting on a level some are treating as legitimate support in its own right, with a deeper floor cited further down near $0.159. So there's a real chance this holds right here instead of extending lower. But given the sequence of lower highs and lower supports this correction has shown so far, the higher probability read is one more leg down into that $0.166-0.170 zone before any real reversal attempt, not a bounce off the level it's testing right now. #BTC Price Analysis# #Altcoin Season#
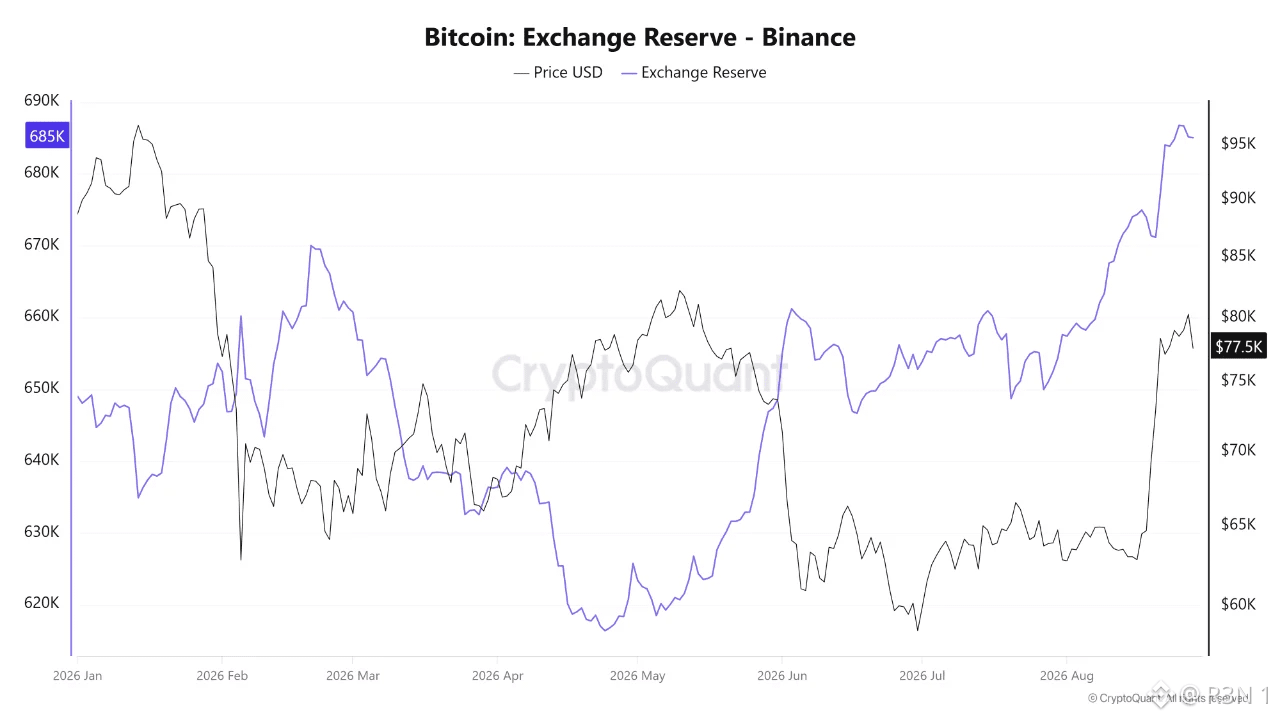
Binance's bitcoin reserves just hit their highest point of the year, and the timing lines up almost too well with where price actually stalled. Reserves climbed from roughly 617,000 BTC in late April to about 685,000 by the end of August, and the acceleration wasn't gradual, it picked up sharply in the second half of August, the exact window $BTC rebounded off the low $60,000s, briefly touched near $80,000, and then settled back around $77,500. Coins flowing onto an exchange while price is running is generally read as holders positioning to sell, hedge, or take profit, since that's what exchange balances are actually for in most cases, moving coins there specifically so they're available to trade. That's a plausible explanation for why $80,000 held as resistance despite otherwise improving demand elsewhere in the market. More available supply sitting on the largest exchange by volume is a real headwind against a breakout, even if nothing about that supply has been sold yet. Worth being precise about what this metric can and can't tell you though. Rising reserves is not the same as confirmed selling. Binance wallet reorganizations, custody transfers between institutional clients, market maker inventory shifts, and collateral movements for lending or derivatives all show up in this same number without representing genuine intent to dump. The chart shows coins arriving on the exchange. It doesn't show why. So the honest framing is a short-term caution flag, not a confirmed bearish signal. Reserves at a yearly high right as price tested major resistance is exactly the kind of setup worth watching closely, but the next layer of data, actual netflows, whale-sized deposits specifically, spot volume, and ETF demand, is what will actually tell you whether this reserve build turns into real selling pressure or just turns out to be coins repositioning without ever hitting the order book. #BTC Price Analysis# #Meme Alpha# #BNBChain#
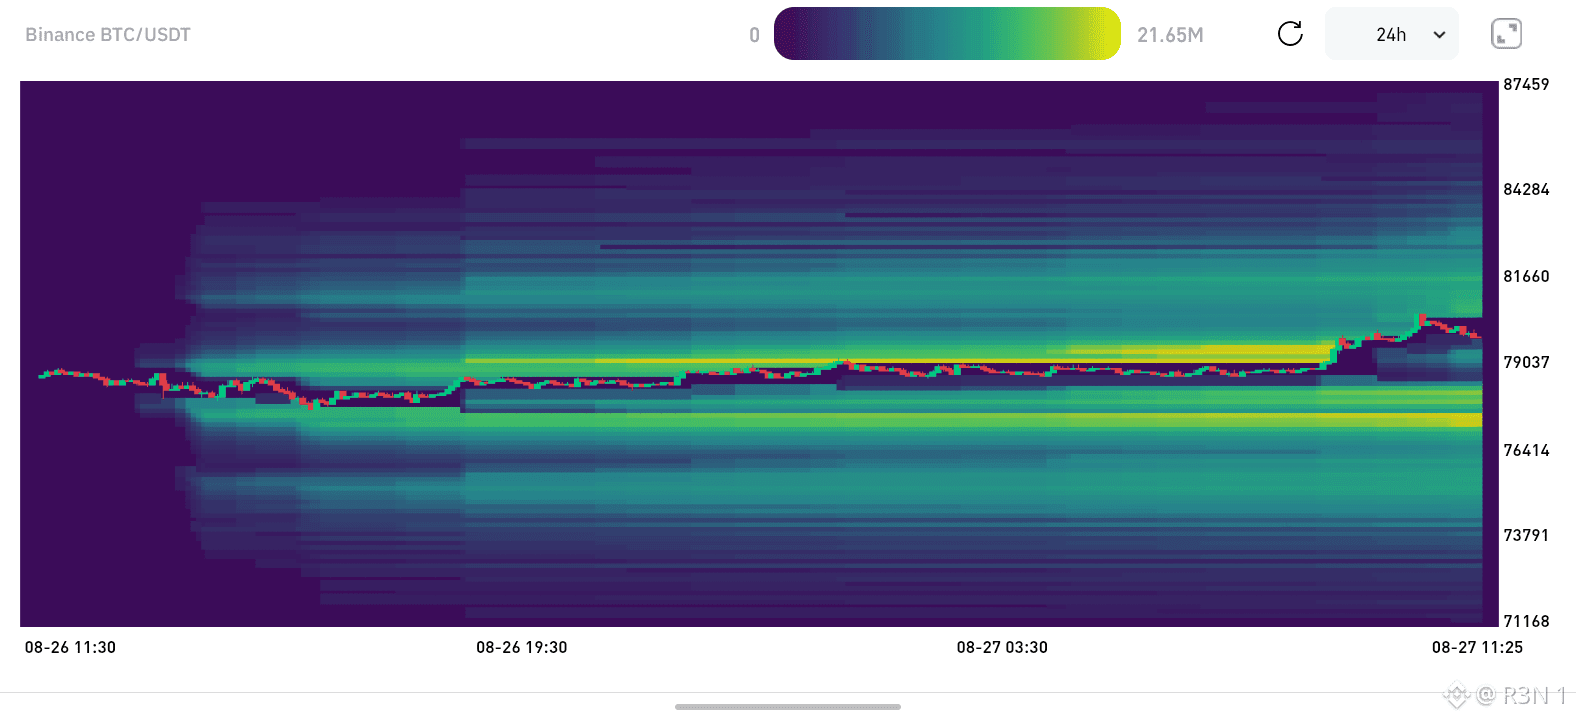
BTC's liquidation heatmap on Binance is showing something worth reading carefully before this next move gets called one thing or the other.
There are two bright bands sitting on this chart, and their position relative to price is the actual signal. One's been sitting just above price, roughly $79,000 to $79,500, glowing consistently since late yesterday while BTC ground sideways underneath it for most of the session. A second, dimmer band sits below current price, around $76,400 to $77,000, still visible but less intense. Yellow on these maps means concentrated leveraged positioning, the model's estimate of where stops and liquidation levels are clustering based on exchange data.
In the last hour of this window, price actually pushed straight through that upper band, running from around $79,000 toward $81,000+, right through the zone that had been sitting there glowing the entire day. That's the pattern you'd expect from a short squeeze. Price grinds under a dense cluster of resistance-side positioning, then breaks through and accelerates as those positions get forced to cover, adding fuel to the move rather than stopping it.
Worth being upfront that this is a probability weighted estimate, not an actual order book. It's the model's read on where stops are likely clustering based on leverage assumptions across the market, not a confirmed ledger of real positions, and actual liquidation levels can land lower than what the heatmap implies.
The band worth watching next is the lower one, $76,400 to $77,000. If this move pulls back at all, that's where the model's flagging remaining leveraged interest still sitting below current price, and how price behaves around that zone on any retrace is a better tell than anything happening at new highs right now.
$BTC #BTC Price Analysis# #Altcoin Season# #Meme Alpha#
There are two bright bands sitting on this chart, and their position relative to price is the actual signal. One's been sitting just above price, roughly $79,000 to $79,500, glowing consistently since late yesterday while BTC ground sideways underneath it for most of the session. A second, dimmer band sits below current price, around $76,400 to $77,000, still visible but less intense. Yellow on these maps means concentrated leveraged positioning, the model's estimate of where stops and liquidation levels are clustering based on exchange data.
In the last hour of this window, price actually pushed straight through that upper band, running from around $79,000 toward $81,000+, right through the zone that had been sitting there glowing the entire day. That's the pattern you'd expect from a short squeeze. Price grinds under a dense cluster of resistance-side positioning, then breaks through and accelerates as those positions get forced to cover, adding fuel to the move rather than stopping it.
Worth being upfront that this is a probability weighted estimate, not an actual order book. It's the model's read on where stops are likely clustering based on leverage assumptions across the market, not a confirmed ledger of real positions, and actual liquidation levels can land lower than what the heatmap implies.
The band worth watching next is the lower one, $76,400 to $77,000. If this move pulls back at all, that's where the model's flagging remaining leveraged interest still sitting below current price, and how price behaves around that zone on any retrace is a better tell than anything happening at new highs right now.
$BTC #BTC Price Analysis# #Altcoin Season# #Meme Alpha#
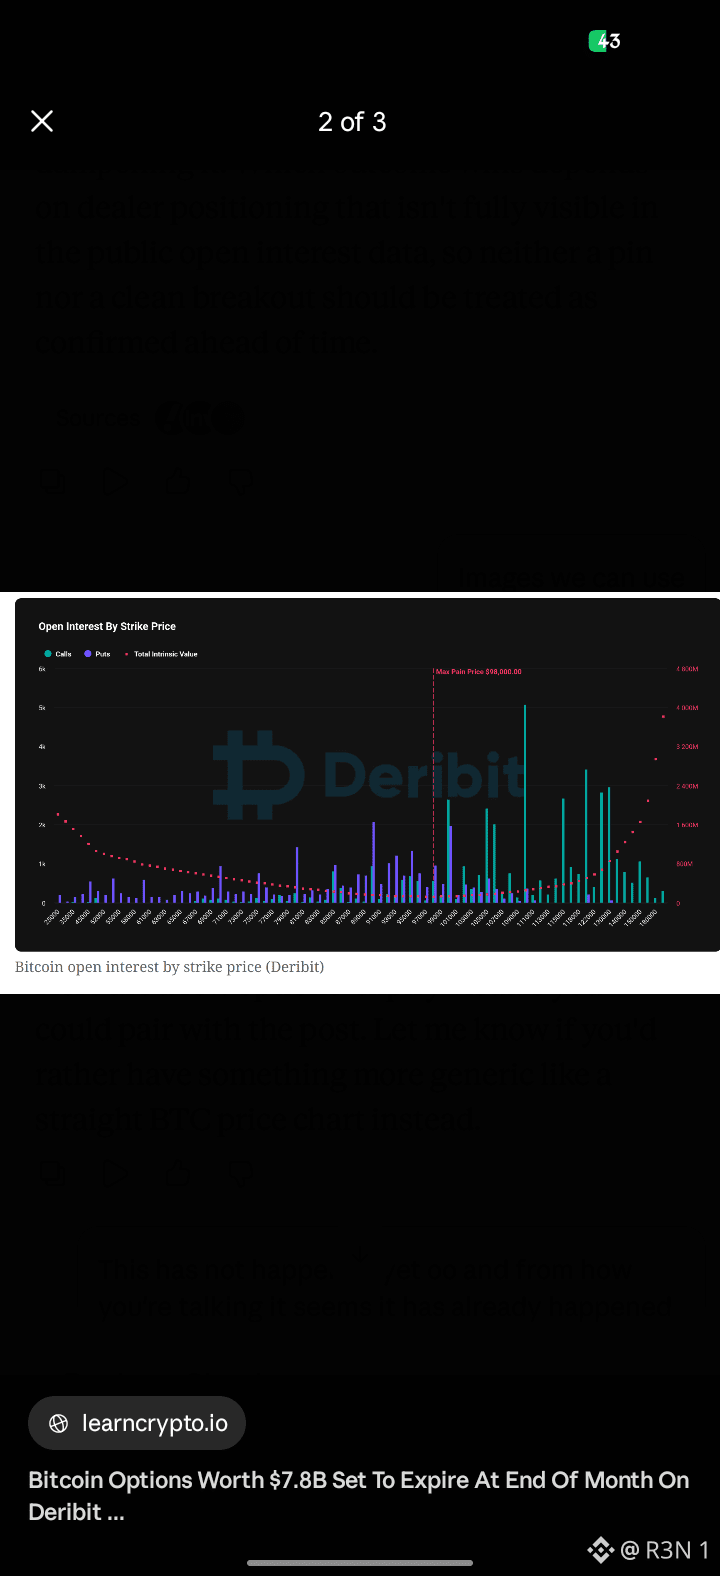
$6.4 billion in bitcoin options are set to expire Friday, and the number everyone's citing as the target is basically irrelevant to where price actually sits right now.
About 81,700 contracts settle at 08:00 UTC on Deribit, and the widely quoted max pain level sits near $68,000, the price at which the largest volume of options would expire worthless. Bitcoin's currently trading around $79,000, roughly $11,000 above that level. For max pain to actually pull price down to $68,000 by Friday, you'd need a move far larger than a simple retreat to the nearby strike clusters, and nothing in current positioning suggests that's underway.
Worth being direct about why max pain tends to get less reliable at exactly the moments people cite it most. The model doesn't account for hedging flows, entry prices held off exchange, spot demand, or the broader macro backdrop, and it has a poor track record of predicting actual settlement prices on expiries this size. It's a mechanical calculation of where option sellers lose the least, not a magnet price actually gets pulled toward.
The more useful thing to watch is strike concentration, not max pain. The $80,000 strike holds $157 million in call notional, and $75,000 has the largest call open interest of any strike, $236 million. That puts real weight right around and just below current price, meaning dealer hedging near those levels likely shapes volatility into Friday more than any theoretical pull toward $68,000.
A pinned market would see BTC hover near $80,000 as dealers offset moves. A decisive break through it could instead force dealers to trade with the move, amplifying it. Which outcome wins depends on dealer positioning not fully visible in public open interest data, so neither should be treated as confirmed ahead of Friday.
$BTC #BTC Price Analysis# #Altcoin Season# #BNBChain#
About 81,700 contracts settle at 08:00 UTC on Deribit, and the widely quoted max pain level sits near $68,000, the price at which the largest volume of options would expire worthless. Bitcoin's currently trading around $79,000, roughly $11,000 above that level. For max pain to actually pull price down to $68,000 by Friday, you'd need a move far larger than a simple retreat to the nearby strike clusters, and nothing in current positioning suggests that's underway.
Worth being direct about why max pain tends to get less reliable at exactly the moments people cite it most. The model doesn't account for hedging flows, entry prices held off exchange, spot demand, or the broader macro backdrop, and it has a poor track record of predicting actual settlement prices on expiries this size. It's a mechanical calculation of where option sellers lose the least, not a magnet price actually gets pulled toward.
The more useful thing to watch is strike concentration, not max pain. The $80,000 strike holds $157 million in call notional, and $75,000 has the largest call open interest of any strike, $236 million. That puts real weight right around and just below current price, meaning dealer hedging near those levels likely shapes volatility into Friday more than any theoretical pull toward $68,000.
A pinned market would see BTC hover near $80,000 as dealers offset moves. A decisive break through it could instead force dealers to trade with the move, amplifying it. Which outcome wins depends on dealer positioning not fully visible in public open interest data, so neither should be treated as confirmed ahead of Friday.
$BTC #BTC Price Analysis# #Altcoin Season# #BNBChain#
Binance's stablecoin reserves barely moved this week, up just 0.44% to $42.92B. On its own, that number says nothing happened. But the actual headline here is what's happening underneath it.
A flat total usually gets read as neutral, capital just sitting still. But when the composition inside that total is shifting, different stablecoins gaining or losing share while the aggregate stays pinned, that's a different story. It means money's moving, just not leaving the platform.
This tracks with something that's been building for months. Binance has been eating a growing share of total exchange stablecoin liquidity while the broader pool across all exchanges keeps shrinking. Other venues bleeding reserves, Binance holding steady or gaining relative share of what's left. Against that backdrop, an internal rotation that doesn't move the headline number reads less like stagnation and more like liquidity consolidating in place rather than actually exiting the system.
Worth being upfront that I couldn't pull the exact denomination breakdown from this specific report, the detail table didn't render. So I'm not going to guess which stablecoin gained and which lost share. But the framing itself, flat surface number hiding real movement underneath, is the more interesting read than the 0.44% by itself.
$BTC #BTC Price Analysis# $BNB
A flat total usually gets read as neutral, capital just sitting still. But when the composition inside that total is shifting, different stablecoins gaining or losing share while the aggregate stays pinned, that's a different story. It means money's moving, just not leaving the platform.
This tracks with something that's been building for months. Binance has been eating a growing share of total exchange stablecoin liquidity while the broader pool across all exchanges keeps shrinking. Other venues bleeding reserves, Binance holding steady or gaining relative share of what's left. Against that backdrop, an internal rotation that doesn't move the headline number reads less like stagnation and more like liquidity consolidating in place rather than actually exiting the system.
Worth being upfront that I couldn't pull the exact denomination breakdown from this specific report, the detail table didn't render. So I'm not going to guess which stablecoin gained and which lost share. But the framing itself, flat surface number hiding real movement underneath, is the more interesting read than the 0.44% by itself.
$BTC #BTC Price Analysis# $BNB
Most people cannot tell the difference between a good entry and a lucky one after the fact. Both make money. Both feel like confirmation that the decision process was sound. The problem is that only one of them actually was.
A good entry is one where the analysis was right before the outcome was known. You separated pool APR from farm APR. You checked the volume-to-TVL ratio. You evaluated the reward token price trend. You understood what the position looked like at the organic floor when incentives expired. The outcome confirmed the analysis.
A lucky entry is one where the analysis was incomplete or wrong but the market moved in a direction that made it look right anyway. You allocated because the APR number looked attractive and the timeline felt urgent. The token happened to go up. The farm happened to pay out before the reward token declined. The position happened to work despite the reasoning that produced it.
The dangerous part is not the lucky entry itself. It is what happens next. A lucky entry reinforces the same decision process that will eventually produce a painful loss because there is no feedback signal distinguishing it from a good entry. Both outcomes feel like validation.
What I started doing was auditing my decision process separately from my outcome. After any position closes I ask two questions independently. Was the outcome positive? Was the analysis complete before I entered? The four combinations tell you more than either question alone. A positive outcome from complete analysis is a good entry. A positive outcome from incomplete analysis is a lucky one. A negative outcome from complete analysis is an unlucky one. A negative outcome from incomplete analysis is the one that actually teaches you something worth keeping.
Most people only track the first number. The second one is where the actual learning lives.
Read more →https://blog.ston.fi/
$BTC #BTC Price Analysis# $PI #Meme Alpha#
A good entry is one where the analysis was right before the outcome was known. You separated pool APR from farm APR. You checked the volume-to-TVL ratio. You evaluated the reward token price trend. You understood what the position looked like at the organic floor when incentives expired. The outcome confirmed the analysis.
A lucky entry is one where the analysis was incomplete or wrong but the market moved in a direction that made it look right anyway. You allocated because the APR number looked attractive and the timeline felt urgent. The token happened to go up. The farm happened to pay out before the reward token declined. The position happened to work despite the reasoning that produced it.
The dangerous part is not the lucky entry itself. It is what happens next. A lucky entry reinforces the same decision process that will eventually produce a painful loss because there is no feedback signal distinguishing it from a good entry. Both outcomes feel like validation.
What I started doing was auditing my decision process separately from my outcome. After any position closes I ask two questions independently. Was the outcome positive? Was the analysis complete before I entered? The four combinations tell you more than either question alone. A positive outcome from complete analysis is a good entry. A positive outcome from incomplete analysis is a lucky one. A negative outcome from complete analysis is an unlucky one. A negative outcome from incomplete analysis is the one that actually teaches you something worth keeping.
Most people only track the first number. The second one is where the actual learning lives.
Read more →https://blog.ston.fi/
$BTC #BTC Price Analysis# $PI #Meme Alpha#

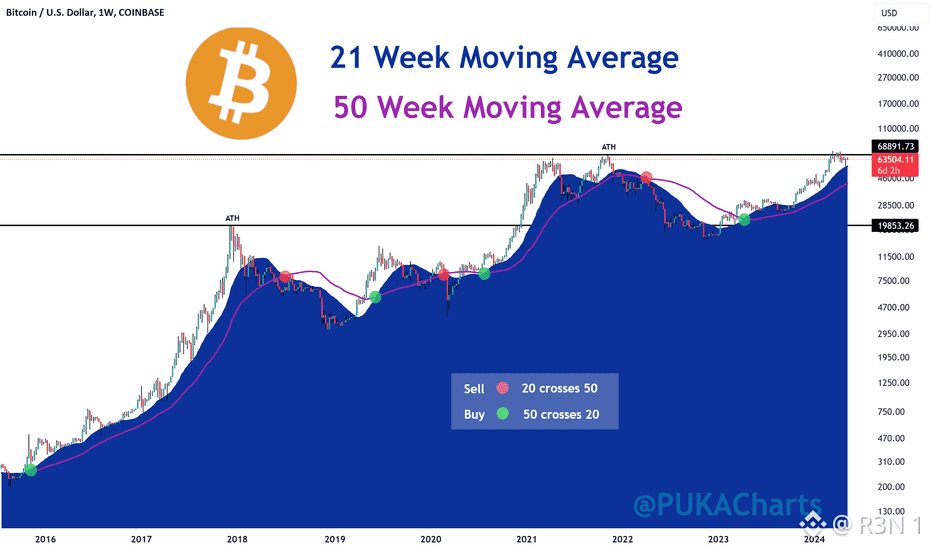
The core of the bear case usually comes down to structure, not vibes. A lot of these calls are built on the idea that this entire move up from the low $60Ks is still sitting inside a larger corrective structure off last year's highs, and that a clean rejection at the 50-week MA is the market confirming that the bounce was always going to fail at a well defined resistance rather than break into a genuine new trend. Under that read, $81K wasn't a breakout attempt, it was the top of a relief rally, and the 50-week MA rejecting it is treated as the confirmation everyone was waiting for. The $50K target specifically tends to come from one of two places. Some are mapping this decline against prior cycles, where after a major high, bitcoin has historically retraced somewhere in the 50 to 60 percent range before finding a real bottom, and $50K sits roughly in that zone relative to last year's peak. Others are anchoring to the 200-week moving average, which has acted as the eventual floor in every prior cycle's bear phase, and that average currently sits in a range that makes $50K a reasonable technical target if price mean-reverts back to it. Here's the actual tension in that logic though. Both of those frameworks assume this cycle behaves like the prior ones structurally, same depth of retracement, same eventual reversion to the 200-week average. That's a real pattern with real history behind it, which is why it gets repeated. But a single rejection at one resistance level doesn't by itself confirm that this cycle is following that same script rather than consolidating and trying again. The rejection is consistent with the bear case. It's also consistent with a normal pause before a retest. Those two outcomes look identical for the first few days after the level gets hit, which is exactly the point where a lot of these calls get made, before the market has actually shown which one it's doing. #BTC Price Analysis# $BTC
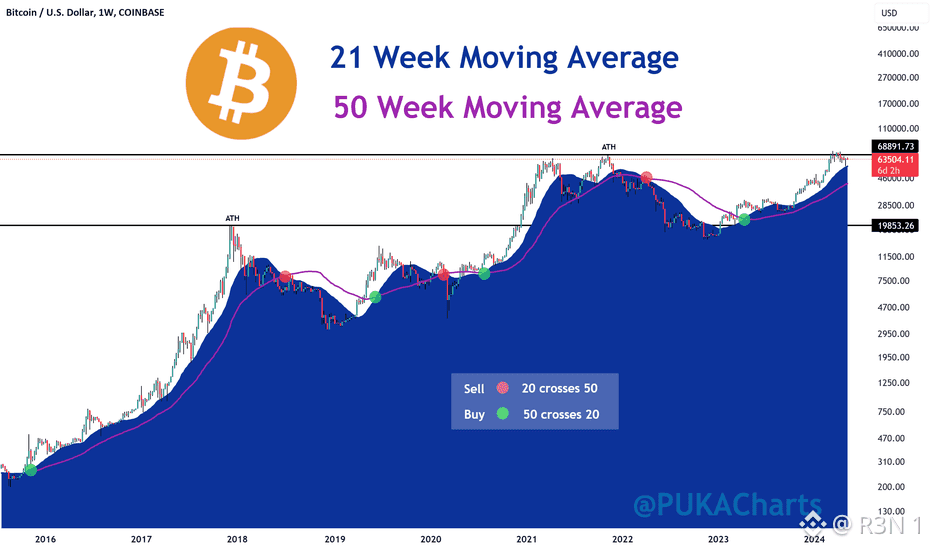
Fair, let's actually get into the why instead of just waving it off. The core of the bear case usually comes down to structure, not vibes. A lot of these calls are built on the idea that this entire move up from the low $60Ks is still sitting inside a larger corrective structure off last year's highs, and that a clean rejection at the 50-week MA is the market confirming that the bounce was always going to fail at a well defined resistance rather than break into a genuine new trend. Under that read, $81K wasn't a breakout attempt, it was the top of a relief rally, and the 50-week MA rejecting it is treated as the confirmation everyone was waiting for. The $50K target specifically tends to come from one of two places. Some are mapping this decline against prior cycles, where after a major high, bitcoin has historically retraced somewhere in the 50 to 60 percent range before finding a real bottom, and $50K sits roughly in that zone relative to last year's peak. Others are anchoring to the 200-week moving average, which has acted as the eventual floor in every prior cycle's bear phase, and that average currently sits in a range that makes $50K a reasonable technical target if price mean-reverts back to it. Here's the actual tension in that logic though. Both of those frameworks assume this cycle behaves like the prior ones structurally, same depth of retracement, same eventual reversion to the 200-week average. That's a real pattern with real history behind it, which is why it gets repeated. But a single rejection at one resistance level doesn't by itself confirm that this cycle is following that same script rather than consolidating and trying again. The rejection is consistent with the bear case. It's also consistent with a normal pause before a retest. Those two outcomes look identical for the first few days after the level gets hit, which is exactly the point where a lot of these calls get made, before the market has actually shown which one it's doing. $BTC
Log in to explore more content