
Gabbbar
16 Paylaşımlar

Gabbbar
Şikayət et
İstifadəçini blokla
Yüksək tezlikli treyder
5.7 il
37 İzlənilir
13 İzləyicilər
2 Bəyəndi
Postlar
·
--
Tərcüməyə bax
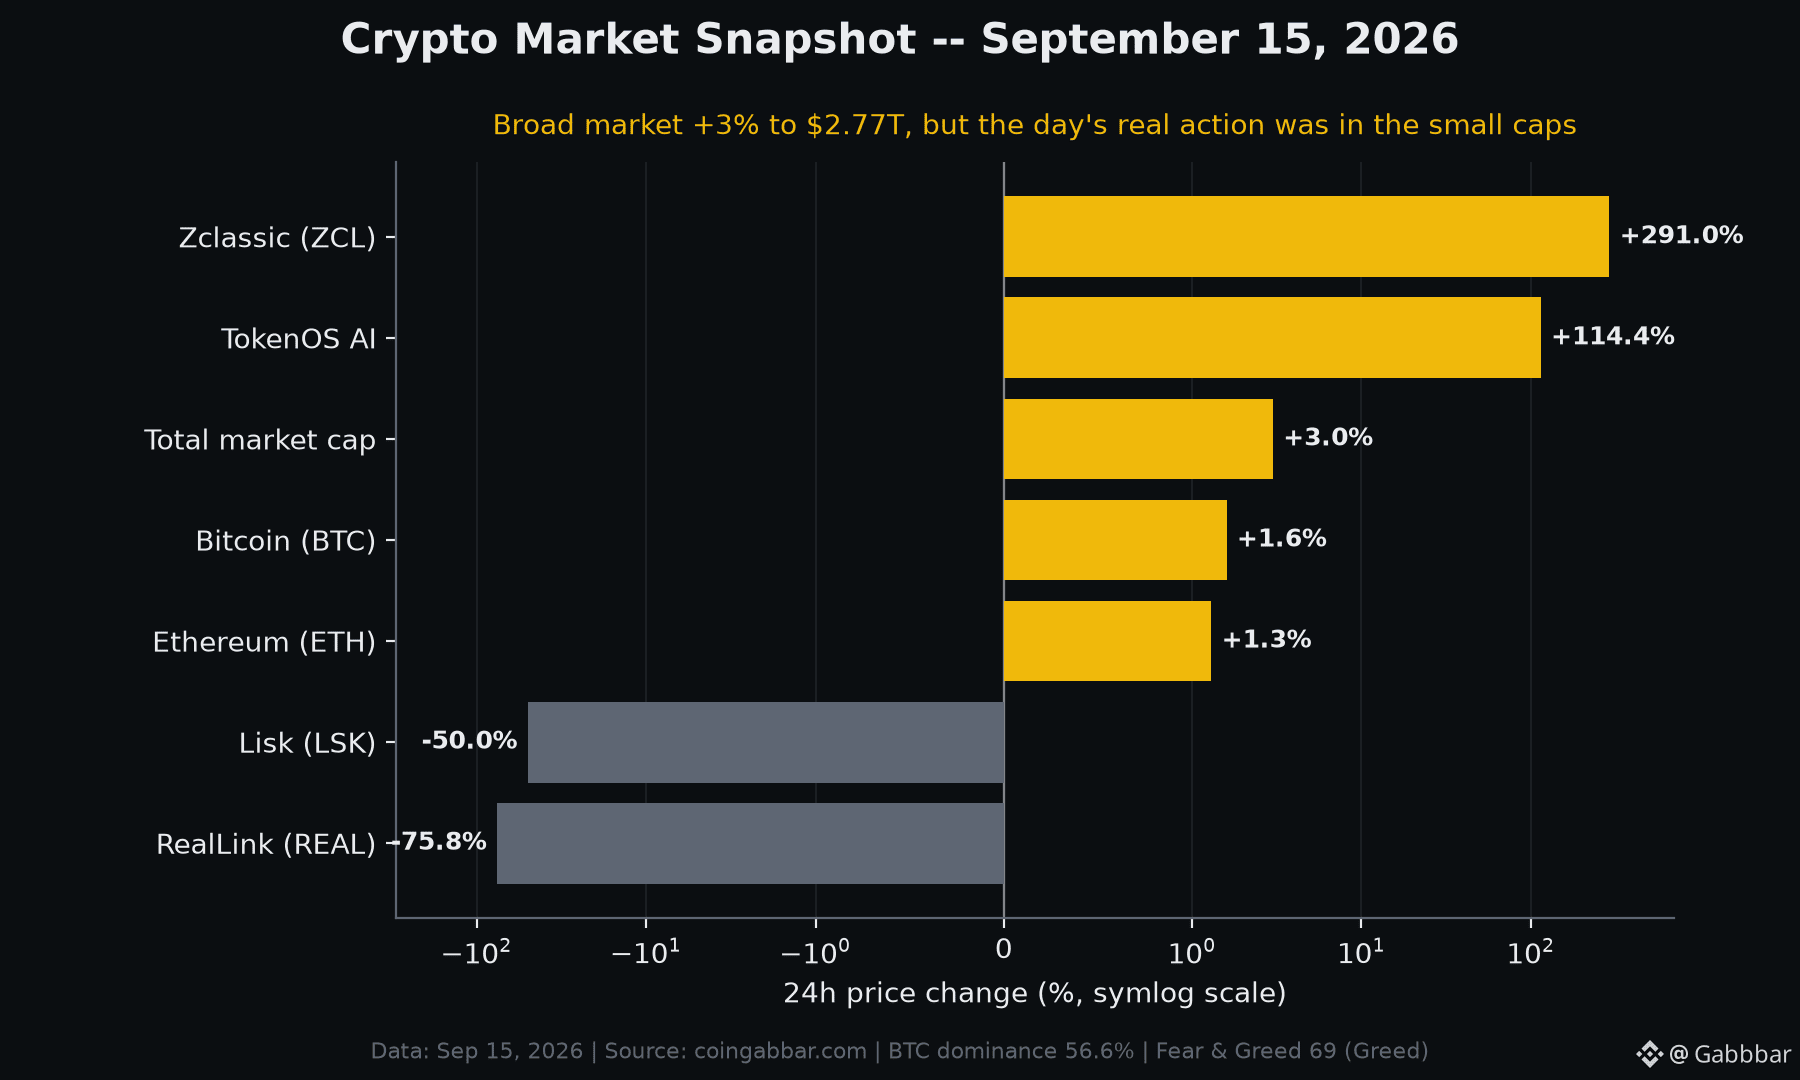
A green day at the index level can hide a 366-percentage-point spread underneath it. On September 15, 2026, the total crypto market cap rose about 3% to $2.77 trillion -- a calm, broadly positive session on the surface. But the day's real story was dispersion between the majors and the small caps.
The majors moved modestly:
- Total market cap: $2.77T (+3.0%)
- Bitcoin: $77,983.80 (+1.6%)
- Ethereum: $2,514.02 (+1.3%)
- 24h total volume: $91.8B
Structure of the market that day:
- BTC dominance: 56.6%
- ETH dominance: 11.1%
- Fear & Greed Index: 69 (Greed)
Now the tails. Among the notable movers on Sep 15, Zclassic (ZCL) reportedly jumped about +291% and TokenOS AI roughly +114%, while RealLink (REAL) fell about -75.8% and Lisk (LSK) around -50%. That is a spread of more than 366 percentage points between the biggest gainer and biggest loser in a single 24-hour window -- on a day the headline number was a quiet +3%.
This is a recurring pattern worth internalizing: a Greed reading and a rising total cap describe the average, not the distribution. Beneath a stable BTC-dominant market, low-liquidity small caps can still swing triple digits in either direction within hours.
When you read a market update, do you check the headline market-cap change, the Fear & Greed number, or the spread between the day's best and worst performers -- and which one actually tells you the most about risk?
#CryptoMarket #Bitcoin #Ethereum
A green day at the index level can hide a 366-percentage-point spread underneath it. On September 15, 2026, the total crypto market cap rose about 3% to $2.77 trillion -- a calm, broadly positive session on the surface. But the day's real story was dispersion between the majors and the small caps.
The majors moved modestly:
- Total market cap: $2.77T (+3.0%)
- Bitcoin: $77,983.80 (+1.6%)
- Ethereum: $2,514.02 (+1.3%)
- 24h total volume: $91.8B
Structure of the market that day:
- BTC dominance: 56.6%
- ETH dominance: 11.1%
- Fear & Greed Index: 69 (Greed)
Now the tails. Among the notable movers on Sep 15, Zclassic (ZCL) reportedly jumped about +291% and TokenOS AI roughly +114%, while RealLink (REAL) fell about -75.8% and Lisk (LSK) around -50%. That is a spread of more than 366 percentage points between the biggest gainer and biggest loser in a single 24-hour window -- on a day the headline number was a quiet +3%.
This is a recurring pattern worth internalizing: a Greed reading and a rising total cap describe the average, not the distribution. Beneath a stable BTC-dominant market, low-liquidity small caps can still swing triple digits in either direction within hours.
When you read a market update, do you check the headline market-cap change, the Fear & Greed number, or the spread between the day's best and worst performers -- and which one actually tells you the most about risk?
#CryptoMarket #Bitcoin #Ethereum
The majors moved modestly:
- Total market cap: $2.77T (+3.0%)
- Bitcoin: $77,983.80 (+1.6%)
- Ethereum: $2,514.02 (+1.3%)
- 24h total volume: $91.8B
Structure of the market that day:
- BTC dominance: 56.6%
- ETH dominance: 11.1%
- Fear & Greed Index: 69 (Greed)
Now the tails. Among the notable movers on Sep 15, Zclassic (ZCL) reportedly jumped about +291% and TokenOS AI roughly +114%, while RealLink (REAL) fell about -75.8% and Lisk (LSK) around -50%. That is a spread of more than 366 percentage points between the biggest gainer and biggest loser in a single 24-hour window -- on a day the headline number was a quiet +3%.
This is a recurring pattern worth internalizing: a Greed reading and a rising total cap describe the average, not the distribution. Beneath a stable BTC-dominant market, low-liquidity small caps can still swing triple digits in either direction within hours.
When you read a market update, do you check the headline market-cap change, the Fear & Greed number, or the spread between the day's best and worst performers -- and which one actually tells you the most about risk?
#CryptoMarket #Bitcoin #Ethereum
1
129
·
--
Tərcüməyə bax
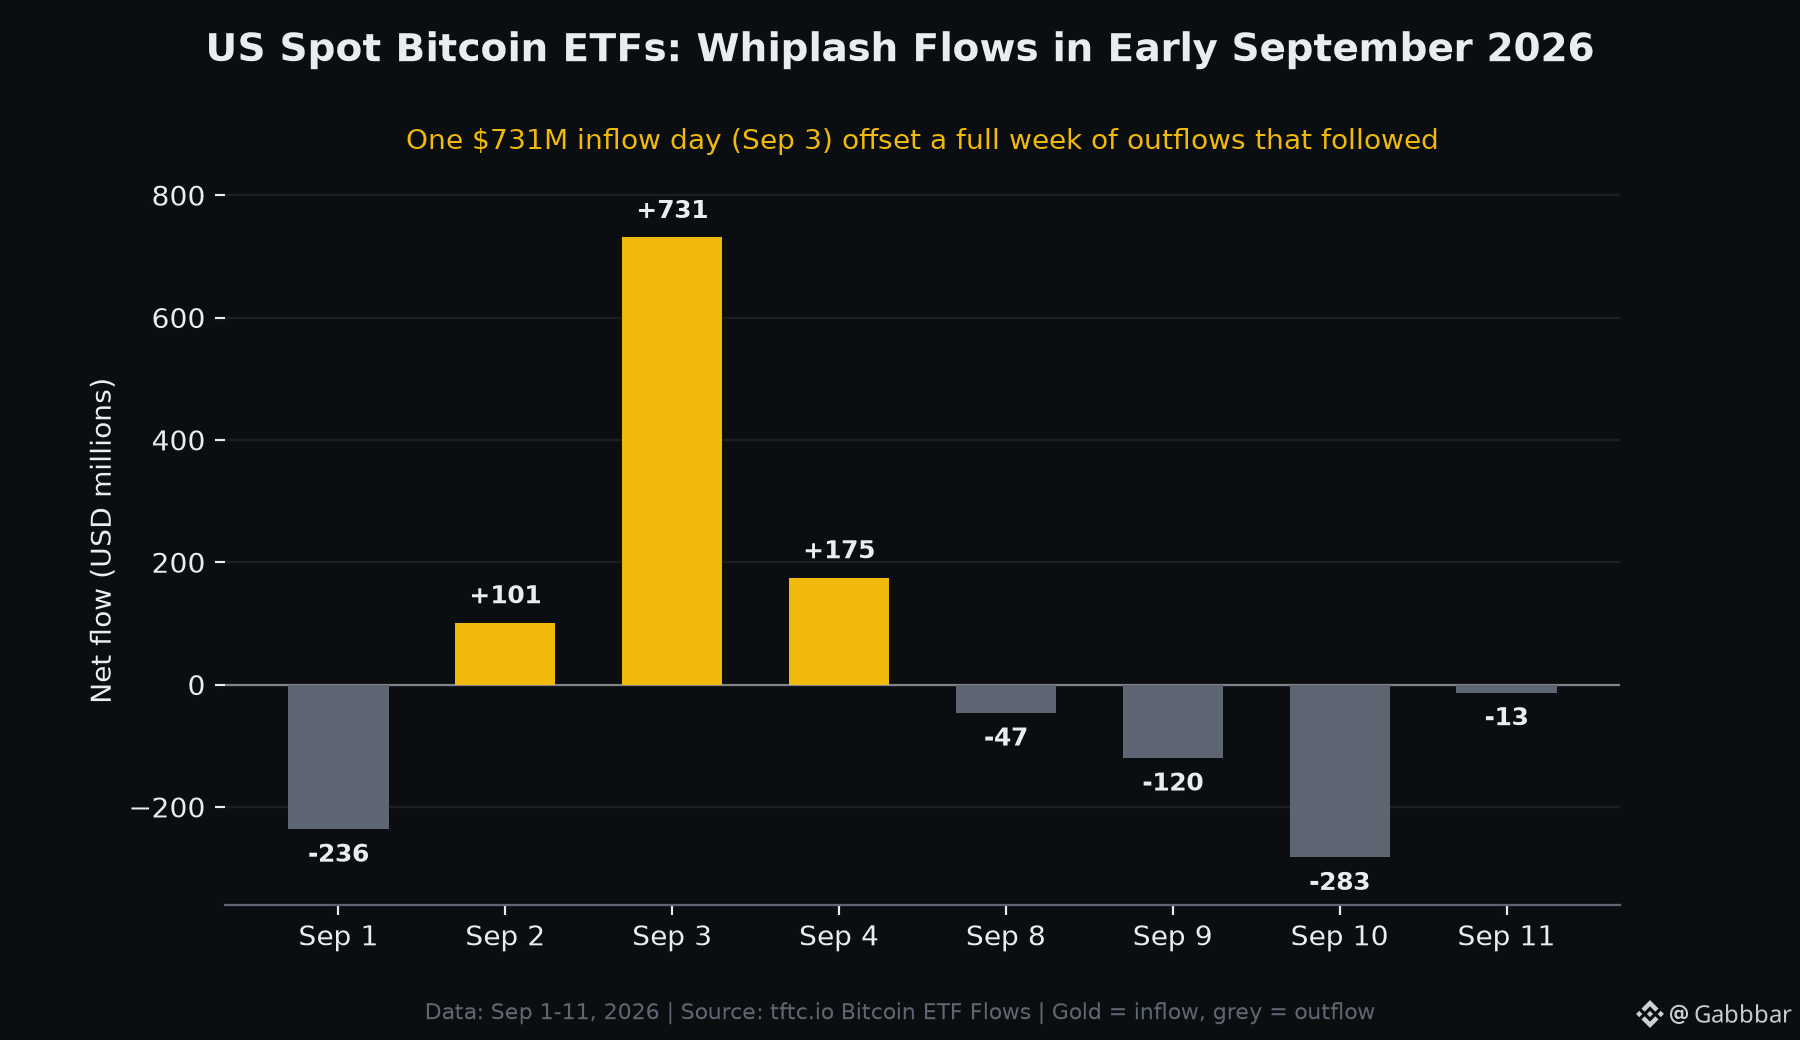
One record day did most of the work. On September 3, 2026, US spot Bitcoin ETFs pulled in $730.9 million in a single session -- their largest daily net inflow since January 2026. But zoom out to the eleven days around it and the picture is far messier than one green bar suggests.
Here is the full early-September sequence (net flows, USD):
- Sep 1: -$236.5M (outflow)
- Sep 2: +$101.1M
- Sep 3: +$730.9M
- Sep 4: +$174.6M
- Sep 8: -$46.6M
- Sep 9: -$120.2M
- Sep 10: -$282.6M
- Sep 11: -$13.3M
Add it up and the eight trading days net to roughly +$307M. In other words, the entire stretch was positive only because of that one Sep 3 spike -- every session that followed it saw money leave.
A concentration detail worth noting: on Sep 3, BlackRock's IBIT alone captured about $454M, more than 60% of all money entering the sector that day, with ARKB (~$138M) and FBTC (~$74M) taking most of the rest. Single-day totals are increasingly driven by one or two funds.
For context, combined US Bitcoin ETF net assets sat near $103.34 billion as of early September 2026 -- roughly 6.3% of Bitcoin's total market cap.
The takeaway isn't direction, it's dispersion: daily ETF flow headlines can swing from record inflow to week-long outflow within days. When you see a single-day flow number, what's the right window to judge institutional demand -- a day, a week, or a month?
#Bitcoin #BitcoinETF #CryptoNews
One record day did most of the work. On September 3, 2026, US spot Bitcoin ETFs pulled in $730.9 million in a single session -- their largest daily net inflow since January 2026. But zoom out to the eleven days around it and the picture is far messier than one green bar suggests.
Here is the full early-September sequence (net flows, USD):
- Sep 1: -$236.5M (outflow)
- Sep 2: +$101.1M
- Sep 3: +$730.9M
- Sep 4: +$174.6M
- Sep 8: -$46.6M
- Sep 9: -$120.2M
- Sep 10: -$282.6M
- Sep 11: -$13.3M
Add it up and the eight trading days net to roughly +$307M. In other words, the entire stretch was positive only because of that one Sep 3 spike -- every session that followed it saw money leave.
A concentration detail worth noting: on Sep 3, BlackRock's IBIT alone captured about $454M, more than 60% of all money entering the sector that day, with ARKB (~$138M) and FBTC (~$74M) taking most of the rest. Single-day totals are increasingly driven by one or two funds.
For context, combined US Bitcoin ETF net assets sat near $103.34 billion as of early September 2026 -- roughly 6.3% of Bitcoin's total market cap.
The takeaway isn't direction, it's dispersion: daily ETF flow headlines can swing from record inflow to week-long outflow within days. When you see a single-day flow number, what's the right window to judge institutional demand -- a day, a week, or a month?
#Bitcoin #BitcoinETF #CryptoNews
Here is the full early-September sequence (net flows, USD):
- Sep 1: -$236.5M (outflow)
- Sep 2: +$101.1M
- Sep 3: +$730.9M
- Sep 4: +$174.6M
- Sep 8: -$46.6M
- Sep 9: -$120.2M
- Sep 10: -$282.6M
- Sep 11: -$13.3M
Add it up and the eight trading days net to roughly +$307M. In other words, the entire stretch was positive only because of that one Sep 3 spike -- every session that followed it saw money leave.
A concentration detail worth noting: on Sep 3, BlackRock's IBIT alone captured about $454M, more than 60% of all money entering the sector that day, with ARKB (~$138M) and FBTC (~$74M) taking most of the rest. Single-day totals are increasingly driven by one or two funds.
For context, combined US Bitcoin ETF net assets sat near $103.34 billion as of early September 2026 -- roughly 6.3% of Bitcoin's total market cap.
The takeaway isn't direction, it's dispersion: daily ETF flow headlines can swing from record inflow to week-long outflow within days. When you see a single-day flow number, what's the right window to judge institutional demand -- a day, a week, or a month?
#Bitcoin #BitcoinETF #CryptoNews
59
·
--
Tərcüməyə bax
Bitcoin dominance is one of the most quoted numbers in crypto — and one of the least consistent.
Check three trackers right now and you might see 57%, 59%, and 60%. None of them is wrong. They're answering slightly different questions.
The formula is simple: BTC market cap ÷ total crypto market cap × 100.
The argument is over what goes in the denominator.
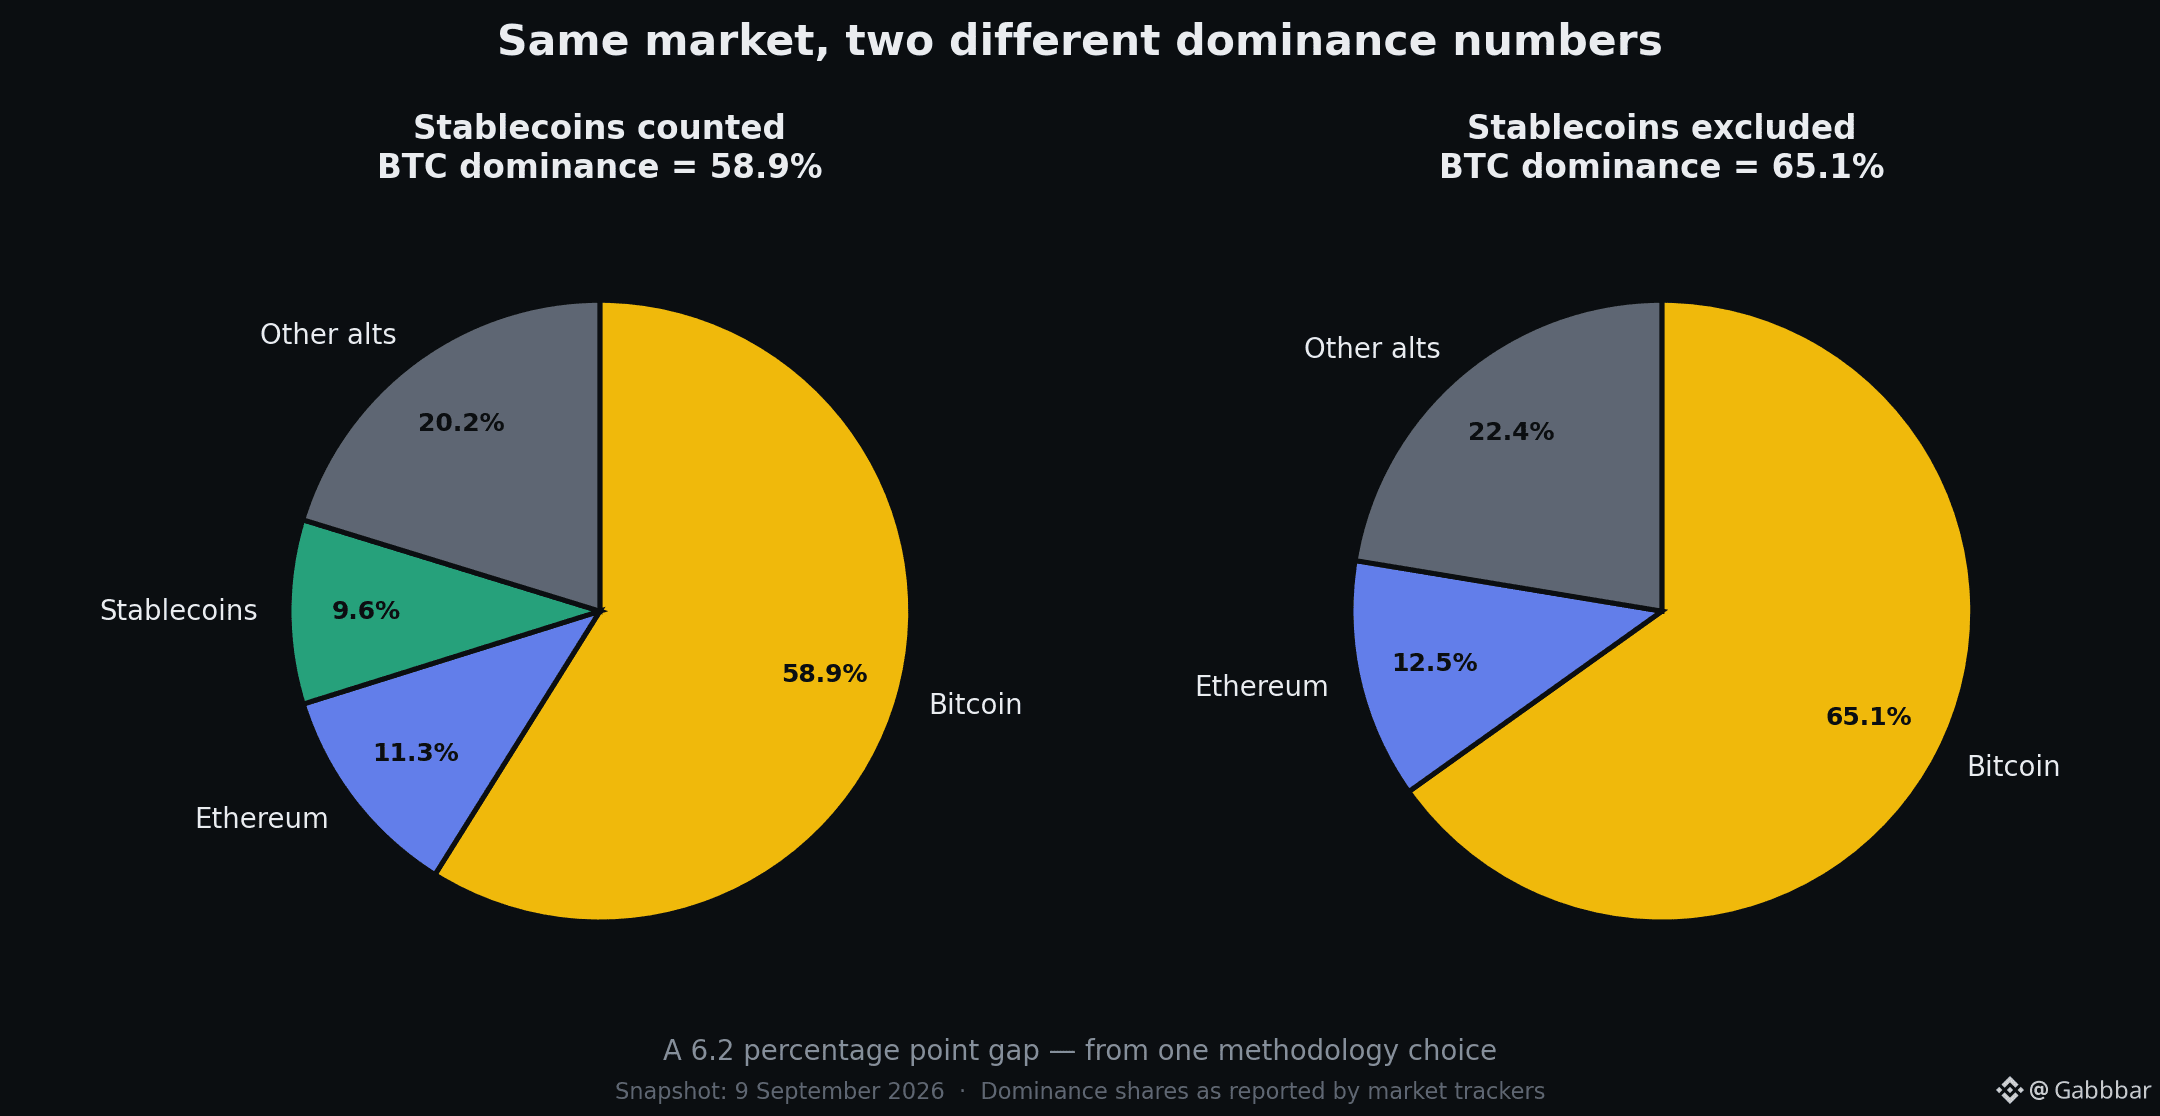
Stablecoins now sit near 10% of the total crypto market. Include them and BTC dominance reads ~58.9%. Exclude them and the same market reads ~65.1%.
Same day. Same market. A 6.2 point gap.
The case for excluding them: stablecoins aren't competing with Bitcoin for capital. They're parked cash — sideline money waiting to be deployed.
The case for including them: that parked cash is still capital sitting inside crypto, and where it sits tells you something about positioning.
One practical consequence worth knowing: BTC dominance can rise while Bitcoin falls, if altcoins are falling faster. Dominance measures share, not price.
So next time a dominance chart gets quoted at you, the useful question isn't "is this bullish" — it's "what's in the denominator?"
#Bitcoin #BTC #CryptoEducation
Bitcoin dominance is one of the most quoted numbers in crypto — and one of the least consistent.
Check three trackers right now and you might see 57%, 59%, and 60%. None of them is wrong. They're answering slightly different questions.
The formula is simple: BTC market cap ÷ total crypto market cap × 100.
The argument is over what goes in the denominator.
Stablecoins now sit near 10% of the total crypto market. Include them and BTC dominance reads ~58.9%. Exclude them and the same market reads ~65.1%.
Same day. Same market. A 6.2 point gap.
The case for excluding them: stablecoins aren't competing with Bitcoin for capital. They're parked cash — sideline money waiting to be deployed.
The case for including them: that parked cash is still capital sitting inside crypto, and where it sits tells you something about positioning.
One practical consequence worth knowing: BTC dominance can rise while Bitcoin falls, if altcoins are falling faster. Dominance measures share, not price.
So next time a dominance chart gets quoted at you, the useful question isn't "is this bullish" — it's "what's in the denominator?"
#Bitcoin #BTC #CryptoEducation
Check three trackers right now and you might see 57%, 59%, and 60%. None of them is wrong. They're answering slightly different questions.
The formula is simple: BTC market cap ÷ total crypto market cap × 100.
The argument is over what goes in the denominator.
Stablecoins now sit near 10% of the total crypto market. Include them and BTC dominance reads ~58.9%. Exclude them and the same market reads ~65.1%.
Same day. Same market. A 6.2 point gap.
The case for excluding them: stablecoins aren't competing with Bitcoin for capital. They're parked cash — sideline money waiting to be deployed.
The case for including them: that parked cash is still capital sitting inside crypto, and where it sits tells you something about positioning.
One practical consequence worth knowing: BTC dominance can rise while Bitcoin falls, if altcoins are falling faster. Dominance measures share, not price.
So next time a dominance chart gets quoted at you, the useful question isn't "is this bullish" — it's "what's in the denominator?"
#Bitcoin #BTC #CryptoEducation
135
Daha çox kontent araşdırmaq üçün daxil olun
Binance Square-də qlobal kriptovalyuta istifadəçilərinə qoşulun
⚡️ Kriptovalyuta haqqında ən son və faydalı məlumatları əldə edin.
💬 Dünyanın ən böyük kriptovalyuta birjası tərəfindən etibar edilir.
👍 Doğrulanmış yaradıcılardan gələn real məlumatları kəşf edin.
E-poçt/Telefon nömrəsi
Trenddə olan mövzular
BitcoinReboundsTo$79K
19,832 baxış
Müzakirə edir: 168
🚨 $BTC daha da yüksəlir.
Bitcoin təxminən $78,804 səviyyəsində ticarət edir, təxminən 1.9% yüksəlib. $78K zonasını geri qaytarandan sonra. Diqqət ediləcək növbəti səviyyə gün içi maksimumdur: təxminən $78,905.
Bu səviyyədən yuxarı təmiz qırılma $79K–$80K istiqamətində yol aça bilər. Əgər BTC geri atılsa, dəstək $78,300 ətrafında olacaq, sonra isə $77,975.
Boğalar impulsda olsa da, BTC $78K-dan yuxarıda qalmalıdır.
#Bitcoin #BTC #CryptoTrading #CryptoMarket #CryptoAnalysis
PulseON
·18 bəyənmə
·17k baxış
BitcoinSpotETFsNetInflow$160M
40 baxış
Müzakirə edir: 21
SouthKoreaCryptoTaxDelayPetitionTops50000
7,877 baxış
Müzakirə edir: 220