
DragonFlyOfficial
59 Paylaşımlar

DragonFlyOfficial
Şikayət et
İstifadəçini blokla
🚀 Crypto Trader | Content Creator | 6 Years Experience
Sharing analysis, altcoin research & trading strategies
Helping traders grow with real market insights
57 İzlənilir
24 İzləyicilər
64 Bəyəndi
Postlar
Tərcüməyə bax
AMDB GAINS 10.6%: IS THE AMD CONNECTION BEHIND TODAY’S MOVE? 📈
🔍 What Started the Story?
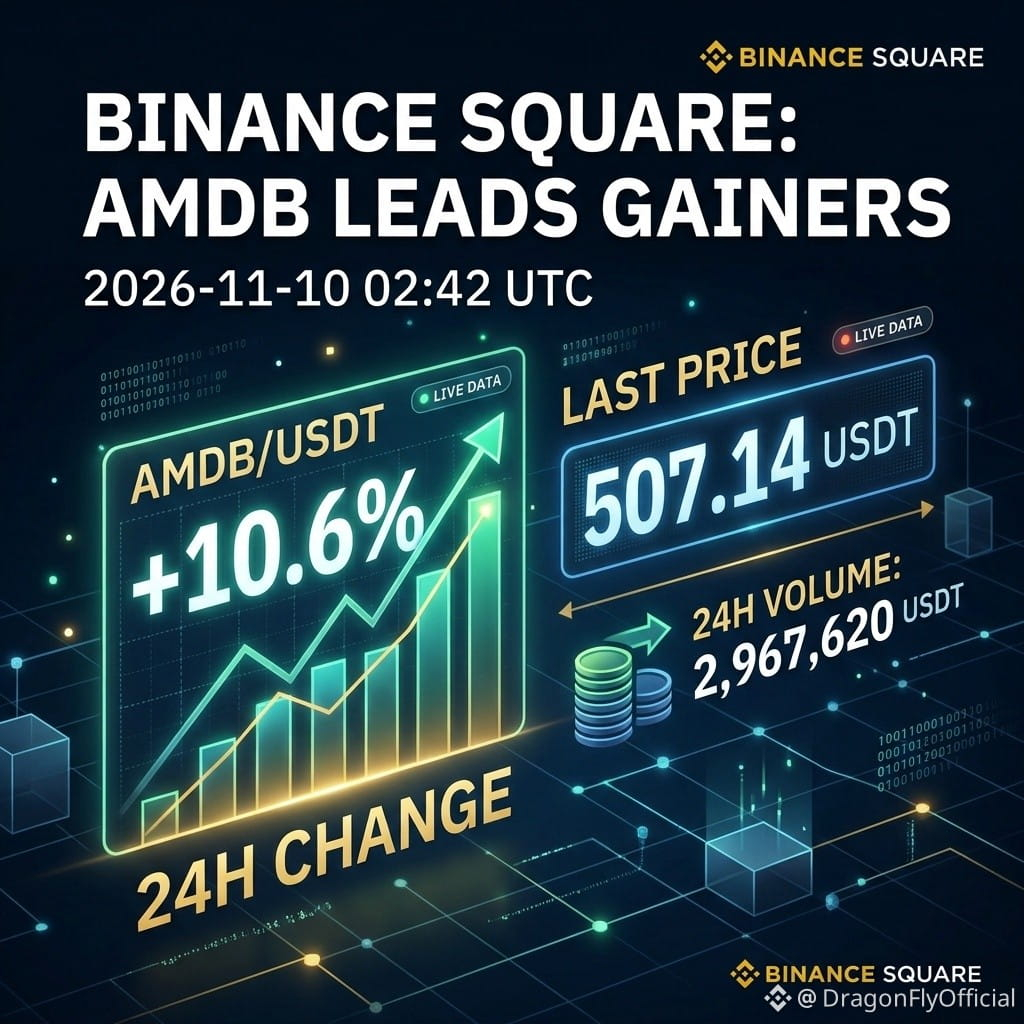
AMDB/USDT recorded a last price of 507.14 USDT, gaining 10.6% in 24 hours. Its trading volume reached approximately 2,967,620 USDT. That performance placed AMDB among today's top gainers on Binance Square.
At first glance, it looks like another strong crypto rally. But there is an important detail behind this asset.
💡 What Makes AMDB Different?
AMDB is a tokenized version of Advanced Micro Devices (AMD) bStocks. It provides economic exposure to AMD shares through a blockchain-based asset.
This creates an important connection between two markets: traditional stocks and digital assets.
The possible reasons behind today's rise include stronger demand for AMDB, changing expectations around AMD's business, or increased interest in tokenized stocks. However, the available data does not confirm one specific catalyst.
⚠️ Could the Rally Lose Strength?
A 10.6% increase is impressive, but one day's performance does not guarantee continued growth.
AMDB faces several risks:
Changes in AMD's underlying share value.
Sudden changes in buying and selling pressure.
Limited liquidity and possible price differences between markets.
Additional risks related to tokenized assets and their issuers.
📊 What Should Traders Watch Next?
The key question is whether trading activity can remain strong and whether $AMDB
{spot}(AMDBUSDT)
continues to follow its underlying asset. Volume near 2.97 million USDT shows meaningful activity, but it does not guarantee that buyers will remain in control.
The Dragonfly Official Takeaway
AMDB's 10.6% gain deserves attention, but smart traders look beyond the percentage. Keep positions small, use stop losses, and risk only what you can afford to lose. Crypto trading is risky, and this analysis is not financial advice.
#AMDB #AMD #CryptoMarket #TokenizedStocks #MarketAnalysis
AMDB GAINS 10.6%: IS THE AMD CONNECTION BEHIND TODAY’S MOVE? 📈
🔍 What Started the Story?
AMDB/USDT recorded a last price of 507.14 USDT, gaining 10.6% in 24 hours. Its trading volume reached approximately 2,967,620 USDT. That performance placed AMDB among today's top gainers on Binance Square.
At first glance, it looks like another strong crypto rally. But there is an important detail behind this asset.
💡 What Makes AMDB Different?
AMDB is a tokenized version of Advanced Micro Devices (AMD) bStocks. It provides economic exposure to AMD shares through a blockchain-based asset.
This creates an important connection between two markets: traditional stocks and digital assets.
The possible reasons behind today's rise include stronger demand for AMDB, changing expectations around AMD's business, or increased interest in tokenized stocks. However, the available data does not confirm one specific catalyst.
⚠️ Could the Rally Lose Strength?
A 10.6% increase is impressive, but one day's performance does not guarantee continued growth.
AMDB faces several risks:
Changes in AMD's underlying share value.
Sudden changes in buying and selling pressure.
Limited liquidity and possible price differences between markets.
Additional risks related to tokenized assets and their issuers.
📊 What Should Traders Watch Next?
The key question is whether trading activity can remain strong and whether $AMDB
continues to follow its underlying asset. Volume near 2.97 million USDT shows meaningful activity, but it does not guarantee that buyers will remain in control.
The Dragonfly Official Takeaway
AMDB's 10.6% gain deserves attention, but smart traders look beyond the percentage. Keep positions small, use stop losses, and risk only what you can afford to lose. Crypto trading is risky, and this analysis is not financial advice.
#AMDB #AMD #CryptoMarket #TokenizedStocks #MarketAnalysis
🔍 What Started the Story?
AMDB/USDT recorded a last price of 507.14 USDT, gaining 10.6% in 24 hours. Its trading volume reached approximately 2,967,620 USDT. That performance placed AMDB among today's top gainers on Binance Square.
At first glance, it looks like another strong crypto rally. But there is an important detail behind this asset.
💡 What Makes AMDB Different?
AMDB is a tokenized version of Advanced Micro Devices (AMD) bStocks. It provides economic exposure to AMD shares through a blockchain-based asset.
This creates an important connection between two markets: traditional stocks and digital assets.
The possible reasons behind today's rise include stronger demand for AMDB, changing expectations around AMD's business, or increased interest in tokenized stocks. However, the available data does not confirm one specific catalyst.
⚠️ Could the Rally Lose Strength?
A 10.6% increase is impressive, but one day's performance does not guarantee continued growth.
AMDB faces several risks:
Changes in AMD's underlying share value.
Sudden changes in buying and selling pressure.
Limited liquidity and possible price differences between markets.
Additional risks related to tokenized assets and their issuers.
📊 What Should Traders Watch Next?
The key question is whether trading activity can remain strong and whether $AMDB
continues to follow its underlying asset. Volume near 2.97 million USDT shows meaningful activity, but it does not guarantee that buyers will remain in control.
The Dragonfly Official Takeaway
AMDB's 10.6% gain deserves attention, but smart traders look beyond the percentage. Keep positions small, use stop losses, and risk only what you can afford to lose. Crypto trading is risky, and this analysis is not financial advice.
#AMDB #AMD #CryptoMarket #TokenizedStocks #MarketAnalysis
5
Tərcüməyə bax
$SIGN
{future}(SIGNUSDT)
RISES 9.4%: DOES EVERY PRICE JUMP MEAN STRONG BUYING?
📚 Myth vs Reality: Green Does Not Always Mean Growth
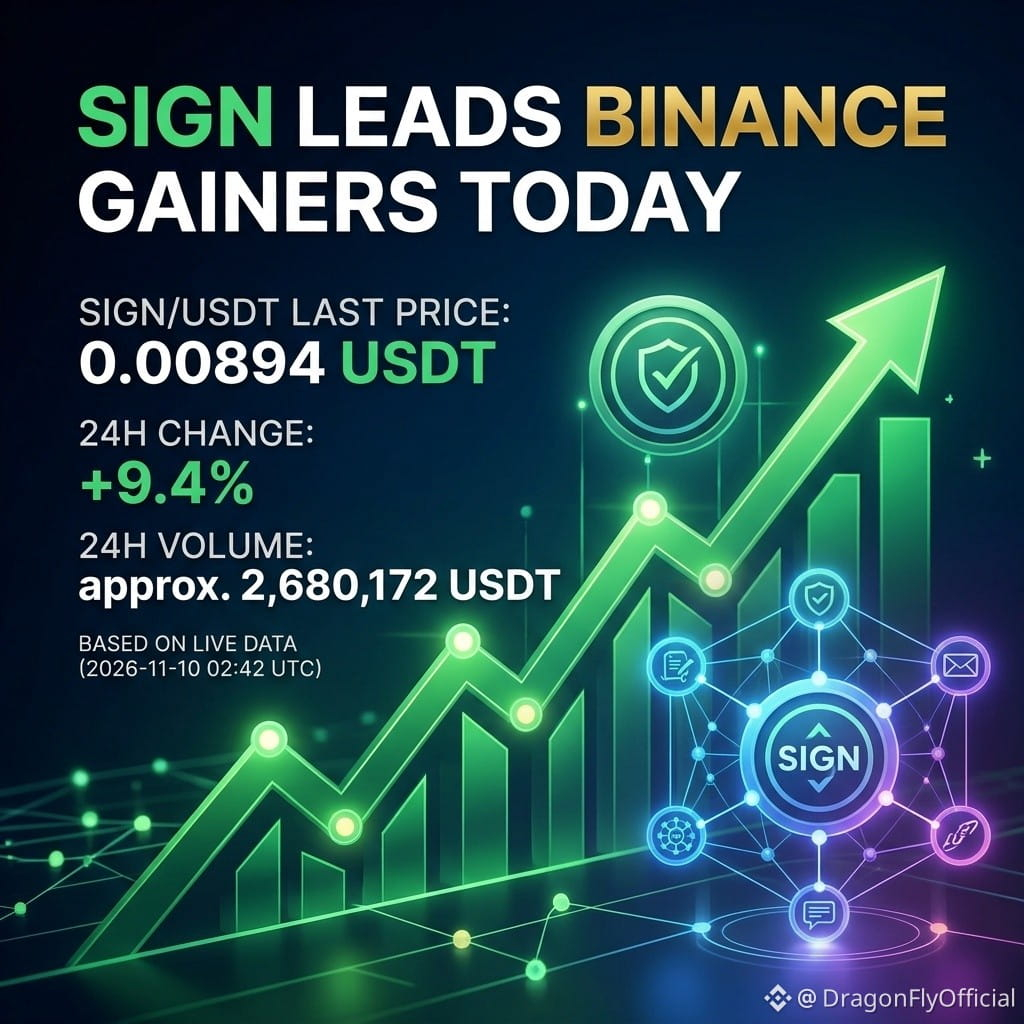
A common myth in crypto is that a coin rising nearly 10% must have strong long-term demand. That is not always true. SIGN/USDT has gained 9.4% in 24 hours, reaching $0.00894. But one positive day does not guarantee a lasting trend.
📈 The Pros: Buyers Are Showing Interest
SIGN recorded approximately $2.68 million in 24-hour trading volume. This shows meaningful trading activity alongside its price increase. Higher volume can indicate growing market attention, although it does not prove that buyers will remain active.
⚠️ The Cons: Momentum Can Reverse
A 9.4% gain can attract short-term traders looking for quick profits. If buying interest weakens or sellers begin taking profits, the price could lose momentum. High trading activity also means that market conditions can change quickly.
🔍 What Is Still Unknown?
The available figures do not confirm the exact reason behind this increase. Without verified evidence of a specific announcement, partnership, or project development driving the move, connecting the rally to a particular event would be speculation.
💡 Final Reminder
Keep positions small, use a stop loss, and risk only what you can afford to lose. Crypto trading involves risk, and this is not financial advice. Stay careful, question the hype, and always think independently.
#SIGN #CryptoMarke t #Altcoins #CryptoAnalysis #TradingRisk
$SIGN
RISES 9.4%: DOES EVERY PRICE JUMP MEAN STRONG BUYING?
📚 Myth vs Reality: Green Does Not Always Mean Growth
A common myth in crypto is that a coin rising nearly 10% must have strong long-term demand. That is not always true. SIGN/USDT has gained 9.4% in 24 hours, reaching $0.00894. But one positive day does not guarantee a lasting trend.
📈 The Pros: Buyers Are Showing Interest
SIGN recorded approximately $2.68 million in 24-hour trading volume. This shows meaningful trading activity alongside its price increase. Higher volume can indicate growing market attention, although it does not prove that buyers will remain active.
⚠️ The Cons: Momentum Can Reverse
A 9.4% gain can attract short-term traders looking for quick profits. If buying interest weakens or sellers begin taking profits, the price could lose momentum. High trading activity also means that market conditions can change quickly.
🔍 What Is Still Unknown?
The available figures do not confirm the exact reason behind this increase. Without verified evidence of a specific announcement, partnership, or project development driving the move, connecting the rally to a particular event would be speculation.
💡 Final Reminder
Keep positions small, use a stop loss, and risk only what you can afford to lose. Crypto trading involves risk, and this is not financial advice. Stay careful, question the hype, and always think independently.
#SIGN #CryptoMarke t #Altcoins #CryptoAnalysis #TradingRisk
RISES 9.4%: DOES EVERY PRICE JUMP MEAN STRONG BUYING?
📚 Myth vs Reality: Green Does Not Always Mean Growth
A common myth in crypto is that a coin rising nearly 10% must have strong long-term demand. That is not always true. SIGN/USDT has gained 9.4% in 24 hours, reaching $0.00894. But one positive day does not guarantee a lasting trend.
📈 The Pros: Buyers Are Showing Interest
SIGN recorded approximately $2.68 million in 24-hour trading volume. This shows meaningful trading activity alongside its price increase. Higher volume can indicate growing market attention, although it does not prove that buyers will remain active.
⚠️ The Cons: Momentum Can Reverse
A 9.4% gain can attract short-term traders looking for quick profits. If buying interest weakens or sellers begin taking profits, the price could lose momentum. High trading activity also means that market conditions can change quickly.
🔍 What Is Still Unknown?
The available figures do not confirm the exact reason behind this increase. Without verified evidence of a specific announcement, partnership, or project development driving the move, connecting the rally to a particular event would be speculation.
💡 Final Reminder
Keep positions small, use a stop loss, and risk only what you can afford to lose. Crypto trading involves risk, and this is not financial advice. Stay careful, question the hype, and always think independently.
#SIGN #CryptoMarke t #Altcoins #CryptoAnalysis #TradingRisk
38
Tərcüməyə bax
BEB RISES 9.3%: THE SURPRISE BEHIND TODAY’S MARKET MOVE
📈 A Strong Start
$BEB
{spot}(BEBUSDT)
has moved into the spotlight with a 9.3% gain in the last 24 hours. Its BEB/USDT price reached 194.89, while trading volume climbed to approximately 1,965,139 USDT as of November 10, 2026, at 02:42 UTC.
📊 The Interesting Twist
The move looks encouraging, but a green price chart does not tell the whole story. Volume shows how much value has been traded, while price change shows how the market has moved. Together, these figures show meaningful trading activity alongside a positive price move.
🔍 What Could Be Behind It?
Possible factors include increased buyer interest, short-term speculation, fresh market attention, or changing trader expectations. However, the available data does not confirm which factor caused BEB to rise. It would be misleading to present any single explanation as fact.
💡 The Lesson for Traders
Dragonfly Official encourages readers to look beyond the percentage gain. Watch whether trading activity remains strong, whether the price can maintain its progress, and whether new market information supports the move. No verified entry, stop-loss, or profit target is available from the supplied figures, so avoid treating this gain as a trading signal.
Keep positions small, use a suitable stop loss, and risk only what you can afford to lose. Crypto trading is risky, and this is not financial advice.
What to Watch Next: Can BEB maintain its momentum, or will profit-taking change the story?
#BEB
#CryptoMarket #MarketAnalysis #Altcoins #CryptoTrading
BEB RISES 9.3%: THE SURPRISE BEHIND TODAY’S MARKET MOVE
📈 A Strong Start
$BEB
has moved into the spotlight with a 9.3% gain in the last 24 hours. Its BEB/USDT price reached 194.89, while trading volume climbed to approximately 1,965,139 USDT as of November 10, 2026, at 02:42 UTC.
📊 The Interesting Twist
The move looks encouraging, but a green price chart does not tell the whole story. Volume shows how much value has been traded, while price change shows how the market has moved. Together, these figures show meaningful trading activity alongside a positive price move.
🔍 What Could Be Behind It?
Possible factors include increased buyer interest, short-term speculation, fresh market attention, or changing trader expectations. However, the available data does not confirm which factor caused BEB to rise. It would be misleading to present any single explanation as fact.
💡 The Lesson for Traders
Dragonfly Official encourages readers to look beyond the percentage gain. Watch whether trading activity remains strong, whether the price can maintain its progress, and whether new market information supports the move. No verified entry, stop-loss, or profit target is available from the supplied figures, so avoid treating this gain as a trading signal.
Keep positions small, use a suitable stop loss, and risk only what you can afford to lose. Crypto trading is risky, and this is not financial advice.
What to Watch Next: Can BEB maintain its momentum, or will profit-taking change the story?
#BEB
#CryptoMarket #MarketAnalysis #Altcoins #CryptoTrading
📈 A Strong Start
$BEB
has moved into the spotlight with a 9.3% gain in the last 24 hours. Its BEB/USDT price reached 194.89, while trading volume climbed to approximately 1,965,139 USDT as of November 10, 2026, at 02:42 UTC.
📊 The Interesting Twist
The move looks encouraging, but a green price chart does not tell the whole story. Volume shows how much value has been traded, while price change shows how the market has moved. Together, these figures show meaningful trading activity alongside a positive price move.
🔍 What Could Be Behind It?
Possible factors include increased buyer interest, short-term speculation, fresh market attention, or changing trader expectations. However, the available data does not confirm which factor caused BEB to rise. It would be misleading to present any single explanation as fact.
💡 The Lesson for Traders
Dragonfly Official encourages readers to look beyond the percentage gain. Watch whether trading activity remains strong, whether the price can maintain its progress, and whether new market information supports the move. No verified entry, stop-loss, or profit target is available from the supplied figures, so avoid treating this gain as a trading signal.
Keep positions small, use a suitable stop loss, and risk only what you can afford to lose. Crypto trading is risky, and this is not financial advice.
What to Watch Next: Can BEB maintain its momentum, or will profit-taking change the story?
#BEB
#CryptoMarket #MarketAnalysis #Altcoins #CryptoTrading
Tərcüməyə bax
GRAM GAINS 9.4%: THE BIGGEST MYTH ABOUT A GREEN MARKET MOVE
📊 Myth: A 9.4% Gain Means Strong Market Confidence
Fact: GRAM/USDT is trading at 1.105, up 9.4% over 24 hours, with approximately 12.24 million USDT in trading volume. That is a notable move, but a green percentage alone does not prove that buyers are confident or that the rally will continue.
🔍 Myth: High Volume Guarantees Further Growth
Fact: Trading volume shows how much value has changed hands. GRAM's reported 24-hour volume indicates considerable trading activity. However, volume alone cannot reveal whether buyers or sellers are controlling the market. Rising prices and high volume deserve attention, but they are not guaranteed signs of lasting strength.
💡 What Could Be Behind the Move?
Increased market interest, short-term speculation, fresh demand or broader crypto market sentiment could contribute to the rise. However, there is not enough verified information to identify one specific reason behind GRAM's performance. Treat these as possibilities, not confirmed explanations.
Final Takeaway
Keep positions small, use a stop loss and risk only what you can afford to lose. Crypto trading is risky, and this is not financial advice. A strong market move deserves attention, not blind trust.
This might also interest you.
Easy MCP AI
Ad
Ad options
Publish from your chat
Draft and publish WordPress posts with AI.
Learn more
Learn about ads and personalization
GRAM GAINS 9.4%: THE BIGGEST MYTH ABOUT A GREEN MARKET MOVE
📊 Myth: A 9.4% Gain Means Strong Market Confidence
Fact: GRAM/USDT is trading at 1.105, up 9.4% over 24 hours, with approximately 12.24 million USDT in trading volume. That is a notable move, but a green percentage alone does not prove that buyers are confident or that the rally will continue.
🔍 Myth: High Volume Guarantees Further Growth
Fact: Trading volume shows how much value has changed hands. GRAM's reported 24-hour volume indicates considerable trading activity. However, volume alone cannot reveal whether buyers or sellers are controlling the market. Rising prices and high volume deserve attention, but they are not guaranteed signs of lasting strength.
💡 What Could Be Behind the Move?
Increased market interest, short-term speculation, fresh demand or broader crypto market sentiment could contribute to the rise. However, there is not enough verified information to identify one specific reason behind GRAM's performance. Treat these as possibilities, not confirmed explanations.
Final Takeaway
Keep positions small, use a stop loss and risk only what you can afford to lose. Crypto trading is risky, and this is not financial advice. A strong market move deserves attention, not blind trust.
This might also interest you.
Easy MCP AI
Ad
Ad options
Publish from your chat
Draft and publish WordPress posts with AI.
Learn more
Learn about ads and personalization
📊 Myth: A 9.4% Gain Means Strong Market Confidence
Fact: GRAM/USDT is trading at 1.105, up 9.4% over 24 hours, with approximately 12.24 million USDT in trading volume. That is a notable move, but a green percentage alone does not prove that buyers are confident or that the rally will continue.
🔍 Myth: High Volume Guarantees Further Growth
Fact: Trading volume shows how much value has changed hands. GRAM's reported 24-hour volume indicates considerable trading activity. However, volume alone cannot reveal whether buyers or sellers are controlling the market. Rising prices and high volume deserve attention, but they are not guaranteed signs of lasting strength.
💡 What Could Be Behind the Move?
Increased market interest, short-term speculation, fresh demand or broader crypto market sentiment could contribute to the rise. However, there is not enough verified information to identify one specific reason behind GRAM's performance. Treat these as possibilities, not confirmed explanations.
Final Takeaway
Keep positions small, use a stop loss and risk only what you can afford to lose. Crypto trading is risky, and this is not financial advice. A strong market move deserves attention, not blind trust.
This might also interest you.
Easy MCP AI
Ad
Ad options
Publish from your chat
Draft and publish WordPress posts with AI.
Learn more
Learn about ads and personalization
155
Tərcüməyə bax
LITEB GAINS 10.7%: WHAT CHANGED, AND CAN THE MOMENTUM LAST?
📊 Before vs Now
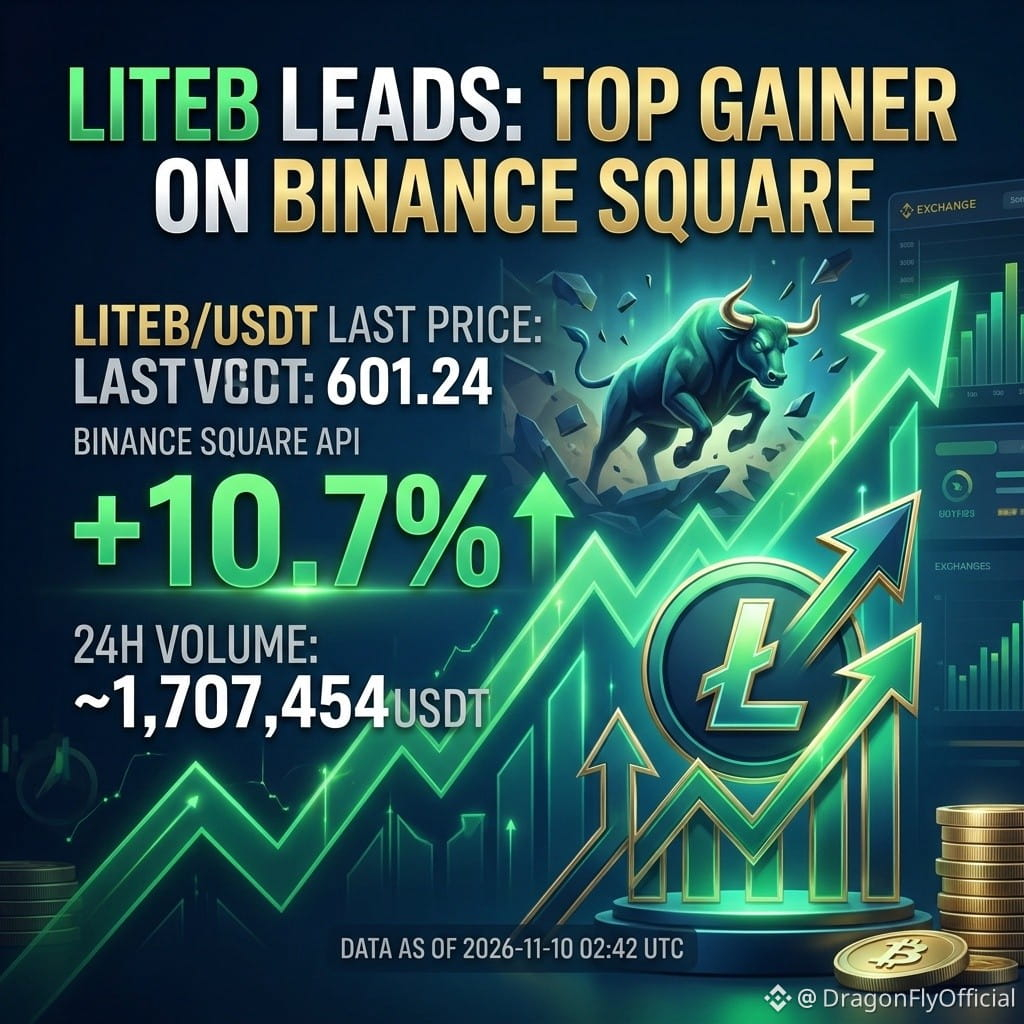
LITEB is attracting attention after a noticeable price increase. Its latest reported 24-hour performance shows a 10.7% gain, with LITEB/USDT trading at 601.24. Its 24-hour trading volume is approximately 1,707,454 USDT. This puts LITEB among today's notable gainers.
📈 The Pros
The strongest positive sign is the combination of price growth and substantial trading activity. A 10.7% increase shows that buyers have been active, while the reported volume indicates meaningful market participation.
Higher volume can make a price move more interesting because it shows that trading activity is taking place alongside the increase. However, it does not guarantee that the rally will continue.
⚠️ The Cons
A rising price does not always mean a strong long-term trend. Some increases happen because of short-term speculation, sudden buying pressure, or limited market liquidity.
There is also insufficient verified information here to identify a specific announcement, partnership, or project development behind LITEB's move. Investors should avoid assuming a positive news event caused the gain.
💡 Final Reminder
Dragonfly Official encourages independent research. Keep positions small, use appropriate stop losses, and never risk money you cannot afford to lose. Crypto trading is risky, and this is not financial advice.
Stay careful, question the hype, and always think independently.
#LITEB #CryptoMarke t #TopGainers #CryptoAnalys #RiskManagement
LITEB GAINS 10.7%: WHAT CHANGED, AND CAN THE MOMENTUM LAST?
📊 Before vs Now
LITEB is attracting attention after a noticeable price increase. Its latest reported 24-hour performance shows a 10.7% gain, with LITEB/USDT trading at 601.24. Its 24-hour trading volume is approximately 1,707,454 USDT. This puts LITEB among today's notable gainers.
📈 The Pros
The strongest positive sign is the combination of price growth and substantial trading activity. A 10.7% increase shows that buyers have been active, while the reported volume indicates meaningful market participation.
Higher volume can make a price move more interesting because it shows that trading activity is taking place alongside the increase. However, it does not guarantee that the rally will continue.
⚠️ The Cons
A rising price does not always mean a strong long-term trend. Some increases happen because of short-term speculation, sudden buying pressure, or limited market liquidity.
There is also insufficient verified information here to identify a specific announcement, partnership, or project development behind LITEB's move. Investors should avoid assuming a positive news event caused the gain.
💡 Final Reminder
Dragonfly Official encourages independent research. Keep positions small, use appropriate stop losses, and never risk money you cannot afford to lose. Crypto trading is risky, and this is not financial advice.
Stay careful, question the hype, and always think independently.
#LITEB #CryptoMarke t #TopGainers #CryptoAnalys #RiskManagement
📊 Before vs Now
LITEB is attracting attention after a noticeable price increase. Its latest reported 24-hour performance shows a 10.7% gain, with LITEB/USDT trading at 601.24. Its 24-hour trading volume is approximately 1,707,454 USDT. This puts LITEB among today's notable gainers.
📈 The Pros
The strongest positive sign is the combination of price growth and substantial trading activity. A 10.7% increase shows that buyers have been active, while the reported volume indicates meaningful market participation.
Higher volume can make a price move more interesting because it shows that trading activity is taking place alongside the increase. However, it does not guarantee that the rally will continue.
⚠️ The Cons
A rising price does not always mean a strong long-term trend. Some increases happen because of short-term speculation, sudden buying pressure, or limited market liquidity.
There is also insufficient verified information here to identify a specific announcement, partnership, or project development behind LITEB's move. Investors should avoid assuming a positive news event caused the gain.
💡 Final Reminder
Dragonfly Official encourages independent research. Keep positions small, use appropriate stop losses, and never risk money you cannot afford to lose. Crypto trading is risky, and this is not financial advice.
Stay careful, question the hype, and always think independently.
#LITEB #CryptoMarke t #TopGainers #CryptoAnalys #RiskManagement
5
Tərcüməyə bax
BEAMX CLIMBS 10.8%: IS GAMING SECTOR INTEREST RETURNING?
🎮 Start With the Basics
Imagine checking your crypto portfolio and finding BEAMX among the day's strongest performers. The token has attracted fresh market attention, but is this the beginning of stronger momentum or simply a short-term price move?
BEAMX is associated with Beam, a blockchain ecosystem focused on Web3 gaming. Its goal is to support gaming applications, digital assets, and blockchain-based experiences.
📊 The Numbers Behind the Move
As of November 10, 2026, at 02:42 UTC, BEAMX/USDT recorded:
💡 A Beginner's Trading Guide
Before considering a position, check whether trading activity remains strong, monitor broader crypto market conditions, and look for sustained price strength rather than reacting to one daily percentage change.
There is no verified entry price, stop-loss level, or take-profit target established by the available data. Avoid guessing these levels or chasing a sudden rally.
⚠️ The Risks Still Matter
A 10.8% gain does not guarantee another upward move. Profit-taking, changing sentiment, and sudden selling pressure can reverse gains quickly.
Keep positions small, use a suitable stop loss, and risk only what you can afford to lose. Crypto trading is risky, and this is not financial advice.
Dragonfly Official Takeaway: BEAMX has delivered an impressive daily gain, but sustainable strength matters more than a single green candle.
Do you think BEAMX can maintain its momentum?
#BEAMX #beams #CryptoMarke t #altcoinscrash #CryptoTrading
BEAMX CLIMBS 10.8%: IS GAMING SECTOR INTEREST RETURNING?
🎮 Start With the Basics
Imagine checking your crypto portfolio and finding BEAMX among the day's strongest performers. The token has attracted fresh market attention, but is this the beginning of stronger momentum or simply a short-term price move?
BEAMX is associated with Beam, a blockchain ecosystem focused on Web3 gaming. Its goal is to support gaming applications, digital assets, and blockchain-based experiences.
📊 The Numbers Behind the Move
As of November 10, 2026, at 02:42 UTC, BEAMX/USDT recorded:
💡 A Beginner's Trading Guide
Before considering a position, check whether trading activity remains strong, monitor broader crypto market conditions, and look for sustained price strength rather than reacting to one daily percentage change.
There is no verified entry price, stop-loss level, or take-profit target established by the available data. Avoid guessing these levels or chasing a sudden rally.
⚠️ The Risks Still Matter
A 10.8% gain does not guarantee another upward move. Profit-taking, changing sentiment, and sudden selling pressure can reverse gains quickly.
Keep positions small, use a suitable stop loss, and risk only what you can afford to lose. Crypto trading is risky, and this is not financial advice.
Dragonfly Official Takeaway: BEAMX has delivered an impressive daily gain, but sustainable strength matters more than a single green candle.
Do you think BEAMX can maintain its momentum?
#BEAMX #beams #CryptoMarke t #altcoinscrash #CryptoTrading
🎮 Start With the Basics
Imagine checking your crypto portfolio and finding BEAMX among the day's strongest performers. The token has attracted fresh market attention, but is this the beginning of stronger momentum or simply a short-term price move?
BEAMX is associated with Beam, a blockchain ecosystem focused on Web3 gaming. Its goal is to support gaming applications, digital assets, and blockchain-based experiences.
📊 The Numbers Behind the Move
As of November 10, 2026, at 02:42 UTC, BEAMX/USDT recorded:
💡 A Beginner's Trading Guide
Before considering a position, check whether trading activity remains strong, monitor broader crypto market conditions, and look for sustained price strength rather than reacting to one daily percentage change.
There is no verified entry price, stop-loss level, or take-profit target established by the available data. Avoid guessing these levels or chasing a sudden rally.
⚠️ The Risks Still Matter
A 10.8% gain does not guarantee another upward move. Profit-taking, changing sentiment, and sudden selling pressure can reverse gains quickly.
Keep positions small, use a suitable stop loss, and risk only what you can afford to lose. Crypto trading is risky, and this is not financial advice.
Dragonfly Official Takeaway: BEAMX has delivered an impressive daily gain, but sustainable strength matters more than a single green candle.
Do you think BEAMX can maintain its momentum?
#BEAMX #beams #CryptoMarke t #altcoinscrash #CryptoTrading
97
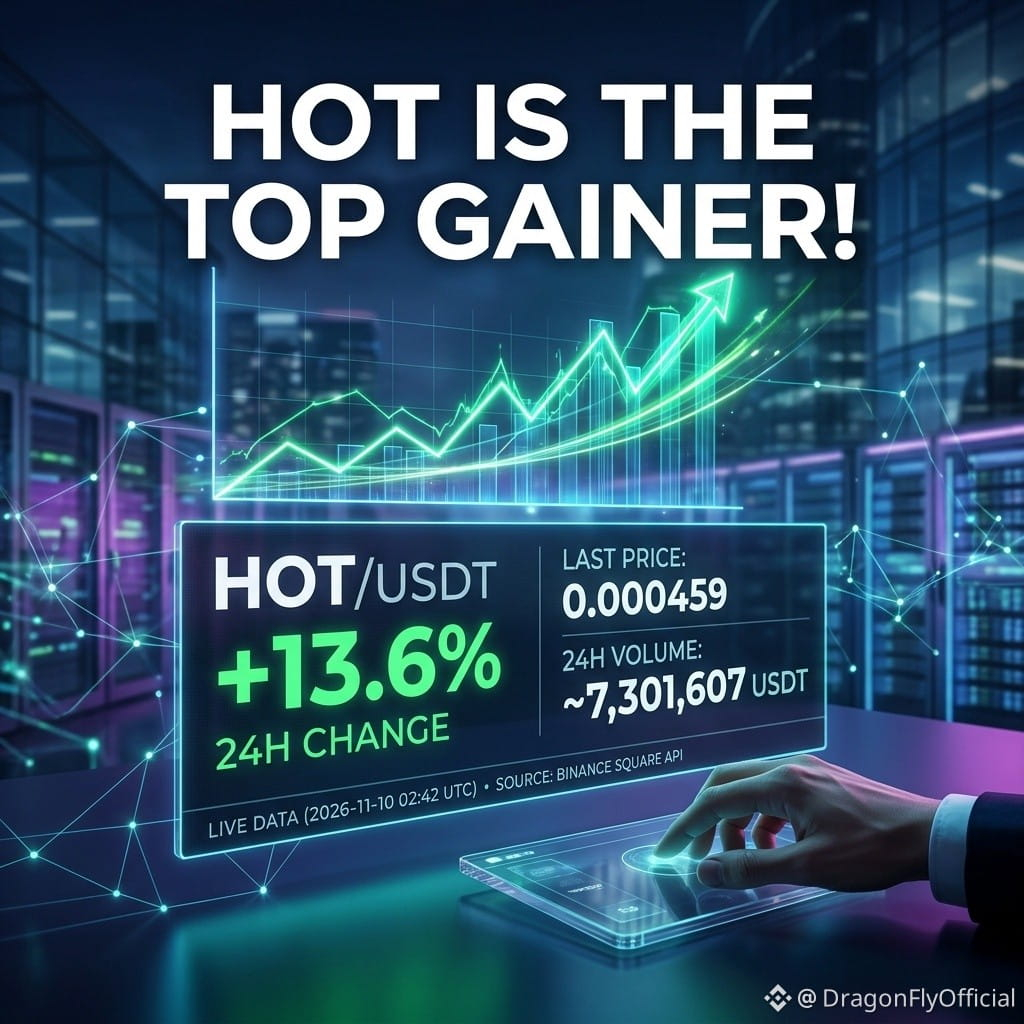
HOT 13,6% ARTDI: YÜKSƏLİŞİ NƏ DƏSTƏKLƏYİR VƏ NƏLƏR PİS GEDƏ BİLƏR?
🔍 Balanslaşdırılmış baxış: momentum təsdiq tələb edir
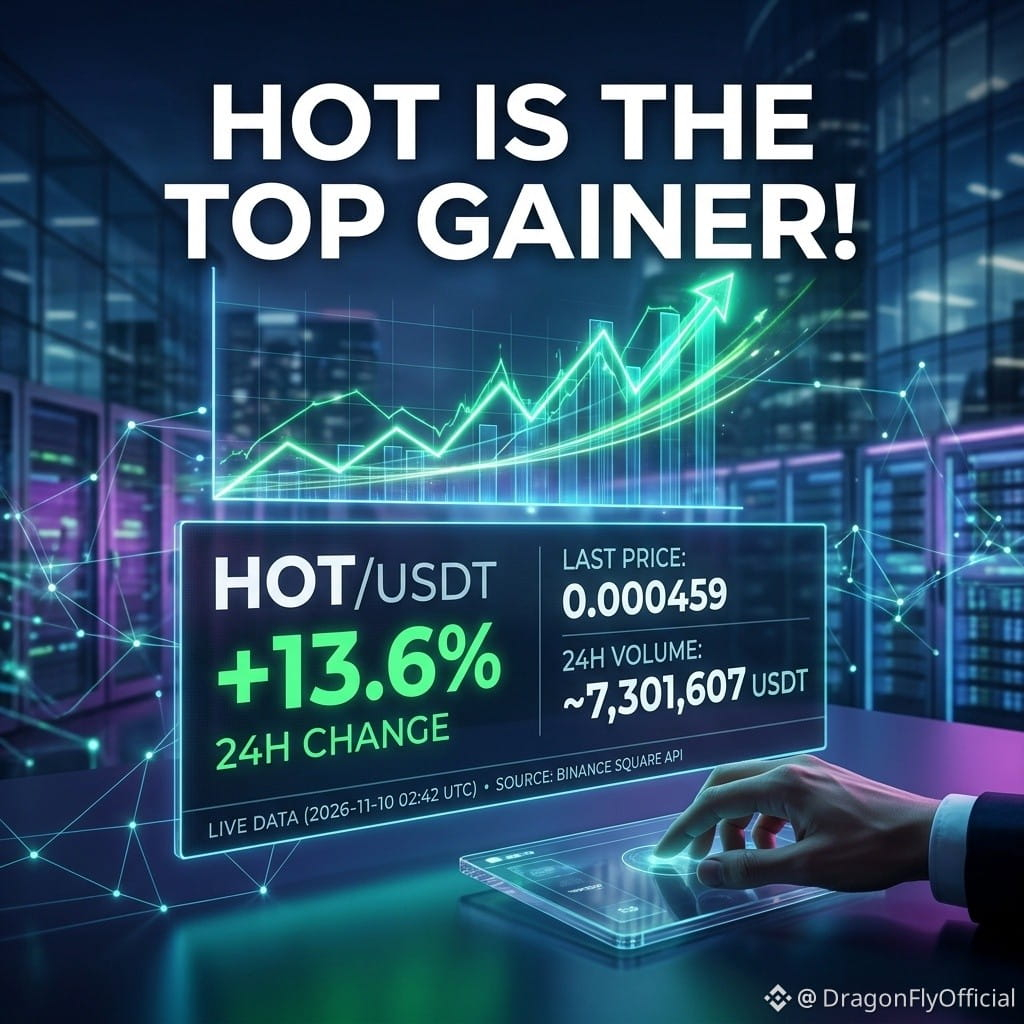
HOT-un 13,6% artımı qısamüddətli müsbət momentum nümayiş etdirir, lakin bir günlük göstərici uzunmüddətli bərpanın baş verdiyini təsdiqləmir. Treyderlər bazar şəraitini və öz risk limitlərini yoxlamadan qəfil artımların ardınca qaçmamalıdırlar.
💡 Növbəti mərhələdə nələri izləməli
Ticarət həcminin yüksək səviyyədə qalıb-qalmadığını, alıcıların marağını qoruyub-qorumadığını və HOT-un momentumunu davam etdirə bilib-bilmədiyini izləyin.
Dragonfly Official oxuculara xatırladır ki, kriptovalyuta ticarəti risklidir. Mövqelərin həcmini kiçik saxlayın, uyğun olduqda stop-loss əmri istifadə edin və yalnız itirməyə imkanınız olan məbləği riskə atın. Bu, maliyyə məsləhəti deyil.
$HOT
HOT 13,6% ARTDI: YÜKSƏLİŞİ NƏ DƏSTƏKLƏYİR VƏ NƏLƏR PİS GEDƏ BİLƏR?
🔍 Balanslaşdırılmış baxış: momentum təsdiq tələb edir
HOT-un 13,6% artımı qısamüddətli müsbət momentum nümayiş etdirir, lakin bir günlük göstərici uzunmüddətli bərpanın baş verdiyini təsdiqləmir. Treyderlər bazar şəraitini və öz risk limitlərini yoxlamadan qəfil artımların ardınca qaçmamalıdırlar.
💡 Növbəti mərhələdə nələri izləməli
Ticarət həcminin yüksək səviyyədə qalıb-qalmadığını, alıcıların marağını qoruyub-qorumadığını və HOT-un momentumunu davam etdirə bilib-bilmədiyini izləyin.
Dragonfly Official oxuculara xatırladır ki, kriptovalyuta ticarəti risklidir. Mövqelərin həcmini kiçik saxlayın, uyğun olduqda stop-loss əmri istifadə edin və yalnız itirməyə imkanınız olan məbləği riskə atın. Bu, maliyyə məsləhəti deyil.
$HOT
🔍 Balanslaşdırılmış baxış: momentum təsdiq tələb edir
HOT-un 13,6% artımı qısamüddətli müsbət momentum nümayiş etdirir, lakin bir günlük göstərici uzunmüddətli bərpanın baş verdiyini təsdiqləmir. Treyderlər bazar şəraitini və öz risk limitlərini yoxlamadan qəfil artımların ardınca qaçmamalıdırlar.
💡 Növbəti mərhələdə nələri izləməli
Ticarət həcminin yüksək səviyyədə qalıb-qalmadığını, alıcıların marağını qoruyub-qorumadığını və HOT-un momentumunu davam etdirə bilib-bilmədiyini izləyin.
Dragonfly Official oxuculara xatırladır ki, kriptovalyuta ticarəti risklidir. Mövqelərin həcmini kiçik saxlayın, uyğun olduqda stop-loss əmri istifadə edin və yalnız itirməyə imkanınız olan məbləği riskə atın. Bu, maliyyə məsləhəti deyil.
$HOT
165
TST 12% YÜKSƏLİR: ALIŞ MARAĞI ARTIR, YOXSA BU QISAMÜDDƏTLİ HƏRƏKƏTDİR?
❓ Nə baş verir?
TST 24 saat ərzində 12.0% bahalaşdıqdan sonra bazarın diqqətini cəlb edir. Bəs bu artım daha güclü yüksəliş tendensiyasının başlanğıcıdır, yoxsa sadəcə alıcı fəallığının müvəqqəti sıçrayışıdır? Ticarət göstəriciləri bəzi faydalı ipucları verir.
📊 Bazar icmalı
10 noyabr 2026-cı il, saat 02:42 UTC tarixinə:
Ticarət cütlüyü: TST/USDT
Son qiymət: $0.01281
24 saatlıq dəyişiklik: +12.0%
24 saatlıq ticarət həcmi: təxminən $8,162,403
Qiymətin müsbət dəyişməsi ilə əhəmiyyətli ticarət fəallığının bir araya gəlməsi TST-nin bazar iştirakçılarının xeyli diqqətini cəlb etdiyini göstərir.
🔍 Mümkün səbəblər
Alış marağının artması, treyderlərin diqqətinin yenidən bu aktivə yönəlməsi, spekulyativ fəallıq və ya ümumi bazar əhval-ruhiyyəsi bu hərəkətə səbəb ola bilər. Lakin mövcud göstəricilər bu amillərdən hansının rol oynadığını təsdiqləmir.
Təkcə qiymət artımı uzunmüddətli tələbin artdığını sübut etmir. Treyderlər bu hərəkəti davamlı tendensiya hesab etməzdən əvvəl fəallığın davam edib-etmədiyini izləməlidirlər.
⚖️ Digər tərəfi
Sürətli bahalaşma qısa müddətdə qazanc əldə etməyə çalışan treyderləri cəlb edə bilər. Alış marağı zəifləsə və ya satıcılar fəallaşsa, qiymət geriləyə bilər. Ticarət həcminin yüksək olması qiymət artımının davam edəcəyinə zəmanət vermir.
⚠️ Son xatırlatma
Kriptovalyuta ticarəti risklidir və bu təhlil maliyyə məsləhəti deyil. Ehtiyatlı olun, faktları yoxlayın və ticarət qərarı verməzdən əvvəl həmişə müstəqil düşünün.
#TST #CryptoMarket #TopGainersonBinance r #CryptoAnalysisb #TradingRisk
TST 12% YÜKSƏLİR: ALIŞ MARAĞI ARTIR, YOXSA BU QISAMÜDDƏTLİ HƏRƏKƏTDİR?
❓ Nə baş verir?
TST 24 saat ərzində 12.0% bahalaşdıqdan sonra bazarın diqqətini cəlb edir. Bəs bu artım daha güclü yüksəliş tendensiyasının başlanğıcıdır, yoxsa sadəcə alıcı fəallığının müvəqqəti sıçrayışıdır? Ticarət göstəriciləri bəzi faydalı ipucları verir.
📊 Bazar icmalı
10 noyabr 2026-cı il, saat 02:42 UTC tarixinə:
Ticarət cütlüyü: TST/USDT
Son qiymət: $0.01281
24 saatlıq dəyişiklik: +12.0%
24 saatlıq ticarət həcmi: təxminən $8,162,403
Qiymətin müsbət dəyişməsi ilə əhəmiyyətli ticarət fəallığının bir araya gəlməsi TST-nin bazar iştirakçılarının xeyli diqqətini cəlb etdiyini göstərir.
🔍 Mümkün səbəblər
Alış marağının artması, treyderlərin diqqətinin yenidən bu aktivə yönəlməsi, spekulyativ fəallıq və ya ümumi bazar əhval-ruhiyyəsi bu hərəkətə səbəb ola bilər. Lakin mövcud göstəricilər bu amillərdən hansının rol oynadığını təsdiqləmir.
Təkcə qiymət artımı uzunmüddətli tələbin artdığını sübut etmir. Treyderlər bu hərəkəti davamlı tendensiya hesab etməzdən əvvəl fəallığın davam edib-etmədiyini izləməlidirlər.
⚖️ Digər tərəfi
Sürətli bahalaşma qısa müddətdə qazanc əldə etməyə çalışan treyderləri cəlb edə bilər. Alış marağı zəifləsə və ya satıcılar fəallaşsa, qiymət geriləyə bilər. Ticarət həcminin yüksək olması qiymət artımının davam edəcəyinə zəmanət vermir.
⚠️ Son xatırlatma
Kriptovalyuta ticarəti risklidir və bu təhlil maliyyə məsləhəti deyil. Ehtiyatlı olun, faktları yoxlayın və ticarət qərarı verməzdən əvvəl həmişə müstəqil düşünün.
#TST #CryptoMarket #TopGainersonBinance r #CryptoAnalysisb #TradingRisk
❓ Nə baş verir?
TST 24 saat ərzində 12.0% bahalaşdıqdan sonra bazarın diqqətini cəlb edir. Bəs bu artım daha güclü yüksəliş tendensiyasının başlanğıcıdır, yoxsa sadəcə alıcı fəallığının müvəqqəti sıçrayışıdır? Ticarət göstəriciləri bəzi faydalı ipucları verir.
📊 Bazar icmalı
10 noyabr 2026-cı il, saat 02:42 UTC tarixinə:
Ticarət cütlüyü: TST/USDT
Son qiymət: $0.01281
24 saatlıq dəyişiklik: +12.0%
24 saatlıq ticarət həcmi: təxminən $8,162,403
Qiymətin müsbət dəyişməsi ilə əhəmiyyətli ticarət fəallığının bir araya gəlməsi TST-nin bazar iştirakçılarının xeyli diqqətini cəlb etdiyini göstərir.
🔍 Mümkün səbəblər
Alış marağının artması, treyderlərin diqqətinin yenidən bu aktivə yönəlməsi, spekulyativ fəallıq və ya ümumi bazar əhval-ruhiyyəsi bu hərəkətə səbəb ola bilər. Lakin mövcud göstəricilər bu amillərdən hansının rol oynadığını təsdiqləmir.
Təkcə qiymət artımı uzunmüddətli tələbin artdığını sübut etmir. Treyderlər bu hərəkəti davamlı tendensiya hesab etməzdən əvvəl fəallığın davam edib-etmədiyini izləməlidirlər.
⚖️ Digər tərəfi
Sürətli bahalaşma qısa müddətdə qazanc əldə etməyə çalışan treyderləri cəlb edə bilər. Alış marağı zəifləsə və ya satıcılar fəallaşsa, qiymət geriləyə bilər. Ticarət həcminin yüksək olması qiymət artımının davam edəcəyinə zəmanət vermir.
⚠️ Son xatırlatma
Kriptovalyuta ticarəti risklidir və bu təhlil maliyyə məsləhəti deyil. Ehtiyatlı olun, faktları yoxlayın və ticarət qərarı verməzdən əvvəl həmişə müstəqil düşünün.
#TST #CryptoMarket #TopGainersonBinance r #CryptoAnalysisb #TradingRisk
233
Tərcüməyə bax
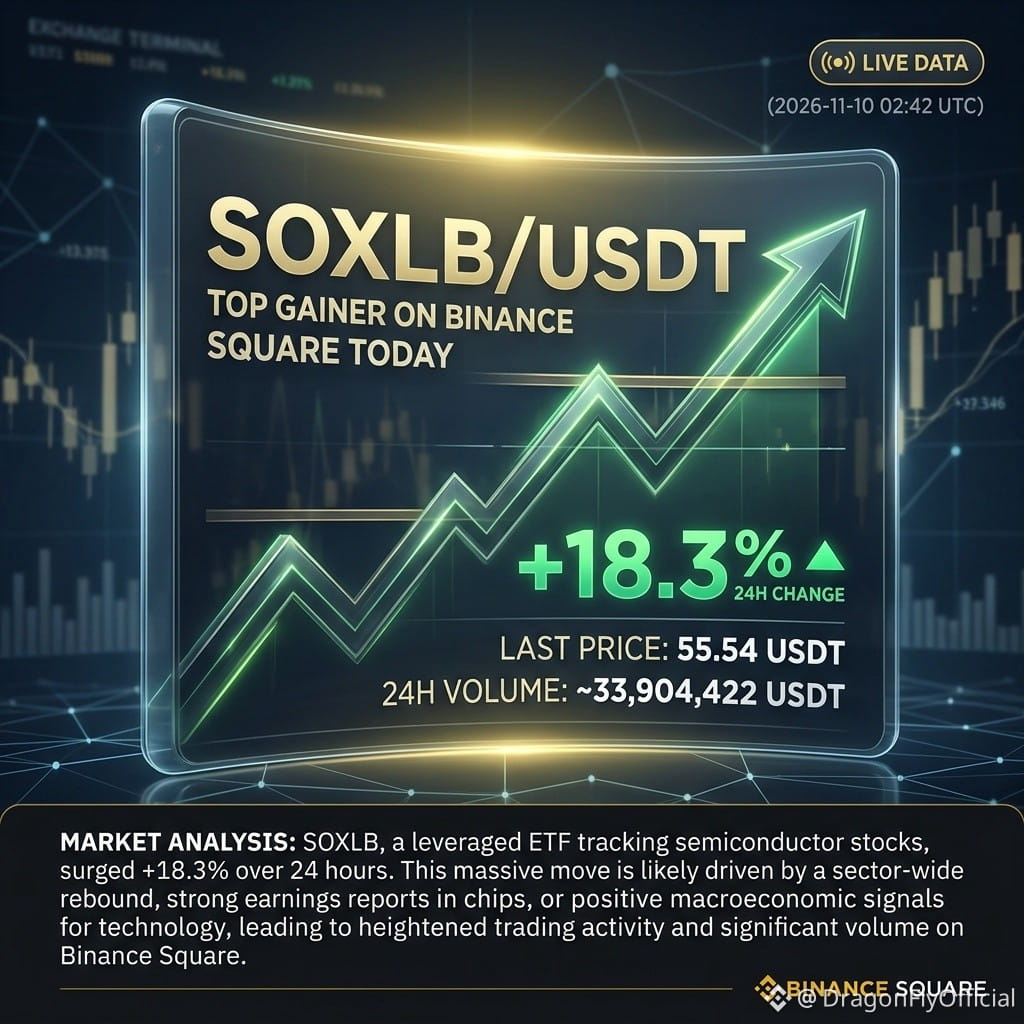
WHY IS SOXLB UP 18.3%? THE FACTS BEHIND TODAY’S TOP GAINER
📈 MYTH: JUST ANOTHER CRYPTO PUMP
FACT: A DIFFERENT KIND OF ASSET
SOXLB is not an ordinary cryptocurrency. It is a tokenized financial asset linked to the Semicon Bull 3X ETF, which provides leveraged exposure to semiconductor stocks. This means its performance is connected to the traditional semiconductor market, not simply crypto market sentiment.
📊 MARKET SNAPSHOT
The latest reported data from November 10, 2026, at 02:42 UTC shows:
Trading pair: SOXLB/USDT
Last price: 55.54 USDT
24-hour gain: +18.3%
24-hour trading volume: Approximately 33,904,422 USDT
This strong price movement and substantial trading activity put SOXLB in the spotlight among today's top gainers.
⚠️ MYTH: 18.3% GROWTH MEANS LOW RISK
FACT: LEVERAGE CAN WORK BOTH WAYS
SOXLB's underlying ETF uses 3X daily leverage. This can amplify gains, but it can also magnify losses. Daily leverage and compounding can produce unexpected results over longer holding periods.
💡 TRADING OUTLOOK
A strong daily gain deserves attention, not blind buying. Watch semiconductor market performance, trading volume, and price stability before making a decision. No reliable entry, stop-loss, or target levels are established by the available data.
Keep positions small, use a suitable stop loss, and risk only what you can afford to lose.
Dragonfly Official takeaway: Big gains attract attention, but understanding leverage and managing risk is what separates informed decisions from speculation.
Crypto trading involves risk. This is not financial advice.
$SOXLB
{spot}(SOXLBUSDT)
WHY IS SOXLB UP 18.3%? THE FACTS BEHIND TODAY’S TOP GAINER
📈 MYTH: JUST ANOTHER CRYPTO PUMP
FACT: A DIFFERENT KIND OF ASSET
SOXLB is not an ordinary cryptocurrency. It is a tokenized financial asset linked to the Semicon Bull 3X ETF, which provides leveraged exposure to semiconductor stocks. This means its performance is connected to the traditional semiconductor market, not simply crypto market sentiment.
📊 MARKET SNAPSHOT
The latest reported data from November 10, 2026, at 02:42 UTC shows:
Trading pair: SOXLB/USDT
Last price: 55.54 USDT
24-hour gain: +18.3%
24-hour trading volume: Approximately 33,904,422 USDT
This strong price movement and substantial trading activity put SOXLB in the spotlight among today's top gainers.
⚠️ MYTH: 18.3% GROWTH MEANS LOW RISK
FACT: LEVERAGE CAN WORK BOTH WAYS
SOXLB's underlying ETF uses 3X daily leverage. This can amplify gains, but it can also magnify losses. Daily leverage and compounding can produce unexpected results over longer holding periods.
💡 TRADING OUTLOOK
A strong daily gain deserves attention, not blind buying. Watch semiconductor market performance, trading volume, and price stability before making a decision. No reliable entry, stop-loss, or target levels are established by the available data.
Keep positions small, use a suitable stop loss, and risk only what you can afford to lose.
Dragonfly Official takeaway: Big gains attract attention, but understanding leverage and managing risk is what separates informed decisions from speculation.
Crypto trading involves risk. This is not financial advice.
$SOXLB
📈 MYTH: JUST ANOTHER CRYPTO PUMP
FACT: A DIFFERENT KIND OF ASSET
SOXLB is not an ordinary cryptocurrency. It is a tokenized financial asset linked to the Semicon Bull 3X ETF, which provides leveraged exposure to semiconductor stocks. This means its performance is connected to the traditional semiconductor market, not simply crypto market sentiment.
📊 MARKET SNAPSHOT
The latest reported data from November 10, 2026, at 02:42 UTC shows:
Trading pair: SOXLB/USDT
Last price: 55.54 USDT
24-hour gain: +18.3%
24-hour trading volume: Approximately 33,904,422 USDT
This strong price movement and substantial trading activity put SOXLB in the spotlight among today's top gainers.
⚠️ MYTH: 18.3% GROWTH MEANS LOW RISK
FACT: LEVERAGE CAN WORK BOTH WAYS
SOXLB's underlying ETF uses 3X daily leverage. This can amplify gains, but it can also magnify losses. Daily leverage and compounding can produce unexpected results over longer holding periods.
💡 TRADING OUTLOOK
A strong daily gain deserves attention, not blind buying. Watch semiconductor market performance, trading volume, and price stability before making a decision. No reliable entry, stop-loss, or target levels are established by the available data.
Keep positions small, use a suitable stop loss, and risk only what you can afford to lose.
Dragonfly Official takeaway: Big gains attract attention, but understanding leverage and managing risk is what separates informed decisions from speculation.
Crypto trading involves risk. This is not financial advice.
$SOXLB
74
Tərcüməyə bax
INIT SURGES 57.6%: IS THIS A REAL RECOVERY OR A SHORT-TERM BUYING WAVE?
📊 MYTH: A 57% PRICE SURGE MEANS A COIN IS NOW SAFE TO BUY.
Not necessarily. A sharp rally can show strong market interest, but it can also bring greater volatility and sudden reversals. INIT is a good example of why traders should look beyond the percentage gain.
📈 Q: WHAT HAPPENED TO INIT?
As of November 10, 2026, at 02:42 UTC, INIT/USDT recorded:
Last price: 0.19856 USDT
24-hour change: +57.6%
24-hour trading volume: Approximately 13.61 million USDT
This strong performance placed INIT among the day's leading gainers.
🔍 Q: WHY IS THE MOVE IMPORTANT?
The combination of a large price increase and substantial trading activity suggests increased market participation.
However, higher volume does not automatically confirm long-term demand. It can also reflect short-term speculation, momentum trading, and traders reacting to rapid price movements.
💡 Q: WHAT COULD BE DRIVING THE RALLY?
Initia is a blockchain ecosystem, so confidence in its technology, ecosystem activity, and broader market sentiment could influence interest in INIT.
However, the available figures do not confirm one specific reason for this rally. Traders should avoid treating speculation as an established catalyst.
⚠️ Q: WHAT ARE THE BIGGEST RISKS?
After a rapid rally, profit-taking can create sudden selling pressure. Momentum can fade, and volatile prices can lead to unexpected losses. Chasing a rising price without a clear plan can be dangerous.
#INIT #Initia #CryptoMarket #TopGainer #CryptoTrading
INIT SURGES 57.6%: IS THIS A REAL RECOVERY OR A SHORT-TERM BUYING WAVE?
📊 MYTH: A 57% PRICE SURGE MEANS A COIN IS NOW SAFE TO BUY.
Not necessarily. A sharp rally can show strong market interest, but it can also bring greater volatility and sudden reversals. INIT is a good example of why traders should look beyond the percentage gain.
📈 Q: WHAT HAPPENED TO INIT?
As of November 10, 2026, at 02:42 UTC, INIT/USDT recorded:
Last price: 0.19856 USDT
24-hour change: +57.6%
24-hour trading volume: Approximately 13.61 million USDT
This strong performance placed INIT among the day's leading gainers.
🔍 Q: WHY IS THE MOVE IMPORTANT?
The combination of a large price increase and substantial trading activity suggests increased market participation.
However, higher volume does not automatically confirm long-term demand. It can also reflect short-term speculation, momentum trading, and traders reacting to rapid price movements.
💡 Q: WHAT COULD BE DRIVING THE RALLY?
Initia is a blockchain ecosystem, so confidence in its technology, ecosystem activity, and broader market sentiment could influence interest in INIT.
However, the available figures do not confirm one specific reason for this rally. Traders should avoid treating speculation as an established catalyst.
⚠️ Q: WHAT ARE THE BIGGEST RISKS?
After a rapid rally, profit-taking can create sudden selling pressure. Momentum can fade, and volatile prices can lead to unexpected losses. Chasing a rising price without a clear plan can be dangerous.
#INIT #Initia #CryptoMarket #TopGainer #CryptoTrading
📊 MYTH: A 57% PRICE SURGE MEANS A COIN IS NOW SAFE TO BUY.
Not necessarily. A sharp rally can show strong market interest, but it can also bring greater volatility and sudden reversals. INIT is a good example of why traders should look beyond the percentage gain.
📈 Q: WHAT HAPPENED TO INIT?
As of November 10, 2026, at 02:42 UTC, INIT/USDT recorded:
Last price: 0.19856 USDT
24-hour change: +57.6%
24-hour trading volume: Approximately 13.61 million USDT
This strong performance placed INIT among the day's leading gainers.
🔍 Q: WHY IS THE MOVE IMPORTANT?
The combination of a large price increase and substantial trading activity suggests increased market participation.
However, higher volume does not automatically confirm long-term demand. It can also reflect short-term speculation, momentum trading, and traders reacting to rapid price movements.
💡 Q: WHAT COULD BE DRIVING THE RALLY?
Initia is a blockchain ecosystem, so confidence in its technology, ecosystem activity, and broader market sentiment could influence interest in INIT.
However, the available figures do not confirm one specific reason for this rally. Traders should avoid treating speculation as an established catalyst.
⚠️ Q: WHAT ARE THE BIGGEST RISKS?
After a rapid rally, profit-taking can create sudden selling pressure. Momentum can fade, and volatile prices can lead to unexpected losses. Chasing a rising price without a clear plan can be dangerous.
#INIT #Initia #CryptoMarket #TopGainer #CryptoTrading
136
Tərcüməyə bax
GNS SURGES 34.7%: WHAT IS DRIVING THE SUDDEN BUYING INTEREST?
📈 WHAT HAPPENED TO GNS?
GNS/USDT has recorded a strong 34.7% gain in 24 hours, reaching $0.427. Its 24-hour trading volume has also reached approximately $6.46 million. This makes GNS a coin worth watching as traders look for opportunities in the market.
🔍 WHAT IS GNS?
GNS is the token of Gains Network, a decentralized trading ecosystem. Its main focus is providing on-chain leveraged trading. In simple words, it allows users to trade different markets through blockchain-based technology.
📊 WHY IS THE PRICE RISING?
A 34.7% increase alongside millions of dollars in trading volume suggests strong market activity. Possible factors include increased buying interest, short-term speculation, renewed attention toward the project, or broader market sentiment.
However, the available figures do not confirm which factor caused the rally. Higher volume shows increased trading activity, not necessarily long-term investor demand.
💡 WHAT SHOULD TRADERS WATCH?
Before considering a position, watch whether buying activity continues, whether volume remains strong, and whether the price can maintain its recent gains. Avoid chasing a sudden pump without confirmation. No reliable entry, stop-loss, or take-profit levels can be established from the supplied data alone.
⚠️ THE BIGGER PICTURE
GNS has delivered an impressive daily move, but sharp rallies can reverse quickly. Keep position sizes small, use a suitable stop loss, and risk only what you can afford to lose.
GNS SURGES 34.7%: WHAT IS DRIVING THE SUDDEN BUYING INTEREST?
📈 WHAT HAPPENED TO GNS?
GNS/USDT has recorded a strong 34.7% gain in 24 hours, reaching $0.427. Its 24-hour trading volume has also reached approximately $6.46 million. This makes GNS a coin worth watching as traders look for opportunities in the market.
🔍 WHAT IS GNS?
GNS is the token of Gains Network, a decentralized trading ecosystem. Its main focus is providing on-chain leveraged trading. In simple words, it allows users to trade different markets through blockchain-based technology.
📊 WHY IS THE PRICE RISING?
A 34.7% increase alongside millions of dollars in trading volume suggests strong market activity. Possible factors include increased buying interest, short-term speculation, renewed attention toward the project, or broader market sentiment.
However, the available figures do not confirm which factor caused the rally. Higher volume shows increased trading activity, not necessarily long-term investor demand.
💡 WHAT SHOULD TRADERS WATCH?
Before considering a position, watch whether buying activity continues, whether volume remains strong, and whether the price can maintain its recent gains. Avoid chasing a sudden pump without confirmation. No reliable entry, stop-loss, or take-profit levels can be established from the supplied data alone.
⚠️ THE BIGGER PICTURE
GNS has delivered an impressive daily move, but sharp rallies can reverse quickly. Keep position sizes small, use a suitable stop loss, and risk only what you can afford to lose.
📈 WHAT HAPPENED TO GNS?
GNS/USDT has recorded a strong 34.7% gain in 24 hours, reaching $0.427. Its 24-hour trading volume has also reached approximately $6.46 million. This makes GNS a coin worth watching as traders look for opportunities in the market.
🔍 WHAT IS GNS?
GNS is the token of Gains Network, a decentralized trading ecosystem. Its main focus is providing on-chain leveraged trading. In simple words, it allows users to trade different markets through blockchain-based technology.
📊 WHY IS THE PRICE RISING?
A 34.7% increase alongside millions of dollars in trading volume suggests strong market activity. Possible factors include increased buying interest, short-term speculation, renewed attention toward the project, or broader market sentiment.
However, the available figures do not confirm which factor caused the rally. Higher volume shows increased trading activity, not necessarily long-term investor demand.
💡 WHAT SHOULD TRADERS WATCH?
Before considering a position, watch whether buying activity continues, whether volume remains strong, and whether the price can maintain its recent gains. Avoid chasing a sudden pump without confirmation. No reliable entry, stop-loss, or take-profit levels can be established from the supplied data alone.
⚠️ THE BIGGER PICTURE
GNS has delivered an impressive daily move, but sharp rallies can reverse quickly. Keep position sizes small, use a suitable stop loss, and risk only what you can afford to lose.
27
Tərcüməyə bax
YOUR ACCOUNT CHANGED. SEND YOUR MESSAGE AGAIN
YOUR ACCOUNT CHANGED. SEND YOUR MESSAGE AGAIN
📊 İNDİ NƏ BAŞ VERDİ?
Kriptovalyuta bazarında daha bir böyük likvidasiya dalğası yaşandı: noyabrın 9-da 24 saat ərzində təxminən 1,16 milyard dollar dəyərində kredit vəsaiti ilə açılmış mövqe bağlandı.
Bazarın qəfil enişi minlərlə treyderi yanlış tərəfdə yaxaladı. Bu müddət ərzində 167 mindən çox treyderin mövqeyi likvidasiya edildi. Bu, bazar şərtlərinin kredit vəsaiti ilə açılmış mövqelərin əleyhinə nə qədər tez dəyişə biləcəyini göstərir.
Ən böyük zərbə uzun mövqelərə dəydi: onların payına təxminən 1,04 milyard dollar düşdü. Qısa mövqelərin payı isə təxminən 117 milyon dollar oldu.
🔍 ZƏRƏRLƏR NİYƏ BU QƏDƏR BÖYÜK OLDU?
Əsas problem həddindən artıq kredit çiyni ilə qiymətlərin düşməsinin üst-üstə düşməsi idi.
Uzun mövqe qiymətlər qalxanda qazanc gətirən əməliyyatdır. Treyderlər mövqelərinin həcmini artırmaq üçün borc götürdükdə və ya kredit çiynindən istifadə etdikdə, qiymətlərin nisbətən cüzi enişi belə ciddi zərərlərə səbəb ola bilər.
Əlçatan marja yetərsiz olduqda, birjalar mövqeləri avtomatik bağlayır. Bu məcburi bağlanmalar likvidasiya adlanır.
Satış təzyiqi qiymətləri daha da aşağı sala, əlavə likvidasiyalara səbəb ola və zəncirvari reaksiya yarada bilər.
Ethereum treyderləri xüsusilə böyük zərərlərlə üzləşdi: likvidasiyaların həcmi 500 milyon dolları keçdi. Bitcoin üzrə bu göstərici isə təxminən 309 milyon dollar oldu.
⚠️ BU, BAZAR ÜÇÜN NƏ DEMƏKDİR?
Likvidasiya göstəriciləri son enişdən əvvəl yüksəliş gözləyən treyderlərin böyük riskə məruz qaldığını göstərir.
Bitcoin qısa müddətə 74 000 dollardan aşağı düşərək onsuz da narahat olan bazara əlavə təzyiq göstərdi. Bununla belə, kütləvi likvidasiyalar daha uzunmüddətli ayı bazarının başladığı anlamına gəlmir.
.
Bu, bazardakı həddindən artıq kredit çiyninin aradan qaldırıldığını göstərir, lakin bazarın dərhal bərpa olunacağına zəmanət vermir.
📈 NÖVBƏTİ MƏRHƏLƏDƏ NƏ BAŞ VERƏ BİLƏR?
Bazarın növbəti istiqaməti alıcıların qiymətləri dəstəkləmək üçün kifayət qədər güclə geri qayıdıb-qayıtmamasından asılı olacaq.
Satış təzyiqi davam edərsə, əlavə dəyişkənlik və məcburi bağlanmalar mümkündür. Alış tələbi yaxşılaşarsa, zəif kredit çiyinli mövqelər artıq aradan qaldırıldığı üçün bazar sabitləşə bilər.
📊 İNDİ NƏ BAŞ VERDİ?
Kriptovalyuta bazarında daha bir böyük likvidasiya dalğası yaşandı: noyabrın 9-da 24 saat ərzində təxminən 1,16 milyard dollar dəyərində kredit vəsaiti ilə açılmış mövqe bağlandı.
Bazarın qəfil enişi minlərlə treyderi yanlış tərəfdə yaxaladı. Bu müddət ərzində 167 mindən çox treyderin mövqeyi likvidasiya edildi. Bu, bazar şərtlərinin kredit vəsaiti ilə açılmış mövqelərin əleyhinə nə qədər tez dəyişə biləcəyini göstərir.
Ən böyük zərbə uzun mövqelərə dəydi: onların payına təxminən 1,04 milyard dollar düşdü. Qısa mövqelərin payı isə təxminən 117 milyon dollar oldu.
🔍 ZƏRƏRLƏR NİYƏ BU QƏDƏR BÖYÜK OLDU?
Əsas problem həddindən artıq kredit çiyni ilə qiymətlərin düşməsinin üst-üstə düşməsi idi.
Uzun mövqe qiymətlər qalxanda qazanc gətirən əməliyyatdır. Treyderlər mövqelərinin həcmini artırmaq üçün borc götürdükdə və ya kredit çiynindən istifadə etdikdə, qiymətlərin nisbətən cüzi enişi belə ciddi zərərlərə səbəb ola bilər.
Əlçatan marja yetərsiz olduqda, birjalar mövqeləri avtomatik bağlayır. Bu məcburi bağlanmalar likvidasiya adlanır.
Satış təzyiqi qiymətləri daha da aşağı sala, əlavə likvidasiyalara səbəb ola və zəncirvari reaksiya yarada bilər.
Ethereum treyderləri xüsusilə böyük zərərlərlə üzləşdi: likvidasiyaların həcmi 500 milyon dolları keçdi. Bitcoin üzrə bu göstərici isə təxminən 309 milyon dollar oldu.
⚠️ BU, BAZAR ÜÇÜN NƏ DEMƏKDİR?
Likvidasiya göstəriciləri son enişdən əvvəl yüksəliş gözləyən treyderlərin böyük riskə məruz qaldığını göstərir.
Bitcoin qısa müddətə 74 000 dollardan aşağı düşərək onsuz da narahat olan bazara əlavə təzyiq göstərdi. Bununla belə, kütləvi likvidasiyalar daha uzunmüddətli ayı bazarının başladığı anlamına gəlmir.
.
Bu, bazardakı həddindən artıq kredit çiyninin aradan qaldırıldığını göstərir, lakin bazarın dərhal bərpa olunacağına zəmanət vermir.
📈 NÖVBƏTİ MƏRHƏLƏDƏ NƏ BAŞ VERƏ BİLƏR?
Bazarın növbəti istiqaməti alıcıların qiymətləri dəstəkləmək üçün kifayət qədər güclə geri qayıdıb-qayıtmamasından asılı olacaq.
Satış təzyiqi davam edərsə, əlavə dəyişkənlik və məcburi bağlanmalar mümkündür. Alış tələbi yaxşılaşarsa, zəif kredit çiyinli mövqelər artıq aradan qaldırıldığı üçün bazar sabitləşə bilər.
Kriptovalyuta bazarında daha bir böyük likvidasiya dalğası yaşandı: noyabrın 9-da 24 saat ərzində təxminən 1,16 milyard dollar dəyərində kredit vəsaiti ilə açılmış mövqe bağlandı.
Bazarın qəfil enişi minlərlə treyderi yanlış tərəfdə yaxaladı. Bu müddət ərzində 167 mindən çox treyderin mövqeyi likvidasiya edildi. Bu, bazar şərtlərinin kredit vəsaiti ilə açılmış mövqelərin əleyhinə nə qədər tez dəyişə biləcəyini göstərir.
Ən böyük zərbə uzun mövqelərə dəydi: onların payına təxminən 1,04 milyard dollar düşdü. Qısa mövqelərin payı isə təxminən 117 milyon dollar oldu.
🔍 ZƏRƏRLƏR NİYƏ BU QƏDƏR BÖYÜK OLDU?
Əsas problem həddindən artıq kredit çiyni ilə qiymətlərin düşməsinin üst-üstə düşməsi idi.
Uzun mövqe qiymətlər qalxanda qazanc gətirən əməliyyatdır. Treyderlər mövqelərinin həcmini artırmaq üçün borc götürdükdə və ya kredit çiynindən istifadə etdikdə, qiymətlərin nisbətən cüzi enişi belə ciddi zərərlərə səbəb ola bilər.
Əlçatan marja yetərsiz olduqda, birjalar mövqeləri avtomatik bağlayır. Bu məcburi bağlanmalar likvidasiya adlanır.
Satış təzyiqi qiymətləri daha da aşağı sala, əlavə likvidasiyalara səbəb ola və zəncirvari reaksiya yarada bilər.
Ethereum treyderləri xüsusilə böyük zərərlərlə üzləşdi: likvidasiyaların həcmi 500 milyon dolları keçdi. Bitcoin üzrə bu göstərici isə təxminən 309 milyon dollar oldu.
⚠️ BU, BAZAR ÜÇÜN NƏ DEMƏKDİR?
Likvidasiya göstəriciləri son enişdən əvvəl yüksəliş gözləyən treyderlərin böyük riskə məruz qaldığını göstərir.
Bitcoin qısa müddətə 74 000 dollardan aşağı düşərək onsuz da narahat olan bazara əlavə təzyiq göstərdi. Bununla belə, kütləvi likvidasiyalar daha uzunmüddətli ayı bazarının başladığı anlamına gəlmir.
.
Bu, bazardakı həddindən artıq kredit çiyninin aradan qaldırıldığını göstərir, lakin bazarın dərhal bərpa olunacağına zəmanət vermir.
📈 NÖVBƏTİ MƏRHƏLƏDƏ NƏ BAŞ VERƏ BİLƏR?
Bazarın növbəti istiqaməti alıcıların qiymətləri dəstəkləmək üçün kifayət qədər güclə geri qayıdıb-qayıtmamasından asılı olacaq.
Satış təzyiqi davam edərsə, əlavə dəyişkənlik və məcburi bağlanmalar mümkündür. Alış tələbi yaxşılaşarsa, zəif kredit çiyinli mövqelər artıq aradan qaldırıldığı üçün bazar sabitləşə bilər.
52
ANTHROPIC IPO SINAĞI İLƏ ÜZ-ÜZƏDİR: ŞİRKƏT DƏYƏRİNİ QORUYACAQ, YOXSA BÖYÜK DEBÜTÜ TƏXİRƏ SALACAQ?
🏢 BÖYÜK DEBÜT, BÖYÜK SUAL
Təsəvvür edin ki, dünyanın ən dəyərli süni intellekt şirkətlərindən birini qurursunuz. Texnologiyanız milyonlarla istifadəçini cəlb edir, investorlar həyəcanlıdır və siz birjaya çıxmağa hazırlaşırsınız. Ancaq debütdən bir qədər əvvəl bəzi alıcılar qiyməti sorğulamağa başlayırlar.
Claude AI-nin yaradıcısı Anthropic böyük ilkin kütləvi səhm təklifinə (IPO) hazırlaşarkən məhz belə bir problemlə üzləşir. Noyabrda planlaşdırılan birja debütü diqqət cəlb edir, lakin investorların etimadı ciddi sınaq qarşısındadır.
📊 1,5 TRİLYON DOLLARLIQ SUAL
Anthropic-in mümkün IPO zamanı bazar dəyərinin təxminən 1,5 trilyon dollar olacağı müzakirə edilir. Bu, əvvəlki, təxminən 2 trilyon dollara yaxın gözləntilərdən aşağıdır.
Bununla belə, potensial investorların bəziləri mövcud bazar şəraitində hətta 1,5 trilyon dolları da həddən artıq yüksək hesab edir. Məlumatlara görə, bəziləri vəsaitlərini yatırmaq qərarına gəlməzdən əvvəl daha böyük endirim istəyirlər.
Bu isə çətin seçim yaradır: iddialı gözləntiləri qoruyub saxlamaq, yoxsa daha güclü tələbi cəlb etmək üçün səhmləri daha aşağı qiymətlə satmaq.
⚠️ İNVESTORLAR NİYƏ TƏRƏDDÜD EDİR?
Texnologiya bazarında kəskin satış dalğası yaşanıb və bu, süni intellektlə əlaqəli şirkətlərə təzyiq göstərib.
İnvestorlar həmçinin Anthropic-in maliyyə vəziyyətini, o cümlədən əməliyyat xərclərini, rüblük zərərlərini və hesablama infrastrukturu ilə biznes tərəfdaşlarına dair böyük öhdəliklərini araşdırırlar.
Digər mühüm narahatlıq isə gəlirlərin artımıdır. Şirkətin son dövrlərdəki artım tempinin zəifləməsinin yaxşılaşıb-yaxşılaşmadığını anlamaq üçün investorlar oktyabr ayının gəlir göstəricilərini gözləyirlər.
💡 SÜNİ İNTELLEKT İNVESTORLARI ÜÇÜN DAHA BÖYÜK DƏRS
Anthropic-in vəziyyəti biznes uğuru ilə birja dəyəri arasındakı mühüm fərqi üzə çıxarır.
Şirkət güclü texnologiyaya, yüksək tələbə və təsirli gəlir artımına malik ola bilər, lakin bu, investorların ondan tələb olunan istənilən qiyməti avtomatik əsaslandırmır.
Süni intellekt sənayesi üçün bu IPO investorların gələcək artım naminə hələ də olduqca yüksək əlavələr ödəməyə hazır olub-olmadığını sınayan mühüm sınağa çevrilə bilər.
ANTHROPIC IPO SINAĞI İLƏ ÜZ-ÜZƏDİR: ŞİRKƏT DƏYƏRİNİ QORUYACAQ, YOXSA BÖYÜK DEBÜTÜ TƏXİRƏ SALACAQ?
🏢 BÖYÜK DEBÜT, BÖYÜK SUAL
Təsəvvür edin ki, dünyanın ən dəyərli süni intellekt şirkətlərindən birini qurursunuz. Texnologiyanız milyonlarla istifadəçini cəlb edir, investorlar həyəcanlıdır və siz birjaya çıxmağa hazırlaşırsınız. Ancaq debütdən bir qədər əvvəl bəzi alıcılar qiyməti sorğulamağa başlayırlar.
Claude AI-nin yaradıcısı Anthropic böyük ilkin kütləvi səhm təklifinə (IPO) hazırlaşarkən məhz belə bir problemlə üzləşir. Noyabrda planlaşdırılan birja debütü diqqət cəlb edir, lakin investorların etimadı ciddi sınaq qarşısındadır.
📊 1,5 TRİLYON DOLLARLIQ SUAL
Anthropic-in mümkün IPO zamanı bazar dəyərinin təxminən 1,5 trilyon dollar olacağı müzakirə edilir. Bu, əvvəlki, təxminən 2 trilyon dollara yaxın gözləntilərdən aşağıdır.
Bununla belə, potensial investorların bəziləri mövcud bazar şəraitində hətta 1,5 trilyon dolları da həddən artıq yüksək hesab edir. Məlumatlara görə, bəziləri vəsaitlərini yatırmaq qərarına gəlməzdən əvvəl daha böyük endirim istəyirlər.
Bu isə çətin seçim yaradır: iddialı gözləntiləri qoruyub saxlamaq, yoxsa daha güclü tələbi cəlb etmək üçün səhmləri daha aşağı qiymətlə satmaq.
⚠️ İNVESTORLAR NİYƏ TƏRƏDDÜD EDİR?
Texnologiya bazarında kəskin satış dalğası yaşanıb və bu, süni intellektlə əlaqəli şirkətlərə təzyiq göstərib.
İnvestorlar həmçinin Anthropic-in maliyyə vəziyyətini, o cümlədən əməliyyat xərclərini, rüblük zərərlərini və hesablama infrastrukturu ilə biznes tərəfdaşlarına dair böyük öhdəliklərini araşdırırlar.
Digər mühüm narahatlıq isə gəlirlərin artımıdır. Şirkətin son dövrlərdəki artım tempinin zəifləməsinin yaxşılaşıb-yaxşılaşmadığını anlamaq üçün investorlar oktyabr ayının gəlir göstəricilərini gözləyirlər.
💡 SÜNİ İNTELLEKT İNVESTORLARI ÜÇÜN DAHA BÖYÜK DƏRS
Anthropic-in vəziyyəti biznes uğuru ilə birja dəyəri arasındakı mühüm fərqi üzə çıxarır.
Şirkət güclü texnologiyaya, yüksək tələbə və təsirli gəlir artımına malik ola bilər, lakin bu, investorların ondan tələb olunan istənilən qiyməti avtomatik əsaslandırmır.
Süni intellekt sənayesi üçün bu IPO investorların gələcək artım naminə hələ də olduqca yüksək əlavələr ödəməyə hazır olub-olmadığını sınayan mühüm sınağa çevrilə bilər.
🏢 BÖYÜK DEBÜT, BÖYÜK SUAL
Təsəvvür edin ki, dünyanın ən dəyərli süni intellekt şirkətlərindən birini qurursunuz. Texnologiyanız milyonlarla istifadəçini cəlb edir, investorlar həyəcanlıdır və siz birjaya çıxmağa hazırlaşırsınız. Ancaq debütdən bir qədər əvvəl bəzi alıcılar qiyməti sorğulamağa başlayırlar.
Claude AI-nin yaradıcısı Anthropic böyük ilkin kütləvi səhm təklifinə (IPO) hazırlaşarkən məhz belə bir problemlə üzləşir. Noyabrda planlaşdırılan birja debütü diqqət cəlb edir, lakin investorların etimadı ciddi sınaq qarşısındadır.
📊 1,5 TRİLYON DOLLARLIQ SUAL
Anthropic-in mümkün IPO zamanı bazar dəyərinin təxminən 1,5 trilyon dollar olacağı müzakirə edilir. Bu, əvvəlki, təxminən 2 trilyon dollara yaxın gözləntilərdən aşağıdır.
Bununla belə, potensial investorların bəziləri mövcud bazar şəraitində hətta 1,5 trilyon dolları da həddən artıq yüksək hesab edir. Məlumatlara görə, bəziləri vəsaitlərini yatırmaq qərarına gəlməzdən əvvəl daha böyük endirim istəyirlər.
Bu isə çətin seçim yaradır: iddialı gözləntiləri qoruyub saxlamaq, yoxsa daha güclü tələbi cəlb etmək üçün səhmləri daha aşağı qiymətlə satmaq.
⚠️ İNVESTORLAR NİYƏ TƏRƏDDÜD EDİR?
Texnologiya bazarında kəskin satış dalğası yaşanıb və bu, süni intellektlə əlaqəli şirkətlərə təzyiq göstərib.
İnvestorlar həmçinin Anthropic-in maliyyə vəziyyətini, o cümlədən əməliyyat xərclərini, rüblük zərərlərini və hesablama infrastrukturu ilə biznes tərəfdaşlarına dair böyük öhdəliklərini araşdırırlar.
Digər mühüm narahatlıq isə gəlirlərin artımıdır. Şirkətin son dövrlərdəki artım tempinin zəifləməsinin yaxşılaşıb-yaxşılaşmadığını anlamaq üçün investorlar oktyabr ayının gəlir göstəricilərini gözləyirlər.
💡 SÜNİ İNTELLEKT İNVESTORLARI ÜÇÜN DAHA BÖYÜK DƏRS
Anthropic-in vəziyyəti biznes uğuru ilə birja dəyəri arasındakı mühüm fərqi üzə çıxarır.
Şirkət güclü texnologiyaya, yüksək tələbə və təsirli gəlir artımına malik ola bilər, lakin bu, investorların ondan tələb olunan istənilən qiyməti avtomatik əsaslandırmır.
Süni intellekt sənayesi üçün bu IPO investorların gələcək artım naminə hələ də olduqca yüksək əlavələr ödəməyə hazır olub-olmadığını sınayan mühüm sınağa çevrilə bilər.
136
CPI DEKABR FAİZ DƏRƏCƏSİ PROQNOZUNU SINAQDAN KEÇİRİR: İNFLYASİYA FEDERAL EHTİYAT SİSTEMİNİ FAİZLƏRİ YÜKSƏK SAXLAMAĞA MƏCBUR EDƏCƏK? 📊
ABŞ-da növbəti inflyasiya hesabatı dekabr ayı üçün faiz dərəcəsi gözləntilərini dəyişəcəkmi? İnvestorlar noyabrın 10-da Şərq vaxtı ilə səhər saat 8:30-da açıqlanacaq oktyabr ayı İstehlak Qiymətləri İndeksini (CPI) gözləyirlər.
Bu hesabat vacibdir, çünki inflyasiya Federal Ehtiyat Sistemi üçün hələ də əsas narahatlıq doğuran məsələlərdən biridir. Nəticələr borclanma xərclərinə, fond bazarlarına, ABŞ dollarına, Bitcoin-ə və daha geniş kriptovalyuta bazarına təsir göstərə bilər.
📊 İNFLYASİYA TƏZYİQİ
ABŞ-da sentyabr ayı CPI göstəricisi illik müqayisədə 3,7%-ə yüksəlib. Avqustda bu göstərici 3,4% idi. Bu, inflyasiya təzyiqinin aradan qalxmadığını göstərir.
Fed inflyasiyanı 2%-ə endirməyi hədəfləyir. Qiymətlər həddindən artıq sürətlə artmağa davam etdikdə, siyasətçilər xərcləmələri və tələbi azaltmaq üçün faiz dərəcələrini yüksək saxlaya və ya artıra bilərlər.
⚖️ DEKABR QƏRARI
Federal Ehtiyat Sistemi oktyabrda baza faiz dərəcəsini 3,75%–4,00% səviyyəsində saxladı. Bununla belə, dekabr üçün gözləntilər mümkün növbəti artım istiqamətində dəyişib.
Son dövrdə məşğulluq göstəricilərinin gözləniləndən güclü olması və inflyasiyanın davam etməsi daha sərt pul siyasətinin lehinə arqumentləri gücləndirib. İndi bazarlar növbəti CPI hesabatının bu gözləntini dəstəkləyib-dəstəkləməyəcəyinə diqqət yetirirlər.
₿ KRİPTOVALYUTALARA TƏSİRİ
İnflyasiya gözləniləndən yüksək olarsa, investorlar faiz dərəcələrinin daha uzun müddət yüksək qalacağını ehtimal edə bilərlər. Bu, kriptovalyutalar da daxil olmaqla, daha riskli investisiyalara təzyiq göstərə bilər.
İnflyasiya zəifləyərsə, investorlar Fed-in gələcək qərarlarını yenidən qiymətləndirdikcə bazarda inam arta bilər. Bununla belə, inflyasiyanın azalması faizlərin endiriləcəyinə zəmanət vermir.
💡 NƏLƏR VACİBDİR
Dragonfly Official izlənilməli üç vacib amili vurğulayır:
Ümumi CPI: İstehlak qiymətlərindəki ümumi dəyişiklik.
Baza CPI: Ərzaq və enerji qiymətləri nəzərə alınmadan hesablanan inflyasiya. Bu göstərici qiymətlərə təsir edən əsas təzyiqləri üzə çıxarmağa kömək edir.
Bazarın reaksiyası: Nəticələrdən asılı olaraq Bitcoin, ABŞ dolları, istiqraz gəlirliliyi və fond bazarları fərqli reaksiya verə bilər.
BUNDAN SONRA NƏ OLACAQ?
Oktyabr ayı CPI hesabatı noyabrın 10-da açıqlanacaq, ardınca dekabrın 9-da Fed-in qərarı veriləcək.
CPI DEKABR FAİZ DƏRƏCƏSİ PROQNOZUNU SINAQDAN KEÇİRİR: İNFLYASİYA FEDERAL EHTİYAT SİSTEMİNİ FAİZLƏRİ YÜKSƏK SAXLAMAĞA MƏCBUR EDƏCƏK? 📊
ABŞ-da növbəti inflyasiya hesabatı dekabr ayı üçün faiz dərəcəsi gözləntilərini dəyişəcəkmi? İnvestorlar noyabrın 10-da Şərq vaxtı ilə səhər saat 8:30-da açıqlanacaq oktyabr ayı İstehlak Qiymətləri İndeksini (CPI) gözləyirlər.
Bu hesabat vacibdir, çünki inflyasiya Federal Ehtiyat Sistemi üçün hələ də əsas narahatlıq doğuran məsələlərdən biridir. Nəticələr borclanma xərclərinə, fond bazarlarına, ABŞ dollarına, Bitcoin-ə və daha geniş kriptovalyuta bazarına təsir göstərə bilər.
📊 İNFLYASİYA TƏZYİQİ
ABŞ-da sentyabr ayı CPI göstəricisi illik müqayisədə 3,7%-ə yüksəlib. Avqustda bu göstərici 3,4% idi. Bu, inflyasiya təzyiqinin aradan qalxmadığını göstərir.
Fed inflyasiyanı 2%-ə endirməyi hədəfləyir. Qiymətlər həddindən artıq sürətlə artmağa davam etdikdə, siyasətçilər xərcləmələri və tələbi azaltmaq üçün faiz dərəcələrini yüksək saxlaya və ya artıra bilərlər.
⚖️ DEKABR QƏRARI
Federal Ehtiyat Sistemi oktyabrda baza faiz dərəcəsini 3,75%–4,00% səviyyəsində saxladı. Bununla belə, dekabr üçün gözləntilər mümkün növbəti artım istiqamətində dəyişib.
Son dövrdə məşğulluq göstəricilərinin gözləniləndən güclü olması və inflyasiyanın davam etməsi daha sərt pul siyasətinin lehinə arqumentləri gücləndirib. İndi bazarlar növbəti CPI hesabatının bu gözləntini dəstəkləyib-dəstəkləməyəcəyinə diqqət yetirirlər.
₿ KRİPTOVALYUTALARA TƏSİRİ
İnflyasiya gözləniləndən yüksək olarsa, investorlar faiz dərəcələrinin daha uzun müddət yüksək qalacağını ehtimal edə bilərlər. Bu, kriptovalyutalar da daxil olmaqla, daha riskli investisiyalara təzyiq göstərə bilər.
İnflyasiya zəifləyərsə, investorlar Fed-in gələcək qərarlarını yenidən qiymətləndirdikcə bazarda inam arta bilər. Bununla belə, inflyasiyanın azalması faizlərin endiriləcəyinə zəmanət vermir.
💡 NƏLƏR VACİBDİR
Dragonfly Official izlənilməli üç vacib amili vurğulayır:
Ümumi CPI: İstehlak qiymətlərindəki ümumi dəyişiklik.
Baza CPI: Ərzaq və enerji qiymətləri nəzərə alınmadan hesablanan inflyasiya. Bu göstərici qiymətlərə təsir edən əsas təzyiqləri üzə çıxarmağa kömək edir.
Bazarın reaksiyası: Nəticələrdən asılı olaraq Bitcoin, ABŞ dolları, istiqraz gəlirliliyi və fond bazarları fərqli reaksiya verə bilər.
BUNDAN SONRA NƏ OLACAQ?
Oktyabr ayı CPI hesabatı noyabrın 10-da açıqlanacaq, ardınca dekabrın 9-da Fed-in qərarı veriləcək.
ABŞ-da növbəti inflyasiya hesabatı dekabr ayı üçün faiz dərəcəsi gözləntilərini dəyişəcəkmi? İnvestorlar noyabrın 10-da Şərq vaxtı ilə səhər saat 8:30-da açıqlanacaq oktyabr ayı İstehlak Qiymətləri İndeksini (CPI) gözləyirlər.
Bu hesabat vacibdir, çünki inflyasiya Federal Ehtiyat Sistemi üçün hələ də əsas narahatlıq doğuran məsələlərdən biridir. Nəticələr borclanma xərclərinə, fond bazarlarına, ABŞ dollarına, Bitcoin-ə və daha geniş kriptovalyuta bazarına təsir göstərə bilər.
📊 İNFLYASİYA TƏZYİQİ
ABŞ-da sentyabr ayı CPI göstəricisi illik müqayisədə 3,7%-ə yüksəlib. Avqustda bu göstərici 3,4% idi. Bu, inflyasiya təzyiqinin aradan qalxmadığını göstərir.
Fed inflyasiyanı 2%-ə endirməyi hədəfləyir. Qiymətlər həddindən artıq sürətlə artmağa davam etdikdə, siyasətçilər xərcləmələri və tələbi azaltmaq üçün faiz dərəcələrini yüksək saxlaya və ya artıra bilərlər.
⚖️ DEKABR QƏRARI
Federal Ehtiyat Sistemi oktyabrda baza faiz dərəcəsini 3,75%–4,00% səviyyəsində saxladı. Bununla belə, dekabr üçün gözləntilər mümkün növbəti artım istiqamətində dəyişib.
Son dövrdə məşğulluq göstəricilərinin gözləniləndən güclü olması və inflyasiyanın davam etməsi daha sərt pul siyasətinin lehinə arqumentləri gücləndirib. İndi bazarlar növbəti CPI hesabatının bu gözləntini dəstəkləyib-dəstəkləməyəcəyinə diqqət yetirirlər.
₿ KRİPTOVALYUTALARA TƏSİRİ
İnflyasiya gözləniləndən yüksək olarsa, investorlar faiz dərəcələrinin daha uzun müddət yüksək qalacağını ehtimal edə bilərlər. Bu, kriptovalyutalar da daxil olmaqla, daha riskli investisiyalara təzyiq göstərə bilər.
İnflyasiya zəifləyərsə, investorlar Fed-in gələcək qərarlarını yenidən qiymətləndirdikcə bazarda inam arta bilər. Bununla belə, inflyasiyanın azalması faizlərin endiriləcəyinə zəmanət vermir.
💡 NƏLƏR VACİBDİR
Dragonfly Official izlənilməli üç vacib amili vurğulayır:
Ümumi CPI: İstehlak qiymətlərindəki ümumi dəyişiklik.
Baza CPI: Ərzaq və enerji qiymətləri nəzərə alınmadan hesablanan inflyasiya. Bu göstərici qiymətlərə təsir edən əsas təzyiqləri üzə çıxarmağa kömək edir.
Bazarın reaksiyası: Nəticələrdən asılı olaraq Bitcoin, ABŞ dolları, istiqraz gəlirliliyi və fond bazarları fərqli reaksiya verə bilər.
BUNDAN SONRA NƏ OLACAQ?
Oktyabr ayı CPI hesabatı noyabrın 10-da açıqlanacaq, ardınca dekabrın 9-da Fed-in qərarı veriləcək.
44
Tərcüməyə bax
📊 FROM STRENGTH TO WEAKNESS: WHAT CHANGED?
Bitcoin was trading near $86,500 in early October. Now, after five consecutive weekly losses, it has fallen to approximately $74,800. This represents a decline of around 13.6% in five weeks. The latest weekly loss was approximately 4.5%, making it the steepest decline in the current losing streak.
For beginners, a red weekly candle simply means Bitcoin closed the week below its opening price. Five consecutive red candles show that selling pressure has continued for several weeks.
Several factors are affecting market confidence:
1. ETF Outflows: Investors withdrew approximately $1.28 billion from US spot Bitcoin ETFs during the first week of November, adding pressure to the market.
2. Market Uncertainty: Concerns about economic conditions, interest rates and technology stocks have weakened investor confidence.
3. Forced Liquidations: When leveraged traders cannot maintain their positions, exchanges automatically close them. This can create additional selling pressure and accelerate price drops.
📉 WHY FIVE LOSING WEEKS MATTER
Five consecutive weekly losses are unusual in Bitcoin's history. However, this pattern does not automatically mean another major crash is coming.
Previous losing streaks have produced different outcomes. Sometimes prices continued falling, while other times the market recovered. History offers useful lessons, but it cannot guarantee what happens next.
⚠️ WHAT SHOULD INVESTORS WATCH NOW?
Bitcoin's recent low near $73,500 is an important area to monitor. A sustained recovery above $75,000 could help improve short-term confidence. On the other hand, an
other decline below the recent low could increase selling pressure.
Bitcoin's five-week losing streak is a serious warning about market weakness, but it is not proof that recovery is impossible. Patience, research and discipline matter most when the market tests investors.
Crypto trading involves risk, and investors can lose their capital. Manage position sizes carefully, use stop losses and never risk money you cannot afford to lose
📊 FROM STRENGTH TO WEAKNESS: WHAT CHANGED?
Bitcoin was trading near $86,500 in early October. Now, after five consecutive weekly losses, it has fallen to approximately $74,800. This represents a decline of around 13.6% in five weeks. The latest weekly loss was approximately 4.5%, making it the steepest decline in the current losing streak.
For beginners, a red weekly candle simply means Bitcoin closed the week below its opening price. Five consecutive red candles show that selling pressure has continued for several weeks.
Several factors are affecting market confidence:
1. ETF Outflows: Investors withdrew approximately $1.28 billion from US spot Bitcoin ETFs during the first week of November, adding pressure to the market.
2. Market Uncertainty: Concerns about economic conditions, interest rates and technology stocks have weakened investor confidence.
3. Forced Liquidations: When leveraged traders cannot maintain their positions, exchanges automatically close them. This can create additional selling pressure and accelerate price drops.
📉 WHY FIVE LOSING WEEKS MATTER
Five consecutive weekly losses are unusual in Bitcoin's history. However, this pattern does not automatically mean another major crash is coming.
Previous losing streaks have produced different outcomes. Sometimes prices continued falling, while other times the market recovered. History offers useful lessons, but it cannot guarantee what happens next.
⚠️ WHAT SHOULD INVESTORS WATCH NOW?
Bitcoin's recent low near $73,500 is an important area to monitor. A sustained recovery above $75,000 could help improve short-term confidence. On the other hand, an
other decline below the recent low could increase selling pressure.
Bitcoin's five-week losing streak is a serious warning about market weakness, but it is not proof that recovery is impossible. Patience, research and discipline matter most when the market tests investors.
Crypto trading involves risk, and investors can lose their capital. Manage position sizes carefully, use stop losses and never risk money you cannot afford to lose
Bitcoin was trading near $86,500 in early October. Now, after five consecutive weekly losses, it has fallen to approximately $74,800. This represents a decline of around 13.6% in five weeks. The latest weekly loss was approximately 4.5%, making it the steepest decline in the current losing streak.
For beginners, a red weekly candle simply means Bitcoin closed the week below its opening price. Five consecutive red candles show that selling pressure has continued for several weeks.
Several factors are affecting market confidence:
1. ETF Outflows: Investors withdrew approximately $1.28 billion from US spot Bitcoin ETFs during the first week of November, adding pressure to the market.
2. Market Uncertainty: Concerns about economic conditions, interest rates and technology stocks have weakened investor confidence.
3. Forced Liquidations: When leveraged traders cannot maintain their positions, exchanges automatically close them. This can create additional selling pressure and accelerate price drops.
📉 WHY FIVE LOSING WEEKS MATTER
Five consecutive weekly losses are unusual in Bitcoin's history. However, this pattern does not automatically mean another major crash is coming.
Previous losing streaks have produced different outcomes. Sometimes prices continued falling, while other times the market recovered. History offers useful lessons, but it cannot guarantee what happens next.
⚠️ WHAT SHOULD INVESTORS WATCH NOW?
Bitcoin's recent low near $73,500 is an important area to monitor. A sustained recovery above $75,000 could help improve short-term confidence. On the other hand, an
other decline below the recent low could increase selling pressure.
Bitcoin's five-week losing streak is a serious warning about market weakness, but it is not proof that recovery is impossible. Patience, research and discipline matter most when the market tests investors.
Crypto trading involves risk, and investors can lose their capital. Manage position sizes carefully, use stop losses and never risk money you cannot afford to lose
87
NVIDIA-NIN BAŞ DİREKTORU ARAŞDIRMA ALTINDA: HUANGIN ÜZRÜ ƏSLİNDƏ NƏ DEMƏKDİR
🔍 MİF 1: BU, SADƏCƏ ŞƏXSİ MÜNASİBƏTLƏRLƏ BAĞLI QALMAQALDIR
Fakt: Mübahisə Huangın şəxsi həyatından daha geniş məsələləri əhatə edir.
2026-cı il noyabrın 8-də Huang əməkdaşlara göndərdiyi mesajda həyat yoldaşına xəyanət etdiyini etiraf edib. O, ailəsindən, həmkarlarından, direktorlar şurasının üzvlərindən, tərəfdaşlarından və səhmdarlarından üzr istəyərək hərəkətlərinə görə məsuliyyəti üzərinə götürüb.
Lakin daha ciddi narahatlıq onun münasibətdə olduğu qadının Çin kəşfiyyatı ilə əlaqələri olduğundan ABŞ kəşfiyyat rəsmilərinin şübhələnməsi barədə xəbərlərlə bağlıdır.
Bu iddiaların doğru olduğu hələ sübuta yetirilməyib.
⚠️ MİF 2: NVIDIA ARTİQ TƏSDİQLƏNMİŞ MƏLUMAT OĞURLUĞU İLƏ ÜZLƏŞİR
Fakt: Araşdırmanın məqsədi əslində nə baş verdiyini müəyyən etməkdir.
NVIDIA-nın direktorlar şurası kənar hüquq məsləhətçilərinin dəstəyi ilə müstəqil direktorların rəhbərlik etdiyi araşdırmaya başlayıb.
Şirkət hazırda milli təhlükəsizliyin və ya NVIDIA-nın məxfi məlumatlarının təhlükə altına düşdüyünə inanmaq üçün heç bir əsas olmadığını bildirib.
Bu fərq vacibdir. Araşdırmanın aparılması öz-özlüyündə casusluq və ya məlumat oğurluğunun baş verdiyi anlamına gəlmir.
📊 MİF 3: HUANG BAŞ DİREKTOR VƏZİFƏSİNDƏN KƏNARLAŞDIRILIB
Fakt: Araşdırma davam etdiyi müddətdə o, şirkətə rəhbərlik etməyə davam edir.
NVIDIA bildirib ki, Huang fasiləsiz olaraq şirkətə rəhbərlik edəcək. O, həmçinin araşdırma ilə tam əməkdaşlıq edəcəyinə söz verib, şirkəti qorumaq və ABŞ-ın milli təhlükəsizliyini dəstəkləmək öhdəliyini bir daha təsdiqləyib.
Bununla belə, vəziyyət rəhbər şəxslərin məsuliyyəti, korporativ təhlükəsizlik və rəhbərliyin cavabdehliyi ilə bağlı mühüm suallar doğurur.
Bu hadisə xatırladır ki, korporativ rəhbərlik biznes nəticələrindən daha artığını əhatə edir. Etimad, şəffaflıq, şəxsi məsuliyyət və təhlükəsizlik də vacibdir.
NVIDIA üçün əsl sınaq müstəqil araşdırmanın aydın cavablar verib əməkdaşların, müştərilərin və investorların etimadını qoruyub-qoruya bilməyəcəyidir.
Sizcə, bu araşdırma davam edərkən NVIDIA investorların etimadını qoruya biləcəkmi?
NVIDIA-NIN BAŞ DİREKTORU ARAŞDIRMA ALTINDA: HUANGIN ÜZRÜ ƏSLİNDƏ NƏ DEMƏKDİR
🔍 MİF 1: BU, SADƏCƏ ŞƏXSİ MÜNASİBƏTLƏRLƏ BAĞLI QALMAQALDIR
Fakt: Mübahisə Huangın şəxsi həyatından daha geniş məsələləri əhatə edir.
2026-cı il noyabrın 8-də Huang əməkdaşlara göndərdiyi mesajda həyat yoldaşına xəyanət etdiyini etiraf edib. O, ailəsindən, həmkarlarından, direktorlar şurasının üzvlərindən, tərəfdaşlarından və səhmdarlarından üzr istəyərək hərəkətlərinə görə məsuliyyəti üzərinə götürüb.
Lakin daha ciddi narahatlıq onun münasibətdə olduğu qadının Çin kəşfiyyatı ilə əlaqələri olduğundan ABŞ kəşfiyyat rəsmilərinin şübhələnməsi barədə xəbərlərlə bağlıdır.
Bu iddiaların doğru olduğu hələ sübuta yetirilməyib.
⚠️ MİF 2: NVIDIA ARTİQ TƏSDİQLƏNMİŞ MƏLUMAT OĞURLUĞU İLƏ ÜZLƏŞİR
Fakt: Araşdırmanın məqsədi əslində nə baş verdiyini müəyyən etməkdir.
NVIDIA-nın direktorlar şurası kənar hüquq məsləhətçilərinin dəstəyi ilə müstəqil direktorların rəhbərlik etdiyi araşdırmaya başlayıb.
Şirkət hazırda milli təhlükəsizliyin və ya NVIDIA-nın məxfi məlumatlarının təhlükə altına düşdüyünə inanmaq üçün heç bir əsas olmadığını bildirib.
Bu fərq vacibdir. Araşdırmanın aparılması öz-özlüyündə casusluq və ya məlumat oğurluğunun baş verdiyi anlamına gəlmir.
📊 MİF 3: HUANG BAŞ DİREKTOR VƏZİFƏSİNDƏN KƏNARLAŞDIRILIB
Fakt: Araşdırma davam etdiyi müddətdə o, şirkətə rəhbərlik etməyə davam edir.
NVIDIA bildirib ki, Huang fasiləsiz olaraq şirkətə rəhbərlik edəcək. O, həmçinin araşdırma ilə tam əməkdaşlıq edəcəyinə söz verib, şirkəti qorumaq və ABŞ-ın milli təhlükəsizliyini dəstəkləmək öhdəliyini bir daha təsdiqləyib.
Bununla belə, vəziyyət rəhbər şəxslərin məsuliyyəti, korporativ təhlükəsizlik və rəhbərliyin cavabdehliyi ilə bağlı mühüm suallar doğurur.
Bu hadisə xatırladır ki, korporativ rəhbərlik biznes nəticələrindən daha artığını əhatə edir. Etimad, şəffaflıq, şəxsi məsuliyyət və təhlükəsizlik də vacibdir.
NVIDIA üçün əsl sınaq müstəqil araşdırmanın aydın cavablar verib əməkdaşların, müştərilərin və investorların etimadını qoruyub-qoruya bilməyəcəyidir.
Sizcə, bu araşdırma davam edərkən NVIDIA investorların etimadını qoruya biləcəkmi?
🔍 MİF 1: BU, SADƏCƏ ŞƏXSİ MÜNASİBƏTLƏRLƏ BAĞLI QALMAQALDIR
Fakt: Mübahisə Huangın şəxsi həyatından daha geniş məsələləri əhatə edir.
2026-cı il noyabrın 8-də Huang əməkdaşlara göndərdiyi mesajda həyat yoldaşına xəyanət etdiyini etiraf edib. O, ailəsindən, həmkarlarından, direktorlar şurasının üzvlərindən, tərəfdaşlarından və səhmdarlarından üzr istəyərək hərəkətlərinə görə məsuliyyəti üzərinə götürüb.
Lakin daha ciddi narahatlıq onun münasibətdə olduğu qadının Çin kəşfiyyatı ilə əlaqələri olduğundan ABŞ kəşfiyyat rəsmilərinin şübhələnməsi barədə xəbərlərlə bağlıdır.
Bu iddiaların doğru olduğu hələ sübuta yetirilməyib.
⚠️ MİF 2: NVIDIA ARTİQ TƏSDİQLƏNMİŞ MƏLUMAT OĞURLUĞU İLƏ ÜZLƏŞİR
Fakt: Araşdırmanın məqsədi əslində nə baş verdiyini müəyyən etməkdir.
NVIDIA-nın direktorlar şurası kənar hüquq məsləhətçilərinin dəstəyi ilə müstəqil direktorların rəhbərlik etdiyi araşdırmaya başlayıb.
Şirkət hazırda milli təhlükəsizliyin və ya NVIDIA-nın məxfi məlumatlarının təhlükə altına düşdüyünə inanmaq üçün heç bir əsas olmadığını bildirib.
Bu fərq vacibdir. Araşdırmanın aparılması öz-özlüyündə casusluq və ya məlumat oğurluğunun baş verdiyi anlamına gəlmir.
📊 MİF 3: HUANG BAŞ DİREKTOR VƏZİFƏSİNDƏN KƏNARLAŞDIRILIB
Fakt: Araşdırma davam etdiyi müddətdə o, şirkətə rəhbərlik etməyə davam edir.
NVIDIA bildirib ki, Huang fasiləsiz olaraq şirkətə rəhbərlik edəcək. O, həmçinin araşdırma ilə tam əməkdaşlıq edəcəyinə söz verib, şirkəti qorumaq və ABŞ-ın milli təhlükəsizliyini dəstəkləmək öhdəliyini bir daha təsdiqləyib.
Bununla belə, vəziyyət rəhbər şəxslərin məsuliyyəti, korporativ təhlükəsizlik və rəhbərliyin cavabdehliyi ilə bağlı mühüm suallar doğurur.
Bu hadisə xatırladır ki, korporativ rəhbərlik biznes nəticələrindən daha artığını əhatə edir. Etimad, şəffaflıq, şəxsi məsuliyyət və təhlükəsizlik də vacibdir.
NVIDIA üçün əsl sınaq müstəqil araşdırmanın aydın cavablar verib əməkdaşların, müştərilərin və investorların etimadını qoruyub-qoruya bilməyəcəyidir.
Sizcə, bu araşdırma davam edərkən NVIDIA investorların etimadını qoruya biləcəkmi?
292
Tərcüməyə bax
#BinanceProcesses$4.65BWithdrawals
Binance Processes $4.65 Billion in Withdrawals: A Major Test of User Confidence
Binance has processed approximately $4.65 billion in customer withdrawals within the first nine and a half hours after reopening withdrawal services on November 1. The massive movement of funds comes after a reported $6.3 billion security incident that raised serious concerns across the crypto market.
$3.64 Billion in Net Outflows
During the reporting period, Binance processed:
$4.649 billion in withdrawals.
$1.01 billion in deposits.
Approximately $3.64 billion in net outflows.
The net outflow represents around 2.1% of Binance's reported $171 billion in total assets.
Withdrawals Gradually Stabilize
Binance restored withdrawals in phases, beginning at 06:00 UTC on November 1. By 12:36 UTC, withdrawals had resumed across all 15 networks and assets included in the initial phase, covering major cryptocurrencies such as BTC, ETH, BNB, SOL, XRP, USDT and USDC.
The exchange also reported that withdrawal activity had declined after its initial surge, while deposits remained substantial.
Security and Transparency Matter
Binance says it is replacing affected assets using its own resources and has covered approximately 95% of the impacted amount. The exchange is also preparing an updated Proof of Reserves report to provide users with a fresh view of its asset backing.
What Does This Mean for Crypto?
This situation highlights an important lesson for the entire cryptocurrency industry: security, transparency and access to customer funds are essential for maintaining trust.
Billions of dollars in withdrawals do not automatically mean an exchange is collapsing. However, users will closely monitor withdrawal services, reserve reports and the exchange's recovery progress.
The coming days will be important for Binance as it works to restore confidence and demonstrate the strength of its security systems.
For every crypto exchange, trust is built through transparency, strong security and consistent protection of user assets.
#BinanceProcesses$4.65BWithdrawals
Binance Processes $4.65 Billion in Withdrawals: A Major Test of User Confidence
Binance has processed approximately $4.65 billion in customer withdrawals within the first nine and a half hours after reopening withdrawal services on November 1. The massive movement of funds comes after a reported $6.3 billion security incident that raised serious concerns across the crypto market.
$3.64 Billion in Net Outflows
During the reporting period, Binance processed:
$4.649 billion in withdrawals.
$1.01 billion in deposits.
Approximately $3.64 billion in net outflows.
The net outflow represents around 2.1% of Binance's reported $171 billion in total assets.
Withdrawals Gradually Stabilize
Binance restored withdrawals in phases, beginning at 06:00 UTC on November 1. By 12:36 UTC, withdrawals had resumed across all 15 networks and assets included in the initial phase, covering major cryptocurrencies such as BTC, ETH, BNB, SOL, XRP, USDT and USDC.
The exchange also reported that withdrawal activity had declined after its initial surge, while deposits remained substantial.
Security and Transparency Matter
Binance says it is replacing affected assets using its own resources and has covered approximately 95% of the impacted amount. The exchange is also preparing an updated Proof of Reserves report to provide users with a fresh view of its asset backing.
What Does This Mean for Crypto?
This situation highlights an important lesson for the entire cryptocurrency industry: security, transparency and access to customer funds are essential for maintaining trust.
Billions of dollars in withdrawals do not automatically mean an exchange is collapsing. However, users will closely monitor withdrawal services, reserve reports and the exchange's recovery progress.
The coming days will be important for Binance as it works to restore confidence and demonstrate the strength of its security systems.
For every crypto exchange, trust is built through transparency, strong security and consistent protection of user assets.
Binance Processes $4.65 Billion in Withdrawals: A Major Test of User Confidence
Binance has processed approximately $4.65 billion in customer withdrawals within the first nine and a half hours after reopening withdrawal services on November 1. The massive movement of funds comes after a reported $6.3 billion security incident that raised serious concerns across the crypto market.
$3.64 Billion in Net Outflows
During the reporting period, Binance processed:
$4.649 billion in withdrawals.
$1.01 billion in deposits.
Approximately $3.64 billion in net outflows.
The net outflow represents around 2.1% of Binance's reported $171 billion in total assets.
Withdrawals Gradually Stabilize
Binance restored withdrawals in phases, beginning at 06:00 UTC on November 1. By 12:36 UTC, withdrawals had resumed across all 15 networks and assets included in the initial phase, covering major cryptocurrencies such as BTC, ETH, BNB, SOL, XRP, USDT and USDC.
The exchange also reported that withdrawal activity had declined after its initial surge, while deposits remained substantial.
Security and Transparency Matter
Binance says it is replacing affected assets using its own resources and has covered approximately 95% of the impacted amount. The exchange is also preparing an updated Proof of Reserves report to provide users with a fresh view of its asset backing.
What Does This Mean for Crypto?
This situation highlights an important lesson for the entire cryptocurrency industry: security, transparency and access to customer funds are essential for maintaining trust.
Billions of dollars in withdrawals do not automatically mean an exchange is collapsing. However, users will closely monitor withdrawal services, reserve reports and the exchange's recovery progress.
The coming days will be important for Binance as it works to restore confidence and demonstrate the strength of its security systems.
For every crypto exchange, trust is built through transparency, strong security and consistent protection of user assets.
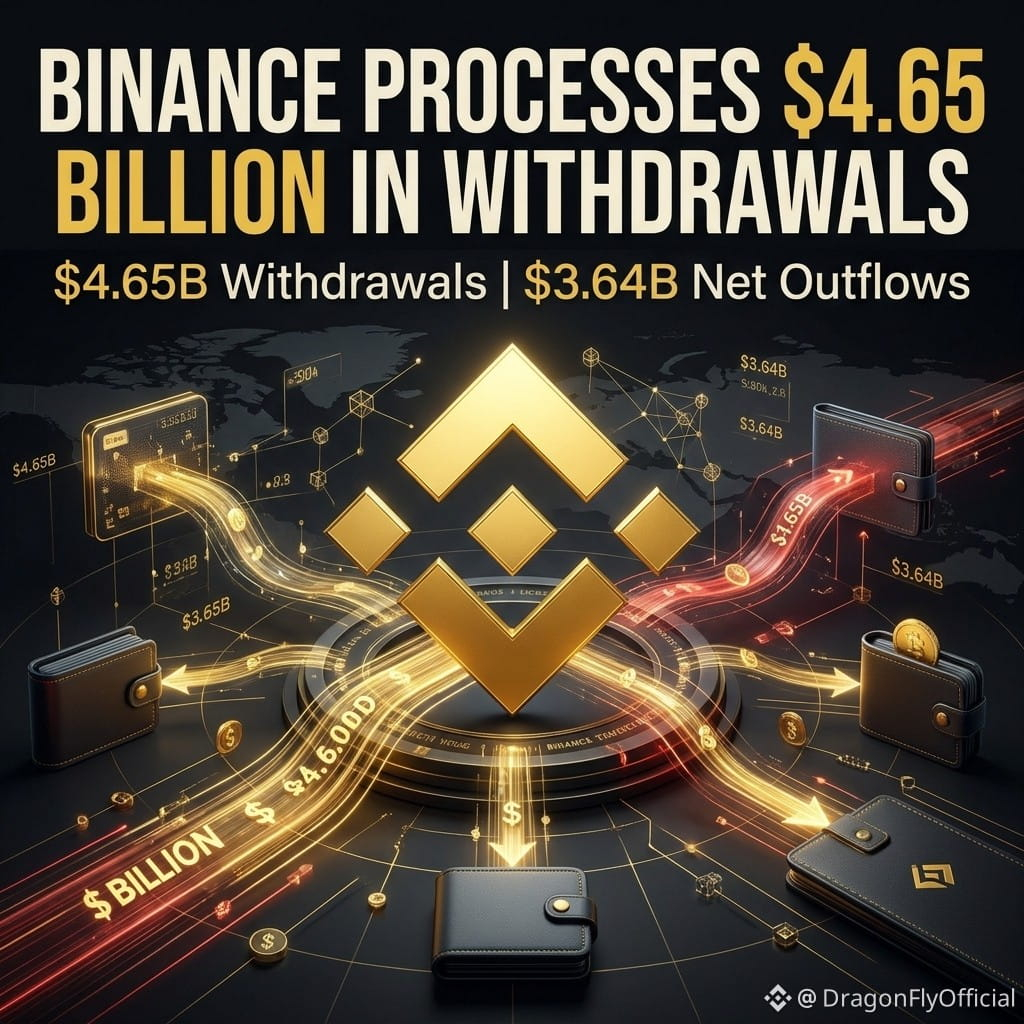
1
81
$1,5 milyardlıq məcburi bağlanma: Bazar etimadı nə vaxt leverage tələsinə çevrilir
MİF
Bir çox treyder kriptovalyuta bazarı kəskin düşəndə yalnız yanlış vaxtda alış edən investorların pul itirdiyini düşünür. Amma reallıq daha mürəkkəbdir. Bazarda qəfil eniş minlərlə leverecli mövqenin avtomatik bağlanmasına səbəb ola və bütün bazar üzrə təzyiqi daha da artıra bilər.
Məhz bu, 30 oktyabr 2026-cı ildə baş verdi: 24 saat ərzində təxminən 1,53 milyard dollar dəyərində leverecli kriptovalyuta mövqeyi məcburi bağlandı.
ZƏRƏR
Rəqəmlər bazarda qiymətlərin yüksələcəyinə nə qədər güclü mərc edildiyini göstərir.
Təxminən 1,29 milyard dollar uzun mövqelərin payına düşürdü ki, bu da bütün məcburi bağlanmaların təxminən 83,8%-ni təşkil edirdi. Uzun mövqelər kriptovalyuta qiymətlərinin artacağını gözləyən əməliyyatlardır.
240.000-dən çox treyder zərər çəkdi. Bu, bazar dəyişkənliyinin müxtəlif ticarət platformalarında iştirakçılara nə qədər tez təsir edə biləcəyini göstərir.
Məcburi bağlanmaların təxminən 499 milyon dolları Bitcoin-in, daha 358 milyon dolları isə Ethereum-un payına düşürdü. Solana, XRP və Dogecoin də əhəmiyyətli sayda məcburi bağlanma ilə üzləşdi.
ÜSTÜNLÜK
Məcburi bağlanmalar zərər çəkən treyderlər üçün ciddi itkilər yaratsa da, bazarın strukturunu dəyişə bilər.
Həddindən artıq leverec aradan qalxdıqda, bazarda yüksək riskli mövqelərin sıxlığı azala bilər. Bu, borc vəsaitlərindən istifadə edən treyderlərin yaratdığı təzyiqi qismən azalda bilər.
Digər mühüm məqam qiymətlərin hər iki istiqamətdə hərəkət etməsi idi. İlkin enişdən sonra qiymətlər bərpa olunmağa başladı və daha da düşəcəyinə mərc edən treyderlər təzyiq altında qaldı.
Bu, məcburi bağlanma hadisələrinin bazarın avtomatik olaraq eyni istiqamətdə hərəkət etməyə davam edəcəyi demək olmadığını göstərir.
ƏN BÖYÜK RİSK
Problem leverecin necə işləməsidir.
Təsəvvür edin ki, treyder öz vəsaitindən cəmi 1.000 dollar istifadə edərək 10.000 dollarlıq mövqe açır. Bu mövqeyə qarşı nisbətən kiçik qiymət dəyişikliyi belə ilkin kapitala nisbətdə böyük zərər yarada bilər.
$1,5 milyardlıq məcburi bağlanma: Bazar etimadı nə vaxt leverage tələsinə çevrilir
MİF
Bir çox treyder kriptovalyuta bazarı kəskin düşəndə yalnız yanlış vaxtda alış edən investorların pul itirdiyini düşünür. Amma reallıq daha mürəkkəbdir. Bazarda qəfil eniş minlərlə leverecli mövqenin avtomatik bağlanmasına səbəb ola və bütün bazar üzrə təzyiqi daha da artıra bilər.
Məhz bu, 30 oktyabr 2026-cı ildə baş verdi: 24 saat ərzində təxminən 1,53 milyard dollar dəyərində leverecli kriptovalyuta mövqeyi məcburi bağlandı.
ZƏRƏR
Rəqəmlər bazarda qiymətlərin yüksələcəyinə nə qədər güclü mərc edildiyini göstərir.
Təxminən 1,29 milyard dollar uzun mövqelərin payına düşürdü ki, bu da bütün məcburi bağlanmaların təxminən 83,8%-ni təşkil edirdi. Uzun mövqelər kriptovalyuta qiymətlərinin artacağını gözləyən əməliyyatlardır.
240.000-dən çox treyder zərər çəkdi. Bu, bazar dəyişkənliyinin müxtəlif ticarət platformalarında iştirakçılara nə qədər tez təsir edə biləcəyini göstərir.
Məcburi bağlanmaların təxminən 499 milyon dolları Bitcoin-in, daha 358 milyon dolları isə Ethereum-un payına düşürdü. Solana, XRP və Dogecoin də əhəmiyyətli sayda məcburi bağlanma ilə üzləşdi.
ÜSTÜNLÜK
Məcburi bağlanmalar zərər çəkən treyderlər üçün ciddi itkilər yaratsa da, bazarın strukturunu dəyişə bilər.
Həddindən artıq leverec aradan qalxdıqda, bazarda yüksək riskli mövqelərin sıxlığı azala bilər. Bu, borc vəsaitlərindən istifadə edən treyderlərin yaratdığı təzyiqi qismən azalda bilər.
Digər mühüm məqam qiymətlərin hər iki istiqamətdə hərəkət etməsi idi. İlkin enişdən sonra qiymətlər bərpa olunmağa başladı və daha da düşəcəyinə mərc edən treyderlər təzyiq altında qaldı.
Bu, məcburi bağlanma hadisələrinin bazarın avtomatik olaraq eyni istiqamətdə hərəkət etməyə davam edəcəyi demək olmadığını göstərir.
ƏN BÖYÜK RİSK
Problem leverecin necə işləməsidir.
Təsəvvür edin ki, treyder öz vəsaitindən cəmi 1.000 dollar istifadə edərək 10.000 dollarlıq mövqe açır. Bu mövqeyə qarşı nisbətən kiçik qiymət dəyişikliyi belə ilkin kapitala nisbətdə böyük zərər yarada bilər.
MİF
Bir çox treyder kriptovalyuta bazarı kəskin düşəndə yalnız yanlış vaxtda alış edən investorların pul itirdiyini düşünür. Amma reallıq daha mürəkkəbdir. Bazarda qəfil eniş minlərlə leverecli mövqenin avtomatik bağlanmasına səbəb ola və bütün bazar üzrə təzyiqi daha da artıra bilər.
Məhz bu, 30 oktyabr 2026-cı ildə baş verdi: 24 saat ərzində təxminən 1,53 milyard dollar dəyərində leverecli kriptovalyuta mövqeyi məcburi bağlandı.
ZƏRƏR
Rəqəmlər bazarda qiymətlərin yüksələcəyinə nə qədər güclü mərc edildiyini göstərir.
Təxminən 1,29 milyard dollar uzun mövqelərin payına düşürdü ki, bu da bütün məcburi bağlanmaların təxminən 83,8%-ni təşkil edirdi. Uzun mövqelər kriptovalyuta qiymətlərinin artacağını gözləyən əməliyyatlardır.
240.000-dən çox treyder zərər çəkdi. Bu, bazar dəyişkənliyinin müxtəlif ticarət platformalarında iştirakçılara nə qədər tez təsir edə biləcəyini göstərir.
Məcburi bağlanmaların təxminən 499 milyon dolları Bitcoin-in, daha 358 milyon dolları isə Ethereum-un payına düşürdü. Solana, XRP və Dogecoin də əhəmiyyətli sayda məcburi bağlanma ilə üzləşdi.
ÜSTÜNLÜK
Məcburi bağlanmalar zərər çəkən treyderlər üçün ciddi itkilər yaratsa da, bazarın strukturunu dəyişə bilər.
Həddindən artıq leverec aradan qalxdıqda, bazarda yüksək riskli mövqelərin sıxlığı azala bilər. Bu, borc vəsaitlərindən istifadə edən treyderlərin yaratdığı təzyiqi qismən azalda bilər.
Digər mühüm məqam qiymətlərin hər iki istiqamətdə hərəkət etməsi idi. İlkin enişdən sonra qiymətlər bərpa olunmağa başladı və daha da düşəcəyinə mərc edən treyderlər təzyiq altında qaldı.
Bu, məcburi bağlanma hadisələrinin bazarın avtomatik olaraq eyni istiqamətdə hərəkət etməyə davam edəcəyi demək olmadığını göstərir.
ƏN BÖYÜK RİSK
Problem leverecin necə işləməsidir.
Təsəvvür edin ki, treyder öz vəsaitindən cəmi 1.000 dollar istifadə edərək 10.000 dollarlıq mövqe açır. Bu mövqeyə qarşı nisbətən kiçik qiymət dəyişikliyi belə ilkin kapitala nisbətdə böyük zərər yarada bilər.

1
142
Tərcüməyə bax
FedWatch: The Market Is Not Expecting What You Think
MYTH: FedWatch Predicts the Federal Reserve's Next Decision
Many people look at FedWatch and assume it tells them exactly what the Federal Reserve will do at its next meeting. That is not true.
FACT: FedWatch Measures Market Expectations
FedWatch is a tool that estimates the probability of future Federal Reserve interest rate decisions. It uses prices from 30-day federal funds futures contracts to calculate what interest rate traders are expecting.
In simple words, it shows whether market participants think the Fed is more likely to raise rates, cut rates, or keep them unchanged.
But there is one important difference: market expectations are not official Fed decisions.
MYTH: A High Probability Means the Decision Is Guaranteed
Imagine FedWatch shows an 80% probability of an interest rate cut. Does that mean the Fed must cut rates?
Absolutely not.
An 80% probability represents market pricing, not a promise. The remaining possibility still matters, and expectations can change quickly when new economic information becomes available.
A probability of 80% does not mean the Fed has already made its decision.
FACT: Economic Data Can Change Everything
Interest rate expectations are closely connected to the health of the US economy.
There are several important factors that market participants watch:
Inflation: If prices continue rising too quickly, the Fed may keep rates higher or consider further increases.
Employment: A strong labour market can give policymakers more room to maintain tighter monetary policy.
Economic growth: Strong growth can support higher rates, while weakening activity may increase the case for cuts.
Consumer spending: Changes in household spending can provide clues about future inflation and economic demand.
Financial conditions: Borrowing costs, credit availability and broader financial stability also influence policy decisions.
This is why FedWatch probabilities can change after important economic reports, even when the next Fed meeting is still weeks away.
FedWatch: The Market Is Not Expecting What You Think
MYTH: FedWatch Predicts the Federal Reserve's Next Decision
Many people look at FedWatch and assume it tells them exactly what the Federal Reserve will do at its next meeting. That is not true.
FACT: FedWatch Measures Market Expectations
FedWatch is a tool that estimates the probability of future Federal Reserve interest rate decisions. It uses prices from 30-day federal funds futures contracts to calculate what interest rate traders are expecting.
In simple words, it shows whether market participants think the Fed is more likely to raise rates, cut rates, or keep them unchanged.
But there is one important difference: market expectations are not official Fed decisions.
MYTH: A High Probability Means the Decision Is Guaranteed
Imagine FedWatch shows an 80% probability of an interest rate cut. Does that mean the Fed must cut rates?
Absolutely not.
An 80% probability represents market pricing, not a promise. The remaining possibility still matters, and expectations can change quickly when new economic information becomes available.
A probability of 80% does not mean the Fed has already made its decision.
FACT: Economic Data Can Change Everything
Interest rate expectations are closely connected to the health of the US economy.
There are several important factors that market participants watch:
Inflation: If prices continue rising too quickly, the Fed may keep rates higher or consider further increases.
Employment: A strong labour market can give policymakers more room to maintain tighter monetary policy.
Economic growth: Strong growth can support higher rates, while weakening activity may increase the case for cuts.
Consumer spending: Changes in household spending can provide clues about future inflation and economic demand.
Financial conditions: Borrowing costs, credit availability and broader financial stability also influence policy decisions.
This is why FedWatch probabilities can change after important economic reports, even when the next Fed meeting is still weeks away.
MYTH: FedWatch Predicts the Federal Reserve's Next Decision
Many people look at FedWatch and assume it tells them exactly what the Federal Reserve will do at its next meeting. That is not true.
FACT: FedWatch Measures Market Expectations
FedWatch is a tool that estimates the probability of future Federal Reserve interest rate decisions. It uses prices from 30-day federal funds futures contracts to calculate what interest rate traders are expecting.
In simple words, it shows whether market participants think the Fed is more likely to raise rates, cut rates, or keep them unchanged.
But there is one important difference: market expectations are not official Fed decisions.
MYTH: A High Probability Means the Decision Is Guaranteed
Imagine FedWatch shows an 80% probability of an interest rate cut. Does that mean the Fed must cut rates?
Absolutely not.
An 80% probability represents market pricing, not a promise. The remaining possibility still matters, and expectations can change quickly when new economic information becomes available.
A probability of 80% does not mean the Fed has already made its decision.
FACT: Economic Data Can Change Everything
Interest rate expectations are closely connected to the health of the US economy.
There are several important factors that market participants watch:
Inflation: If prices continue rising too quickly, the Fed may keep rates higher or consider further increases.
Employment: A strong labour market can give policymakers more room to maintain tighter monetary policy.
Economic growth: Strong growth can support higher rates, while weakening activity may increase the case for cuts.
Consumer spending: Changes in household spending can provide clues about future inflation and economic demand.
Financial conditions: Borrowing costs, credit availability and broader financial stability also influence policy decisions.
This is why FedWatch probabilities can change after important economic reports, even when the next Fed meeting is still weeks away.
69
Daha çox kontent araşdırmaq üçün daxil olun
Binance Square-də qlobal kriptovalyuta istifadəçilərinə qoşulun
⚡️ Kriptovalyuta haqqında ən son və faydalı məlumatları əldə edin.
💬 Dünyanın ən böyük kriptovalyuta birjası tərəfindən etibar edilir.
👍 Doğrulanmış yaradıcılardan gələn real məlumatları kəşf edin.
E-poçt/Telefon nömrəsi
Trenddə olan mövzular
CPITestsDecemberRateOutlook
740,421 baxış
Müzakirə edir: 3,606
Oktyabrda İstehlak Qiymətləri İndeksinin 0,3% Artacağı Gözlənilir; Bu, Fed-in Dekabrda Faiz Artırımı Planını Dəstəkləyir
Binance News
·8 bəyənmə
·10.2k baxış
AnthropicRejectsIPODelayValuationinQuestion
81,201 baxış
Müzakirə edir: 758
NvidiaInvestigatesAfterHuang’sAffairApology
299,360 baxış
Müzakirə edir: 2,319