
#layer1
layer1
5M baxış
Müzakirə edir: 26,232
Populyar
Sonuncu
·
--
$2.34-dəki NEAR hələ də 20D və 50D hərəkətli ortalamalarının üstündədir; bu arada bu gün $31.71M həcm fonunda 0.93% ucuzlaşıb. Daha böyük tezis isə Yanvar 2027 hədəfidir: planlaşdırılan $1,000 mövqeyi $2,166.40-a çevriləcək, yəni 116.64% ROI. Proqnozlar 2026-da orta hesabla $3.98, 2027-də $4.52 və 2029-a qədər $7.43-u göstərir. Qısamüddətli impuls daha sakitdir: 4H RSI 47 səviyyəsindədir və həcm yalnız 20D orta həcmindən 0.6x-dir. Long-lar 0.010% funding ödəyir, ona görə səbir önəmlidir. $NEAR #NEAR #Altcoin #Layer1 🚀📈
Binance Square-də syed ali ahmed-dən ilham alınıb.
$2.34-dəki NEAR hələ də 20D və 50D hərəkətli ortalamalarının üstündədir; bu arada bu gün $31.71M həcm fonunda 0.93% ucuzlaşıb. Daha böyük tezis isə Yanvar 2027 hədəfidir: planlaşdırılan $1,000 mövqeyi $2,166.40-a çevriləcək, yəni 116.64% ROI. Proqnozlar 2026-da orta hesabla $3.98, 2027-də $4.52 və 2029-a qədər $7.43-u göstərir. Qısamüddətli impuls daha sakitdir: 4H RSI 47 səviyyəsindədir və həcm yalnız 20D orta həcmindən 0.6x-dir. Long-lar 0.010% funding ödəyir, ona görə səbir önəmlidir. $NEAR #NEAR #Altcoin #Layer1 🚀📈
Binance Square-də syed ali ahmed-dən ilham alınıb.
Binance Square-də syed ali ahmed-dən ilham alınıb.

61

·
--
Tərcüməyə bax
Can $SUI challenge the top Layer-1 networks this cycle? ⚡
Sui’s object-centric model and lightning-fast finality have attracted serious developer attention and fresh DeFi liquidity. On-chain volume has seen massive surges over recent months.
💡 Key takeaway: Fast chains fight for market share, but holding total value locked (TVL) during corrections is the true test.
Are you Bullish on $SUI or holding alternative Layer-1s? Let me know your top pick! 📊
#SuiNetwork #Layer1 #defi
Can $SUI challenge the top Layer-1 networks this cycle? ⚡
Sui’s object-centric model and lightning-fast finality have attracted serious developer attention and fresh DeFi liquidity. On-chain volume has seen massive surges over recent months.
💡 Key takeaway: Fast chains fight for market share, but holding total value locked (TVL) during corrections is the true test.
Are you Bullish on $SUI or holding alternative Layer-1s? Let me know your top pick! 📊
#SuiNetwork #Layer1 #defi
Sui’s object-centric model and lightning-fast finality have attracted serious developer attention and fresh DeFi liquidity. On-chain volume has seen massive surges over recent months.
💡 Key takeaway: Fast chains fight for market share, but holding total value locked (TVL) during corrections is the true test.
Are you Bullish on $SUI or holding alternative Layer-1s? Let me know your top pick! 📊
#SuiNetwork #Layer1 #defi
46

Tərcüməyə bax
PORTAL & NEO: Monitoring and Layer 1/Layer 2 Intraday Momentum
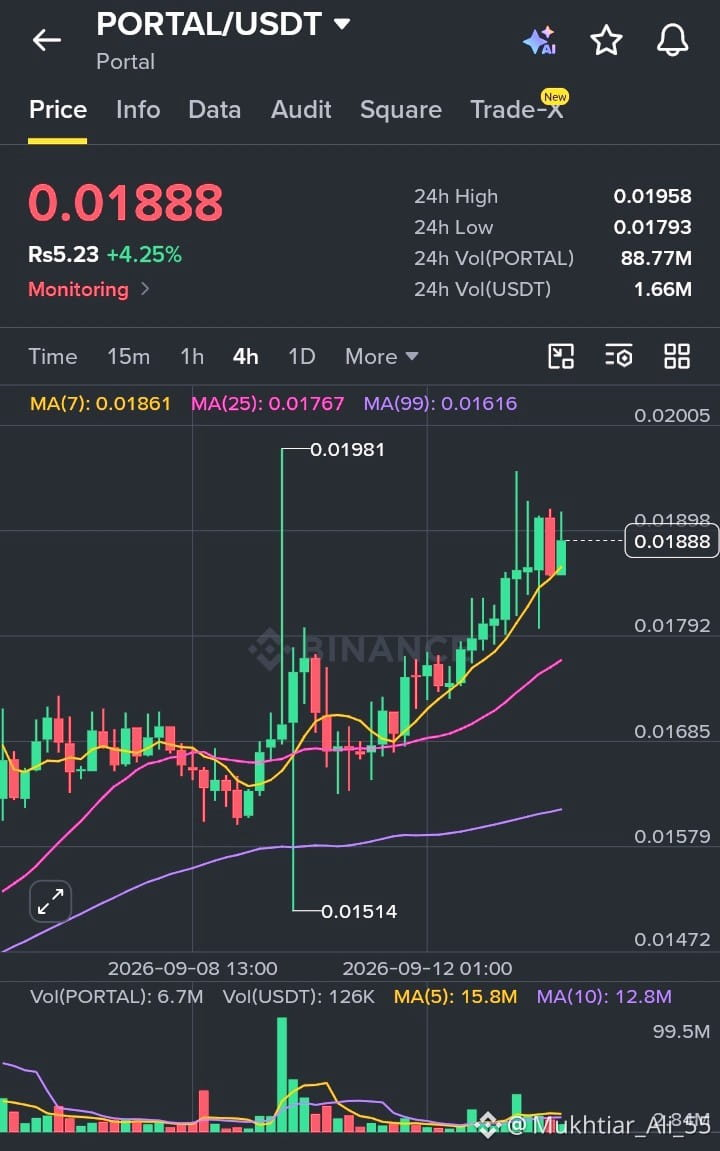
PORTAL is trading at $0.01888, up approximately +4.25% over the latest 24-hour session. The token reached a high of $0.01958 and a low of $0.01793, with around 1.66M USDT in quoted trading volume (88.77M PORTAL). This upward movement signals strong short-term participation, while the daily range highlights ongoing volatility near the current price area.
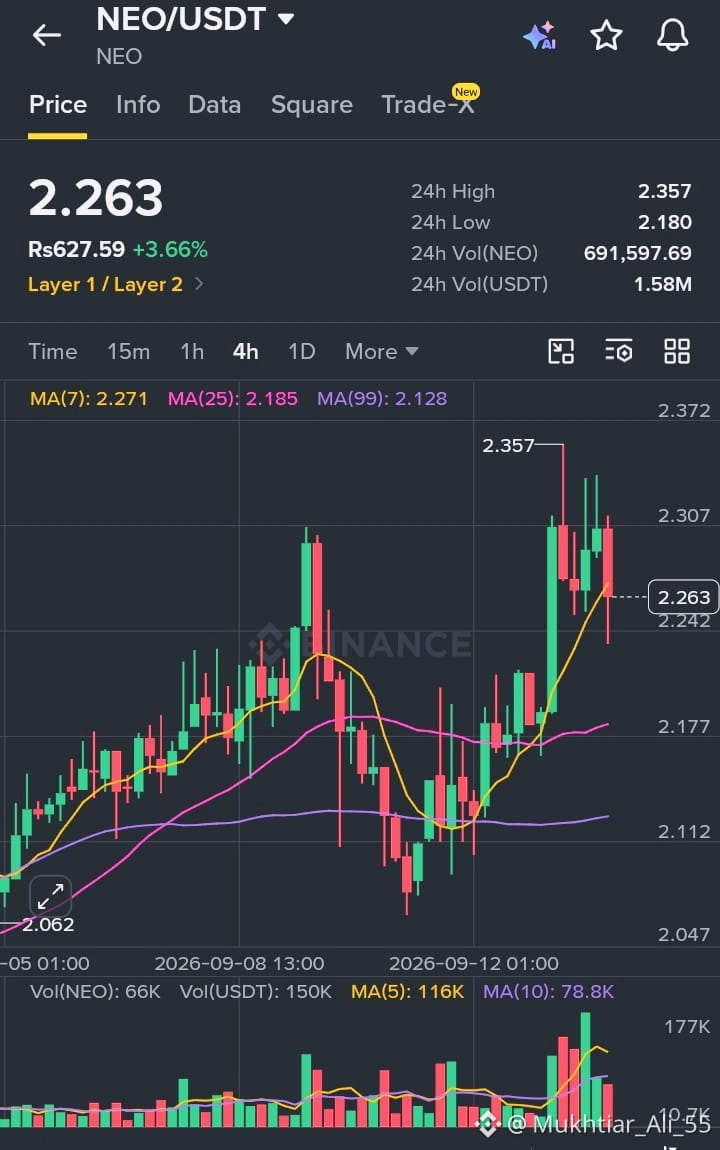
NEO is trading near $2.263, up approximately +3.66% over the latest 24 hours. The Layer 1 / Layer 2 token moved between a high of $2.357 and a low of $2.180, while quoted volume reached roughly 1.58M USDT (691,597.69 NEO). NEO’s advance stands out for its steady recovery from session lows, showing renewed interest; however, the pullback from the intraday high suggests traders are still testing whether momentum can sustain.
Across both assets, PORTAL has shown active momentum within its monitoring category, while NEO has posted a notable recovery profile in the Layer 1 / Layer 2 sector. The common theme is rising participation, but each asset remains exposed to rapid sentiment shifts and broader crypto-market conditions.
#CryptoTrading #PORTAL #NEO #Layer1 #MarketUpdate
$PORTAL
{spot}(PORTALUSDT)
$NEO
{spot}(NEOUSDT)
PORTAL & NEO: Monitoring and Layer 1/Layer 2 Intraday Momentum
PORTAL is trading at $0.01888, up approximately +4.25% over the latest 24-hour session. The token reached a high of $0.01958 and a low of $0.01793, with around 1.66M USDT in quoted trading volume (88.77M PORTAL). This upward movement signals strong short-term participation, while the daily range highlights ongoing volatility near the current price area.
NEO is trading near $2.263, up approximately +3.66% over the latest 24 hours. The Layer 1 / Layer 2 token moved between a high of $2.357 and a low of $2.180, while quoted volume reached roughly 1.58M USDT (691,597.69 NEO). NEO’s advance stands out for its steady recovery from session lows, showing renewed interest; however, the pullback from the intraday high suggests traders are still testing whether momentum can sustain.
Across both assets, PORTAL has shown active momentum within its monitoring category, while NEO has posted a notable recovery profile in the Layer 1 / Layer 2 sector. The common theme is rising participation, but each asset remains exposed to rapid sentiment shifts and broader crypto-market conditions.
#CryptoTrading #PORTAL #NEO #Layer1 #MarketUpdate
$PORTAL
$NEO
PORTAL is trading at $0.01888, up approximately +4.25% over the latest 24-hour session. The token reached a high of $0.01958 and a low of $0.01793, with around 1.66M USDT in quoted trading volume (88.77M PORTAL). This upward movement signals strong short-term participation, while the daily range highlights ongoing volatility near the current price area.
NEO is trading near $2.263, up approximately +3.66% over the latest 24 hours. The Layer 1 / Layer 2 token moved between a high of $2.357 and a low of $2.180, while quoted volume reached roughly 1.58M USDT (691,597.69 NEO). NEO’s advance stands out for its steady recovery from session lows, showing renewed interest; however, the pullback from the intraday high suggests traders are still testing whether momentum can sustain.
Across both assets, PORTAL has shown active momentum within its monitoring category, while NEO has posted a notable recovery profile in the Layer 1 / Layer 2 sector. The common theme is rising participation, but each asset remains exposed to rapid sentiment shifts and broader crypto-market conditions.
#CryptoTrading #PORTAL #NEO #Layer1 #MarketUpdate
$PORTAL
$NEO
70
·
--
Artım
Tərcüməyə bax
عملة Lisk تشهد قفزة هائلة وسط أنباء عن إنهاء عمل شبكة Lisk وتقلبات في التداول.. سجلت عملة Lisk (الرمز: LSK) ارتفاعاً حاداً بنسبة 344% رغم الأنباء المتعلقة بإنهاء عمل شبكة Lisk، مما أدى إلى تقلبات كبيرة في السوق؛ حيث تمت تصفية مراكز بيع على المكشوف بقيمة 36 مليون دولار تزامناً مع صعود سعر العملة لفترة وجيزة ليصل إلى 2.37 دولار.
#layer #Layer1 #Layer2 #DePIN
$LSK
{spot}(LSKUSDT)
عملة Lisk تشهد قفزة هائلة وسط أنباء عن إنهاء عمل شبكة Lisk وتقلبات في التداول.. سجلت عملة Lisk (الرمز: LSK) ارتفاعاً حاداً بنسبة 344% رغم الأنباء المتعلقة بإنهاء عمل شبكة Lisk، مما أدى إلى تقلبات كبيرة في السوق؛ حيث تمت تصفية مراكز بيع على المكشوف بقيمة 36 مليون دولار تزامناً مع صعود سعر العملة لفترة وجيزة ليصل إلى 2.37 دولار.
#layer #Layer1 #Layer2 #DePIN
$LSK
#layer #Layer1 #Layer2 #DePIN
$LSK
1
80

·
--
Tərcüməyə bax
The L1 Metric Nobody Talks About: Developer-to-TVL Ratio
Market cap rankings. TPS benchmarks. TVL leaderboards. These dominate Layer 1 debates. They also lag reality.
The most predictive L1 metric I know is almost never discussed: developer-to-TVL ratio.
Here's the thesis. Chains with high TVL but few active developers are sitting on borrowed capital. Their liquidity came from incentive programs and narrative cycles. When those end, the capital leaves. They look strong but are structurally fragile.
Chains with many active developers but modest TVL are in the opposite position. They're building infrastructure that compounds — more apps attract more users, more users attract more liquidity. TVL follows developers, not the reverse.
This is the closest thing crypto has to a price-to-earnings ratio. It measures productive capacity relative to current market recognition.
Right now this metric reveals a clear divergence. Several mid-cap Layer 1s have developer activity substantially exceeding their TVL ranking — building tomorrow's infrastructure at today's valuations.
The chains that win the next cycle won't be the ones with the highest TPS or the flashiest marketing. They'll be the ones with the deepest, most durable builder communities.
That's not a narrative. It's a leading indicator.
$ETH $SOL $BNB
#Layer1 #Crypto #Web3 #Blockchain
The L1 Metric Nobody Talks About: Developer-to-TVL Ratio
Market cap rankings. TPS benchmarks. TVL leaderboards. These dominate Layer 1 debates. They also lag reality.
The most predictive L1 metric I know is almost never discussed: developer-to-TVL ratio.
Here's the thesis. Chains with high TVL but few active developers are sitting on borrowed capital. Their liquidity came from incentive programs and narrative cycles. When those end, the capital leaves. They look strong but are structurally fragile.
Chains with many active developers but modest TVL are in the opposite position. They're building infrastructure that compounds — more apps attract more users, more users attract more liquidity. TVL follows developers, not the reverse.
This is the closest thing crypto has to a price-to-earnings ratio. It measures productive capacity relative to current market recognition.
Right now this metric reveals a clear divergence. Several mid-cap Layer 1s have developer activity substantially exceeding their TVL ranking — building tomorrow's infrastructure at today's valuations.
The chains that win the next cycle won't be the ones with the highest TPS or the flashiest marketing. They'll be the ones with the deepest, most durable builder communities.
That's not a narrative. It's a leading indicator.
$ETH $SOL $BNB
#Layer1 #Crypto #Web3 #Blockchain
Market cap rankings. TPS benchmarks. TVL leaderboards. These dominate Layer 1 debates. They also lag reality.
The most predictive L1 metric I know is almost never discussed: developer-to-TVL ratio.
Here's the thesis. Chains with high TVL but few active developers are sitting on borrowed capital. Their liquidity came from incentive programs and narrative cycles. When those end, the capital leaves. They look strong but are structurally fragile.
Chains with many active developers but modest TVL are in the opposite position. They're building infrastructure that compounds — more apps attract more users, more users attract more liquidity. TVL follows developers, not the reverse.
This is the closest thing crypto has to a price-to-earnings ratio. It measures productive capacity relative to current market recognition.
Right now this metric reveals a clear divergence. Several mid-cap Layer 1s have developer activity substantially exceeding their TVL ranking — building tomorrow's infrastructure at today's valuations.
The chains that win the next cycle won't be the ones with the highest TPS or the flashiest marketing. They'll be the ones with the deepest, most durable builder communities.
That's not a narrative. It's a leading indicator.
$ETH $SOL $BNB
#Layer1 #Crypto #Web3 #Blockchain
1
47

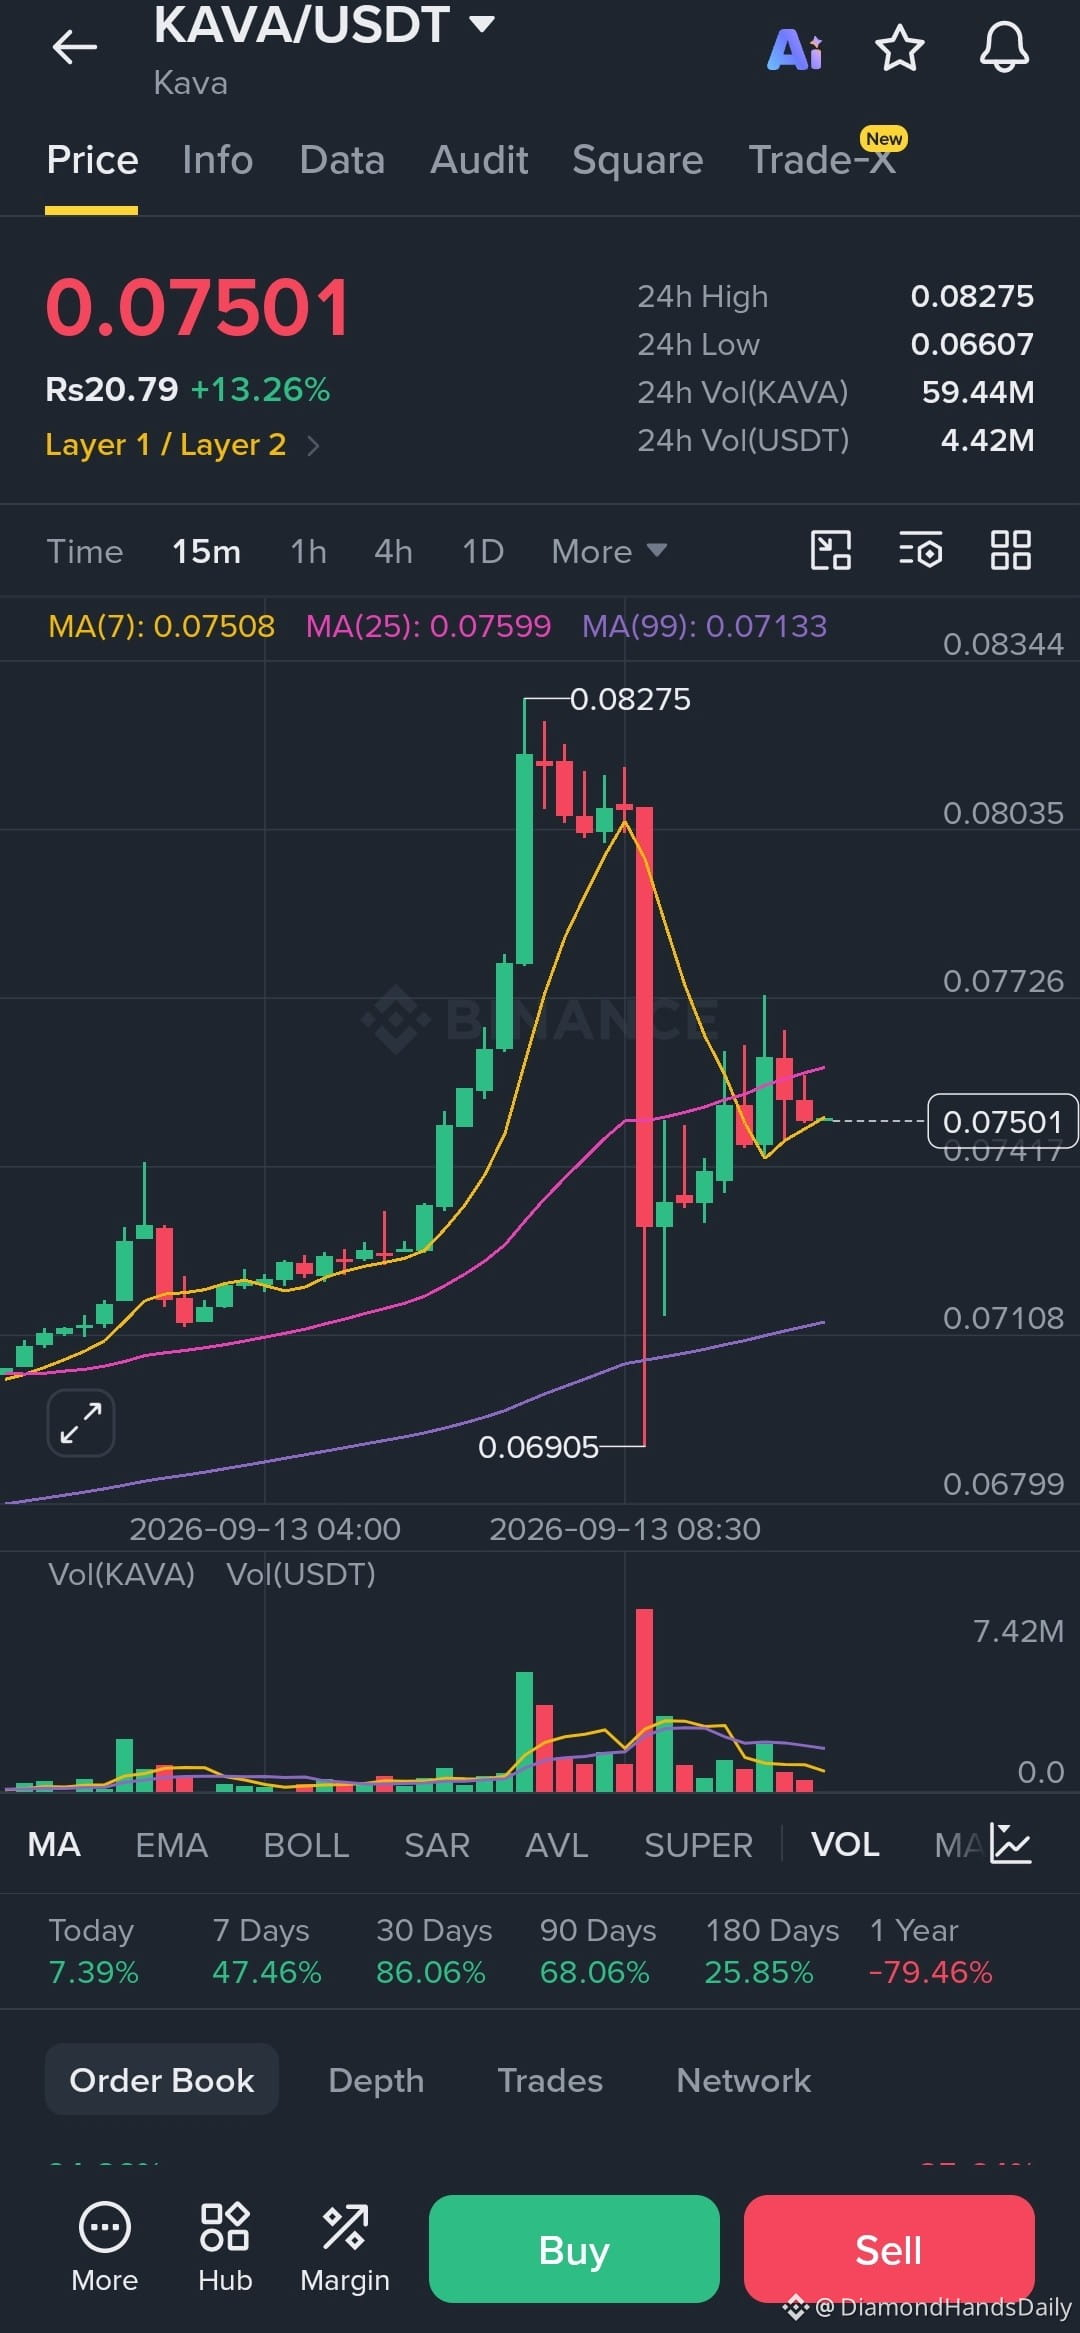
🚀 $KAVA bu bazar şənbə səhəri qızışır! 🚀
Ümumi bazar hələ də sönük olsa da, $KAVA just indi daha bir güclü yaşıl şam çap etdi — hazırda **$0.074–0.076** civarında, son 24 saatda **+11–13%**, həftəlik isə demək olar ki **+50%**.
Alıcılar tam nəzarətdədir. Qiymət bütün əsas hərəkətli ortalamaların üzərindədir, həcm artmaqdadır və bu, gündəlik artanlar siyahısında liderlik edən faktiki olaraq az sayda Layer-1-dən biridir.
Kava-nın dərin USDT likvidliyi, real dünya aktivləri və AI infrastrukturu üzərindəki hədəfləri artıq özünü göstərməyə başlayıb. Bu cür impuls hər həftəsonu görünmür.
Biz sadəcə başlayırıq… yoxsa əvvəlcə nəfəs alırıq?
Aşağıda chart səviyyələrini və hədəflərini paylaş 👇
Bu hərəkət boyunca hələ də $KAVA -ni saxlayan kimlər var?
#KAVA #BinanceSquare #crypto #altcoins #Layer1
{future}(KAVAUSDT)
🚀 $KAVA bu bazar şənbə səhəri qızışır! 🚀
Ümumi bazar hələ də sönük olsa da, $KAVA just indi daha bir güclü yaşıl şam çap etdi — hazırda **$0.074–0.076** civarında, son 24 saatda **+11–13%**, həftəlik isə demək olar ki **+50%**.
Alıcılar tam nəzarətdədir. Qiymət bütün əsas hərəkətli ortalamaların üzərindədir, həcm artmaqdadır və bu, gündəlik artanlar siyahısında liderlik edən faktiki olaraq az sayda Layer-1-dən biridir.
Kava-nın dərin USDT likvidliyi, real dünya aktivləri və AI infrastrukturu üzərindəki hədəfləri artıq özünü göstərməyə başlayıb. Bu cür impuls hər həftəsonu görünmür.
Biz sadəcə başlayırıq… yoxsa əvvəlcə nəfəs alırıq?
Aşağıda chart səviyyələrini və hədəflərini paylaş 👇
Bu hərəkət boyunca hələ də $KAVA -ni saxlayan kimlər var?
#KAVA #BinanceSquare #crypto #altcoins #Layer1
Ümumi bazar hələ də sönük olsa da, $KAVA just indi daha bir güclü yaşıl şam çap etdi — hazırda **$0.074–0.076** civarında, son 24 saatda **+11–13%**, həftəlik isə demək olar ki **+50%**.
Alıcılar tam nəzarətdədir. Qiymət bütün əsas hərəkətli ortalamaların üzərindədir, həcm artmaqdadır və bu, gündəlik artanlar siyahısında liderlik edən faktiki olaraq az sayda Layer-1-dən biridir.
Kava-nın dərin USDT likvidliyi, real dünya aktivləri və AI infrastrukturu üzərindəki hədəfləri artıq özünü göstərməyə başlayıb. Bu cür impuls hər həftəsonu görünmür.
Biz sadəcə başlayırıq… yoxsa əvvəlcə nəfəs alırıq?
Aşağıda chart səviyyələrini və hədəflərini paylaş 👇
Bu hərəkət boyunca hələ də $KAVA -ni saxlayan kimlər var?
#KAVA #BinanceSquare #crypto #altcoins #Layer1
79

·
--
$CELO
{future}(CELOUSDT)
🎯 CELO uzun mövqe açılışı canlıdır, ATH-dən 99.3% aşağı, Layer-1 rotasiyası son geridə qalanları tutaraq, təmiz risk-mükafat 🔨
💵 Giriş 0.07726, SL 0.06181 (təxminən -20% risk), TPs 0.08112-dən 0.15452-yə qədər (maks +100% potensial)
📊 Alt tərəfdə aylarla 3D qrafik düzdür, kapitulyasiya tamamlanıb, ATH-dən düşən trend xətti bütün TPs-dən yuxarı 0.236-da yerləşir
🔥 Heç kəsin vecinə deyil zonası, eyni mərhələ AKE BTR HEMI ilə yazılıb
🌊 Qrafik yalan demir 📊 CELO alt struktur kilidlənib, Layer-1 dalğası siyahının aşağısına doğru rotasiya edir. Al, 60 gün saxla, TPs-i bir-bir çap etsin 📈
#CELO #Layer1 #hold
📌 Yalnız şəxsi fikirlər paylaşılır
maliyyə məsləhəti deyil və alma/satmaq üçün tövsiyə sayılmır. Kripto çox yüksək risklidir; DYOR edin və tam məsuliyyət sizdədir. Heç bir coin reklamı yoxdur
$CELO
🎯 CELO uzun mövqe açılışı canlıdır, ATH-dən 99.3% aşağı, Layer-1 rotasiyası son geridə qalanları tutaraq, təmiz risk-mükafat 🔨
💵 Giriş 0.07726, SL 0.06181 (təxminən -20% risk), TPs 0.08112-dən 0.15452-yə qədər (maks +100% potensial)
📊 Alt tərəfdə aylarla 3D qrafik düzdür, kapitulyasiya tamamlanıb, ATH-dən düşən trend xətti bütün TPs-dən yuxarı 0.236-da yerləşir
🔥 Heç kəsin vecinə deyil zonası, eyni mərhələ AKE BTR HEMI ilə yazılıb
🌊 Qrafik yalan demir 📊 CELO alt struktur kilidlənib, Layer-1 dalğası siyahının aşağısına doğru rotasiya edir. Al, 60 gün saxla, TPs-i bir-bir çap etsin 📈
#CELO #Layer1 #hold
📌 Yalnız şəxsi fikirlər paylaşılır
maliyyə məsləhəti deyil və alma/satmaq üçün tövsiyə sayılmır. Kripto çox yüksək risklidir; DYOR edin və tam məsuliyyət sizdədir. Heç bir coin reklamı yoxdur
🎯 CELO uzun mövqe açılışı canlıdır, ATH-dən 99.3% aşağı, Layer-1 rotasiyası son geridə qalanları tutaraq, təmiz risk-mükafat 🔨
💵 Giriş 0.07726, SL 0.06181 (təxminən -20% risk), TPs 0.08112-dən 0.15452-yə qədər (maks +100% potensial)
📊 Alt tərəfdə aylarla 3D qrafik düzdür, kapitulyasiya tamamlanıb, ATH-dən düşən trend xətti bütün TPs-dən yuxarı 0.236-da yerləşir
🔥 Heç kəsin vecinə deyil zonası, eyni mərhələ AKE BTR HEMI ilə yazılıb
🌊 Qrafik yalan demir 📊 CELO alt struktur kilidlənib, Layer-1 dalğası siyahının aşağısına doğru rotasiya edir. Al, 60 gün saxla, TPs-i bir-bir çap etsin 📈
#CELO #Layer1 #hold
📌 Yalnız şəxsi fikirlər paylaşılır
maliyyə məsləhəti deyil və alma/satmaq üçün tövsiyə sayılmır. Kripto çox yüksək risklidir; DYOR edin və tam məsuliyyət sizdədir. Heç bir coin reklamı yoxdur

Kabbo Da:
💜
3
1
8
3.2k

·
--
Tərcüməyə bax
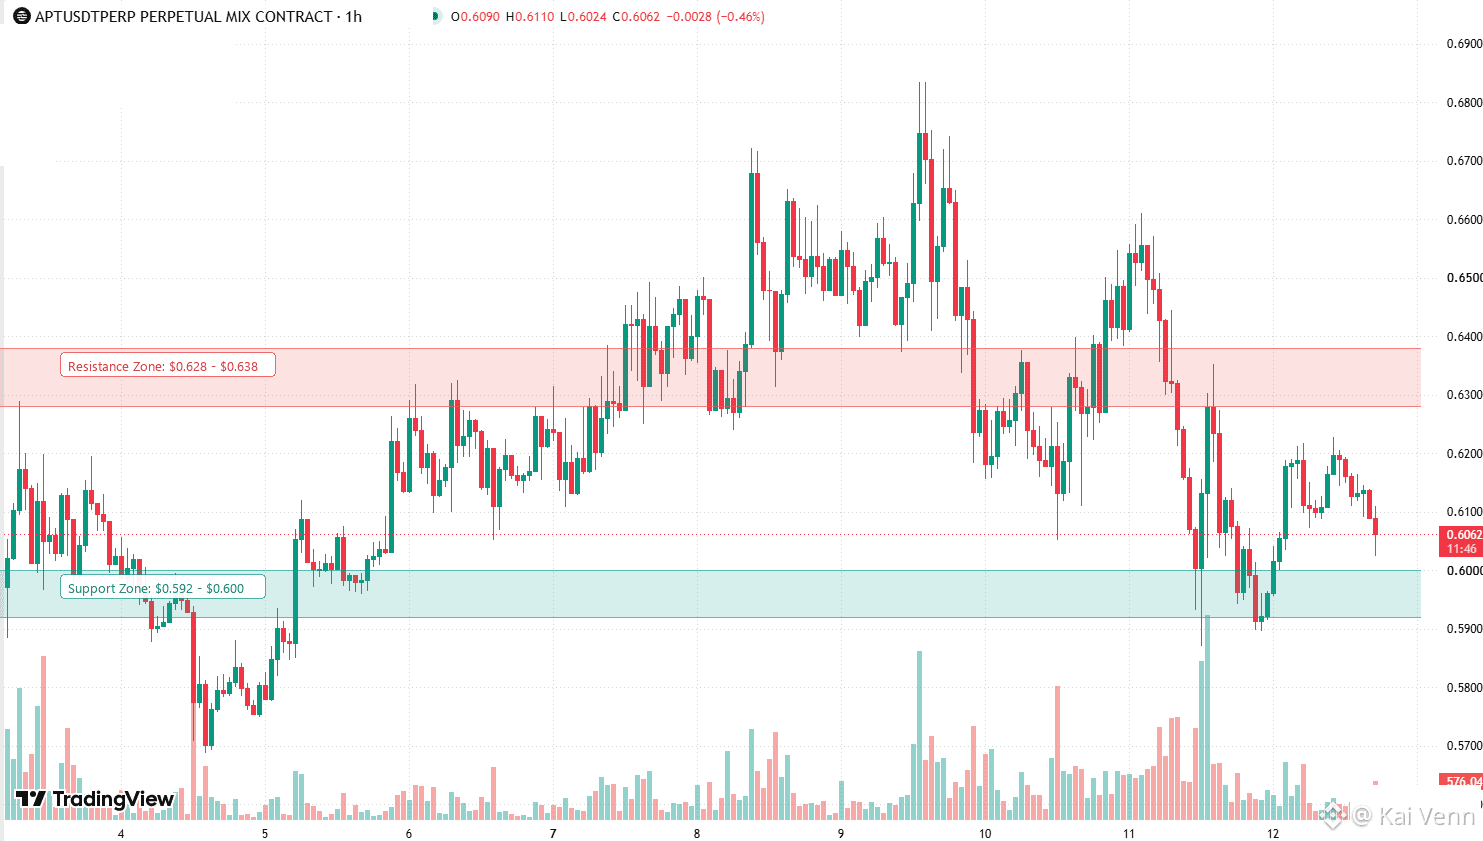
$APT just tested the $0.592-$0.600 demand floor for the second time, and the selling volume was completely flat compared to the panic dump on the 11th.
I'm taking the long play in the $0.602-$0.608 pocket. The immediate target is a clean rotation back up to $0.628-$0.638 resistance to take profit.
Non-negotiable risk: stop loss hard at $0.587. If 1H closes below $0.590, the floor is gone - exit immediately, zero bagholding.
$APT #Aptos #Layer1
$APT just tested the $0.592-$0.600 demand floor for the second time, and the selling volume was completely flat compared to the panic dump on the 11th.
I'm taking the long play in the $0.602-$0.608 pocket. The immediate target is a clean rotation back up to $0.628-$0.638 resistance to take profit.
Non-negotiable risk: stop loss hard at $0.587. If 1H closes below $0.590, the floor is gone - exit immediately, zero bagholding.
$APT #Aptos #Layer1
I'm taking the long play in the $0.602-$0.608 pocket. The immediate target is a clean rotation back up to $0.628-$0.638 resistance to take profit.
Non-negotiable risk: stop loss hard at $0.587. If 1H closes below $0.590, the floor is gone - exit immediately, zero bagholding.
$APT #Aptos #Layer1
194

·
--
Tərcüməyə bax
$SOL 四小时前完成了一次教科书级的V型反转。
从104一路跌到97.36,跌了将近7个点。多数人以为要破位。结果一根4小时K线直接拉回105.77。成交量1170万枚SOL。前后几根K线只有150到200万。这根是它们的5到8倍。放量拉到这个程度,不是散户干的。
价格现在回到101附近。那个底,踩实了。
---
盘面信号
那根超大阳线之后,连续三根小K线收在101到103区间。没有继续上攻,也没有再破底。冲高回落不代表行情结束,只是第一波吃完需要消化。
市场情绪
下跌时散户最容易恐慌割肉。这次急跌之后没有形成持续性抛压,反而快速被接住。说明底部承接力量不弱。资金费率0.0011%,几乎中性。拉升不靠合约杠杆,靠的是现货真金白银。这种行情底子更硬。
大户动向
1170万枚SOL集中在单根4小时K线里。从97.36到105.77,8美元的空间里一口吃掉大量筹码。之后价格回落到101到102震荡。典型的建仓后洗盘动作。大户不急,慢慢磨。
量价结构
下跌过程中量能萎缩,抛压减弱。反弹时量能爆发,买方强势。超大阳线后量能回归100到300万枚的正常水平。放量上涨,缩量整理,格局健康。
K线细节
那根大阳线实体3.31美元,上影4.22美元,下影4.19美元。上下影线基本等长。之后三根小K线实体都不超过1美元。波动被压缩在窄幅区间。收敛形态,变盘不远。
---
关键位置
支撑:97.36,100.30
压力:105.77,突破看110
---
妮妮的计划
偏多。100到101区间分批接。止损放97下方。第一目标105,第二目标110。如果直接跌破97不追,等新的机会。
当前价 101.96。
有策略需要定制,可以找妮妮。
#SOL #Layer1 #公链
$SOL 四小时前完成了一次教科书级的V型反转。
从104一路跌到97.36,跌了将近7个点。多数人以为要破位。结果一根4小时K线直接拉回105.77。成交量1170万枚SOL。前后几根K线只有150到200万。这根是它们的5到8倍。放量拉到这个程度,不是散户干的。
价格现在回到101附近。那个底,踩实了。
---
盘面信号
那根超大阳线之后,连续三根小K线收在101到103区间。没有继续上攻,也没有再破底。冲高回落不代表行情结束,只是第一波吃完需要消化。
市场情绪
下跌时散户最容易恐慌割肉。这次急跌之后没有形成持续性抛压,反而快速被接住。说明底部承接力量不弱。资金费率0.0011%,几乎中性。拉升不靠合约杠杆,靠的是现货真金白银。这种行情底子更硬。
大户动向
1170万枚SOL集中在单根4小时K线里。从97.36到105.77,8美元的空间里一口吃掉大量筹码。之后价格回落到101到102震荡。典型的建仓后洗盘动作。大户不急,慢慢磨。
量价结构
下跌过程中量能萎缩,抛压减弱。反弹时量能爆发,买方强势。超大阳线后量能回归100到300万枚的正常水平。放量上涨,缩量整理,格局健康。
K线细节
那根大阳线实体3.31美元,上影4.22美元,下影4.19美元。上下影线基本等长。之后三根小K线实体都不超过1美元。波动被压缩在窄幅区间。收敛形态,变盘不远。
---
关键位置
支撑:97.36,100.30
压力:105.77,突破看110
---
妮妮的计划
偏多。100到101区间分批接。止损放97下方。第一目标105,第二目标110。如果直接跌破97不追,等新的机会。
当前价 101.96。
有策略需要定制,可以找妮妮。
#SOL #Layer1 #公链
从104一路跌到97.36,跌了将近7个点。多数人以为要破位。结果一根4小时K线直接拉回105.77。成交量1170万枚SOL。前后几根K线只有150到200万。这根是它们的5到8倍。放量拉到这个程度,不是散户干的。
价格现在回到101附近。那个底,踩实了。
---
盘面信号
那根超大阳线之后,连续三根小K线收在101到103区间。没有继续上攻,也没有再破底。冲高回落不代表行情结束,只是第一波吃完需要消化。
市场情绪
下跌时散户最容易恐慌割肉。这次急跌之后没有形成持续性抛压,反而快速被接住。说明底部承接力量不弱。资金费率0.0011%,几乎中性。拉升不靠合约杠杆,靠的是现货真金白银。这种行情底子更硬。
大户动向
1170万枚SOL集中在单根4小时K线里。从97.36到105.77,8美元的空间里一口吃掉大量筹码。之后价格回落到101到102震荡。典型的建仓后洗盘动作。大户不急,慢慢磨。
量价结构
下跌过程中量能萎缩,抛压减弱。反弹时量能爆发,买方强势。超大阳线后量能回归100到300万枚的正常水平。放量上涨,缩量整理,格局健康。
K线细节
那根大阳线实体3.31美元,上影4.22美元,下影4.19美元。上下影线基本等长。之后三根小K线实体都不超过1美元。波动被压缩在窄幅区间。收敛形态,变盘不远。
---
关键位置
支撑:97.36,100.30
压力:105.77,突破看110
---
妮妮的计划
偏多。100到101区间分批接。止损放97下方。第一目标105,第二目标110。如果直接跌破97不追,等新的机会。
当前价 101.96。
有策略需要定制,可以找妮妮。
#SOL #Layer1 #公链
1
95
·
--
Tərcüməyə bax
$SOL 四小时前完成了一次教科书级的V型反转。
从104一路跌到97.36,跌了将近7个点。多数人以为要破位。结果一根4小时K线直接拉回105.77。成交量1170万枚SOL。前后几根K线只有150到200万。这根是它们的5到8倍。放量拉到这个程度,不是散户干的。
价格现在回到101附近。那个底,踩实了。
---
盘面信号
那根超大阳线之后,连续三根小K线收在101到103区间。没有继续上攻,也没有再破底。冲高回落不代表行情结束,只是第一波吃完需要消化。
市场情绪
下跌时散户最容易恐慌割肉。这次急跌之后没有形成持续性抛压,反而快速被接住。说明底部承接力量不弱。资金费率0.0011%,几乎中性。拉升不靠合约杠杆,靠的是现货真金白银。这种行情底子更硬。
大户动向
1170万枚SOL集中在单根4小时K线里。从97.36到105.77,8美元的空间里一口吃掉大量筹码。之后价格回落到101到102震荡。典型的建仓后洗盘动作。大户不急,慢慢磨。
量价结构
下跌过程中量能萎缩,抛压减弱。反弹时量能爆发,买方强势。超大阳线后量能回归100到300万枚的正常水平。放量上涨,缩量整理,格局健康。
K线细节
那根大阳线实体3.31美元,上影4.22美元,下影4.19美元。上下影线基本等长。之后三根小K线实体都不超过1美元。波动被压缩在窄幅区间。收敛形态,变盘不远。
---
关键位置
支撑:97.36,100.30
压力:105.77,突破看110
---
妮妮的计划
偏多。100到101区间分批接。止损放97下方。第一目标105,第二目标110。如果直接跌破97不追,等新的机会。
当前价 101.96。
有策略需要定制,可以找妮妮。
#SOL #Layer1 #公链
$SOL 四小时前完成了一次教科书级的V型反转。
从104一路跌到97.36,跌了将近7个点。多数人以为要破位。结果一根4小时K线直接拉回105.77。成交量1170万枚SOL。前后几根K线只有150到200万。这根是它们的5到8倍。放量拉到这个程度,不是散户干的。
价格现在回到101附近。那个底,踩实了。
---
盘面信号
那根超大阳线之后,连续三根小K线收在101到103区间。没有继续上攻,也没有再破底。冲高回落不代表行情结束,只是第一波吃完需要消化。
市场情绪
下跌时散户最容易恐慌割肉。这次急跌之后没有形成持续性抛压,反而快速被接住。说明底部承接力量不弱。资金费率0.0011%,几乎中性。拉升不靠合约杠杆,靠的是现货真金白银。这种行情底子更硬。
大户动向
1170万枚SOL集中在单根4小时K线里。从97.36到105.77,8美元的空间里一口吃掉大量筹码。之后价格回落到101到102震荡。典型的建仓后洗盘动作。大户不急,慢慢磨。
量价结构
下跌过程中量能萎缩,抛压减弱。反弹时量能爆发,买方强势。超大阳线后量能回归100到300万枚的正常水平。放量上涨,缩量整理,格局健康。
K线细节
那根大阳线实体3.31美元,上影4.22美元,下影4.19美元。上下影线基本等长。之后三根小K线实体都不超过1美元。波动被压缩在窄幅区间。收敛形态,变盘不远。
---
关键位置
支撑:97.36,100.30
压力:105.77,突破看110
---
妮妮的计划
偏多。100到101区间分批接。止损放97下方。第一目标105,第二目标110。如果直接跌破97不追,等新的机会。
当前价 101.96。
有策略需要定制,可以找妮妮。
#SOL #Layer1 #公链
从104一路跌到97.36,跌了将近7个点。多数人以为要破位。结果一根4小时K线直接拉回105.77。成交量1170万枚SOL。前后几根K线只有150到200万。这根是它们的5到8倍。放量拉到这个程度,不是散户干的。
价格现在回到101附近。那个底,踩实了。
---
盘面信号
那根超大阳线之后,连续三根小K线收在101到103区间。没有继续上攻,也没有再破底。冲高回落不代表行情结束,只是第一波吃完需要消化。
市场情绪
下跌时散户最容易恐慌割肉。这次急跌之后没有形成持续性抛压,反而快速被接住。说明底部承接力量不弱。资金费率0.0011%,几乎中性。拉升不靠合约杠杆,靠的是现货真金白银。这种行情底子更硬。
大户动向
1170万枚SOL集中在单根4小时K线里。从97.36到105.77,8美元的空间里一口吃掉大量筹码。之后价格回落到101到102震荡。典型的建仓后洗盘动作。大户不急,慢慢磨。
量价结构
下跌过程中量能萎缩,抛压减弱。反弹时量能爆发,买方强势。超大阳线后量能回归100到300万枚的正常水平。放量上涨,缩量整理,格局健康。
K线细节
那根大阳线实体3.31美元,上影4.22美元,下影4.19美元。上下影线基本等长。之后三根小K线实体都不超过1美元。波动被压缩在窄幅区间。收敛形态,变盘不远。
---
关键位置
支撑:97.36,100.30
压力:105.77,突破看110
---
妮妮的计划
偏多。100到101区间分批接。止损放97下方。第一目标105,第二目标110。如果直接跌破97不追,等新的机会。
当前价 101.96。
有策略需要定制,可以找妮妮。
#SOL #Layer1 #公链
User-ff5e108f:
上次SOL跌到97.36我也想接,犹豫两秒直接拉到105,手忙脚乱追高被挂在山腰,现在全丢给托管不管了,可以看看 他的帖子
1
103
·
--
Tərcüməyə bax
Economic Security Is the New Layer 1 Moat
The Layer 1 conversation has been stuck on throughput for years. TPS charts, finality times, blob fee compression — all important, but increasingly commoditized.
Here's what actually differentiates L1s now: economic security.
Staking depth — the total value at risk securing a chain — determines how expensive it is to attack. A chain with $40B staked isn't just "more decentralized." It means the cost of a 51% attack exceeds the upside of almost any double-spend. That's a moat institutions can underwrite.
Slashing economics matter too. A chain where validators face real consequences for misbehavior creates trust without requiring trust. That's the difference between a chain that can settle tokenized treasuries and one that can't.
The L1s winning institutional attention aren't the fastest. They're the ones where the security budget is deep enough, the validator set is broad enough, and the slashing parameters are sharp enough that a CFO can put real capital on-chain without losing sleep.
Speed gets attention. Economic security keeps capital.
$ETH $SOL $BNB
#Crypto #Layer1 #EconomicSecurity #Staking #InstitutionalAdoption
Economic Security Is the New Layer 1 Moat
The Layer 1 conversation has been stuck on throughput for years. TPS charts, finality times, blob fee compression — all important, but increasingly commoditized.
Here's what actually differentiates L1s now: economic security.
Staking depth — the total value at risk securing a chain — determines how expensive it is to attack. A chain with $40B staked isn't just "more decentralized." It means the cost of a 51% attack exceeds the upside of almost any double-spend. That's a moat institutions can underwrite.
Slashing economics matter too. A chain where validators face real consequences for misbehavior creates trust without requiring trust. That's the difference between a chain that can settle tokenized treasuries and one that can't.
The L1s winning institutional attention aren't the fastest. They're the ones where the security budget is deep enough, the validator set is broad enough, and the slashing parameters are sharp enough that a CFO can put real capital on-chain without losing sleep.
Speed gets attention. Economic security keeps capital.
$ETH $SOL $BNB
#Crypto #Layer1 #EconomicSecurity #Staking #InstitutionalAdoption
The Layer 1 conversation has been stuck on throughput for years. TPS charts, finality times, blob fee compression — all important, but increasingly commoditized.
Here's what actually differentiates L1s now: economic security.
Staking depth — the total value at risk securing a chain — determines how expensive it is to attack. A chain with $40B staked isn't just "more decentralized." It means the cost of a 51% attack exceeds the upside of almost any double-spend. That's a moat institutions can underwrite.
Slashing economics matter too. A chain where validators face real consequences for misbehavior creates trust without requiring trust. That's the difference between a chain that can settle tokenized treasuries and one that can't.
The L1s winning institutional attention aren't the fastest. They're the ones where the security budget is deep enough, the validator set is broad enough, and the slashing parameters are sharp enough that a CFO can put real capital on-chain without losing sleep.
Speed gets attention. Economic security keeps capital.
$ETH $SOL $BNB
#Crypto #Layer1 #EconomicSecurity #Staking #InstitutionalAdoption
1
84
·
--
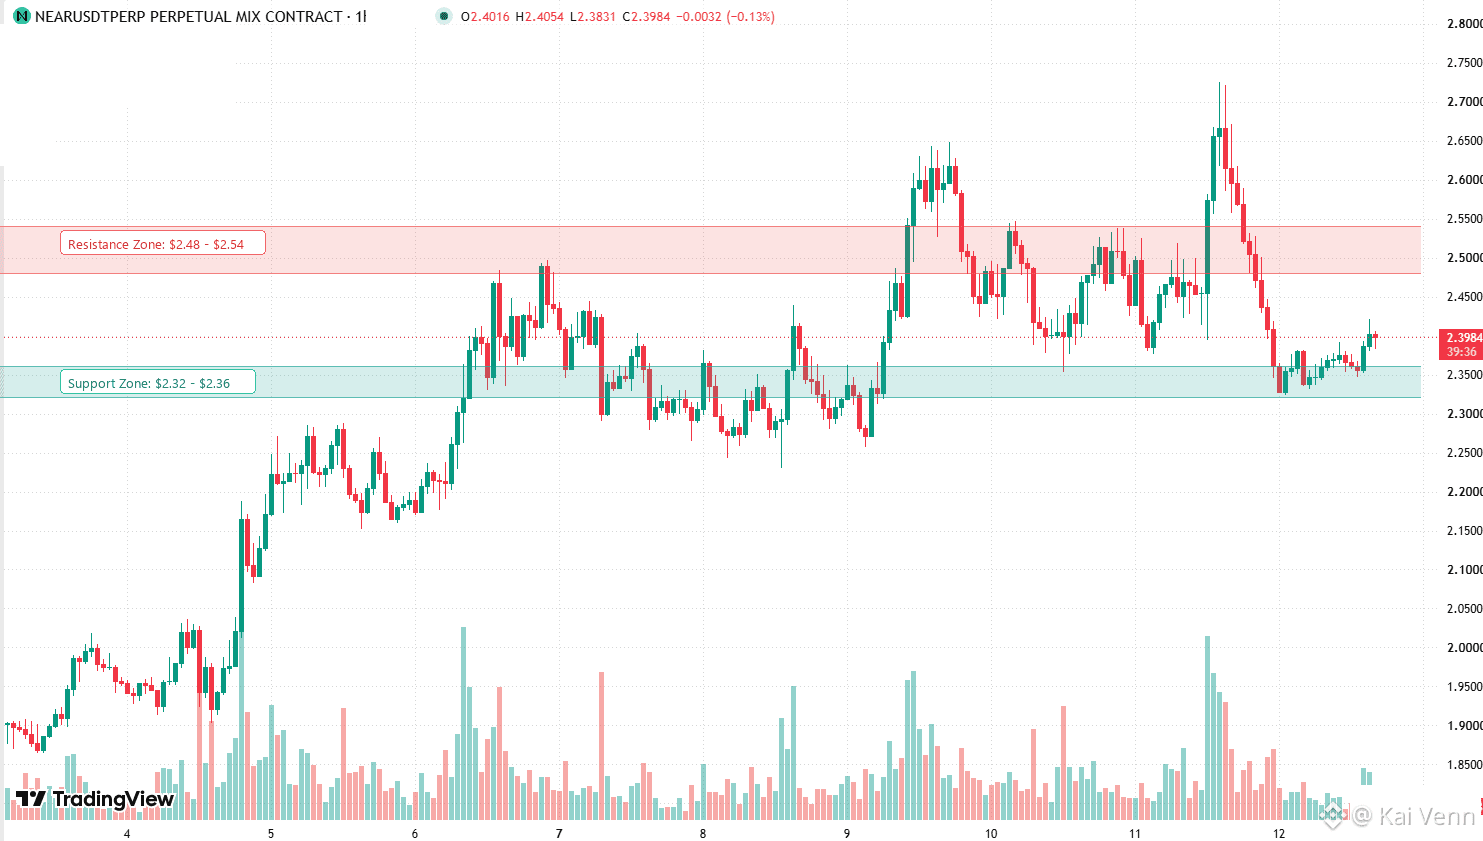
$NEAR -dəki panika tipli “flush” həddən artıq borclu (overleveraged) gecikmiş long-ları $2.33-ə qədər silib, amma qiymət çoxgünlük baza səviyyəsinə toxunanda satış həcminin nə qədər tez quruduğuna diqqət yetirin.
İndi həmin $2.32-$2.36 tələb “shelf”-indən üç ardıcıl daha yüksək minimum çap elədik. Burada spot absorbiya aydındır—satıcılar böyük həcmdə bid-ə atdılar, amma strukturu poza bilmədilər.
Mən $2.36 ilə $2.40 arasında akkumulyasiya edirəm. Mənfəət götürmək üçün ilk əsas likvidlik cibı $2.48-$2.54 təchizat blokunda yerləşir; burada əvvəlki dağılım (distribution) pozulmuşdu.
Hard stop $2.29-dan aşağı düşür. Əgər 1H $2.31-dən aşağı bağlanarsa, bu bərpa cəhdi bitmiş sayılır—dərhal çıxın və stop loss olmadan saxlamayın.
$NEAR #nearprotocol #Layer1
$NEAR -dəki panika tipli “flush” həddən artıq borclu (overleveraged) gecikmiş long-ları $2.33-ə qədər silib, amma qiymət çoxgünlük baza səviyyəsinə toxunanda satış həcminin nə qədər tez quruduğuna diqqət yetirin.
İndi həmin $2.32-$2.36 tələb “shelf”-indən üç ardıcıl daha yüksək minimum çap elədik. Burada spot absorbiya aydındır—satıcılar böyük həcmdə bid-ə atdılar, amma strukturu poza bilmədilər.
Mən $2.36 ilə $2.40 arasında akkumulyasiya edirəm. Mənfəət götürmək üçün ilk əsas likvidlik cibı $2.48-$2.54 təchizat blokunda yerləşir; burada əvvəlki dağılım (distribution) pozulmuşdu.
Hard stop $2.29-dan aşağı düşür. Əgər 1H $2.31-dən aşağı bağlanarsa, bu bərpa cəhdi bitmiş sayılır—dərhal çıxın və stop loss olmadan saxlamayın.
$NEAR #nearprotocol #Layer1
İndi həmin $2.32-$2.36 tələb “shelf”-indən üç ardıcıl daha yüksək minimum çap elədik. Burada spot absorbiya aydındır—satıcılar böyük həcmdə bid-ə atdılar, amma strukturu poza bilmədilər.
Mən $2.36 ilə $2.40 arasında akkumulyasiya edirəm. Mənfəət götürmək üçün ilk əsas likvidlik cibı $2.48-$2.54 təchizat blokunda yerləşir; burada əvvəlki dağılım (distribution) pozulmuşdu.
Hard stop $2.29-dan aşağı düşür. Əgər 1H $2.31-dən aşağı bağlanarsa, bu bərpa cəhdi bitmiş sayılır—dərhal çıxın və stop loss olmadan saxlamayın.
$NEAR #nearprotocol #Layer1
97

·
--
Artım
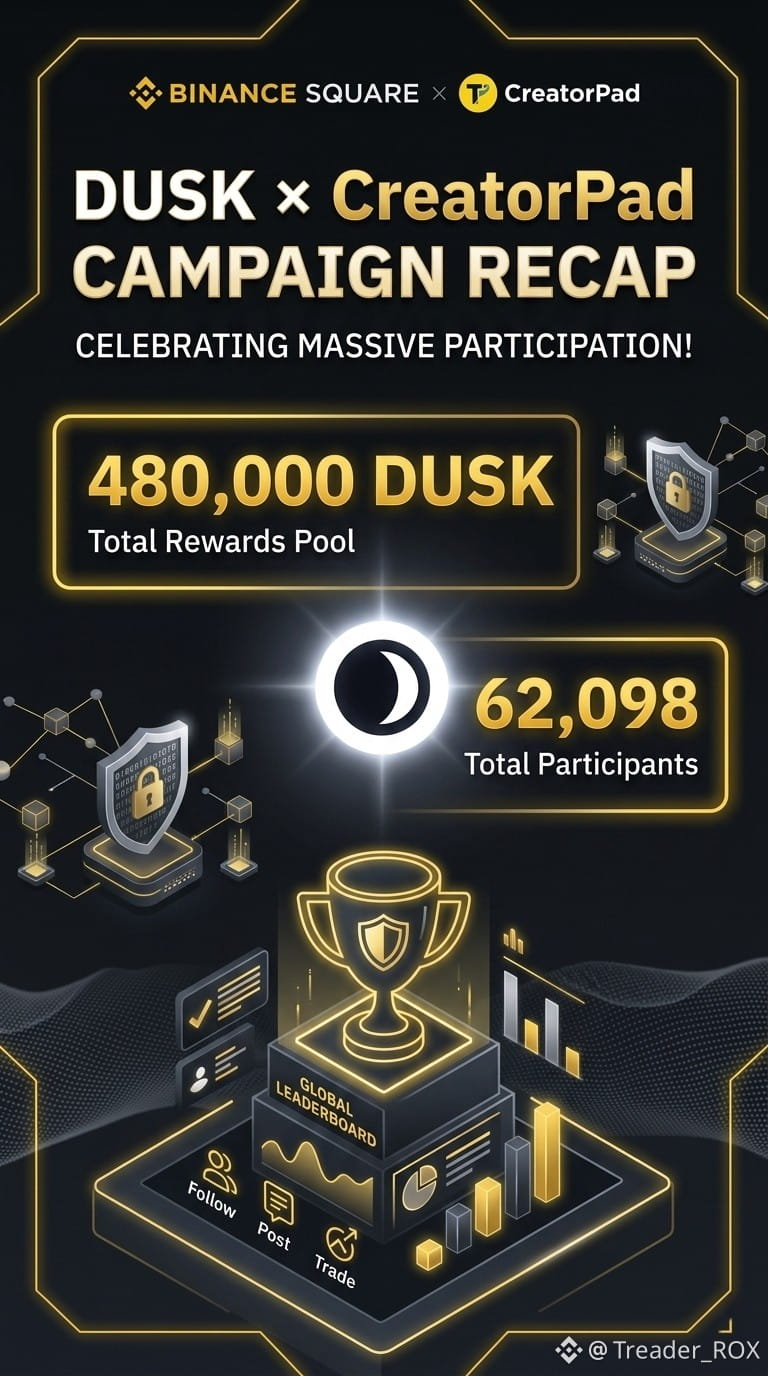
🚀 Böyük Uğur! DUSK × CreatorPad Kampaniyasına 62K+ İştirakçı Qoşuldu!
Binance CreatorPad-da inanılmaz bir mərhələ! DUSK Network kampaniyasına qoşulmaq üçün 62,098+ yaradıcı və iştirakçı dəstək verib, 480,000 $DUSK mükafatdan ibarət böyük ümumi fondu paylaşdı! 📈🔥
Layer-1 məxfilik blokçeynidir, məxfi maliyyə təhlükəsizliyi və real dünya aktivlərini (RWA) təmin edir; DUSK Web3 maliyyəsinin gələcəyini qurmağa davam edir. Global Leaderboard-da ilk yerləri tutan bütün yaradıcıları təbrik edirik! 🏆
Kupon mükafatlarının paylanması yaxın zamanda başlayır (16 sentyabrdan əvvəl). Bu kampaniyada iştirak etmisiniz? Fikirlərinizi şərhlərdə bizimlə paylaşın! 👇
#BinanceCreatorPad #DUSK #DUSKNetwork #BinanceSquare #Layer1
@Dusk_Foundation $DUSK
{future}(DUSKUSDT)
🚀 Böyük Uğur! DUSK × CreatorPad Kampaniyasına 62K+ İştirakçı Qoşuldu!
Binance CreatorPad-da inanılmaz bir mərhələ! DUSK Network kampaniyasına qoşulmaq üçün 62,098+ yaradıcı və iştirakçı dəstək verib, 480,000 $DUSK mükafatdan ibarət böyük ümumi fondu paylaşdı! 📈🔥
Layer-1 məxfilik blokçeynidir, məxfi maliyyə təhlükəsizliyi və real dünya aktivlərini (RWA) təmin edir; DUSK Web3 maliyyəsinin gələcəyini qurmağa davam edir. Global Leaderboard-da ilk yerləri tutan bütün yaradıcıları təbrik edirik! 🏆
Kupon mükafatlarının paylanması yaxın zamanda başlayır (16 sentyabrdan əvvəl). Bu kampaniyada iştirak etmisiniz? Fikirlərinizi şərhlərdə bizimlə paylaşın! 👇
#BinanceCreatorPad #DUSK #DUSKNetwork #BinanceSquare #Layer1
@Dusk $DUSK
Binance CreatorPad-da inanılmaz bir mərhələ! DUSK Network kampaniyasına qoşulmaq üçün 62,098+ yaradıcı və iştirakçı dəstək verib, 480,000 $DUSK mükafatdan ibarət böyük ümumi fondu paylaşdı! 📈🔥
Layer-1 məxfilik blokçeynidir, məxfi maliyyə təhlükəsizliyi və real dünya aktivlərini (RWA) təmin edir; DUSK Web3 maliyyəsinin gələcəyini qurmağa davam edir. Global Leaderboard-da ilk yerləri tutan bütün yaradıcıları təbrik edirik! 🏆
Kupon mükafatlarının paylanması yaxın zamanda başlayır (16 sentyabrdan əvvəl). Bu kampaniyada iştirak etmisiniz? Fikirlərinizi şərhlərdə bizimlə paylaşın! 👇
#BinanceCreatorPad #DUSK #DUSKNetwork #BinanceSquare #Layer1
@Dusk $DUSK
129

Tərcüməyə bax
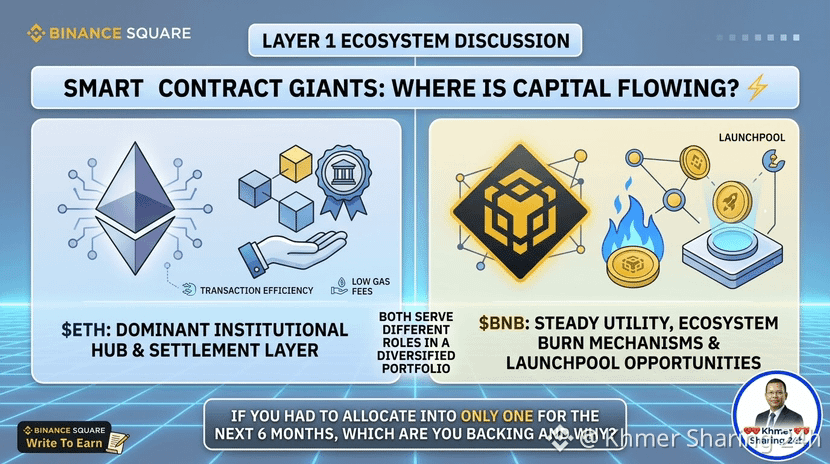
Layer 1 Ecosystem Discussion
Smart Contract Giants: Where Is Capital Flowing? ⚡
The Layer 1 narrative continues to evolve as transaction efficiency and low gas fees drive retail adoption.
$ETH remains the dominant institutional hub and settlement layer.
$BNB continues to deliver steady utility, ecosystem burn mechanisms, and Launchpool opportunities.
Both serve different roles in a diversified portfolio. If you had to allocate into only one for the next 6 months, which are you backing and why?
@Binance_Square_Official #Write2Earn #Layer1 #CryptoAnalysis #defi
Layer 1 Ecosystem Discussion
Smart Contract Giants: Where Is Capital Flowing? ⚡
The Layer 1 narrative continues to evolve as transaction efficiency and low gas fees drive retail adoption.
$ETH remains the dominant institutional hub and settlement layer.
$BNB continues to deliver steady utility, ecosystem burn mechanisms, and Launchpool opportunities.
Both serve different roles in a diversified portfolio. If you had to allocate into only one for the next 6 months, which are you backing and why?
@Binance Square Official #Write2Earn #Layer1 #CryptoAnalysis #defi
Smart Contract Giants: Where Is Capital Flowing? ⚡
The Layer 1 narrative continues to evolve as transaction efficiency and low gas fees drive retail adoption.
$ETH remains the dominant institutional hub and settlement layer.
$BNB continues to deliver steady utility, ecosystem burn mechanisms, and Launchpool opportunities.
Both serve different roles in a diversified portfolio. If you had to allocate into only one for the next 6 months, which are you backing and why?
@Binance Square Official #Write2Earn #Layer1 #CryptoAnalysis #defi
80
·
--
Tərcüməyə bax
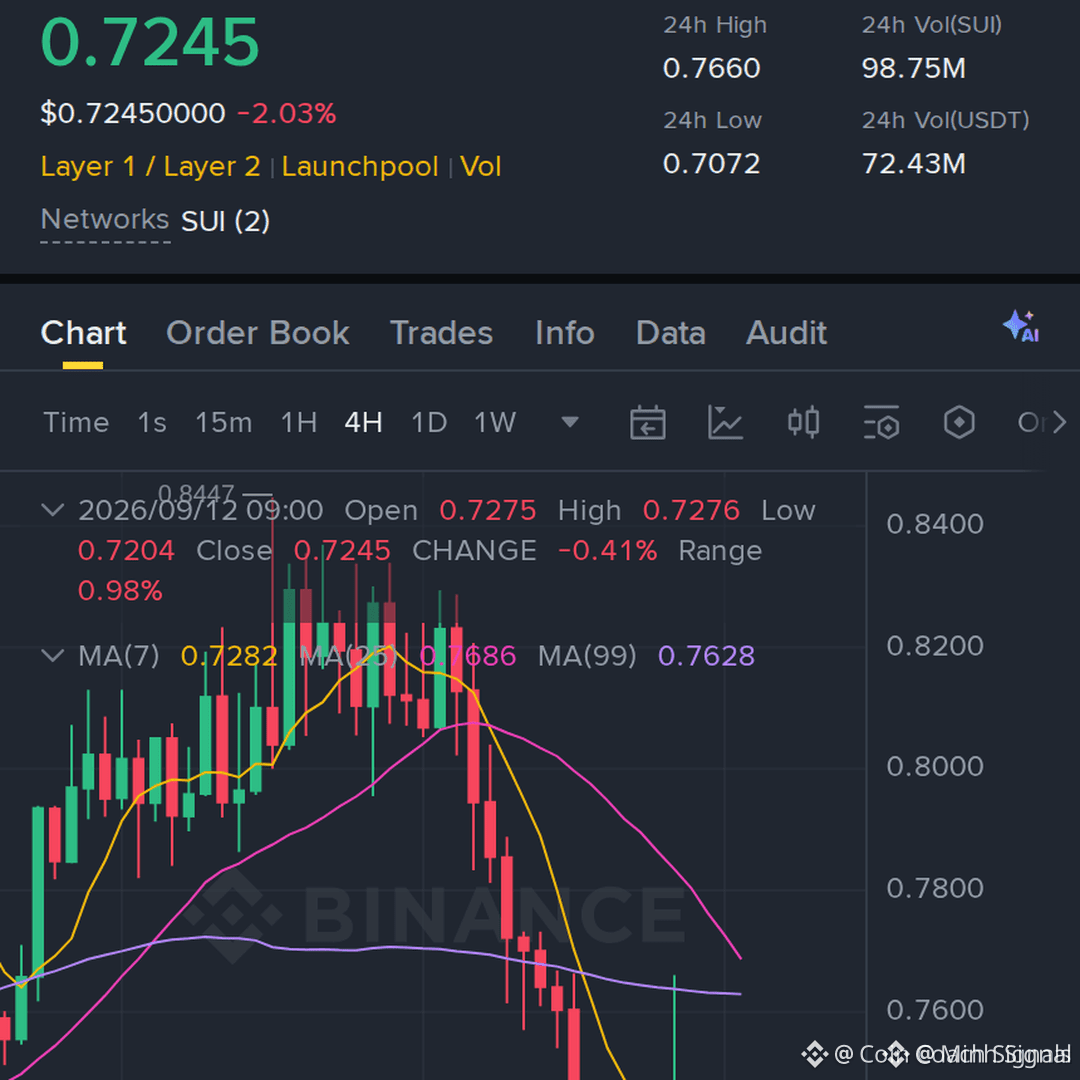
$SUI is still looking heavy near this zone. At $0.7263, down 1.16% with only $71.2M traded, the 45x short setup remains: entry $0.7234–$0.7294, TP1 $0.6901, TP2 $0.6574, TP3 $0.6247, invalidation at $0.7712. The 4h RSI at 36 hints at weakness, while -0.002% funding shows shorts are paying. Mixed MAs and volume at just 0.2x the 20d average make this a thin, choppy setup. High risk, manage leverage carefully ⚠️ $SUI #SUI #Layer1 #Altcoin
Inspired by Coin Coach Signals on Binance Square.
$SUI is still looking heavy near this zone. At $0.7263, down 1.16% with only $71.2M traded, the 45x short setup remains: entry $0.7234–$0.7294, TP1 $0.6901, TP2 $0.6574, TP3 $0.6247, invalidation at $0.7712. The 4h RSI at 36 hints at weakness, while -0.002% funding shows shorts are paying. Mixed MAs and volume at just 0.2x the 20d average make this a thin, choppy setup. High risk, manage leverage carefully ⚠️ $SUI #SUI #Layer1 #Altcoin
Inspired by Coin Coach Signals on Binance Square.
Inspired by Coin Coach Signals on Binance Square.
119

·
--
Artım
Tərcüməyə bax
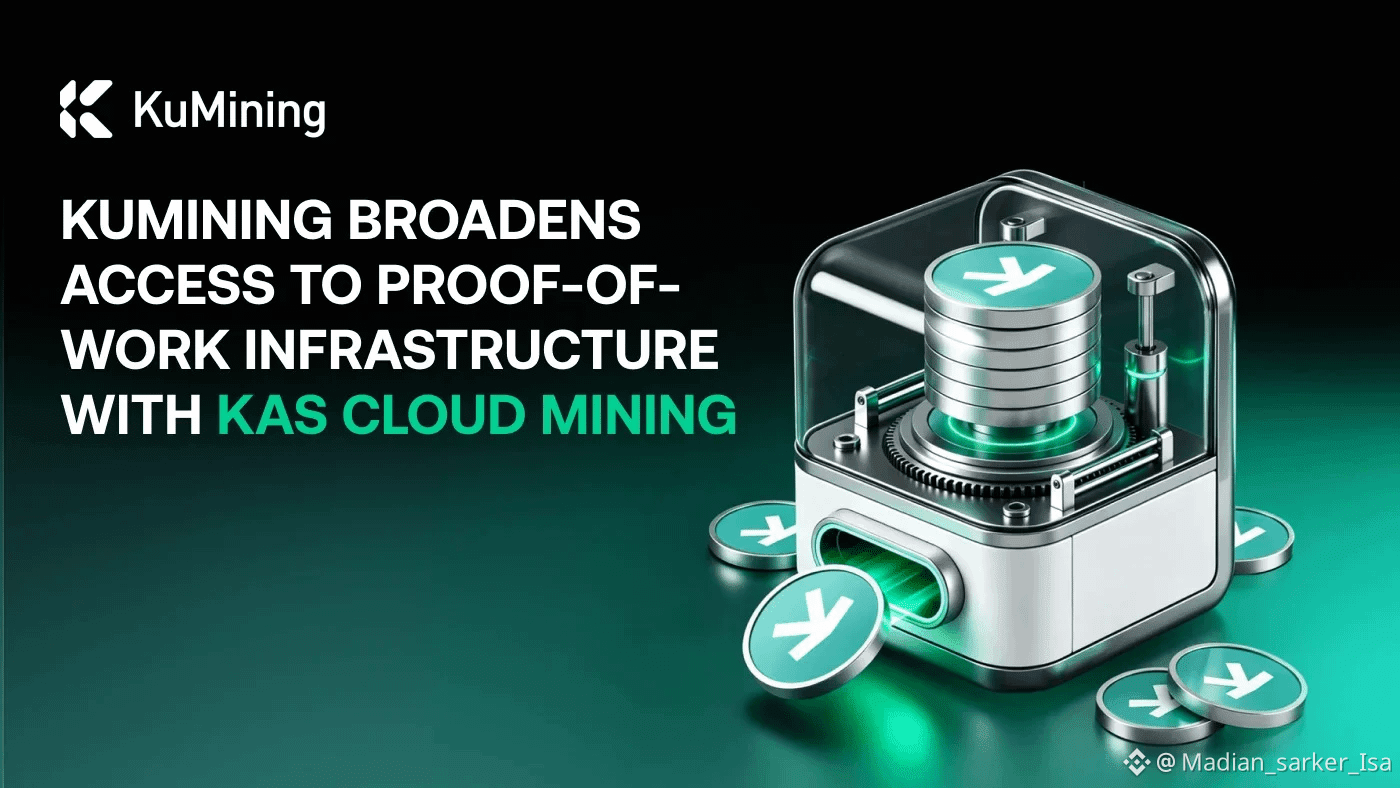
$KAS : A Binance-Listed #PoW Coin to Watch For future ...
#Kaspa ($KAS ) is trading near $0.036, with a market cap of about $985 million and $13.98 million in 24-hour volume.Its not meme coin.
$KAS has gained around
17.5% in the past 7 days and 39.5% over the past 30 days
, showing renewed market interest.
Its proof-of-work (#PoW ) technology and fast block production make it different from many traditional #layer1 projects. KAS is also listed on Binance, giving it stronger visibility and liquidity than many small-cap altcoins.
{future}(KASUSDT)
$KAS : A Binance-Listed #PoW Coin to Watch For future ...
#Kaspa ($KAS ) is trading near $0.036, with a market cap of about $985 million and $13.98 million in 24-hour volume.Its not meme coin.
$KAS has gained around
17.5% in the past 7 days and 39.5% over the past 30 days
, showing renewed market interest.
Its proof-of-work (#PoW ) technology and fast block production make it different from many traditional #layer1 projects. KAS is also listed on Binance, giving it stronger visibility and liquidity than many small-cap altcoins.
#Kaspa ($KAS ) is trading near $0.036, with a market cap of about $985 million and $13.98 million in 24-hour volume.Its not meme coin.
$KAS has gained around
17.5% in the past 7 days and 39.5% over the past 30 days
, showing renewed market interest.
Its proof-of-work (#PoW ) technology and fast block production make it different from many traditional #layer1 projects. KAS is also listed on Binance, giving it stronger visibility and liquidity than many small-cap altcoins.
27

·
--
🔺 Avalanche ($AVAX) Layer-1 Fərdiləşdirmə və Ekosistem Mərkəzi! ⚡
Modulyar blokçeyn arxitekturası və yüksək performanslı xüsusi şəbəkələr inkişaf etdikcə, Avalanche ($AVAX) müəssisə səviyyəli istifadə və çevik miqyaslanma üçün nəzərdə tutulmuş önəmli Layer-1 infrastrukturu olaraq qalır.
Diqqət mərkəzində $AVAX saxlayaraq əsas məqamlar:
* Avalanche L1 İnfrastrukturu: Avalanche9000/Etna yeniləmələri kimi böyük arxitektur genişlənmələrdən sonra, tərtibatçılar xeyli aşağı yerləşdirmə (deployment) maneələri ilə suveren, yüksək dərəcədə fərdiləşdirilmiş Layer-1 şəbəkələri yarada bilərlər.
* Subşəbəkələrarası (Cross-Subnet) Qarşılıqlı Əməliyyat: Teleporter və Avalanche Warp Messaging kimi qabaqcıl kommunikasiya çərçivələri ekosistemdəki müstəqil zəncirlərin məlumat və aktivləri təhlükəsiz şəkildə ötürməsinə imkan verir.
* İnstitusional Real Dünya Aktivləri (RWAs): Ənənəvi maliyyə qurumları və müəssisə platformaları tərəfindən artırılan qəbul, şəbəkənin tokenləşdirilmiş qiymətli kağızlara və uyğunluğa (compliance) hazır infrastrukturuna yönəldilməsini vurğulayır.
Siz Avalanche-in fərdiləşdirilə bilən L1 arxitekturasını izləyirsiniz, yoxsa onun institusional RWA inteqrasiyalarını araşdırırsınız? Fikirlərinizi aşağıda paylaşın! 👇
İmtina: Kriptovalyuta bazarları yüksək dəyişkənlik və risk daşıyır. Ticarət etməzdən və ya investisiya etməzdən əvvəl həmişə öz araşdırmanızı aparın.
#AVAX #Avalanche #Layer1 #CryptoTrading
🔺 Avalanche ($AVAX ) Layer-1 Fərdiləşdirmə və Ekosistem Mərkəzi! ⚡
Modulyar blokçeyn arxitekturası və yüksək performanslı xüsusi şəbəkələr inkişaf etdikcə, Avalanche ($AVAX ) müəssisə səviyyəli istifadə və çevik miqyaslanma üçün nəzərdə tutulmuş önəmli Layer-1 infrastrukturu olaraq qalır.
Diqqət mərkəzində $AVAX saxlayaraq əsas məqamlar:
* Avalanche L1 İnfrastrukturu: Avalanche9000/Etna yeniləmələri kimi böyük arxitektur genişlənmələrdən sonra, tərtibatçılar xeyli aşağı yerləşdirmə (deployment) maneələri ilə suveren, yüksək dərəcədə fərdiləşdirilmiş Layer-1 şəbəkələri yarada bilərlər.
* Subşəbəkələrarası (Cross-Subnet) Qarşılıqlı Əməliyyat: Teleporter və Avalanche Warp Messaging kimi qabaqcıl kommunikasiya çərçivələri ekosistemdəki müstəqil zəncirlərin məlumat və aktivləri təhlükəsiz şəkildə ötürməsinə imkan verir.
* İnstitusional Real Dünya Aktivləri (RWAs): Ənənəvi maliyyə qurumları və müəssisə platformaları tərəfindən artırılan qəbul, şəbəkənin tokenləşdirilmiş qiymətli kağızlara və uyğunluğa (compliance) hazır infrastrukturuna yönəldilməsini vurğulayır.
Siz Avalanche-in fərdiləşdirilə bilən L1 arxitekturasını izləyirsiniz, yoxsa onun institusional RWA inteqrasiyalarını araşdırırsınız? Fikirlərinizi aşağıda paylaşın! 👇
İmtina: Kriptovalyuta bazarları yüksək dəyişkənlik və risk daşıyır. Ticarət etməzdən və ya investisiya etməzdən əvvəl həmişə öz araşdırmanızı aparın.
#AVAX #Avalanche #Layer1 #CryptoTrading
Modulyar blokçeyn arxitekturası və yüksək performanslı xüsusi şəbəkələr inkişaf etdikcə, Avalanche ($AVAX ) müəssisə səviyyəli istifadə və çevik miqyaslanma üçün nəzərdə tutulmuş önəmli Layer-1 infrastrukturu olaraq qalır.
Diqqət mərkəzində $AVAX saxlayaraq əsas məqamlar:
* Avalanche L1 İnfrastrukturu: Avalanche9000/Etna yeniləmələri kimi böyük arxitektur genişlənmələrdən sonra, tərtibatçılar xeyli aşağı yerləşdirmə (deployment) maneələri ilə suveren, yüksək dərəcədə fərdiləşdirilmiş Layer-1 şəbəkələri yarada bilərlər.
* Subşəbəkələrarası (Cross-Subnet) Qarşılıqlı Əməliyyat: Teleporter və Avalanche Warp Messaging kimi qabaqcıl kommunikasiya çərçivələri ekosistemdəki müstəqil zəncirlərin məlumat və aktivləri təhlükəsiz şəkildə ötürməsinə imkan verir.
* İnstitusional Real Dünya Aktivləri (RWAs): Ənənəvi maliyyə qurumları və müəssisə platformaları tərəfindən artırılan qəbul, şəbəkənin tokenləşdirilmiş qiymətli kağızlara və uyğunluğa (compliance) hazır infrastrukturuna yönəldilməsini vurğulayır.
Siz Avalanche-in fərdiləşdirilə bilən L1 arxitekturasını izləyirsiniz, yoxsa onun institusional RWA inteqrasiyalarını araşdırırsınız? Fikirlərinizi aşağıda paylaşın! 👇
İmtina: Kriptovalyuta bazarları yüksək dəyişkənlik və risk daşıyır. Ticarət etməzdən və ya investisiya etməzdən əvvəl həmişə öz araşdırmanızı aparın.
#AVAX #Avalanche #Layer1 #CryptoTrading
2
109
·
--
🌊 Sui ($SUI) Yüksək Performanslı 1-ci Səviyyə Layer-1 və Ekosistem İşıqlandırması! ⚡
Qabaqcıl obyekt-mərkəzli məlumat modelləri və yüksək ötürümlü icra mühitləri inkişaf etdikcə, Sui ($SUI) ultra-sürətli əməliyyatlar və sorunsuz istifadəçi onboarding üçün nəzərdə tutulmuş, görkəmli Layer-1 infrastruktur olaraq qalır.
Diqqətdə $SUI saxlamaq üçün əsas məqamlar:
* Obyekt-Mərkəzli Arxitektura: Ənənəvi hesab-əsaslı blokçeynlərdən fərqli olaraq, Sui aktivləri müstəqil obyekt kimi qəbul edir; bu da kütləvi paralel icra və saniyədən aşağı əməliyyat yekunlaşması (finality) ilə nəticələnir.
* Sürtünməsiz İstifadəçi Təcrübəsi: Doğma qazsız (gasless) stabilkoin köçürmələri və zkLogin dəstəyi kimi yenilikçi protokol xüsusiyyətləri Web2 istifadəçilərini Web3 tətbiqlərinə rahat şəkildə körpüləmək üçün nəzərdə tutulub.
* İnstitusional Girişin Genişlənməsi: Spot ETP-lər və institusional etibar vasitələri daxil olmaqla tənzimlənmiş investisiya məhsullarının tətbiqi, ənənəvi kapital ayıranlar üçün bazar əlçatanlığını genişləndirdi.
Sui-nin developer ekosisteminin artımını izləyirsiniz, yoxsa yüksək sürətli mərkəzləşdirilməmiş tətbiqlərindən istifadə edirsiniz? Fikirlərinizi aşağıda paylaşın! 👇
İmtina: Kriptovalyuta bazarları yüksək dəyişkənlik və risk daşıyır. Alqı-satqı və ya investisiya etməzdən əvvəl həmişə öz araşdırmanızı aparın.
#SUI #SuiNetwork #Layer1
🌊 Sui ($SUI ) Yüksək Performanslı 1-ci Səviyyə Layer-1 və Ekosistem İşıqlandırması! ⚡
Qabaqcıl obyekt-mərkəzli məlumat modelləri və yüksək ötürümlü icra mühitləri inkişaf etdikcə, Sui ($SUI ) ultra-sürətli əməliyyatlar və sorunsuz istifadəçi onboarding üçün nəzərdə tutulmuş, görkəmli Layer-1 infrastruktur olaraq qalır.
Diqqətdə $SUI saxlamaq üçün əsas məqamlar:
* Obyekt-Mərkəzli Arxitektura: Ənənəvi hesab-əsaslı blokçeynlərdən fərqli olaraq, Sui aktivləri müstəqil obyekt kimi qəbul edir; bu da kütləvi paralel icra və saniyədən aşağı əməliyyat yekunlaşması (finality) ilə nəticələnir.
* Sürtünməsiz İstifadəçi Təcrübəsi: Doğma qazsız (gasless) stabilkoin köçürmələri və zkLogin dəstəyi kimi yenilikçi protokol xüsusiyyətləri Web2 istifadəçilərini Web3 tətbiqlərinə rahat şəkildə körpüləmək üçün nəzərdə tutulub.
* İnstitusional Girişin Genişlənməsi: Spot ETP-lər və institusional etibar vasitələri daxil olmaqla tənzimlənmiş investisiya məhsullarının tətbiqi, ənənəvi kapital ayıranlar üçün bazar əlçatanlığını genişləndirdi.
Sui-nin developer ekosisteminin artımını izləyirsiniz, yoxsa yüksək sürətli mərkəzləşdirilməmiş tətbiqlərindən istifadə edirsiniz? Fikirlərinizi aşağıda paylaşın! 👇
İmtina: Kriptovalyuta bazarları yüksək dəyişkənlik və risk daşıyır. Alqı-satqı və ya investisiya etməzdən əvvəl həmişə öz araşdırmanızı aparın.
#SUI #SuiNetwork #Layer1
Qabaqcıl obyekt-mərkəzli məlumat modelləri və yüksək ötürümlü icra mühitləri inkişaf etdikcə, Sui ($SUI ) ultra-sürətli əməliyyatlar və sorunsuz istifadəçi onboarding üçün nəzərdə tutulmuş, görkəmli Layer-1 infrastruktur olaraq qalır.
Diqqətdə $SUI saxlamaq üçün əsas məqamlar:
* Obyekt-Mərkəzli Arxitektura: Ənənəvi hesab-əsaslı blokçeynlərdən fərqli olaraq, Sui aktivləri müstəqil obyekt kimi qəbul edir; bu da kütləvi paralel icra və saniyədən aşağı əməliyyat yekunlaşması (finality) ilə nəticələnir.
* Sürtünməsiz İstifadəçi Təcrübəsi: Doğma qazsız (gasless) stabilkoin köçürmələri və zkLogin dəstəyi kimi yenilikçi protokol xüsusiyyətləri Web2 istifadəçilərini Web3 tətbiqlərinə rahat şəkildə körpüləmək üçün nəzərdə tutulub.
* İnstitusional Girişin Genişlənməsi: Spot ETP-lər və institusional etibar vasitələri daxil olmaqla tənzimlənmiş investisiya məhsullarının tətbiqi, ənənəvi kapital ayıranlar üçün bazar əlçatanlığını genişləndirdi.
Sui-nin developer ekosisteminin artımını izləyirsiniz, yoxsa yüksək sürətli mərkəzləşdirilməmiş tətbiqlərindən istifadə edirsiniz? Fikirlərinizi aşağıda paylaşın! 👇
İmtina: Kriptovalyuta bazarları yüksək dəyişkənlik və risk daşıyır. Alqı-satqı və ya investisiya etməzdən əvvəl həmişə öz araşdırmanızı aparın.
#SUI #SuiNetwork #Layer1
2
179
·
--
$ETH dörd saatda qəribə bir canavar iynəsini topladı. 2433-dən 2666-ya qədər çəkdi, sonra yenə 2576-yə qaytardı. Bir K-line 233 bənd gedib. Ticarət həcmi 372 milyon ədəd ETH, dəyəri 9.5 milyard ABŞ dollarına bərabərdir. Bu normal bazar deyil; burada kim isə toplama edir, kim isə qaçır.
Bazar mənzərəsi siqnalları çox aydındır. Dünən bu vaxt ETH hələ 2440 yaxınlığında “döyünürdü”. Birdən bir şam yüksələn kimi qalxdı və düz 2500, 2550, 2600 kimi üç tam psixoloji səviyyəni aşdı. Ən yüksək 2666-ya toxundu. Ardınca isə tez geri düşdü. Üst kölgə 108 bənddir. Belə hərəkət “sınaq məqsədli yüksəliş” adlanır — öküzlər (long) yuxarıdakı satış təzyiqinin nə qədər ağır olduğunu yoxladı. Cavab: yüngül deyil, amma long-ları tamamilə məhv də etməyib. Hazırkı qiymət 2575-in üstündə dayanır, 2500-dən aşağı düşməyib. Bu o deməkdir ki, alıcılar bir mərhələdə sındırılsa da, əsas dayaqları var.
Bazarın duyğu tərəfi də maraqlıdır. Maliyyələşdirmə (funding) dərəcəsi 0.0056% — qiymət 5.26% qalxsa da, funding bu qədər aşağıdır. Adətən belə bir yüksəlişdə dərəcə vaxtında 0.03%-dən yuxarı fırlanır. İndi bu rəqəm nəyi göstərir? Boş (short) mövqelər hələ də təslim olmayıb. Çoxlu sayda short hələ də açıqdır, ETH-nin yenidən aşağı düşəcəyinə bahis edirlər. Bu, əslində yaxşı haldır. Shortlar çıxıb gedməyibsə, qiymət daha yuxarı itələnərsə, məcburi bağlanmalar (liquidasiya) baş verəcək və bu da ikinci dəfə squeeze (böyük sıxılma) yaradar. Bazarın ən qorxduğu şey short-ların çox olması deyil, short-ların hamısının qaçmasıdır ki, heç kim növbəti pəncərəni doldurmasın. İndi isə short hələ də var, sursat da yetərlidir.
Böyük alıcıların hərəkəti: həcm və qiymətə bax. 4h K-line 372 milyon ədəd — gün ərzindəki ticarət həcminin altmış faizindən çoxunu təşkil edir. Pərakəndə investorlar bu miqdarı udmaq gücündə deyil. Bu, institut səviyyəli sifarişdir. Üstəlik yüksəliş 2433-dən başlayıb, 2550-dən yox. Dibdən toplama izləri çox aydın görünür. Böyük oyunçu aşağı səviyyədə çoxlu çip qəbul edib və bir nəfəsə 2666-ya qədər itələyib. Sonra isə nə etdi? Davam edib daha da çəkmədi, əksinə qiyməti geri qaytardı. İki ehtimal var: 1) 2666 yaxınlığında həqiqi satış divarı çıxıb və həzm edilməlidir; 2) bilərəkdən geri çəkib yuyundurmaq (washing) edib arxadan gələnləri kənara atmaq. Mən ikinci ehtimalın tərəfdarıyam. Çünki geri çəkilmə zamanı ticarət həcmi kəskin şəkildə seyrəkləşib; ən son 4h K-line cəmi 46 milyon ədəd olub — əvvəlkinin səkkizdə biri qədər. Həcmin azalaraq geri düzəliş etməsi “satış (çıxış)” mənzərəsi deyil.
Həcm-qiymət quruluşunu ayrı-ayrı parçalayanda görünür. Yüksəliş hissəsi: 2433-dən 2666-ya, həcm 372 milyon ədəd. Geri düzəliş hissəsi: 2666-dan 2575-ə, həcm 46 milyon ədəd. Yüksəliş həcmi geri düzəliş həcminin 8 mislidir. Bu, sağlam “həcmi artıraraq yüksəlmək, sonra həcmi azaltmaqla geri düzəlmək” formasıdır. Əgər əksinə olsaydı — yüksəlişdə həcmi azaldıb geri düzəlişdə həcmi artırmaq — onda zirvə siqnalı olardı. İndi o vəziyyət deyil. Dayaqlar 2500 və 2460-a baxılır. 2500 psixoloji mərhələdir, 2460 isə dünənki consolidation zonanın yuxarı sərhədidir. Bu iki səviyyə qırılmasa, long struktur zədələnməyib. Təzyiq (resistance) 2666-dır; qısa müddətdə onu keçmək üçün yenidən həcm yığmaq lazımdır.
K-line detallarını bir qat da dərinləşək. Son 5 ədəd 4h K-line: ardıcıl müsbət (green) şamlar, bir böyük müsbət şam, uzun yuxarı kölgəli müsbət şam, sonra kiçik müsbət şam. Mərkəz (orbit) yuxarıya sürüşür. Aşağı nöqtələr: 2433-dən 2437-yə, 2445-ə, 2450-yə, sonra 2542-yə qədər mərhələli şəkildə yüksəlib. Yuxarı nöqtələr: 2459-dan 2472-yə, 2483-ə, 2666-ya, sonra 2582-yə qədər də yuxarıya doğru hərəkət edir — bu da artan kanalın standart strukturudur. Tək problem odur ki, 2666 şamında uzun üst kölgə qalıb. Bu üst kölgə qısa müddətdə təzyiq kimi görünə bilər. Amma sonradan, əgər üst kölgəni yeyən bir gövdəli müsbət şam bağlansa, o zaman “psixik adam işarəsi” (仙人指路) kimi olur — üst kölgə təzyiq deyil, istiqamətdir.
ETH-ə mənim izah etməyimə ehtiyac yoxdur. Smart contract-ların babası, DeFi-nin baza aktividir, staking sektorunun əsas nişanıdır. Bu etiketlər illərdir yapışıb. Amma indi bazar daha çox ETF pul axınlarına və Layer2 ekosisteminin genişlənməsinə diqqət edir. Yenə də dürüst desək, bu narrativlər qiymət qarşısında hələ də köməkçi roldadır. ETH bu il 3800-dən 2200-ə düşüb, sonra 2200-dən geri qayıdıb 2600-ə çəkilib. Böyük intervalda dalğalanma var. İndi də intervalın yuxarı kənarında sınaq edilir.
Ninienin planı: cari qiymət 2576-dır. Mən artımın dalınca (FOMO) getmirəm. Geri düzəliş zamanı 2500-2520 aralığına qayıdıb orada mərhələli long edəcəyəm. Stop-loss 2430-da — o böyük müsbət şamın start nöqtəsinin altındadır. Məqsəd: 2666-nın qırılmasından sonra 2750-2800. Əgər geri düzəliş 2520-yə çatmasa və düz elə yuxarı gedərsə, bu əməliyyat edilməyəcək. Bazarın həmişə şansı olur, bir dənə ilə qalmır. Strategiya fərdiləşdirilməlidir, Ninieni ilə də əlaqə saxlamaq olar.
#ETH #Layer1 #智能合约
$ETH dörd saatda qəribə bir canavar iynəsini topladı. 2433-dən 2666-ya qədər çəkdi, sonra yenə 2576-yə qaytardı. Bir K-line 233 bənd gedib. Ticarət həcmi 372 milyon ədəd ETH, dəyəri 9.5 milyard ABŞ dollarına bərabərdir. Bu normal bazar deyil; burada kim isə toplama edir, kim isə qaçır.
Bazar mənzərəsi siqnalları çox aydındır. Dünən bu vaxt ETH hələ 2440 yaxınlığında “döyünürdü”. Birdən bir şam yüksələn kimi qalxdı və düz 2500, 2550, 2600 kimi üç tam psixoloji səviyyəni aşdı. Ən yüksək 2666-ya toxundu. Ardınca isə tez geri düşdü. Üst kölgə 108 bənddir. Belə hərəkət “sınaq məqsədli yüksəliş” adlanır — öküzlər (long) yuxarıdakı satış təzyiqinin nə qədər ağır olduğunu yoxladı. Cavab: yüngül deyil, amma long-ları tamamilə məhv də etməyib. Hazırkı qiymət 2575-in üstündə dayanır, 2500-dən aşağı düşməyib. Bu o deməkdir ki, alıcılar bir mərhələdə sındırılsa da, əsas dayaqları var.
Bazarın duyğu tərəfi də maraqlıdır. Maliyyələşdirmə (funding) dərəcəsi 0.0056% — qiymət 5.26% qalxsa da, funding bu qədər aşağıdır. Adətən belə bir yüksəlişdə dərəcə vaxtında 0.03%-dən yuxarı fırlanır. İndi bu rəqəm nəyi göstərir? Boş (short) mövqelər hələ də təslim olmayıb. Çoxlu sayda short hələ də açıqdır, ETH-nin yenidən aşağı düşəcəyinə bahis edirlər. Bu, əslində yaxşı haldır. Shortlar çıxıb gedməyibsə, qiymət daha yuxarı itələnərsə, məcburi bağlanmalar (liquidasiya) baş verəcək və bu da ikinci dəfə squeeze (böyük sıxılma) yaradar. Bazarın ən qorxduğu şey short-ların çox olması deyil, short-ların hamısının qaçmasıdır ki, heç kim növbəti pəncərəni doldurmasın. İndi isə short hələ də var, sursat da yetərlidir.
Böyük alıcıların hərəkəti: həcm və qiymətə bax. 4h K-line 372 milyon ədəd — gün ərzindəki ticarət həcminin altmış faizindən çoxunu təşkil edir. Pərakəndə investorlar bu miqdarı udmaq gücündə deyil. Bu, institut səviyyəli sifarişdir. Üstəlik yüksəliş 2433-dən başlayıb, 2550-dən yox. Dibdən toplama izləri çox aydın görünür. Böyük oyunçu aşağı səviyyədə çoxlu çip qəbul edib və bir nəfəsə 2666-ya qədər itələyib. Sonra isə nə etdi? Davam edib daha da çəkmədi, əksinə qiyməti geri qaytardı. İki ehtimal var: 1) 2666 yaxınlığında həqiqi satış divarı çıxıb və həzm edilməlidir; 2) bilərəkdən geri çəkib yuyundurmaq (washing) edib arxadan gələnləri kənara atmaq. Mən ikinci ehtimalın tərəfdarıyam. Çünki geri çəkilmə zamanı ticarət həcmi kəskin şəkildə seyrəkləşib; ən son 4h K-line cəmi 46 milyon ədəd olub — əvvəlkinin səkkizdə biri qədər. Həcmin azalaraq geri düzəliş etməsi “satış (çıxış)” mənzərəsi deyil.
Həcm-qiymət quruluşunu ayrı-ayrı parçalayanda görünür. Yüksəliş hissəsi: 2433-dən 2666-ya, həcm 372 milyon ədəd. Geri düzəliş hissəsi: 2666-dan 2575-ə, həcm 46 milyon ədəd. Yüksəliş həcmi geri düzəliş həcminin 8 mislidir. Bu, sağlam “həcmi artıraraq yüksəlmək, sonra həcmi azaltmaqla geri düzəlmək” formasıdır. Əgər əksinə olsaydı — yüksəlişdə həcmi azaldıb geri düzəlişdə həcmi artırmaq — onda zirvə siqnalı olardı. İndi o vəziyyət deyil. Dayaqlar 2500 və 2460-a baxılır. 2500 psixoloji mərhələdir, 2460 isə dünənki consolidation zonanın yuxarı sərhədidir. Bu iki səviyyə qırılmasa, long struktur zədələnməyib. Təzyiq (resistance) 2666-dır; qısa müddətdə onu keçmək üçün yenidən həcm yığmaq lazımdır.
K-line detallarını bir qat da dərinləşək. Son 5 ədəd 4h K-line: ardıcıl müsbət (green) şamlar, bir böyük müsbət şam, uzun yuxarı kölgəli müsbət şam, sonra kiçik müsbət şam. Mərkəz (orbit) yuxarıya sürüşür. Aşağı nöqtələr: 2433-dən 2437-yə, 2445-ə, 2450-yə, sonra 2542-yə qədər mərhələli şəkildə yüksəlib. Yuxarı nöqtələr: 2459-dan 2472-yə, 2483-ə, 2666-ya, sonra 2582-yə qədər də yuxarıya doğru hərəkət edir — bu da artan kanalın standart strukturudur. Tək problem odur ki, 2666 şamında uzun üst kölgə qalıb. Bu üst kölgə qısa müddətdə təzyiq kimi görünə bilər. Amma sonradan, əgər üst kölgəni yeyən bir gövdəli müsbət şam bağlansa, o zaman “psixik adam işarəsi” (仙人指路) kimi olur — üst kölgə təzyiq deyil, istiqamətdir.
ETH-ə mənim izah etməyimə ehtiyac yoxdur. Smart contract-ların babası, DeFi-nin baza aktividir, staking sektorunun əsas nişanıdır. Bu etiketlər illərdir yapışıb. Amma indi bazar daha çox ETF pul axınlarına və Layer2 ekosisteminin genişlənməsinə diqqət edir. Yenə də dürüst desək, bu narrativlər qiymət qarşısında hələ də köməkçi roldadır. ETH bu il 3800-dən 2200-ə düşüb, sonra 2200-dən geri qayıdıb 2600-ə çəkilib. Böyük intervalda dalğalanma var. İndi də intervalın yuxarı kənarında sınaq edilir.
Ninienin planı: cari qiymət 2576-dır. Mən artımın dalınca (FOMO) getmirəm. Geri düzəliş zamanı 2500-2520 aralığına qayıdıb orada mərhələli long edəcəyəm. Stop-loss 2430-da — o böyük müsbət şamın start nöqtəsinin altındadır. Məqsəd: 2666-nın qırılmasından sonra 2750-2800. Əgər geri düzəliş 2520-yə çatmasa və düz elə yuxarı gedərsə, bu əməliyyat edilməyəcək. Bazarın həmişə şansı olur, bir dənə ilə qalmır. Strategiya fərdiləşdirilməlidir, Ninieni ilə də əlaqə saxlamaq olar.
#ETH #Layer1 #智能合约
Bazar mənzərəsi siqnalları çox aydındır. Dünən bu vaxt ETH hələ 2440 yaxınlığında “döyünürdü”. Birdən bir şam yüksələn kimi qalxdı və düz 2500, 2550, 2600 kimi üç tam psixoloji səviyyəni aşdı. Ən yüksək 2666-ya toxundu. Ardınca isə tez geri düşdü. Üst kölgə 108 bənddir. Belə hərəkət “sınaq məqsədli yüksəliş” adlanır — öküzlər (long) yuxarıdakı satış təzyiqinin nə qədər ağır olduğunu yoxladı. Cavab: yüngül deyil, amma long-ları tamamilə məhv də etməyib. Hazırkı qiymət 2575-in üstündə dayanır, 2500-dən aşağı düşməyib. Bu o deməkdir ki, alıcılar bir mərhələdə sındırılsa da, əsas dayaqları var.
Bazarın duyğu tərəfi də maraqlıdır. Maliyyələşdirmə (funding) dərəcəsi 0.0056% — qiymət 5.26% qalxsa da, funding bu qədər aşağıdır. Adətən belə bir yüksəlişdə dərəcə vaxtında 0.03%-dən yuxarı fırlanır. İndi bu rəqəm nəyi göstərir? Boş (short) mövqelər hələ də təslim olmayıb. Çoxlu sayda short hələ də açıqdır, ETH-nin yenidən aşağı düşəcəyinə bahis edirlər. Bu, əslində yaxşı haldır. Shortlar çıxıb gedməyibsə, qiymət daha yuxarı itələnərsə, məcburi bağlanmalar (liquidasiya) baş verəcək və bu da ikinci dəfə squeeze (böyük sıxılma) yaradar. Bazarın ən qorxduğu şey short-ların çox olması deyil, short-ların hamısının qaçmasıdır ki, heç kim növbəti pəncərəni doldurmasın. İndi isə short hələ də var, sursat da yetərlidir.
Böyük alıcıların hərəkəti: həcm və qiymətə bax. 4h K-line 372 milyon ədəd — gün ərzindəki ticarət həcminin altmış faizindən çoxunu təşkil edir. Pərakəndə investorlar bu miqdarı udmaq gücündə deyil. Bu, institut səviyyəli sifarişdir. Üstəlik yüksəliş 2433-dən başlayıb, 2550-dən yox. Dibdən toplama izləri çox aydın görünür. Böyük oyunçu aşağı səviyyədə çoxlu çip qəbul edib və bir nəfəsə 2666-ya qədər itələyib. Sonra isə nə etdi? Davam edib daha da çəkmədi, əksinə qiyməti geri qaytardı. İki ehtimal var: 1) 2666 yaxınlığında həqiqi satış divarı çıxıb və həzm edilməlidir; 2) bilərəkdən geri çəkib yuyundurmaq (washing) edib arxadan gələnləri kənara atmaq. Mən ikinci ehtimalın tərəfdarıyam. Çünki geri çəkilmə zamanı ticarət həcmi kəskin şəkildə seyrəkləşib; ən son 4h K-line cəmi 46 milyon ədəd olub — əvvəlkinin səkkizdə biri qədər. Həcmin azalaraq geri düzəliş etməsi “satış (çıxış)” mənzərəsi deyil.
Həcm-qiymət quruluşunu ayrı-ayrı parçalayanda görünür. Yüksəliş hissəsi: 2433-dən 2666-ya, həcm 372 milyon ədəd. Geri düzəliş hissəsi: 2666-dan 2575-ə, həcm 46 milyon ədəd. Yüksəliş həcmi geri düzəliş həcminin 8 mislidir. Bu, sağlam “həcmi artıraraq yüksəlmək, sonra həcmi azaltmaqla geri düzəlmək” formasıdır. Əgər əksinə olsaydı — yüksəlişdə həcmi azaldıb geri düzəlişdə həcmi artırmaq — onda zirvə siqnalı olardı. İndi o vəziyyət deyil. Dayaqlar 2500 və 2460-a baxılır. 2500 psixoloji mərhələdir, 2460 isə dünənki consolidation zonanın yuxarı sərhədidir. Bu iki səviyyə qırılmasa, long struktur zədələnməyib. Təzyiq (resistance) 2666-dır; qısa müddətdə onu keçmək üçün yenidən həcm yığmaq lazımdır.
K-line detallarını bir qat da dərinləşək. Son 5 ədəd 4h K-line: ardıcıl müsbət (green) şamlar, bir böyük müsbət şam, uzun yuxarı kölgəli müsbət şam, sonra kiçik müsbət şam. Mərkəz (orbit) yuxarıya sürüşür. Aşağı nöqtələr: 2433-dən 2437-yə, 2445-ə, 2450-yə, sonra 2542-yə qədər mərhələli şəkildə yüksəlib. Yuxarı nöqtələr: 2459-dan 2472-yə, 2483-ə, 2666-ya, sonra 2582-yə qədər də yuxarıya doğru hərəkət edir — bu da artan kanalın standart strukturudur. Tək problem odur ki, 2666 şamında uzun üst kölgə qalıb. Bu üst kölgə qısa müddətdə təzyiq kimi görünə bilər. Amma sonradan, əgər üst kölgəni yeyən bir gövdəli müsbət şam bağlansa, o zaman “psixik adam işarəsi” (仙人指路) kimi olur — üst kölgə təzyiq deyil, istiqamətdir.
ETH-ə mənim izah etməyimə ehtiyac yoxdur. Smart contract-ların babası, DeFi-nin baza aktividir, staking sektorunun əsas nişanıdır. Bu etiketlər illərdir yapışıb. Amma indi bazar daha çox ETF pul axınlarına və Layer2 ekosisteminin genişlənməsinə diqqət edir. Yenə də dürüst desək, bu narrativlər qiymət qarşısında hələ də köməkçi roldadır. ETH bu il 3800-dən 2200-ə düşüb, sonra 2200-dən geri qayıdıb 2600-ə çəkilib. Böyük intervalda dalğalanma var. İndi də intervalın yuxarı kənarında sınaq edilir.
Ninienin planı: cari qiymət 2576-dır. Mən artımın dalınca (FOMO) getmirəm. Geri düzəliş zamanı 2500-2520 aralığına qayıdıb orada mərhələli long edəcəyəm. Stop-loss 2430-da — o böyük müsbət şamın start nöqtəsinin altındadır. Məqsəd: 2666-nın qırılmasından sonra 2750-2800. Əgər geri düzəliş 2520-yə çatmasa və düz elə yuxarı gedərsə, bu əməliyyat edilməyəcək. Bazarın həmişə şansı olur, bir dənə ilə qalmır. Strategiya fərdiləşdirilməlidir, Ninieni ilə də əlaqə saxlamaq olar.
#ETH #Layer1 #智能合约
307
·
--
$NEAR at $2.61 civarında 30 günlük zirvəyə çatmaq üzrədir, yoxsa gecikmiş longlar tələyə düşür?
@nearprotocol bu gün 5.5% yuxarıdır, $96.63M ticarət olunub. 4 saatlıq hərəkət +5.7% təşkil edir, həcmi 20 günlük orta göstəricisinin 1.6 mislidir və RSI 64-dir—bu da impulsun real olduğunu göstərir, amma istiləşmə var. Qiymət 20 günlük və 50 günlük MA-ların üstündədir, 30 günlük zirvədən cəmi 4% aşağıdadır. Fondung 0.006% olduğu üçün longlar ödəyir.
$2.61 səviyyəsinə sərt şəkildə diqqət edərdim. Orada saxlayın, mən səbirli qalacağam. İmtina olsa, qovalamıram. $BTC əhvalı müəyyənləşdirir, amma NEAR hazırda öz alıcısı ilə dəstəklənir 🔥📈
#NEARProtocol #Layer1
$NEAR at $2.61 civarında 30 günlük zirvəyə çatmaq üzrədir, yoxsa gecikmiş longlar tələyə düşür?
@nearprotocol bu gün 5.5% yuxarıdır, $96.63M ticarət olunub. 4 saatlıq hərəkət +5.7% təşkil edir, həcmi 20 günlük orta göstəricisinin 1.6 mislidir və RSI 64-dir—bu da impulsun real olduğunu göstərir, amma istiləşmə var. Qiymət 20 günlük və 50 günlük MA-ların üstündədir, 30 günlük zirvədən cəmi 4% aşağıdadır. Fondung 0.006% olduğu üçün longlar ödəyir.
$2.61 səviyyəsinə sərt şəkildə diqqət edərdim. Orada saxlayın, mən səbirli qalacağam. İmtina olsa, qovalamıram. $BTC əhvalı müəyyənləşdirir, amma NEAR hazırda öz alıcısı ilə dəstəklənir 🔥📈
#NEARProtocol #Layer1
@nearprotocol bu gün 5.5% yuxarıdır, $96.63M ticarət olunub. 4 saatlıq hərəkət +5.7% təşkil edir, həcmi 20 günlük orta göstəricisinin 1.6 mislidir və RSI 64-dir—bu da impulsun real olduğunu göstərir, amma istiləşmə var. Qiymət 20 günlük və 50 günlük MA-ların üstündədir, 30 günlük zirvədən cəmi 4% aşağıdadır. Fondung 0.006% olduğu üçün longlar ödəyir.
$2.61 səviyyəsinə sərt şəkildə diqqət edərdim. Orada saxlayın, mən səbirli qalacağam. İmtina olsa, qovalamıram. $BTC əhvalı müəyyənləşdirir, amma NEAR hazırda öz alıcısı ilə dəstəklənir 🔥📈
#NEARProtocol #Layer1
135
Daha çox kontent araşdırmaq üçün daxil olun
Binance Square-də qlobal kriptovalyuta istifadəçilərinə qoşulun
⚡️ Kriptovalyuta haqqında ən son və faydalı məlumatları əldə edin.
💬 Dünyanın ən böyük kriptovalyuta birjası tərəfindən etibar edilir.
👍 Doğrulanmış yaradıcılardan gələn real məlumatları kəşf edin.
E-poçt/Telefon nömrəsi
Trenddə olan mövzular
1
#AnthropicCEOCallsForAISlowdown
80,596 baxış
Müzakirə edir: 1,217
2
#BitcoinThirdSingleBlockReorgInFourWeeks
10,645 baxış
Müzakirə edir: 343
3
#EthereumFallsBelow$2500
648 baxış
Müzakirə edir: 46
4
#BitcoinDropsToIntradayLow$76367
255 baxış
Müzakirə edir: 8
5
#WhiteHouseRejectsAISlowdownCalls
439 baxış
Müzakirə edir: 44
6
#UKMayExemptTokenizedGoldFromFundRules
195 baxış
Müzakirə edir: 27
7
#BitcoinSpotETFsRecord$463MNetOutflowLastWeek
19 baxış
Müzakirə edir: 2
8
#LSKSurgesOver515%In24Hours
9,703 baxış
Müzakirə edir: 200
9
#ClarityActLawIn2026OddsRiseTo30%
6,408 baxış
Müzakirə edir: 112
10
#KoreaCryptoTaxDelayPetitionMeetsReviewThreshold
1,709 baxış
Müzakirə edir: 61