

Atta_e_Abbas110
3 منشورات

Atta_e_Abbas110
إبلاغ
حظر المُستخدم
10 تتابع
22 المتابعون
14 إعجاب
منشورات
🧠 إدارة المخاطر مقابل تقلبات السوق: إلى أين تتجه السيولة؟
مع استمرار $BTC في الهيمنة بقوة بنسبة تتجاوز 59%، وتغيّر عوائد الأصول الكلية، يشهد السوق انقسامًا مألوفًا: رأس المال المؤسسي يعطي الأولوية للأمان، بينما يبحث المتداولون النشطون عن التقلبات في العملات البديلة ذات أحجام التداول المرتفعة.
لا يعتمد التعامل الناجح مع ظروف السوق هذه على تخمين القمة أو القاع بدقة، بل على تطبيق إطار منهجي لإدارة المخاطر.
إليك 3 قواعد للتنفيذ ينبغي لكل متداول اتباعها الآن:
1️⃣ الانضباط في استخدام الهامش مهم (معزول أم متقاطع)
في التقلبات الحادة، قد يؤدي الإفراط في استخدام الرافعة المالية مع الهامش المتقاطع إلى تعريض رصيد حسابك بالكامل للخطر. يحد استخدام الهامش المعزول من خسائرك في كل صفقة ويحافظ على رأس مالك الأساسي.
2️⃣ راقب سيولة دفتر الأوامر والخرائط الحرارية
لا تتداول عشوائيًا عند مستويات المقاومة. راجع خرائط عمق السوق لتحديد مواقع جدران البيع الفعلية وتجمعات السيولة قبل وضع أوامر محددة السعر. غالبًا ما تحدث الاختراقات الوهمية عندما تتراجع السيولة مع انخفاض حجم التداول.
3️⃣ أعطِ الأولوية للحفاظ على رأس المال
تركز الاستراتيجية الرابحة على المكاسب المحتملة، أما الاستراتيجية المستدامة فتركز على الحماية من الخسائر. احسب دائمًا حجم مركزك بناءً على أقصى نسبة خسارة مقبولة، لا على الربح المحتمل.
📌 محور الاهتمام الحالي وإعدادات المجتمع:
هل تحتفظ بمراكز فورية خلال مرحلة التماسك هذه، أم تضارب بنشاط على التقلبات قصيرة الأجل؟
شارك إعداداتك ومستويات الأسعار الرئيسية أدناه! 👇
$BTC $ETH
#CryptoTrading. #BinanceSquareFamily #writetoearn #RiskManagementMastery #MarketAnalysis
98
عرض الترجمة
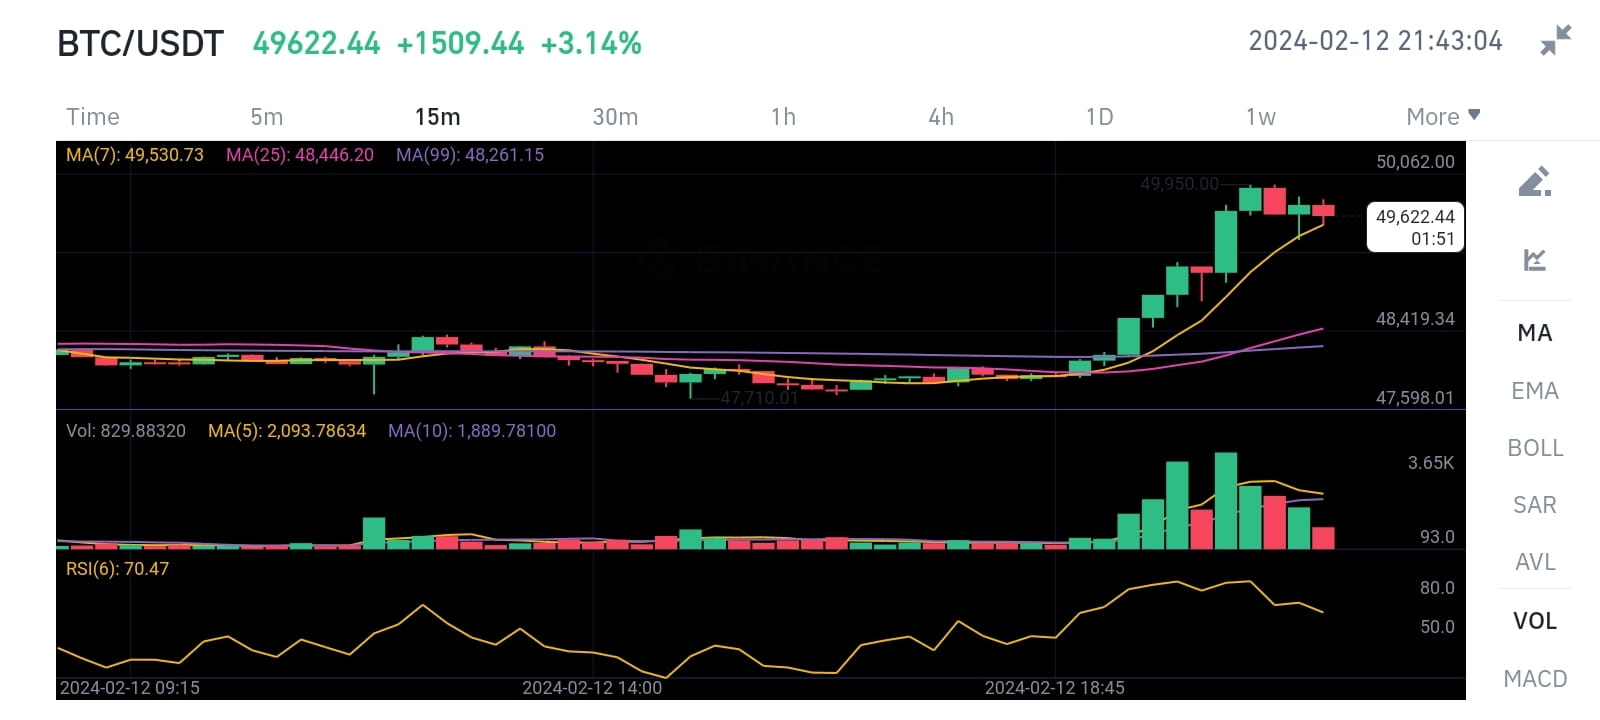
$BTC I can try to help you with that. Here is my analysis of the chart:
The chart shows the price movement of BTC/USDT (Bitcoin/Tether) trading pair on a 15-minute time frame.
The price is in an uptrend, as indicated by the higher highs and higher lows, and the moving averages (MA7, MA25, MA99) being in ascending order.
The support point is around 47,598.01, where the price had a consolidation before moving upwards. This level can act as a floor for the price, and if it breaks below it, it may signal a reversal of the trend.
The resistance point is at 50,062.00, where the highest price is marked. This level can act as a ceiling for the price, and if it breaks above it, it may signal a continuation of the trend.
The RSI (Relative Strength Index) is at 70.47, which is close to the overbought zone (above 70). This means that the price may be overvalued and due for a correction or a pullback.
The volume bars show that the buying volume is higher than the selling volume, which confirms the bullish sentiment of the market.
Based on this analysis, one possible trading strategy is to buy BTC/USDT at the support level of 47,598.01, and sell it at the resistance level of 50,062.00, or hold it until the trend changes. However, this is not a financial advice, and you should do your own research and risk management before making any trading decisions.
if you want more analysis like this you have to like comment
#Write2Earn
#TrendingTopic #BTC
7
984
عرض الترجمة
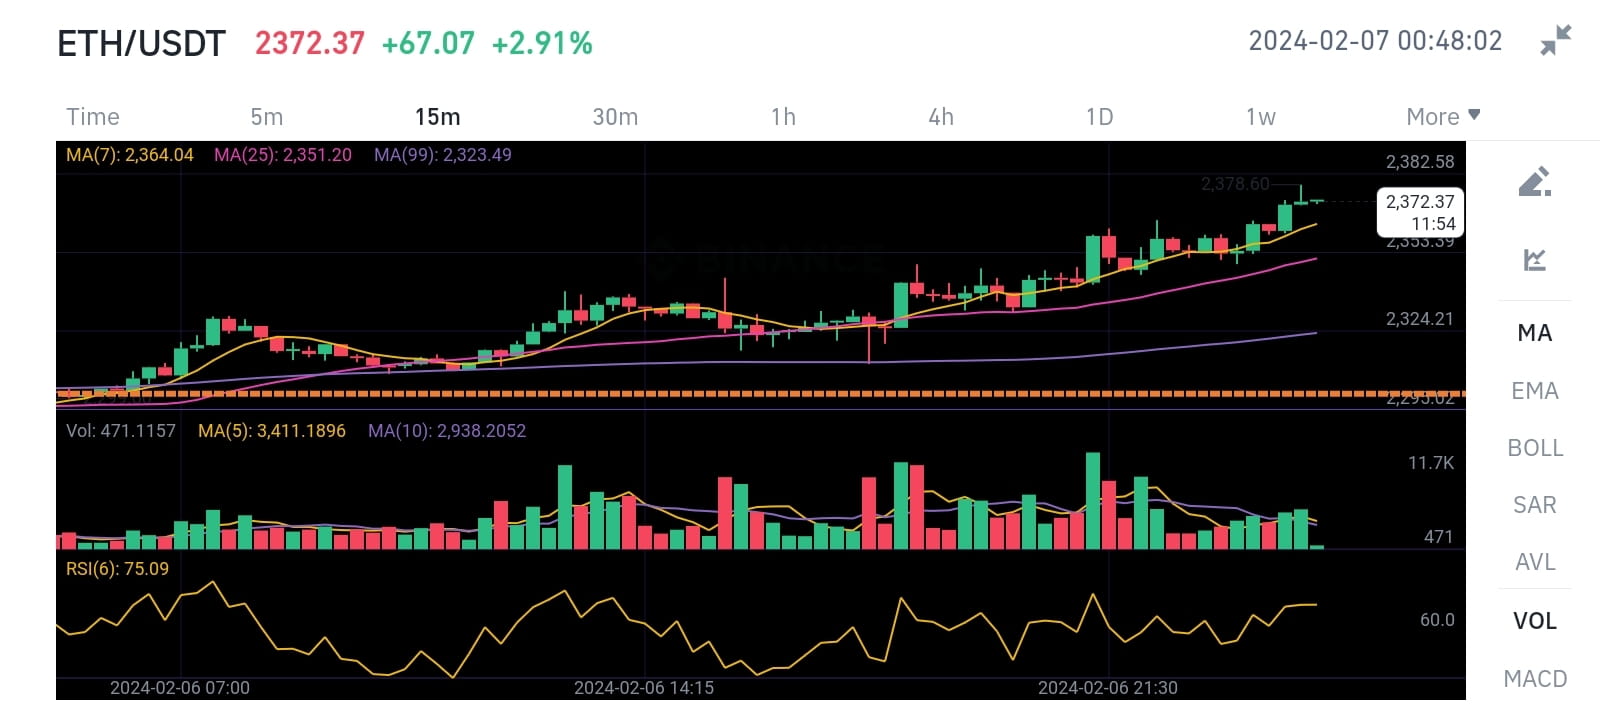
$ETH This is my technical analysis for this chart. I hope you find it helpful. 😊
The support can be identified around the price of 2324.21 USDT where the price has bounced back up previously. This level also coincides with the MA99 line, which adds to its strength as a support. If the price breaks below this level, it could indicate a bearish trend and the next support could be around 2300 USDT where the price has found support in the past.
The resistance point is likely near the current high in this image at 2372.37 USDT. This level is also close to the RSI overbought zone, which suggests that the price might face some selling pressure and pull back. If the price breaks above this level, it could indicate a bullish trend and the next resistance could be around 2400 USDT where the price has faced resistance in the past.#Write2Earn #Write2Earn #Write2Earn
7
2.1k
سجّل الدخول لاستكشاف المزيد من المُحتوى
انضم إلى مُستخدمي العملات الرقمية حول العالم على Binance Square
⚡️ احصل على أحدث المعلومات المفيدة عن العملات الرقمية.
💬 موثوقة من قبل أكبر منصّة لتداول العملات الرقمية في العالم.
👍 اكتشف الرؤى الحقيقية من صنّاع المُحتوى الموثوقين.
البريد الإلكتروني / رقم الهاتف
المواضيع الرائجة
CanMicrosoftDeliverOnAI
368,268 مشاهدات
2,906 يقومون بالنقاش
جلسة موسم الأرباح 3: هل ستتجاوز نتائج Google وMicrosoft توقعات الأرباح؟
Binance Square Official
·141 إعجاب
·70k مشاهدات
CanGoogleDefindItsCore
217,847 مشاهدات
2,062 يقومون بالنقاش
EarningsSeason
5.9M مشاهدات
28,947 يقومون بالنقاش