
Mr_Aamir
26 منشورات

Mr_Aamir
إبلاغ
حظر المُستخدم
3 تتابع
5 المتابعون
7 إعجاب
منشورات
·
--
من يمتلك البيتكوين؟ أكبر 10 حائزينلم يسبق أن كانت ملكية البيتكوين مركزة أكثر من الآن — أو أكثر مؤسسية. إليك تفصيل لمن يتحكم في أكبر كمية من BTC على الكوكب الآن.
---
#ساتوشي ناكاموتو لا يزال في القمة، ثابت وغير متأثر. المُبدع المجهول للبيتكوين يحتفظ بحوالي 1,096,361 #BTC — تقريباً 5.22% من إجمالي العرض البالغ 21 مليون. هذه العملات لم تتحرك منذ الأيام الأولى للشبكة، ومن المحتمل ألا تتحرك أبداً.
#Coinbase تحتل المرتبة #2 مع حوالي 958,000 BTC (~4.56%) محتفظ بها كمنصة تبادل وحفظ — رغم أن حيازاتها شهدت انخفاضاً طفيفاً مؤخراً.
من يمتلك البيتكوين؟ أكبر 10 حائزين
لم يسبق أن كانت ملكية البيتكوين مركزة أكثر من الآن — أو أكثر مؤسسية. إليك تفصيل لمن يتحكم في أكبر كمية من BTC على الكوكب الآن.
---
#ساتوشي ناكاموتو لا يزال في القمة، ثابت وغير متأثر. المُبدع المجهول للبيتكوين يحتفظ بحوالي 1,096,361 #BTC — تقريباً 5.22% من إجمالي العرض البالغ 21 مليون. هذه العملات لم تتحرك منذ الأيام الأولى للشبكة، ومن المحتمل ألا تتحرك أبداً.
#Coinbase تحتل المرتبة #2 مع حوالي 958,000 BTC (~4.56%) محتفظ بها كمنصة تبادل وحفظ — رغم أن حيازاتها شهدت انخفاضاً طفيفاً مؤخراً.
---
#ساتوشي ناكاموتو لا يزال في القمة، ثابت وغير متأثر. المُبدع المجهول للبيتكوين يحتفظ بحوالي 1,096,361 #BTC — تقريباً 5.22% من إجمالي العرض البالغ 21 مليون. هذه العملات لم تتحرك منذ الأيام الأولى للشبكة، ومن المحتمل ألا تتحرك أبداً.
#Coinbase تحتل المرتبة #2 مع حوالي 958,000 BTC (~4.56%) محتفظ بها كمنصة تبادل وحفظ — رغم أن حيازاتها شهدت انخفاضاً طفيفاً مؤخراً.
81
·
--
عرض الترجمة
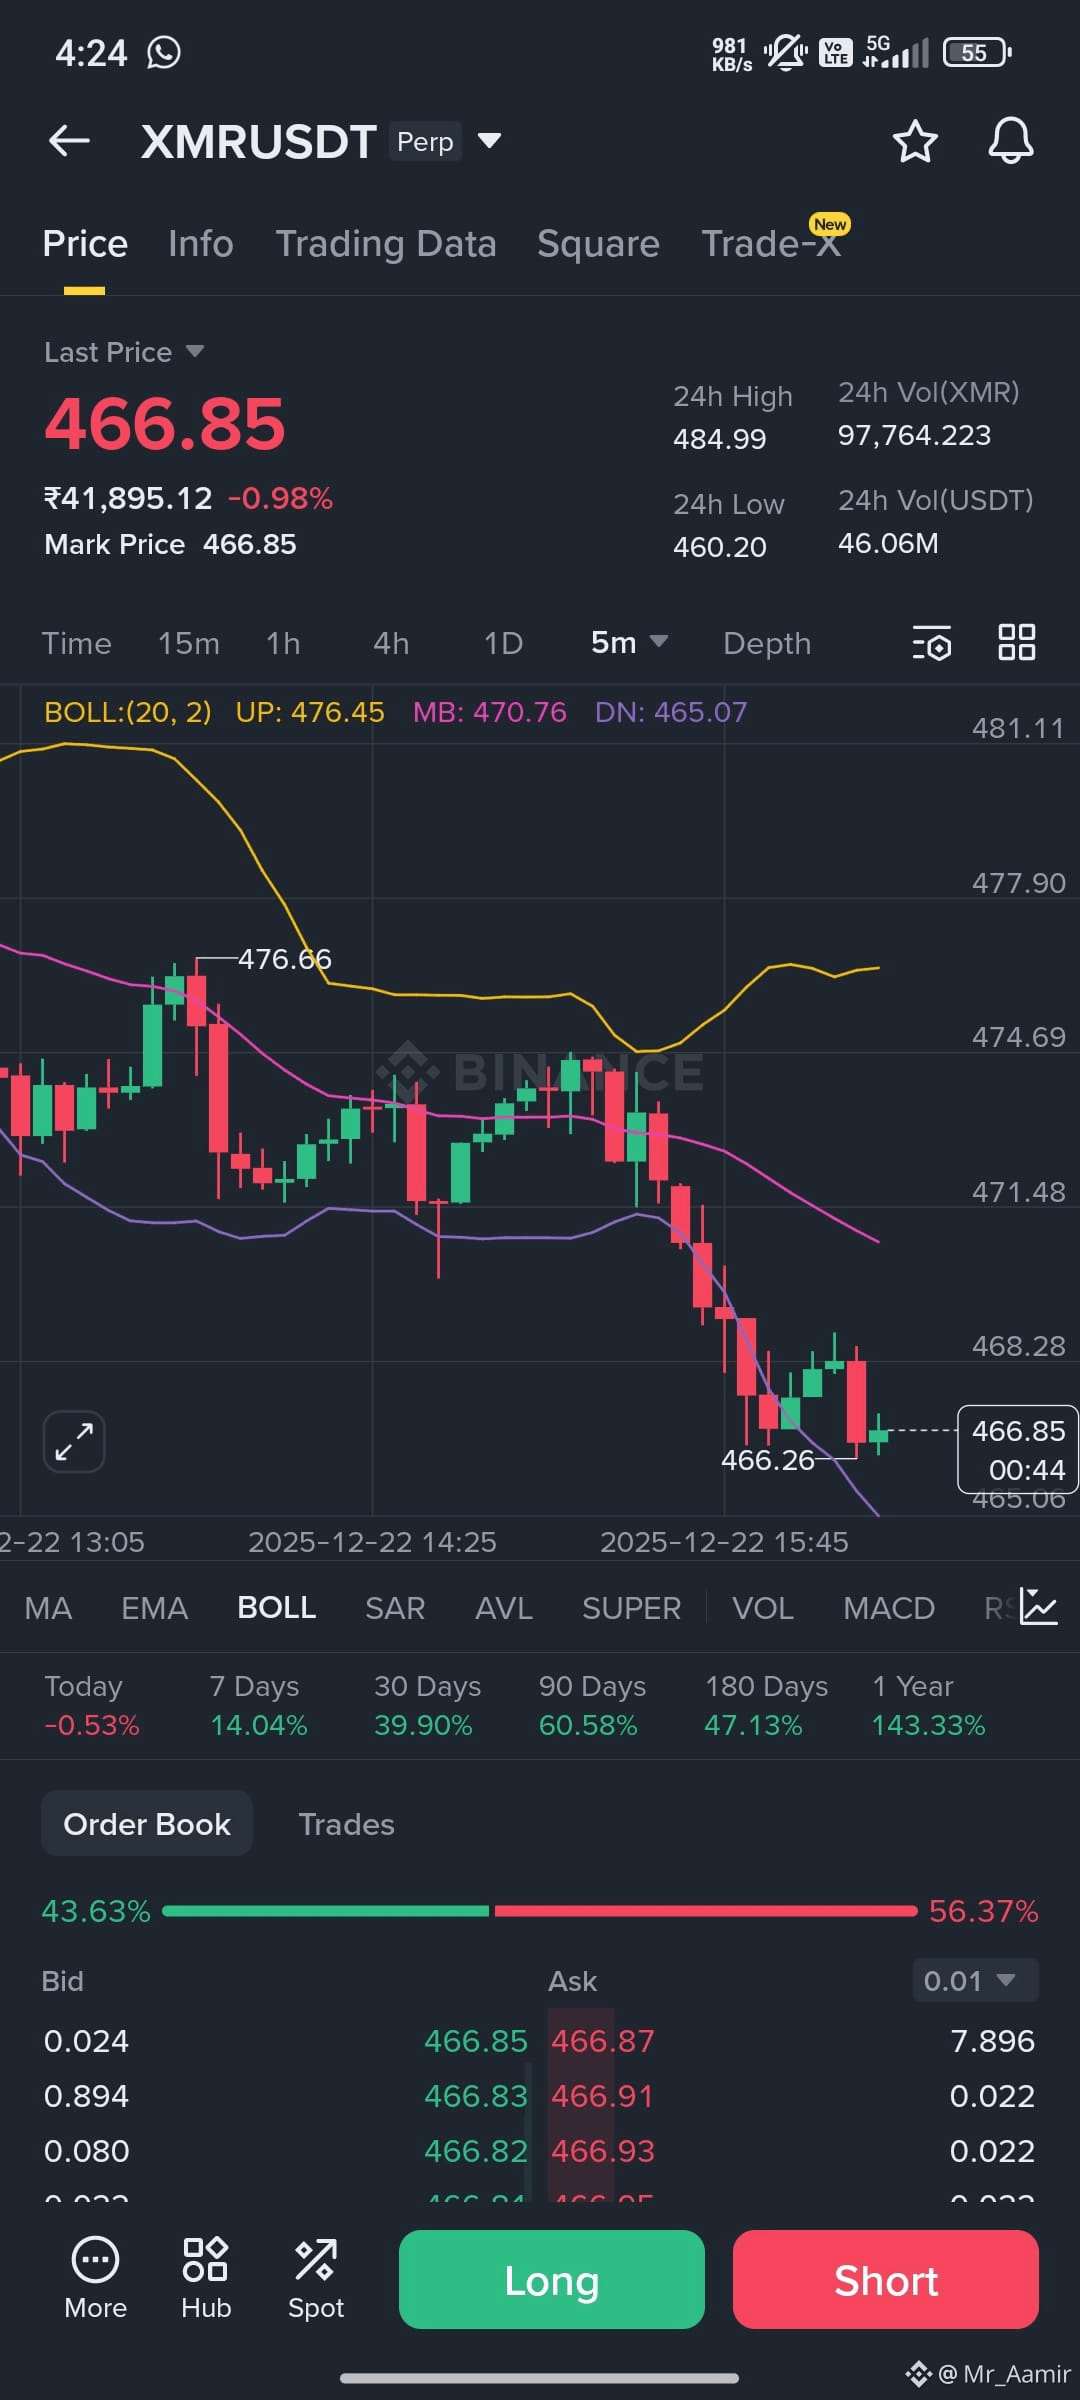
💥 Futures LONG Setup
✅ Long
$XMR /USDT
Entry zone : 453.63 - 467.67
Take Profits :
469.98
483.94
497.90
511.86
525.82
Stop loss :434.9331
Leverage: 10x
#XMR
{future}(XMRUSDT)
💥 Futures LONG Setup
✅ Long
$XMR /USDT
Entry zone : 453.63 - 467.67
Take Profits :
469.98
483.94
497.90
511.86
525.82
Stop loss :434.9331
Leverage: 10x
#XMR
✅ Long
$XMR /USDT
Entry zone : 453.63 - 467.67
Take Profits :
469.98
483.94
497.90
511.86
525.82
Stop loss :434.9331
Leverage: 10x
#XMR
3
·
--
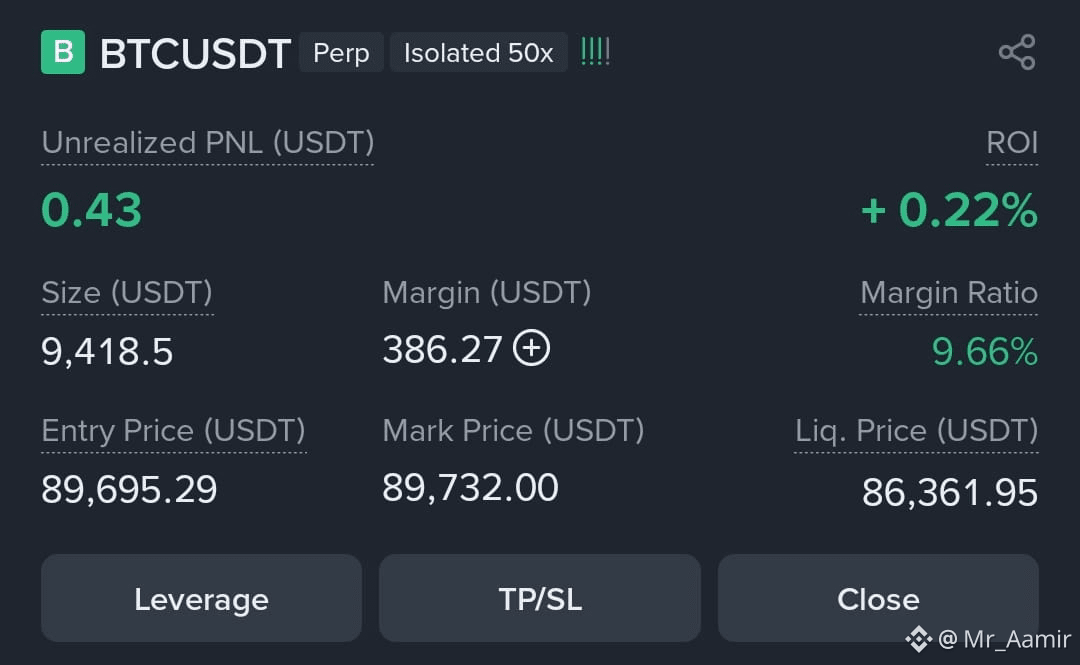
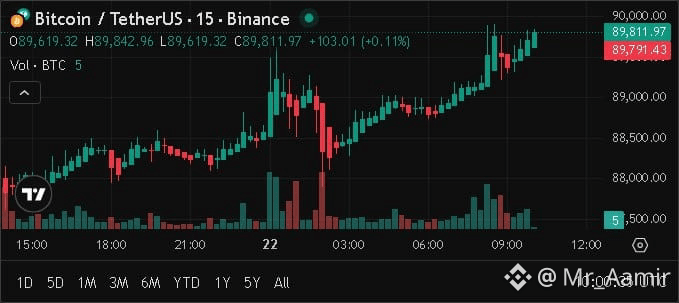
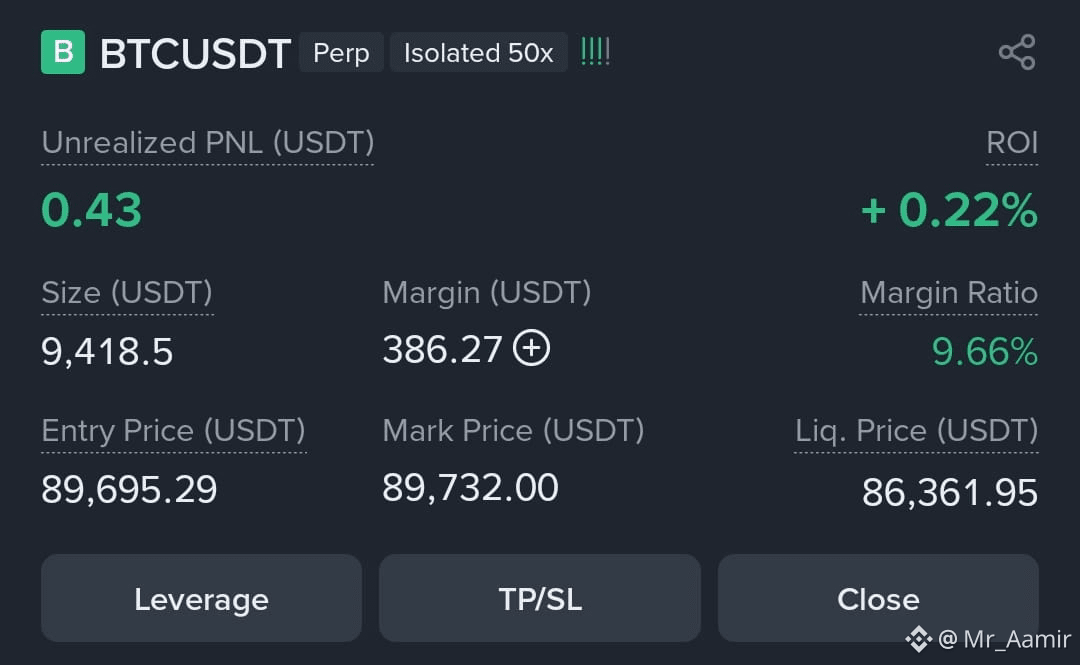
$BTC /USDT - طويل🟢 إعداد
دخول: 89785.3
إيقاف الخسارة: 85557.19574
الهدف 1: 90623.89008
الهدف 2: 92370.08177
الهدف 3: 94674.93057
الهدف 4: 96733.02143
الرافعة المالية: x32
#BTC
$BTC /USDT - طويل🟢 إعداد
دخول: 89785.3
إيقاف الخسارة: 85557.19574
الهدف 1: 90623.89008
الهدف 2: 92370.08177
الهدف 3: 94674.93057
الهدف 4: 96733.02143
الرافعة المالية: x32
#BTC
دخول: 89785.3
إيقاف الخسارة: 85557.19574
الهدف 1: 90623.89008
الهدف 2: 92370.08177
الهدف 3: 94674.93057
الهدف 4: 96733.02143
الرافعة المالية: x32
#BTC
1
19
·
--
عرض الترجمة
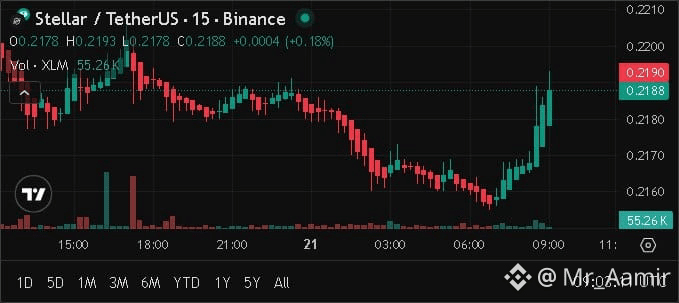
$XLM /USDT long setup
#XLM /USDT – Long 🟢
Leverage: x27
Entry: 0.2191
Stop Loss: 0.21587
Targets:
• Target 1: 0.22053
• Target 2: 0.22244
• Target 3: 0.22889
• Target 4: 0.23213
• Target 5: 0.23543
Risk Note: High leverage (x27) means amplified gains and losses. Use strict stop-loss discipline.
$XLM /USDT long setup
#XLM /USDT – Long 🟢
Leverage: x27
Entry: 0.2191
Stop Loss: 0.21587
Targets:
• Target 1: 0.22053
• Target 2: 0.22244
• Target 3: 0.22889
• Target 4: 0.23213
• Target 5: 0.23543
Risk Note: High leverage (x27) means amplified gains and losses. Use strict stop-loss discipline.
#XLM /USDT – Long 🟢
Leverage: x27
Entry: 0.2191
Stop Loss: 0.21587
Targets:
• Target 1: 0.22053
• Target 2: 0.22244
• Target 3: 0.22889
• Target 4: 0.23213
• Target 5: 0.23543
Risk Note: High leverage (x27) means amplified gains and losses. Use strict stop-loss discipline.
58
·
--
عرض الترجمة
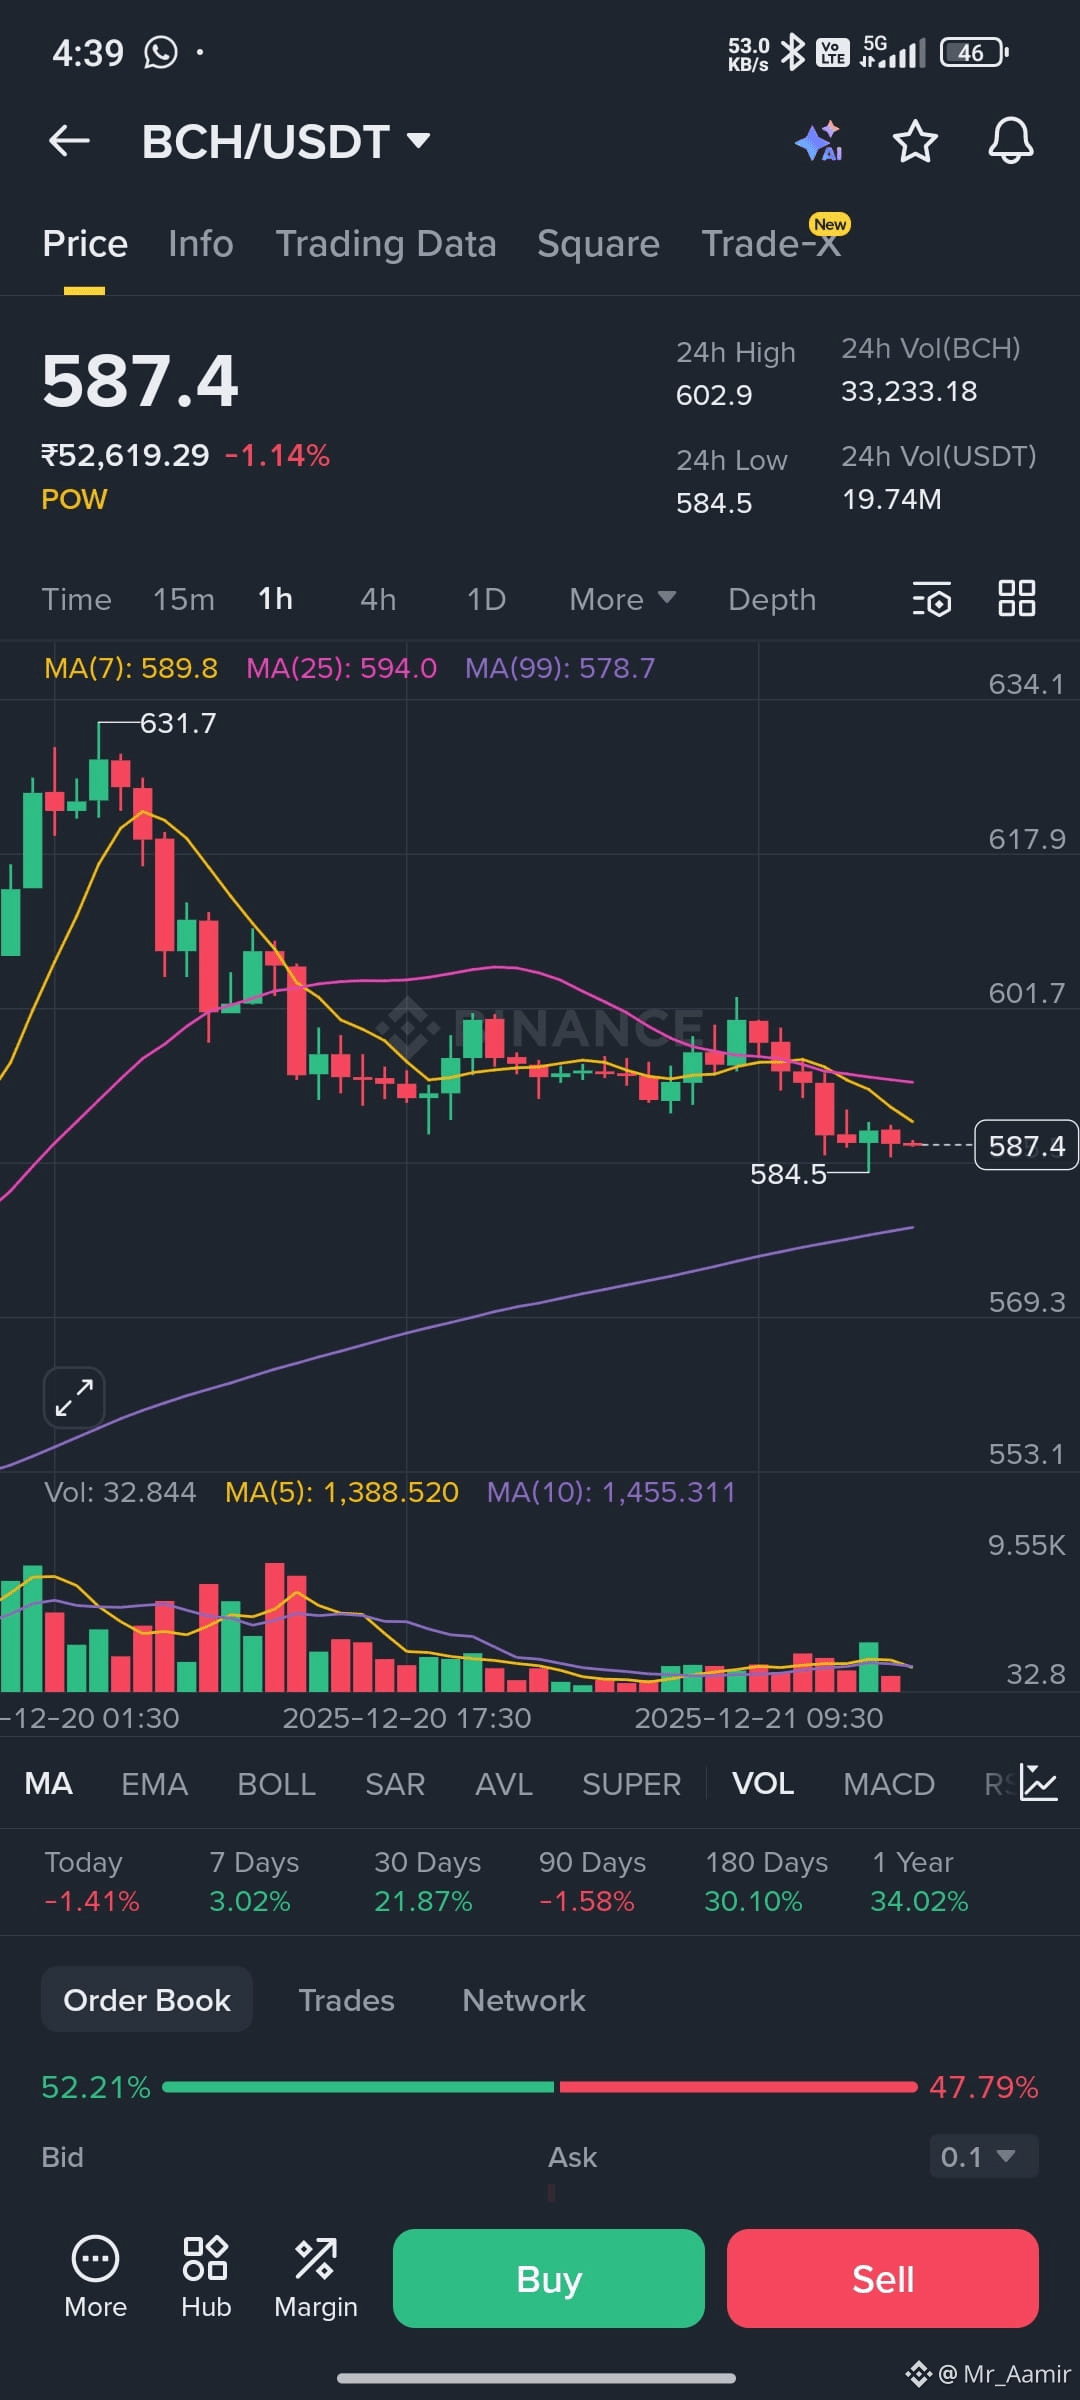
💥 Futures take this
✅ Long
$BCH /USDT
Entry zone : 571.32 - 588.99
Take Profits :
591.90
609.48
627.06
644.64
662.23
Stop loss :547.7607
Leverage: 10x
💥 Futures take this
✅ Long
$BCH /USDT
Entry zone : 571.32 - 588.99
Take Profits :
591.90
609.48
627.06
644.64
662.23
Stop loss :547.7607
Leverage: 10x
✅ Long
$BCH /USDT
Entry zone : 571.32 - 588.99
Take Profits :
591.90
609.48
627.06
644.64
662.23
Stop loss :547.7607
Leverage: 10x
15
·
--
مقالة
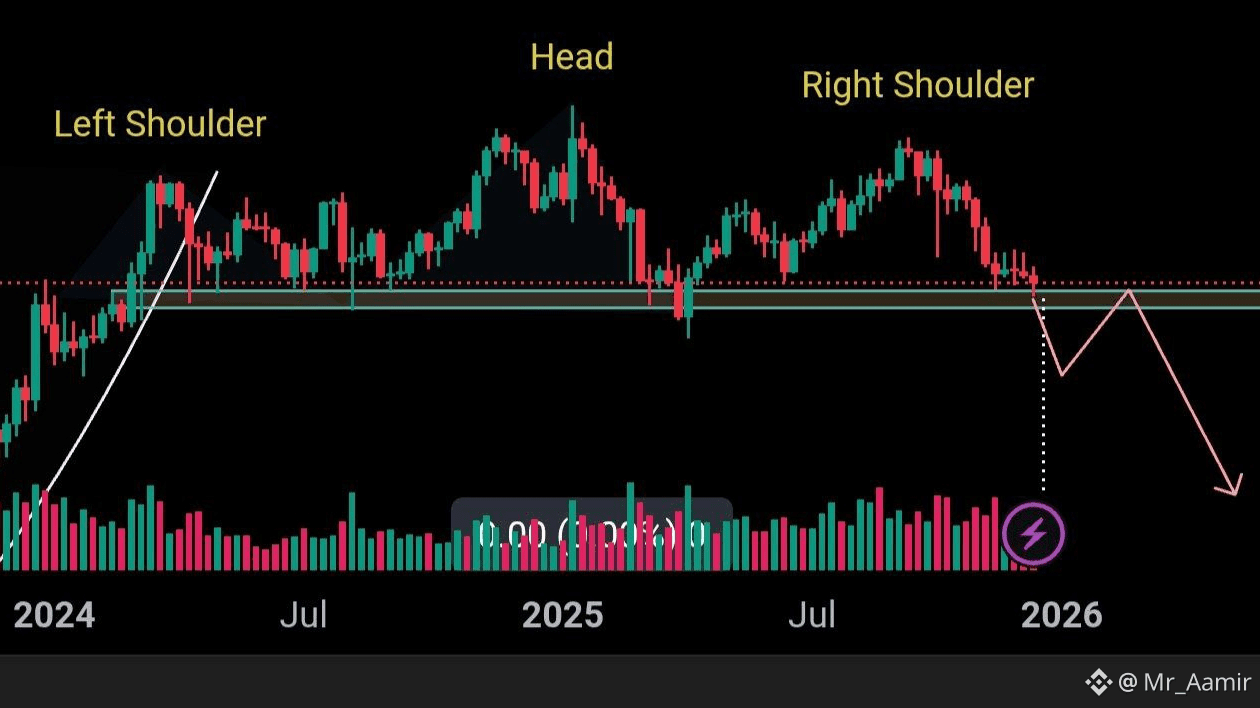
رأس وكتفين في سولانا في قمة اتجاه صعوديأنت تقرأ النمط بشكل صحيح: الرأس والكتفين (H&S) في قمة اتجاه صعودي قوي تشير إلى استنفاد محتمل للاتجاه وارتداد هبوطي محتمل بمجرد كسر خط العنق مع تأكيد.
---
ماذا يعني النمط وكيف يتم التحقق منه
- الهيكل: الكتف الأيسر يشكل قمة، الرأس يصنع قمة أعلى، والكتف الأيمن يفشل في تحقيق ارتفاع جديد. خط العنق يربط بين أدنى انخفاضين بين الكتفين والرأس.
- التحقق الرئيسي: إغلاق حاسم أدنى من خط العنق/منطقة الدعم مطلوب. منطقتك المحددة عند 110–120 USDT تعمل كخط العنق/حزام الطلب. إغلاق يومي أو أسبوعي أدنى من هذه المنطقة يؤكد الانهيار.
رأس وكتفين في سولانا في قمة اتجاه صعودي
أنت تقرأ النمط بشكل صحيح: الرأس والكتفين (H&S) في قمة اتجاه صعودي قوي تشير إلى استنفاد محتمل للاتجاه وارتداد هبوطي محتمل بمجرد كسر خط العنق مع تأكيد.
---
ماذا يعني النمط وكيف يتم التحقق منه
- الهيكل: الكتف الأيسر يشكل قمة، الرأس يصنع قمة أعلى، والكتف الأيمن يفشل في تحقيق ارتفاع جديد. خط العنق يربط بين أدنى انخفاضين بين الكتفين والرأس.
- التحقق الرئيسي: إغلاق حاسم أدنى من خط العنق/منطقة الدعم مطلوب. منطقتك المحددة عند 110–120 USDT تعمل كخط العنق/حزام الطلب. إغلاق يومي أو أسبوعي أدنى من هذه المنطقة يؤكد الانهيار.
---
ماذا يعني النمط وكيف يتم التحقق منه
- الهيكل: الكتف الأيسر يشكل قمة، الرأس يصنع قمة أعلى، والكتف الأيمن يفشل في تحقيق ارتفاع جديد. خط العنق يربط بين أدنى انخفاضين بين الكتفين والرأس.
- التحقق الرئيسي: إغلاق حاسم أدنى من خط العنق/منطقة الدعم مطلوب. منطقتك المحددة عند 110–120 USDT تعمل كخط العنق/حزام الطلب. إغلاق يومي أو أسبوعي أدنى من هذه المنطقة يؤكد الانهيار.
14
·
--
صاعد
عرض الترجمة
18
·
--
صاعد
عرض الترجمة
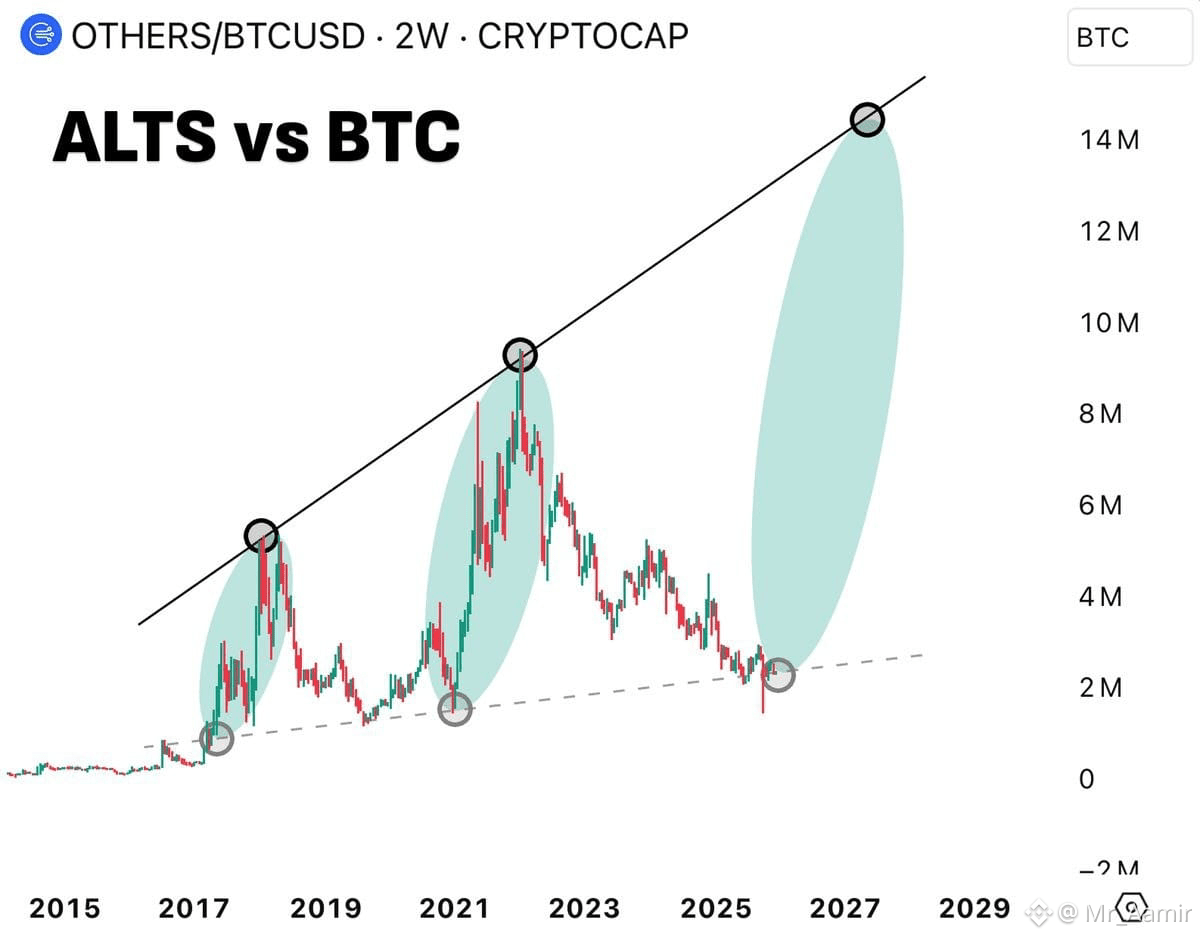
This chart "ALTS vs BTC" (OTHERS/BTCUSD, 2-week timeframe from CRYPTOCAP) shows how the market cap of altcoins (all cryptocurrencies except Bitcoin) performs relative to Bitcoin over time. Here's a breakdown of its key insights:
---
📊 Chart Structure & Elements
- Candlestick Patterns: Represent the price movement of altcoins vs BTC over each 2-week period.
- Black Circles (Peaks): Mark major resistance points where altcoins hit a high relative to BTC.
- Gray Circles (Troughs): Indicate support zones where altcoins bottomed out before rebounding.
- Solid Black Trendline: Connects the peaks — a resistance line showing where altcoins typically face selling pressure.
- Dashed Gray Trendline: Connects the troughs — a support line suggesting where altcoins tend to bounce.
- Green Ellipses: Highlight cyclical growth phases — altcoins rising strongly after hitting support.
---
🔍 Interpretation & Signals
- Cyclical Pattern: The chart shows a repeating cycle — altcoins dip, consolidate, then surge relative to BTC.
- 2025 Trough: The latest gray circle suggests altcoins may have bottomed out in 2025.
- Projected Rise to 2027: Based on past cycles and trendlines, the chart implies a potential altcoin dominance surge toward 2027.
- Resistance Ahead: The solid black line shows where altcoins may face resistance again — possibly around the 2027 peak.
---
🧠 Strategic Takeaway for Traders
- Accumulation Zone: If history repeats, the current zone (late 2025) may be a good time to accumulate altcoins before a potential rally.
- Watch BTC Dominance: If Bitcoin starts losing dominance, altcoins could outperform.
- Risk Management: Use the support/resistance zones to set entry, target, and stop-loss levels.
This chart "ALTS vs BTC" (OTHERS/BTCUSD, 2-week timeframe from CRYPTOCAP) shows how the market cap of altcoins (all cryptocurrencies except Bitcoin) performs relative to Bitcoin over time. Here's a breakdown of its key insights:
---
📊 Chart Structure & Elements
- Candlestick Patterns: Represent the price movement of altcoins vs BTC over each 2-week period.
- Black Circles (Peaks): Mark major resistance points where altcoins hit a high relative to BTC.
- Gray Circles (Troughs): Indicate support zones where altcoins bottomed out before rebounding.
- Solid Black Trendline: Connects the peaks — a resistance line showing where altcoins typically face selling pressure.
- Dashed Gray Trendline: Connects the troughs — a support line suggesting where altcoins tend to bounce.
- Green Ellipses: Highlight cyclical growth phases — altcoins rising strongly after hitting support.
---
🔍 Interpretation & Signals
- Cyclical Pattern: The chart shows a repeating cycle — altcoins dip, consolidate, then surge relative to BTC.
- 2025 Trough: The latest gray circle suggests altcoins may have bottomed out in 2025.
- Projected Rise to 2027: Based on past cycles and trendlines, the chart implies a potential altcoin dominance surge toward 2027.
- Resistance Ahead: The solid black line shows where altcoins may face resistance again — possibly around the 2027 peak.
---
🧠 Strategic Takeaway for Traders
- Accumulation Zone: If history repeats, the current zone (late 2025) may be a good time to accumulate altcoins before a potential rally.
- Watch BTC Dominance: If Bitcoin starts losing dominance, altcoins could outperform.
- Risk Management: Use the support/resistance zones to set entry, target, and stop-loss levels.
---
📊 Chart Structure & Elements
- Candlestick Patterns: Represent the price movement of altcoins vs BTC over each 2-week period.
- Black Circles (Peaks): Mark major resistance points where altcoins hit a high relative to BTC.
- Gray Circles (Troughs): Indicate support zones where altcoins bottomed out before rebounding.
- Solid Black Trendline: Connects the peaks — a resistance line showing where altcoins typically face selling pressure.
- Dashed Gray Trendline: Connects the troughs — a support line suggesting where altcoins tend to bounce.
- Green Ellipses: Highlight cyclical growth phases — altcoins rising strongly after hitting support.
---
🔍 Interpretation & Signals
- Cyclical Pattern: The chart shows a repeating cycle — altcoins dip, consolidate, then surge relative to BTC.
- 2025 Trough: The latest gray circle suggests altcoins may have bottomed out in 2025.
- Projected Rise to 2027: Based on past cycles and trendlines, the chart implies a potential altcoin dominance surge toward 2027.
- Resistance Ahead: The solid black line shows where altcoins may face resistance again — possibly around the 2027 peak.
---
🧠 Strategic Takeaway for Traders
- Accumulation Zone: If history repeats, the current zone (late 2025) may be a good time to accumulate altcoins before a potential rally.
- Watch BTC Dominance: If Bitcoin starts losing dominance, altcoins could outperform.
- Risk Management: Use the support/resistance zones to set entry, target, and stop-loss levels.
6
·
--
عرض الترجمة
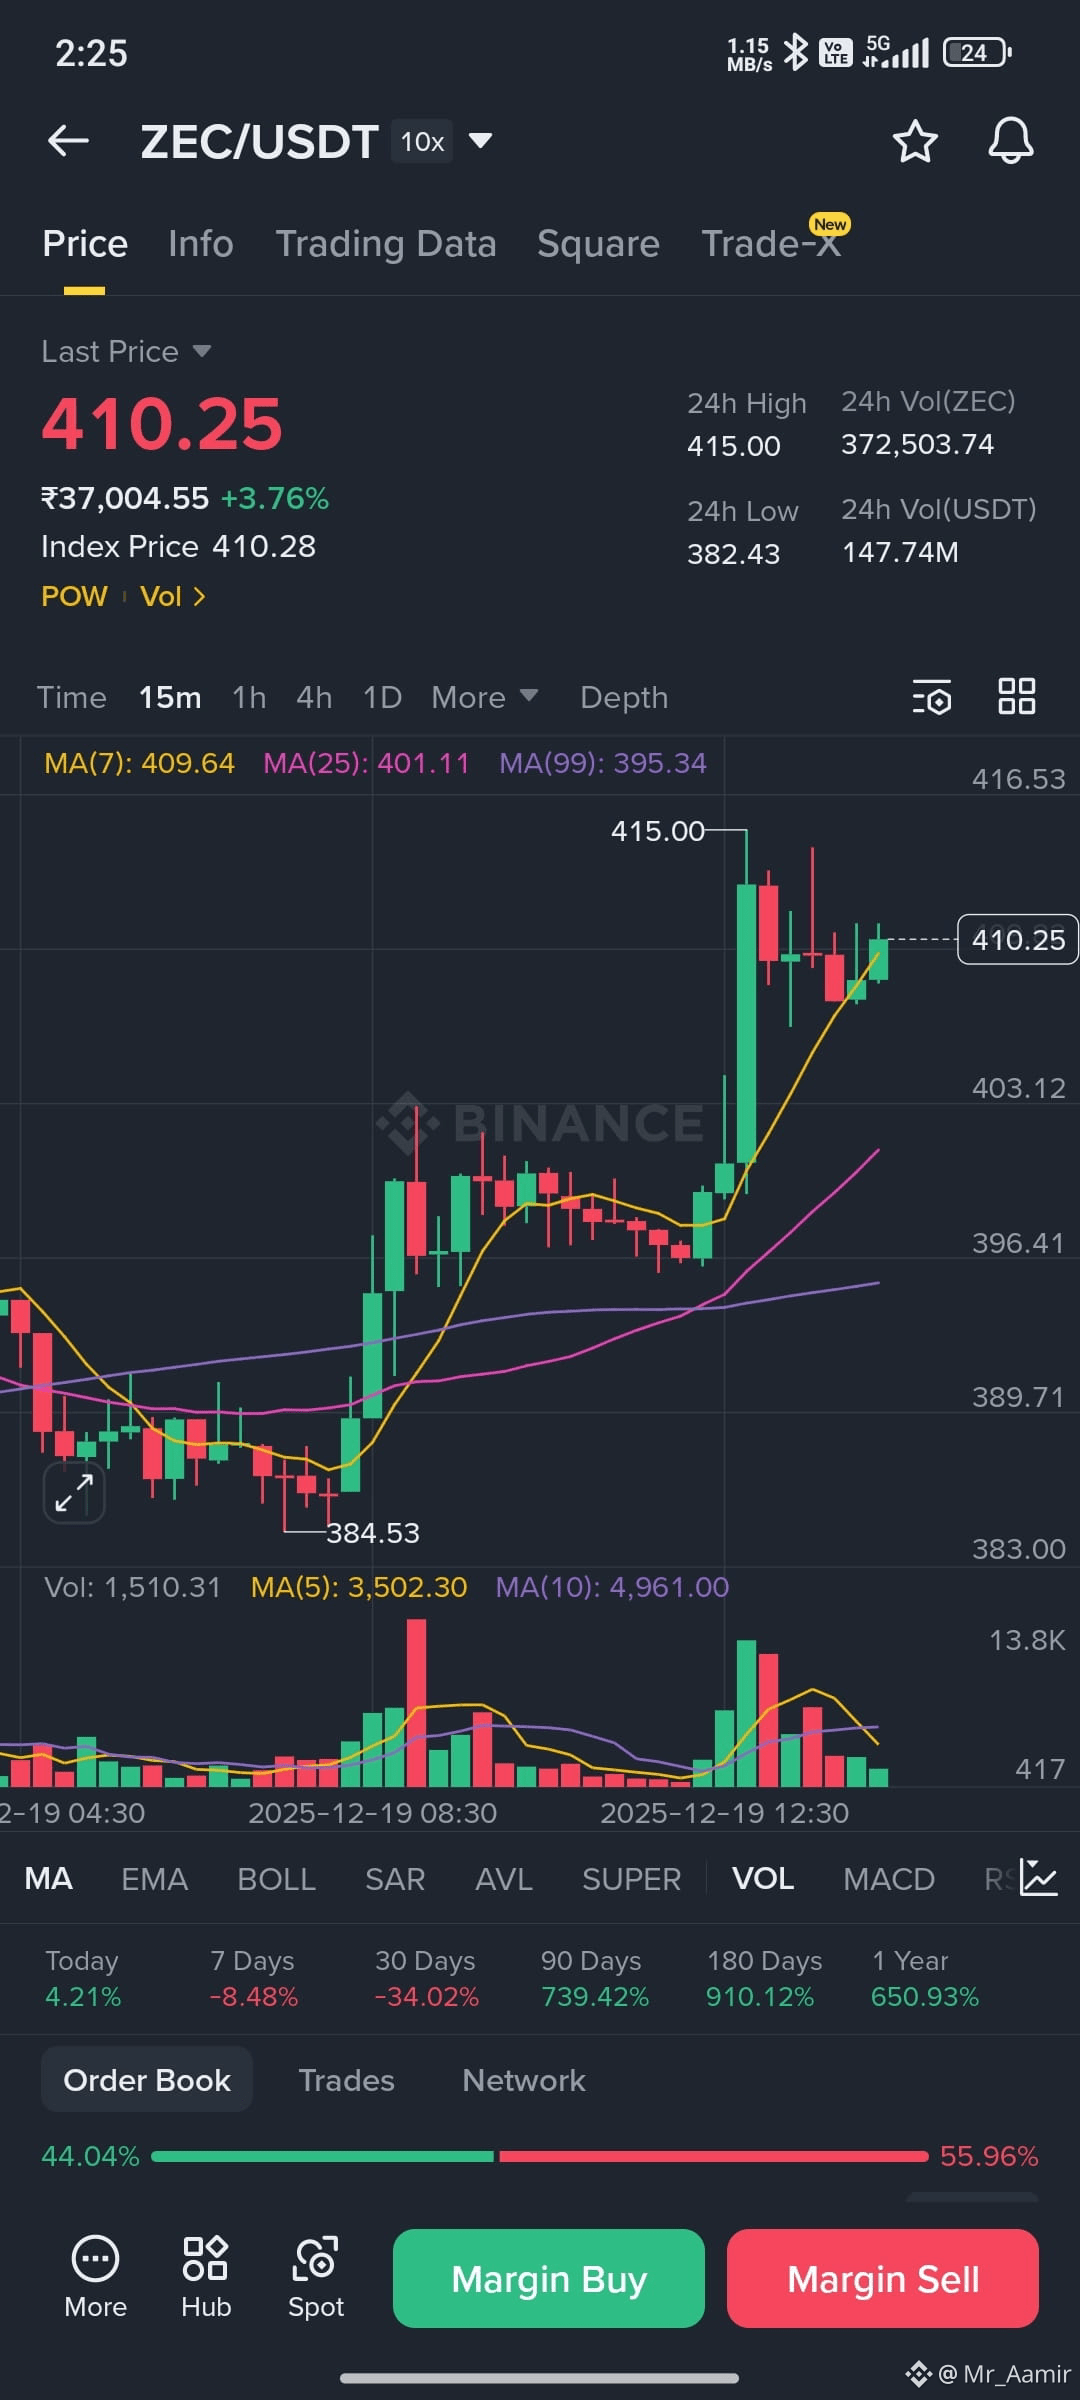
💥$ZEC Futures
🔴 SHORT
#ZEC/USDT
Entry zone : 422.28 - 409.99
Take Profits :
407.91
395.55
383.19
370.83
358.47
Stop loss :438.6893
Leverage: 10x
💥$ZEC Futures
🔴 SHORT
#ZEC/USDT
Entry zone : 422.28 - 409.99
Take Profits :
407.91
395.55
383.19
370.83
358.47
Stop loss :438.6893
Leverage: 10x
🔴 SHORT
#ZEC/USDT
Entry zone : 422.28 - 409.99
Take Profits :
407.91
395.55
383.19
370.83
358.47
Stop loss :438.6893
Leverage: 10x
8
·
--
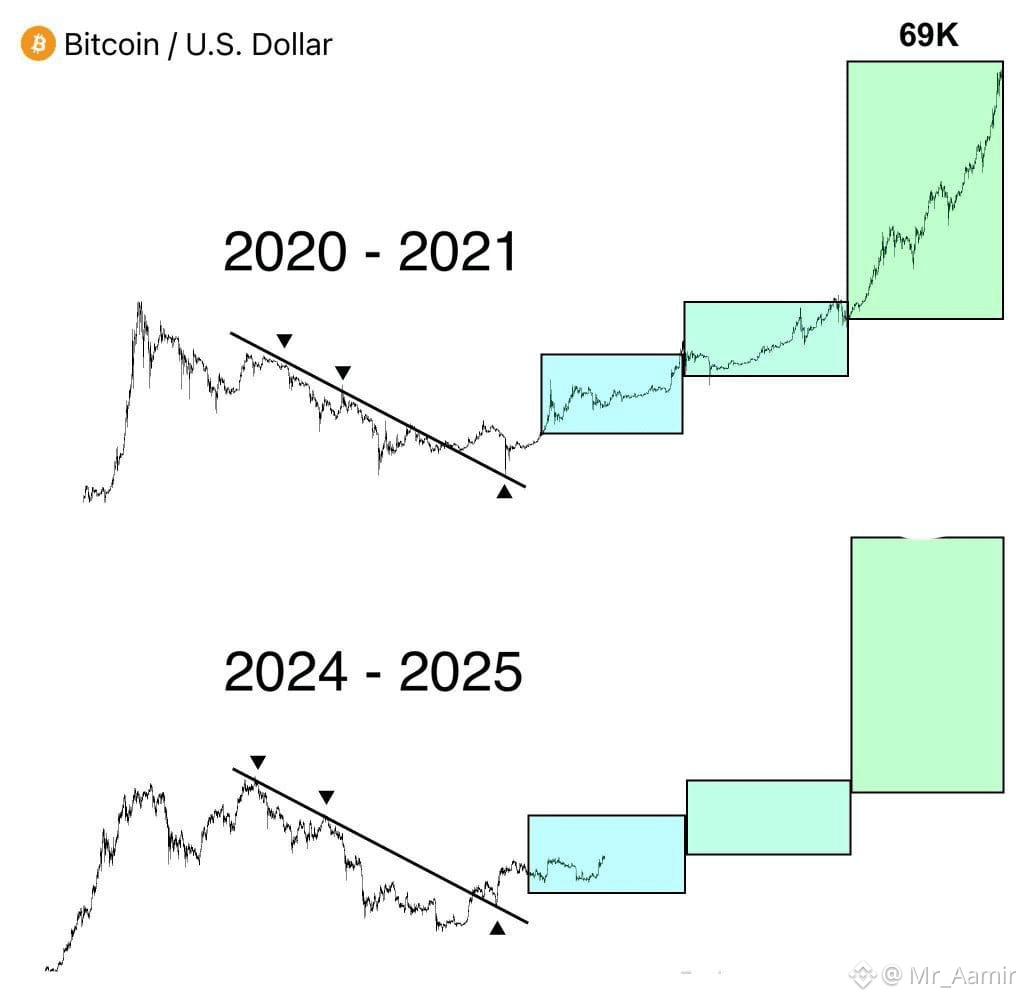
🚀 موسم العملات الرقمية لم يمت.
⚡ إنه فقط في حالة شحن.
📊 تابع المخططات. اشعر بالتغيير. كن مستعدًا.
$BTC $ETH
🚀 موسم العملات الرقمية لم يمت.
⚡ إنه فقط في حالة شحن.
📊 تابع المخططات. اشعر بالتغيير. كن مستعدًا.
$BTC $ETH
⚡ إنه فقط في حالة شحن.
📊 تابع المخططات. اشعر بالتغيير. كن مستعدًا.
$BTC $ETH
38
·
--
مقالة
عرض الترجمة
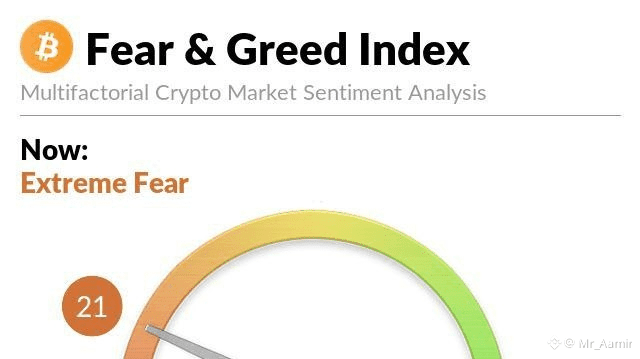
😱 Crypto Fear & Greed Index Hits 21: What “Extreme Fear” Means for TradersAs of December 14, 2025, the Crypto Fear & Greed Index has plunged to 21, signaling Extreme Fear in the market. This index, a sentiment gauge ranging from 0 (maximum fear) to 100 (maximum greed), reflects how investors feel about Bitcoin and the broader crypto space.
📉 What Does “Extreme Fear” Indicate?
- Panic Selling: Many traders are exiting positions, fearing further losses.
- Oversold Conditions: Prices may be undervalued, creating potential buying opportunities.
- Low Confidence: News, volatility, or macro uncertainty often drive fear spikes.
🧠 Smart Traders See Opportunity
Historically, Extreme Fear zones have often preceded market reversals. As Warren Buffett famously said:
> “Be fearful when others are greedy, and greedy when others are fearful.”
This doesn’t mean blindly buying—but it’s a signal to analyze, not panic.
🔍 Strategy Tips for This Phase
| Action | Why It Helps |
|--------|--------------|
| ✅ Accumulate slowly | Dollar-cost averaging reduces risk in volatile zones |
| 🔒 Tighten stop-losses | Protect capital from sudden drops |
| 📊 Watch volume & trend | Confirm if fear is fading or deepening |
| 🧠 Stay informed | Avoid emotional trades—use data, not drama |
#Bitcoin #Fear #Dollar #BinanceAlphaAlert
😱 Crypto Fear & Greed Index Hits 21: What “Extreme Fear” Means for Traders
As of December 14, 2025, the Crypto Fear & Greed Index has plunged to 21, signaling Extreme Fear in the market. This index, a sentiment gauge ranging from 0 (maximum fear) to 100 (maximum greed), reflects how investors feel about Bitcoin and the broader crypto space.
📉 What Does “Extreme Fear” Indicate?
- Panic Selling: Many traders are exiting positions, fearing further losses.
- Oversold Conditions: Prices may be undervalued, creating potential buying opportunities.
- Low Confidence: News, volatility, or macro uncertainty often drive fear spikes.
🧠 Smart Traders See Opportunity
Historically, Extreme Fear zones have often preceded market reversals. As Warren Buffett famously said:
> “Be fearful when others are greedy, and greedy when others are fearful.”
This doesn’t mean blindly buying—but it’s a signal to analyze, not panic.
🔍 Strategy Tips for This Phase
| Action | Why It Helps |
|--------|--------------|
| ✅ Accumulate slowly | Dollar-cost averaging reduces risk in volatile zones |
| 🔒 Tighten stop-losses | Protect capital from sudden drops |
| 📊 Watch volume & trend | Confirm if fear is fading or deepening |
| 🧠 Stay informed | Avoid emotional trades—use data, not drama |
#Bitcoin #Fear #Dollar #BinanceAlphaAlert
📉 What Does “Extreme Fear” Indicate?
- Panic Selling: Many traders are exiting positions, fearing further losses.
- Oversold Conditions: Prices may be undervalued, creating potential buying opportunities.
- Low Confidence: News, volatility, or macro uncertainty often drive fear spikes.
🧠 Smart Traders See Opportunity
Historically, Extreme Fear zones have often preceded market reversals. As Warren Buffett famously said:
> “Be fearful when others are greedy, and greedy when others are fearful.”
This doesn’t mean blindly buying—but it’s a signal to analyze, not panic.
🔍 Strategy Tips for This Phase
| Action | Why It Helps |
|--------|--------------|
| ✅ Accumulate slowly | Dollar-cost averaging reduces risk in volatile zones |
| 🔒 Tighten stop-losses | Protect capital from sudden drops |
| 📊 Watch volume & trend | Confirm if fear is fading or deepening |
| 🧠 Stay informed | Avoid emotional trades—use data, not drama |
#Bitcoin #Fear #Dollar #BinanceAlphaAlert
33
·
--
صاعد
عرض الترجمة
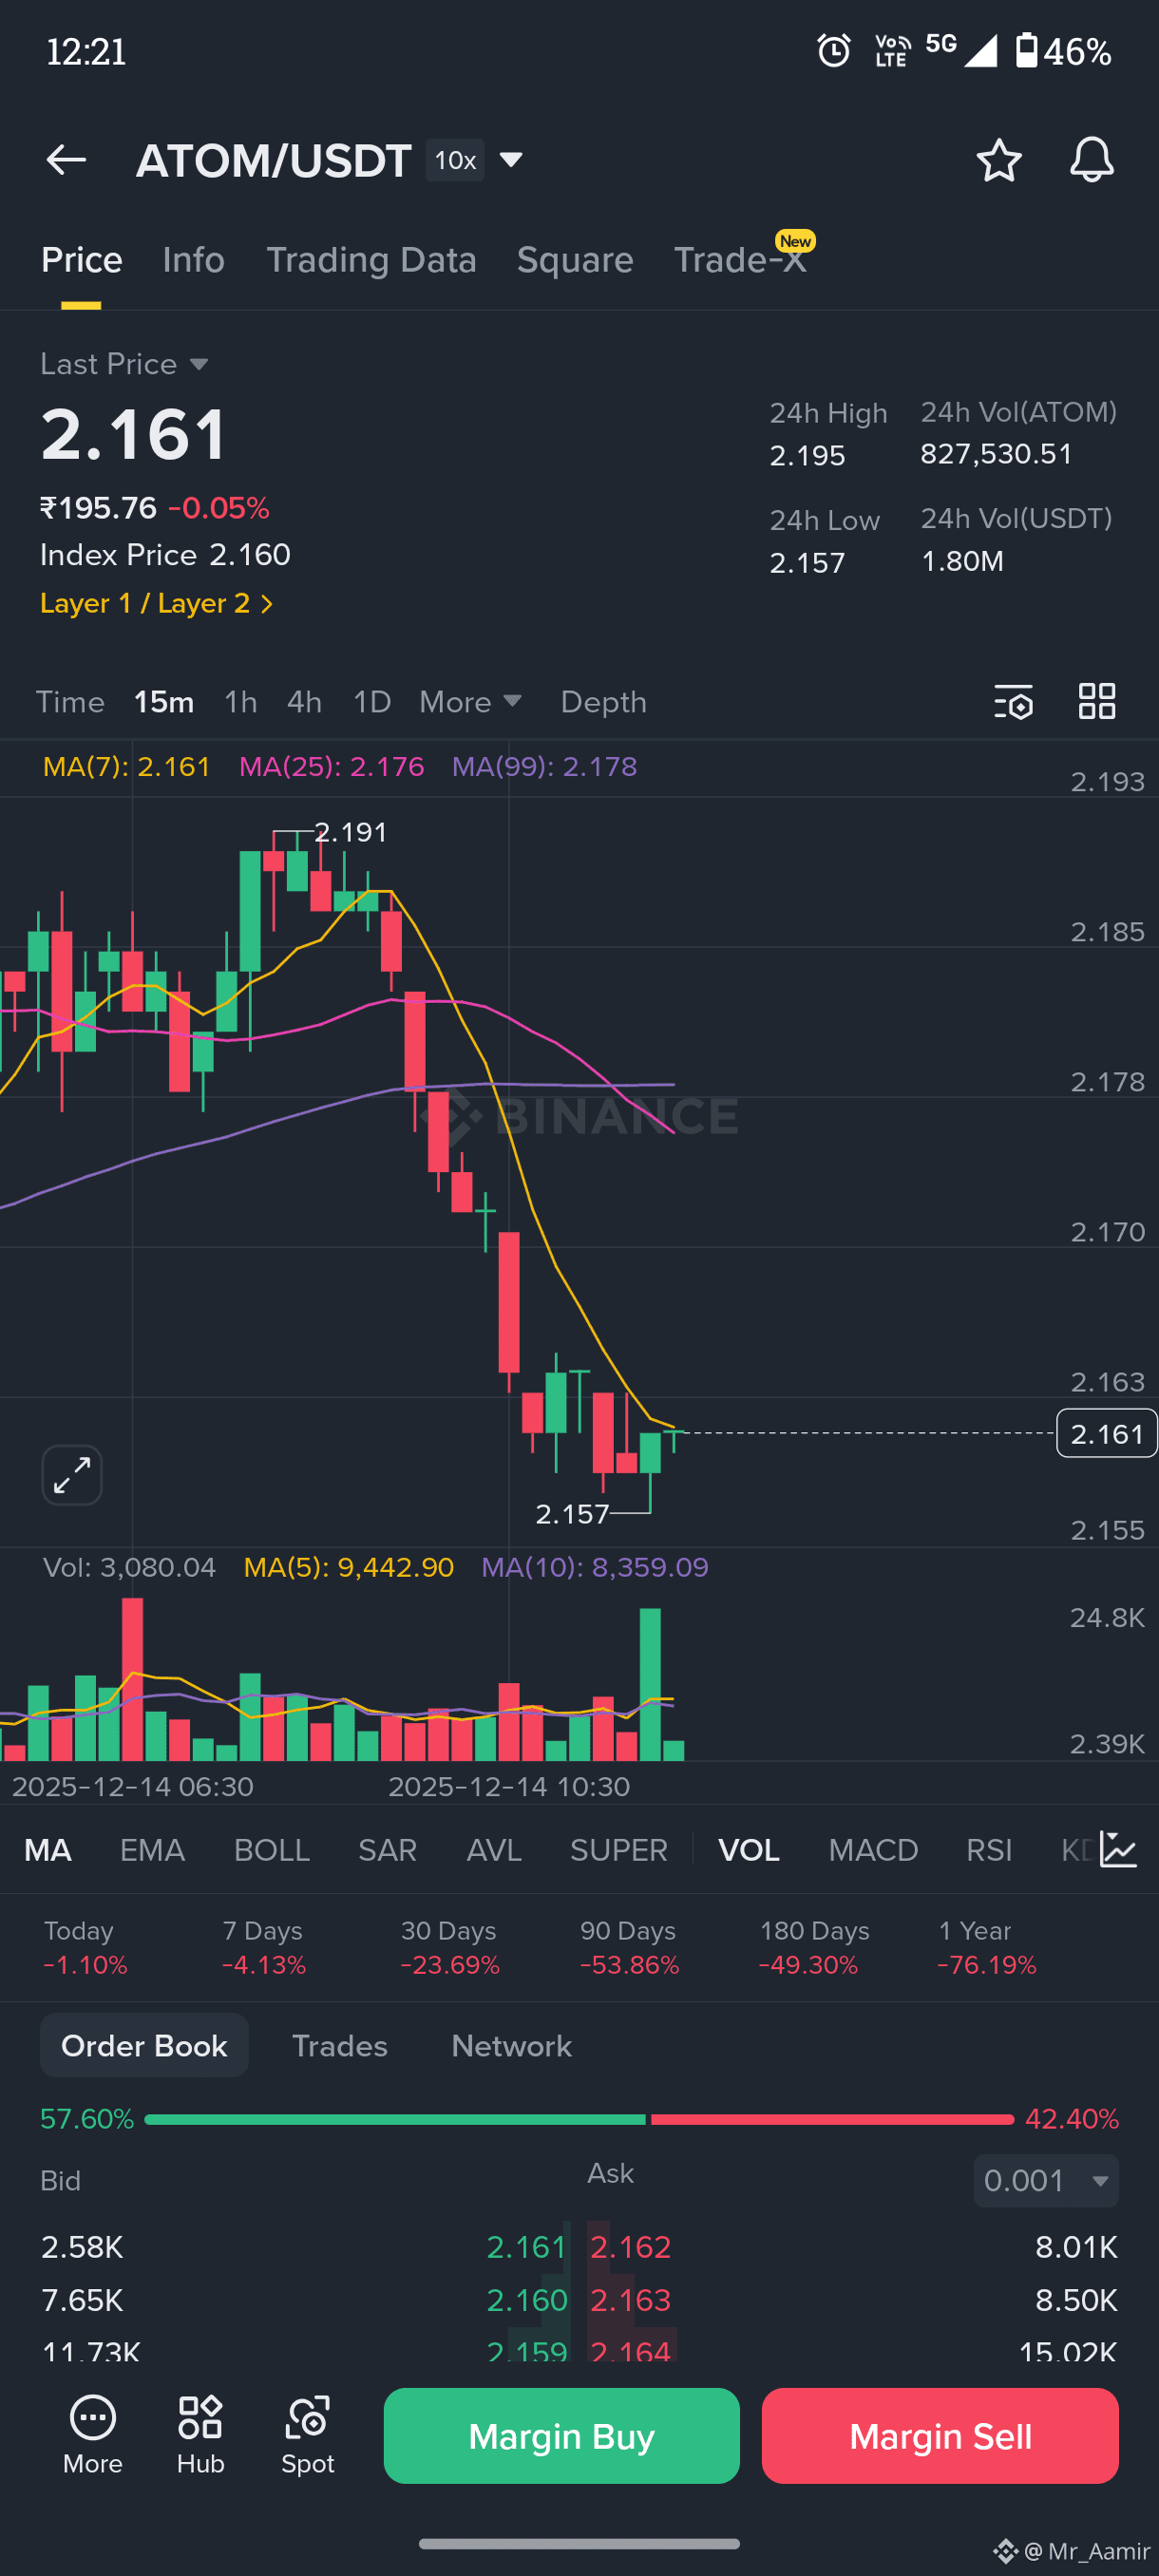
💥 Futures Trade Alert: $ATOM USDT (Long)
🔹 Entry Zone: 2.092 – 2.157
🎯 Targets:
• TP1: 2.167
• TP2: 2.232
• TP3: 2.296
• TP4: 2.360
• TP5: 2.425
🛑 Stop Loss: 2.00601
⚙️ Leverage: 10x
📈 Bias: Bullish momentum expected after breakout from support zone.
💥 Futures Trade Alert: $ATOM USDT (Long)
🔹 Entry Zone: 2.092 – 2.157
🎯 Targets:
• TP1: 2.167
• TP2: 2.232
• TP3: 2.296
• TP4: 2.360
• TP5: 2.425
🛑 Stop Loss: 2.00601
⚙️ Leverage: 10x
📈 Bias: Bullish momentum expected after breakout from support zone.
🔹 Entry Zone: 2.092 – 2.157
🎯 Targets:
• TP1: 2.167
• TP2: 2.232
• TP3: 2.296
• TP4: 2.360
• TP5: 2.425
🛑 Stop Loss: 2.00601
⚙️ Leverage: 10x
📈 Bias: Bullish momentum expected after breakout from support zone.
1
42
·
--
مقالة
عرض الترجمة
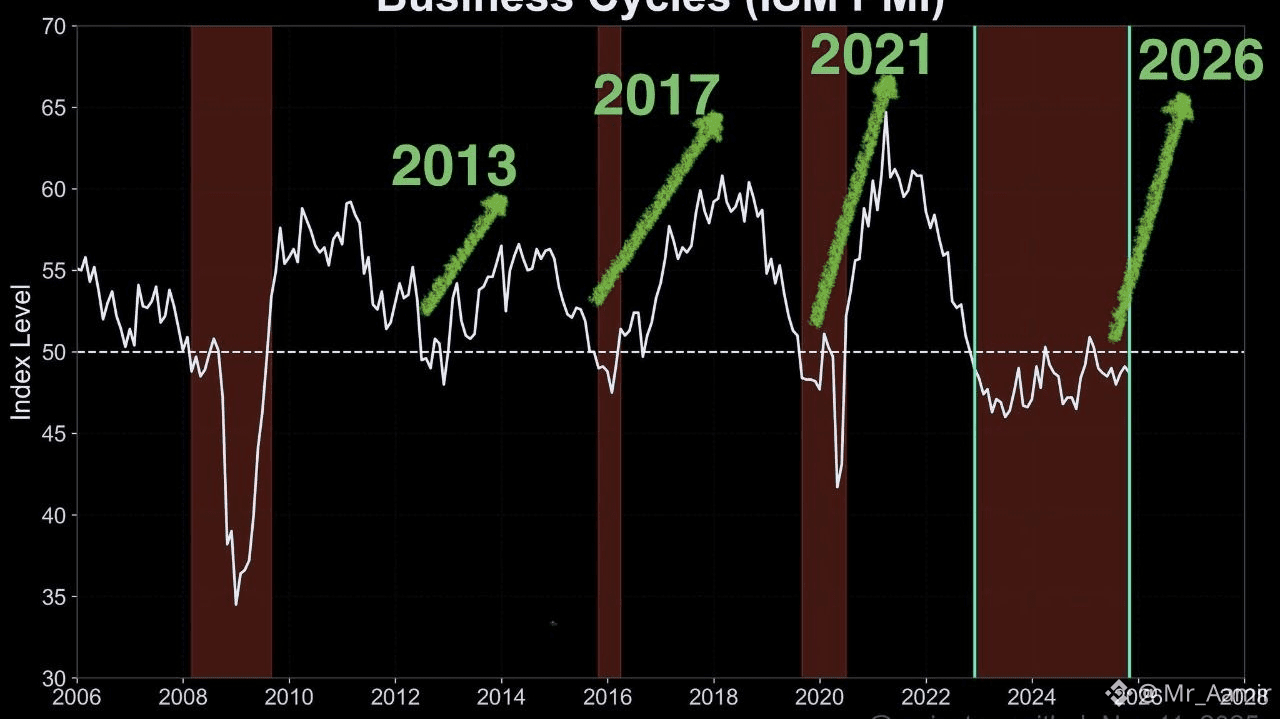
Crypto Halving Cycle Aligns with Economic Recovery: A 4-Year Rhythm RevealedThe recent completion of the 4-year Bitcoin halving cycle coincides with a projected economic rebound in 2026, as illustrated by the ISM PMI chart. This synchronicity highlights a compelling pattern between crypto market cycles and broader business cycles.
📉 Understanding the Graph
The ISM Purchasing Managers’ Index (PMI) tracks economic activity from 2006 to 2028. Periods of contraction are shaded in red, while green arrows mark recoveries in 2013, 2017, 2021—and now a forecasted upswing in 2026. Each recovery aligns closely with Bitcoin’s halving events, which occur roughly every four years and historically trigger bullish momentum in crypto markets.
🔁 The Halving-Economy Connection
Bitcoin halving reduces mining rewards, tightening supply. This often sparks a price rally within 12–18 months. Interestingly, these rallies tend to mirror broader economic recoveries:
- 2013: Post-2008 crisis recovery + BTC boom
- 2017: Mid-cycle expansion + crypto bull run
- 2021: Post-COVID rebound + record crypto highs
- 2026 (projected): Halving completed in 2024 → macro recovery + crypto resurgence?
📊 Cycle Insight for Traders & Investors
This 4-year rhythm offers strategic timing cues:
| Year | Halving Impact | Economic Phase | Crypto Sentiment |
|------|----------------|----------------|------------------|
| 2013 | Supply shock | Recovery | Bullish |
| 2017 | Supply shock | Expansion | Bullish |
| 2021 | Supply shock | Post-COVID rebound | Bullish |
| 2025–26 | Supply shock (2024 halving) | Projected recovery | Accumulation phase |
#CPIWatch #BitcoinETFMajorInflows #BTCVSGOLD
Crypto Halving Cycle Aligns with Economic Recovery: A 4-Year Rhythm Revealed
The recent completion of the 4-year Bitcoin halving cycle coincides with a projected economic rebound in 2026, as illustrated by the ISM PMI chart. This synchronicity highlights a compelling pattern between crypto market cycles and broader business cycles.
📉 Understanding the Graph
The ISM Purchasing Managers’ Index (PMI) tracks economic activity from 2006 to 2028. Periods of contraction are shaded in red, while green arrows mark recoveries in 2013, 2017, 2021—and now a forecasted upswing in 2026. Each recovery aligns closely with Bitcoin’s halving events, which occur roughly every four years and historically trigger bullish momentum in crypto markets.
🔁 The Halving-Economy Connection
Bitcoin halving reduces mining rewards, tightening supply. This often sparks a price rally within 12–18 months. Interestingly, these rallies tend to mirror broader economic recoveries:
- 2013: Post-2008 crisis recovery + BTC boom
- 2017: Mid-cycle expansion + crypto bull run
- 2021: Post-COVID rebound + record crypto highs
- 2026 (projected): Halving completed in 2024 → macro recovery + crypto resurgence?
📊 Cycle Insight for Traders & Investors
This 4-year rhythm offers strategic timing cues:
| Year | Halving Impact | Economic Phase | Crypto Sentiment |
|------|----------------|----------------|------------------|
| 2013 | Supply shock | Recovery | Bullish |
| 2017 | Supply shock | Expansion | Bullish |
| 2021 | Supply shock | Post-COVID rebound | Bullish |
| 2025–26 | Supply shock (2024 halving) | Projected recovery | Accumulation phase |
#CPIWatch #BitcoinETFMajorInflows #BTCVSGOLD
📉 Understanding the Graph
The ISM Purchasing Managers’ Index (PMI) tracks economic activity from 2006 to 2028. Periods of contraction are shaded in red, while green arrows mark recoveries in 2013, 2017, 2021—and now a forecasted upswing in 2026. Each recovery aligns closely with Bitcoin’s halving events, which occur roughly every four years and historically trigger bullish momentum in crypto markets.
🔁 The Halving-Economy Connection
Bitcoin halving reduces mining rewards, tightening supply. This often sparks a price rally within 12–18 months. Interestingly, these rallies tend to mirror broader economic recoveries:
- 2013: Post-2008 crisis recovery + BTC boom
- 2017: Mid-cycle expansion + crypto bull run
- 2021: Post-COVID rebound + record crypto highs
- 2026 (projected): Halving completed in 2024 → macro recovery + crypto resurgence?
📊 Cycle Insight for Traders & Investors
This 4-year rhythm offers strategic timing cues:
| Year | Halving Impact | Economic Phase | Crypto Sentiment |
|------|----------------|----------------|------------------|
| 2013 | Supply shock | Recovery | Bullish |
| 2017 | Supply shock | Expansion | Bullish |
| 2021 | Supply shock | Post-COVID rebound | Bullish |
| 2025–26 | Supply shock (2024 halving) | Projected recovery | Accumulation phase |
#CPIWatch #BitcoinETFMajorInflows #BTCVSGOLD
1
2
242
·
--
عرض الترجمة
$XMR
{future}(XMRUSDT)
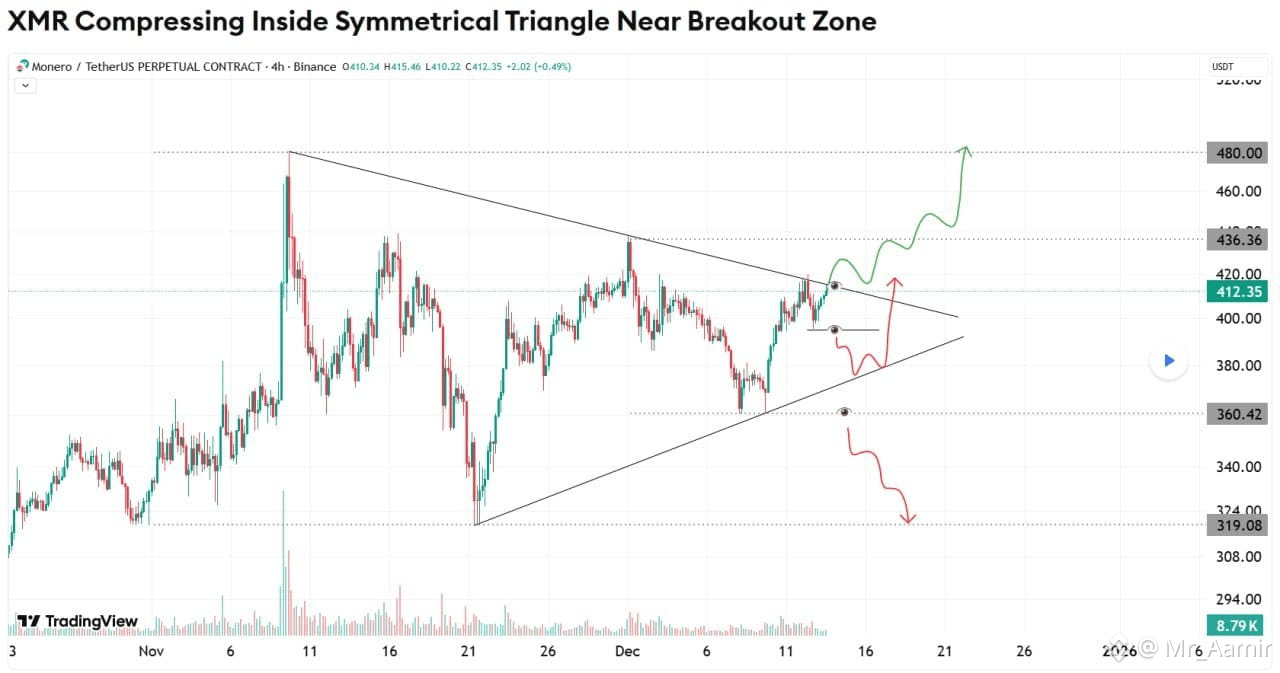
is trading inside a symmetrical triangle with price squeezing between lower highs and higher lows.
This structure usually precedes a strong expansion. A clean break above resistance can extend price toward the 436 and 480 areas. A rejection and support loss may send price back toward 360 or lower.
The reaction near the triangle edge will decide direction.
$XMR
is trading inside a symmetrical triangle with price squeezing between lower highs and higher lows.
This structure usually precedes a strong expansion. A clean break above resistance can extend price toward the 436 and 480 areas. A rejection and support loss may send price back toward 360 or lower.
The reaction near the triangle edge will decide direction.
is trading inside a symmetrical triangle with price squeezing between lower highs and higher lows.
This structure usually precedes a strong expansion. A clean break above resistance can extend price toward the 436 and 480 areas. A rejection and support loss may send price back toward 360 or lower.
The reaction near the triangle edge will decide direction.
1
78
·
--
عرض الترجمة
Breaking Update: The U.S. SEC has released a new Investor Bulletin titled “Crypto Asset Custody Basics for Retail Investors” (December 12, 2025). It explains how everyday investors can safely store and manage their crypto assets.
---
🔑 Key Highlights from the SEC Bulletin
- Definition of Custody: Custody refers to how and where crypto assets are stored and accessed. Assets themselves remain on the blockchain, but wallets store the private keys that control them.
- Wallet Types:
- Hot wallets (online, convenient, but more vulnerable to hacks).
- Cold wallets (offline, safer against cyberattacks, but less convenient).
- Self-Custody vs. Third-Party Custody:
- Self-custody gives full control but requires strong responsibility for securing keys.
- Third-party custody (exchanges, custodians) offers convenience but introduces counterparty risk.
- Security Tips:
- Protect seed phrases and private keys.
- Use multi-factor authentication.
- Be cautious of phishing and scams.
- Investor Guidance: The SEC urges investors to weigh risks, responsibilities, and convenience before choosing custody methods.
---
🧭 Why This Matters
The SEC is intensifying investor education in crypto markets, especially after recent high-profile exchange failures. By publishing this bulletin, the regulator aims to empower retail investors with practical knowledge so they can avoid common pitfalls and make informed custody decisions.
$BTC
{spot}(BTCUSDT)
$XRP
{spot}(XRPUSDT)
$ETH
{spot}(ETHUSDT)
Breaking Update: The U.S. SEC has released a new Investor Bulletin titled “Crypto Asset Custody Basics for Retail Investors” (December 12, 2025). It explains how everyday investors can safely store and manage their crypto assets.
---
🔑 Key Highlights from the SEC Bulletin
- Definition of Custody: Custody refers to how and where crypto assets are stored and accessed. Assets themselves remain on the blockchain, but wallets store the private keys that control them.
- Wallet Types:
- Hot wallets (online, convenient, but more vulnerable to hacks).
- Cold wallets (offline, safer against cyberattacks, but less convenient).
- Self-Custody vs. Third-Party Custody:
- Self-custody gives full control but requires strong responsibility for securing keys.
- Third-party custody (exchanges, custodians) offers convenience but introduces counterparty risk.
- Security Tips:
- Protect seed phrases and private keys.
- Use multi-factor authentication.
- Be cautious of phishing and scams.
- Investor Guidance: The SEC urges investors to weigh risks, responsibilities, and convenience before choosing custody methods.
---
🧭 Why This Matters
The SEC is intensifying investor education in crypto markets, especially after recent high-profile exchange failures. By publishing this bulletin, the regulator aims to empower retail investors with practical knowledge so they can avoid common pitfalls and make informed custody decisions.
$BTC
$XRP
$ETH
---
🔑 Key Highlights from the SEC Bulletin
- Definition of Custody: Custody refers to how and where crypto assets are stored and accessed. Assets themselves remain on the blockchain, but wallets store the private keys that control them.
- Wallet Types:
- Hot wallets (online, convenient, but more vulnerable to hacks).
- Cold wallets (offline, safer against cyberattacks, but less convenient).
- Self-Custody vs. Third-Party Custody:
- Self-custody gives full control but requires strong responsibility for securing keys.
- Third-party custody (exchanges, custodians) offers convenience but introduces counterparty risk.
- Security Tips:
- Protect seed phrases and private keys.
- Use multi-factor authentication.
- Be cautious of phishing and scams.
- Investor Guidance: The SEC urges investors to weigh risks, responsibilities, and convenience before choosing custody methods.
---
🧭 Why This Matters
The SEC is intensifying investor education in crypto markets, especially after recent high-profile exchange failures. By publishing this bulletin, the regulator aims to empower retail investors with practical knowledge so they can avoid common pitfalls and make informed custody decisions.
$BTC
$XRP
$ETH
2
·
--
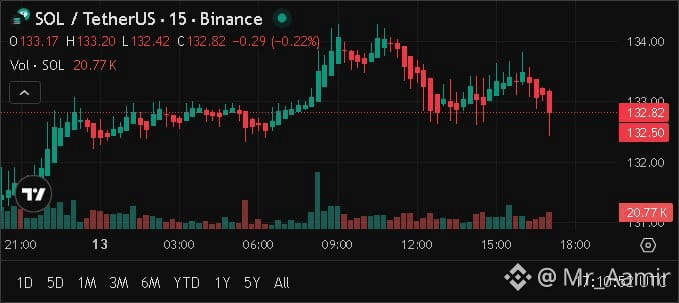
$SOL USDT إعداد صفقة بيع مع رافعة مالية x16:
---
🔍 نظرة عامة على الصفقة
- النوع: بيع (توقع انخفاض السعر)
- الدخول: 132.51 USDT
- وقف الخسارة: 134.1756 USDT (≈1.26% مخاطرة)
- الأهداف:
- 🎯 الهدف 1: 131.61681 (≈0.67% ربح)
- 🎯 الهدف 2: 130.44978 (≈1.55% ربح)
- 🎯 الهدف 3: 127.27924 (≈3.95% ربح)
⚠️ تأثير الرافعة المالية
- مع رافعة مالية x16، حتى الحركات الصغيرة في السعر تتضخم.
- الهدف 3 يمكن أن يحقق ~63% عائد على الاستثمار، ولكنه يزيد أيضًا من خطر التصفية إذا تم الوصول إلى وقف الخسارة.
---
📌 سياق الرسم البياني
- السعر الحالي: 132.82 USDT (أعلى قليلاً من الدخول)
- حركة السعر تظهر رفضًا مؤخرًا بالقرب من 133.20، مما يدعم الاتجاه البيعي.
- الحجم معتدل، مما يشير إلى زخم حذر.
---
🧠 نصيحة استراتيجية سريعة
- ضع في اعتبارك استخدام وقف متحرك بمجرد الوصول إلى الهدف 1 لتأمين أرباح جزئية.
- راقب تحركات #BTC و #ETH - غالبًا ما تؤثر على تقلبات #SOL.
{spot}(SOLUSDT)
$SOL USDT إعداد صفقة بيع مع رافعة مالية x16:
---
🔍 نظرة عامة على الصفقة
- النوع: بيع (توقع انخفاض السعر)
- الدخول: 132.51 USDT
- وقف الخسارة: 134.1756 USDT (≈1.26% مخاطرة)
- الأهداف:
- 🎯 الهدف 1: 131.61681 (≈0.67% ربح)
- 🎯 الهدف 2: 130.44978 (≈1.55% ربح)
- 🎯 الهدف 3: 127.27924 (≈3.95% ربح)
⚠️ تأثير الرافعة المالية
- مع رافعة مالية x16، حتى الحركات الصغيرة في السعر تتضخم.
- الهدف 3 يمكن أن يحقق ~63% عائد على الاستثمار، ولكنه يزيد أيضًا من خطر التصفية إذا تم الوصول إلى وقف الخسارة.
---
📌 سياق الرسم البياني
- السعر الحالي: 132.82 USDT (أعلى قليلاً من الدخول)
- حركة السعر تظهر رفضًا مؤخرًا بالقرب من 133.20، مما يدعم الاتجاه البيعي.
- الحجم معتدل، مما يشير إلى زخم حذر.
---
🧠 نصيحة استراتيجية سريعة
- ضع في اعتبارك استخدام وقف متحرك بمجرد الوصول إلى الهدف 1 لتأمين أرباح جزئية.
- راقب تحركات #BTC و #ETH - غالبًا ما تؤثر على تقلبات #SOL.
---
🔍 نظرة عامة على الصفقة
- النوع: بيع (توقع انخفاض السعر)
- الدخول: 132.51 USDT
- وقف الخسارة: 134.1756 USDT (≈1.26% مخاطرة)
- الأهداف:
- 🎯 الهدف 1: 131.61681 (≈0.67% ربح)
- 🎯 الهدف 2: 130.44978 (≈1.55% ربح)
- 🎯 الهدف 3: 127.27924 (≈3.95% ربح)
⚠️ تأثير الرافعة المالية
- مع رافعة مالية x16، حتى الحركات الصغيرة في السعر تتضخم.
- الهدف 3 يمكن أن يحقق ~63% عائد على الاستثمار، ولكنه يزيد أيضًا من خطر التصفية إذا تم الوصول إلى وقف الخسارة.
---
📌 سياق الرسم البياني
- السعر الحالي: 132.82 USDT (أعلى قليلاً من الدخول)
- حركة السعر تظهر رفضًا مؤخرًا بالقرب من 133.20، مما يدعم الاتجاه البيعي.
- الحجم معتدل، مما يشير إلى زخم حذر.
---
🧠 نصيحة استراتيجية سريعة
- ضع في اعتبارك استخدام وقف متحرك بمجرد الوصول إلى الهدف 1 لتأمين أرباح جزئية.
- راقب تحركات #BTC و #ETH - غالبًا ما تؤثر على تقلبات #SOL.
44
سجّل الدخول لاستكشاف المزيد من المُحتوى
انضم إلى مُستخدمي العملات الرقمية حول العالم على Binance Square
⚡️ احصل على أحدث المعلومات المفيدة عن العملات الرقمية.
💬 موثوقة من قبل أكبر منصّة لتداول العملات الرقمية في العالم.
👍 اكتشف الرؤى الحقيقية من صنّاع المُحتوى الموثوقين.
البريد الإلكتروني / رقم الهاتف
المواضيع الرائجة
HuangExitNvidiaStrategyInFocus
326 مشاهدات
64 يقومون بالنقاش
الأسهم | استقالة جنسن هوانغ من إنفيديا وتعيين كوليت كريس رئيسةً تنفيذية مؤقتة
Binance News
·0 إعجاب
·2.9k مشاهدات
ChipStocksExtendLossesAfterNvidiaCEOChange
0 مشاهدات
29 يقومون بالنقاش
AnthropicRejectsIPODelayValuationinQuestion
551,167 مشاهدات
4,540 يقومون بالنقاش