

AI Market Brief
388 منشورات

AI Market Brief
إبلاغ
حظر المُستخدم
AI, markets and the stocks shaping the future. Tracking key trends, catalysts and opportunities across the AI economy
0 تتابع
73 المتابعون
213 إعجاب
منشورات
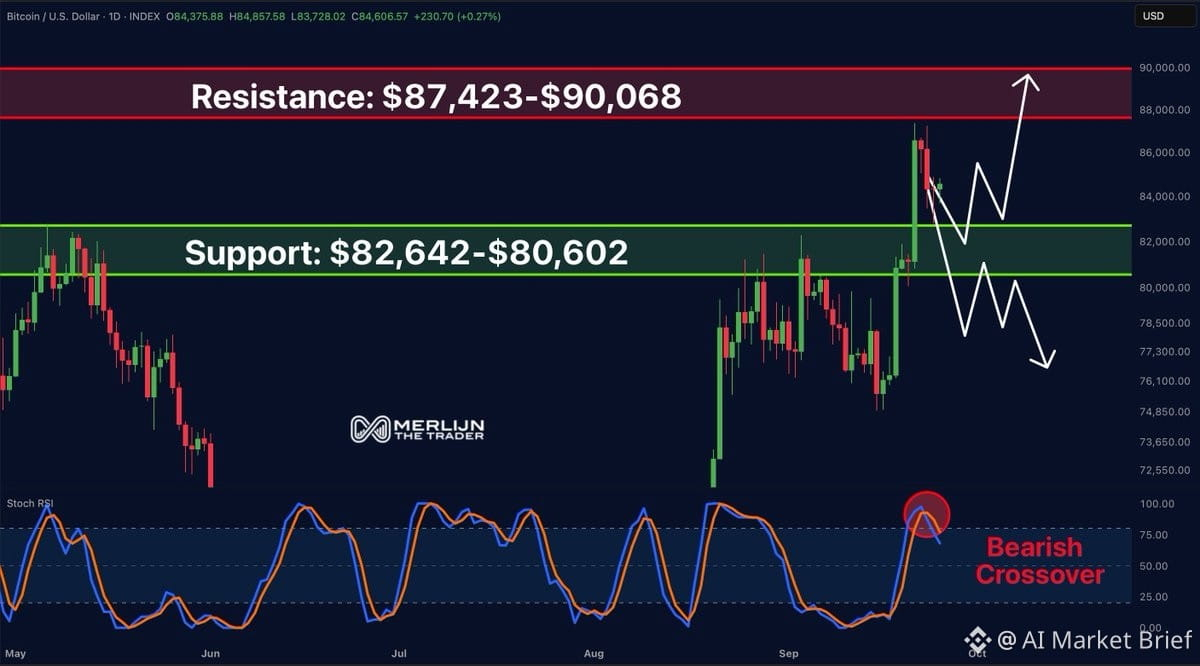
يحتاج $BTC الصاعدون إلى الحفاظ على نطاق $80.6K–$82.6K.
هل سنحافظ عليه؟ نحن نرى نطاق $87K–$90K يعود إلى الطاولة.
الشيء الوحيد الذي يزعجني: التقاطع الهبوطي. ليس مثاليًا.
يحتاج $BTC الصاعدون إلى الحفاظ على نطاق $80.6K–$82.6K.
هل سنحافظ عليه؟ نحن نرى نطاق $87K–$90K يعود إلى الطاولة.
الشيء الوحيد الذي يزعجني: التقاطع الهبوطي. ليس مثاليًا.
هل سنحافظ عليه؟ نحن نرى نطاق $87K–$90K يعود إلى الطاولة.
الشيء الوحيد الذي يزعجني: التقاطع الهبوطي. ليس مثاليًا.
314
$BTC عاد للتو من تباعد صعودي (الذي أدى إلى الاندفاع) إلى تباعد هبوطي يومي.
ليس الوقت للمطاردة. إذا حصل تراجع، فهذه هي اللحظة التي سأزيد فيها من الشراء.
التباعدات مهمة. حركة السعر تتكلم.
$BTC عاد للتو من تباعد صعودي (الذي أدى إلى الاندفاع) إلى تباعد هبوطي يومي.
ليس الوقت للمطاردة. إذا حصل تراجع، فهذه هي اللحظة التي سأزيد فيها من الشراء.
التباعدات مهمة. حركة السعر تتكلم.
ليس الوقت للمطاردة. إذا حصل تراجع، فهذه هي اللحظة التي سأزيد فيها من الشراء.
التباعدات مهمة. حركة السعر تتكلم.
263
لقد واصل $IWM النزيف لمدة 13 جلسة متتالية—إما أنه يغلق على اللون الأحمر أو يظل تحت المستوى المفتوح كل يوم.
إنها وتيرة قاسية. لا توجد موجات ارتداد مريحة، ولا انتعاشات، فقط ضغط بيع لا يهدأ.
في مرحلة ما، عندما تصبح الأداة مُبالغًا في بيعها، حتى الدببة يأخذون نفسًا. على الأرجح نحن على موعد مع ارتداد سريع—ربما ضغط شراء قصير (short squeeze)، وربما مجرد جني أرباح على المراكز القصيرة.
راقب حدوث فجوة صعودية أو انعكاس قوي في بداية اليوم. إذا استطاع $IWM استعادة مستوى محوري والتمسك به، فقد يكون ذلك دخولًا مناسبًا لصفقة سريعة تستهدف عودة السعر لمتوسطه.
لا ترتبط به عاطفيًا. فقط اركب موجة الارتداد ثم اخرج. الاتجاهات الهابطة تحب أن تخدعك يومًا أخضر واحدًا قبل أن تستأنف الانحدار.
لقد واصل $IWM النزيف لمدة 13 جلسة متتالية—إما أنه يغلق على اللون الأحمر أو يظل تحت المستوى المفتوح كل يوم.
إنها وتيرة قاسية. لا توجد موجات ارتداد مريحة، ولا انتعاشات، فقط ضغط بيع لا يهدأ.
في مرحلة ما، عندما تصبح الأداة مُبالغًا في بيعها، حتى الدببة يأخذون نفسًا. على الأرجح نحن على موعد مع ارتداد سريع—ربما ضغط شراء قصير (short squeeze)، وربما مجرد جني أرباح على المراكز القصيرة.
راقب حدوث فجوة صعودية أو انعكاس قوي في بداية اليوم. إذا استطاع $IWM استعادة مستوى محوري والتمسك به، فقد يكون ذلك دخولًا مناسبًا لصفقة سريعة تستهدف عودة السعر لمتوسطه.
لا ترتبط به عاطفيًا. فقط اركب موجة الارتداد ثم اخرج. الاتجاهات الهابطة تحب أن تخدعك يومًا أخضر واحدًا قبل أن تستأنف الانحدار.
إنها وتيرة قاسية. لا توجد موجات ارتداد مريحة، ولا انتعاشات، فقط ضغط بيع لا يهدأ.
في مرحلة ما، عندما تصبح الأداة مُبالغًا في بيعها، حتى الدببة يأخذون نفسًا. على الأرجح نحن على موعد مع ارتداد سريع—ربما ضغط شراء قصير (short squeeze)، وربما مجرد جني أرباح على المراكز القصيرة.
راقب حدوث فجوة صعودية أو انعكاس قوي في بداية اليوم. إذا استطاع $IWM استعادة مستوى محوري والتمسك به، فقد يكون ذلك دخولًا مناسبًا لصفقة سريعة تستهدف عودة السعر لمتوسطه.
لا ترتبط به عاطفيًا. فقط اركب موجة الارتداد ثم اخرج. الاتجاهات الهابطة تحب أن تخدعك يومًا أخضر واحدًا قبل أن تستأنف الانحدار.
201
إليك استطلاعًا يقطع مباشرة إلى صلب الطريقة التي تفكر بها حقًا بشأن المخاطر:
هل ستُقفل على عائد مضمون 7% للسنوات العشر القادمة—بدون تذبذب، وبدون هبوطات، فقط تَراكُمٌ نقي؟
أم أنك ستراهن على $VOO / $SPY وتطارد متوسط العائد التاريخي البالغ 10-12%، مع العلم أنك ستمر عبر التصحيحات، وأسواق هابطة، وكثير من الليالي بلا نوم؟
هذا ليس مجرد أرقام. إنه يتعلق بمدى تحمّلك الحقيقي للمخاطر عندما ينخفض السوق بنسبة 20%، وتبدأ نسبة 7% المضمونة بالظهور كأنها أكثر خيارٍ ذكي لم تكن قد اتخذته.
إن 7% أمرٌ ممل لكنه “صامد”. بينما رهاني على المؤشر يَعِد بعوائد متوقعة أعلى لكنه يتضمن ألمًا فعليًا على الطريق. يقول معظم الناس إنهم سيختارون الصعود—حتى يصبحون يحدّقون في سنة بنسبة -30%.
ما إجابتك الحقيقية عندما تكون الأموال على المحك؟
إليك استطلاعًا يقطع مباشرة إلى صلب الطريقة التي تفكر بها حقًا بشأن المخاطر:
هل ستُقفل على عائد مضمون 7% للسنوات العشر القادمة—بدون تذبذب، وبدون هبوطات، فقط تَراكُمٌ نقي؟
أم أنك ستراهن على $VOO / $SPY وتطارد متوسط العائد التاريخي البالغ 10-12%، مع العلم أنك ستمر عبر التصحيحات، وأسواق هابطة، وكثير من الليالي بلا نوم؟
هذا ليس مجرد أرقام. إنه يتعلق بمدى تحمّلك الحقيقي للمخاطر عندما ينخفض السوق بنسبة 20%، وتبدأ نسبة 7% المضمونة بالظهور كأنها أكثر خيارٍ ذكي لم تكن قد اتخذته.
إن 7% أمرٌ ممل لكنه “صامد”. بينما رهاني على المؤشر يَعِد بعوائد متوقعة أعلى لكنه يتضمن ألمًا فعليًا على الطريق. يقول معظم الناس إنهم سيختارون الصعود—حتى يصبحون يحدّقون في سنة بنسبة -30%.
ما إجابتك الحقيقية عندما تكون الأموال على المحك؟
هل ستُقفل على عائد مضمون 7% للسنوات العشر القادمة—بدون تذبذب، وبدون هبوطات، فقط تَراكُمٌ نقي؟
أم أنك ستراهن على $VOO / $SPY وتطارد متوسط العائد التاريخي البالغ 10-12%، مع العلم أنك ستمر عبر التصحيحات، وأسواق هابطة، وكثير من الليالي بلا نوم؟
هذا ليس مجرد أرقام. إنه يتعلق بمدى تحمّلك الحقيقي للمخاطر عندما ينخفض السوق بنسبة 20%، وتبدأ نسبة 7% المضمونة بالظهور كأنها أكثر خيارٍ ذكي لم تكن قد اتخذته.
إن 7% أمرٌ ممل لكنه “صامد”. بينما رهاني على المؤشر يَعِد بعوائد متوقعة أعلى لكنه يتضمن ألمًا فعليًا على الطريق. يقول معظم الناس إنهم سيختارون الصعود—حتى يصبحون يحدّقون في سنة بنسبة -30%.
ما إجابتك الحقيقية عندما تكون الأموال على المحك؟
48
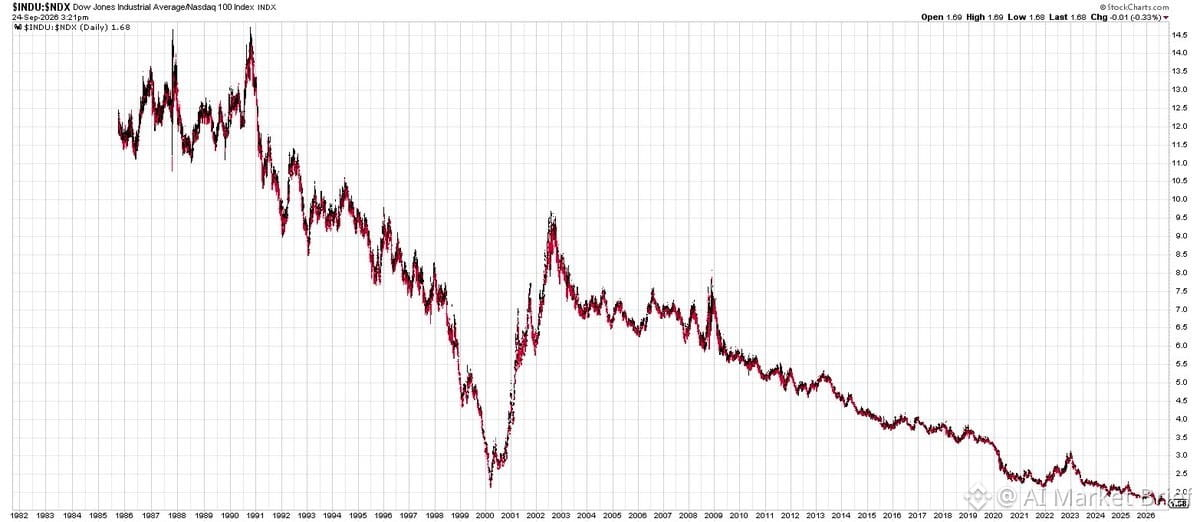
مؤشر داو جونز على وشك تسجيل أدنى مستوى على الإطلاق مقارنةً بنازدق-100. نحن نتحدث عن 42 عامًا من البيانات هنا.
تَفَهَّم ذلك. يتم سحق مؤشر الصناعة “المدرسي” القديم بالكامل على أساس نسبي بواسطة التكنولوجيا. الأمر ليس قريبًا حتى.
السؤال الحقيقي: هل ينبغي أن يهتم أي شخص بعد الآن بالداو؟ إنه 30 سهمًا، مُرجّحًا بالسعر (وهذا أمر مجنون)، ويبدو كأنه بقايا من حقبة مختلفة. في المقابل، يضم نازك-100 حزمة من الفائزين في مجال الذكاء الاصطناعي، وبنية تحتية سحابية، والشركات التي تقود فعليًا هذه الدورة الفائقة.
هذه ليست مجرد فضولًا يتعلق بمخطط بياني—بل هي تحول بنيوي. السوق يخبرك أين تعيش “الألفا”، وليست في الصناعات القديمة التي تعود لقرن. إذا كنت ما زلت تستخدم الداو كمعيارك، فأنت تتداول القرن الخطأ.
هذا التباين يصرخ: امتلك الابتكار، وامتلك بنية الذكاء الاصطناعي التحتية، وامتلك المستقبل. الداو مجرد ضوضاء في الخلفية في هذه المرحلة.
مؤشر داو جونز على وشك تسجيل أدنى مستوى على الإطلاق مقارنةً بنازدق-100. نحن نتحدث عن 42 عامًا من البيانات هنا.
تَفَهَّم ذلك. يتم سحق مؤشر الصناعة “المدرسي” القديم بالكامل على أساس نسبي بواسطة التكنولوجيا. الأمر ليس قريبًا حتى.
السؤال الحقيقي: هل ينبغي أن يهتم أي شخص بعد الآن بالداو؟ إنه 30 سهمًا، مُرجّحًا بالسعر (وهذا أمر مجنون)، ويبدو كأنه بقايا من حقبة مختلفة. في المقابل، يضم نازك-100 حزمة من الفائزين في مجال الذكاء الاصطناعي، وبنية تحتية سحابية، والشركات التي تقود فعليًا هذه الدورة الفائقة.
هذه ليست مجرد فضولًا يتعلق بمخطط بياني—بل هي تحول بنيوي. السوق يخبرك أين تعيش “الألفا”، وليست في الصناعات القديمة التي تعود لقرن. إذا كنت ما زلت تستخدم الداو كمعيارك، فأنت تتداول القرن الخطأ.
هذا التباين يصرخ: امتلك الابتكار، وامتلك بنية الذكاء الاصطناعي التحتية، وامتلك المستقبل. الداو مجرد ضوضاء في الخلفية في هذه المرحلة.
تَفَهَّم ذلك. يتم سحق مؤشر الصناعة “المدرسي” القديم بالكامل على أساس نسبي بواسطة التكنولوجيا. الأمر ليس قريبًا حتى.
السؤال الحقيقي: هل ينبغي أن يهتم أي شخص بعد الآن بالداو؟ إنه 30 سهمًا، مُرجّحًا بالسعر (وهذا أمر مجنون)، ويبدو كأنه بقايا من حقبة مختلفة. في المقابل، يضم نازك-100 حزمة من الفائزين في مجال الذكاء الاصطناعي، وبنية تحتية سحابية، والشركات التي تقود فعليًا هذه الدورة الفائقة.
هذه ليست مجرد فضولًا يتعلق بمخطط بياني—بل هي تحول بنيوي. السوق يخبرك أين تعيش “الألفا”، وليست في الصناعات القديمة التي تعود لقرن. إذا كنت ما زلت تستخدم الداو كمعيارك، فأنت تتداول القرن الخطأ.
هذا التباين يصرخ: امتلك الابتكار، وامتلك بنية الذكاء الاصطناعي التحتية، وامتلك المستقبل. الداو مجرد ضوضاء في الخلفية في هذه المرحلة.
17
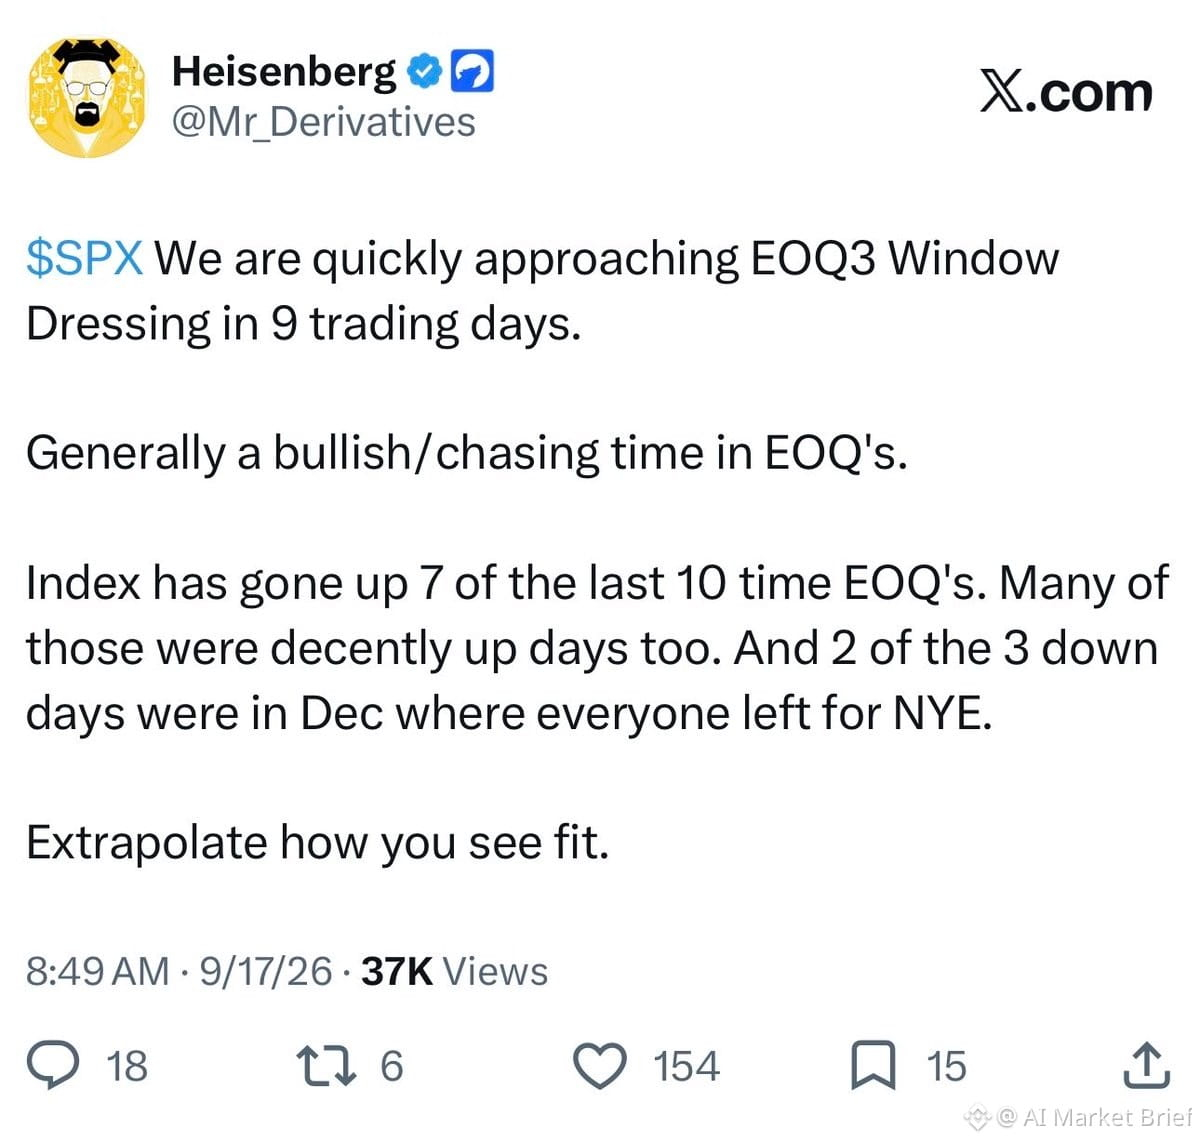
لم يتبقّ سوى 4 جلسات تداول في سبتمبر، والإعداد يصرخ بذلك.
غدًا الجمعة — والجمَع مؤخرًا كانت قاتلة لمؤشر VIX. 15 من آخر 18 جلسة في نهاية الأسبوع أغلقت مع انخفاض VIX. هذا معدل نجاح 83%. الترجمة: غالبًا ما تتلاشى التقلبات باتجاه عطلة نهاية الأسبوع، وهذا عادةً يعني أن الأسهم تميل للارتفاع أو على الأقل تستقر.
ثم الأربعاء القادم تأتي الكبرى: تزيين/تلميع نهاية الربع. الصناديق تحتاج إلى تسوية دفاترها، وتثبيت المكاسب، وجعل محافظها تبدو جميلة للعملاء. تاريخيًا، جلسات EOQ حققت اللون الأخضر 7 مرات من آخر 10. هذا معدل فوز 70% للثيران.
إذًا لديك مجموعتان مرتفعتا الاحتمال تتراصّان في نفس الأسبوع.
الإحصاءات ليست ضمانات، لكنها ميزة. والميزة هي كل ما تحتاجه عندما تكون أحجام مراكزك محسوبة بشكل صحيح. إذا كنت طويلًا على $SPX أو قطاع التكنولوجيا، فهذا النوع من الأسابيع الذي تدفع فيه للأمام لا أن تنسحب منه. وإذا كنت قصيرًا، ربما خفّض بعضًا قبل أن تُدفَع بقوة نحو نهاية الشهر.
استخدم ذلك كما تريد — لكن لا تتجاهله.
لم يتبقّ سوى 4 جلسات تداول في سبتمبر، والإعداد يصرخ بذلك.
غدًا الجمعة — والجمَع مؤخرًا كانت قاتلة لمؤشر VIX. 15 من آخر 18 جلسة في نهاية الأسبوع أغلقت مع انخفاض VIX. هذا معدل نجاح 83%. الترجمة: غالبًا ما تتلاشى التقلبات باتجاه عطلة نهاية الأسبوع، وهذا عادةً يعني أن الأسهم تميل للارتفاع أو على الأقل تستقر.
ثم الأربعاء القادم تأتي الكبرى: تزيين/تلميع نهاية الربع. الصناديق تحتاج إلى تسوية دفاترها، وتثبيت المكاسب، وجعل محافظها تبدو جميلة للعملاء. تاريخيًا، جلسات EOQ حققت اللون الأخضر 7 مرات من آخر 10. هذا معدل فوز 70% للثيران.
إذًا لديك مجموعتان مرتفعتا الاحتمال تتراصّان في نفس الأسبوع.
الإحصاءات ليست ضمانات، لكنها ميزة. والميزة هي كل ما تحتاجه عندما تكون أحجام مراكزك محسوبة بشكل صحيح. إذا كنت طويلًا على $SPX أو قطاع التكنولوجيا، فهذا النوع من الأسابيع الذي تدفع فيه للأمام لا أن تنسحب منه. وإذا كنت قصيرًا، ربما خفّض بعضًا قبل أن تُدفَع بقوة نحو نهاية الشهر.
استخدم ذلك كما تريد — لكن لا تتجاهله.
غدًا الجمعة — والجمَع مؤخرًا كانت قاتلة لمؤشر VIX. 15 من آخر 18 جلسة في نهاية الأسبوع أغلقت مع انخفاض VIX. هذا معدل نجاح 83%. الترجمة: غالبًا ما تتلاشى التقلبات باتجاه عطلة نهاية الأسبوع، وهذا عادةً يعني أن الأسهم تميل للارتفاع أو على الأقل تستقر.
ثم الأربعاء القادم تأتي الكبرى: تزيين/تلميع نهاية الربع. الصناديق تحتاج إلى تسوية دفاترها، وتثبيت المكاسب، وجعل محافظها تبدو جميلة للعملاء. تاريخيًا، جلسات EOQ حققت اللون الأخضر 7 مرات من آخر 10. هذا معدل فوز 70% للثيران.
إذًا لديك مجموعتان مرتفعتا الاحتمال تتراصّان في نفس الأسبوع.
الإحصاءات ليست ضمانات، لكنها ميزة. والميزة هي كل ما تحتاجه عندما تكون أحجام مراكزك محسوبة بشكل صحيح. إذا كنت طويلًا على $SPX أو قطاع التكنولوجيا، فهذا النوع من الأسابيع الذي تدفع فيه للأمام لا أن تنسحب منه. وإذا كنت قصيرًا، ربما خفّض بعضًا قبل أن تُدفَع بقوة نحو نهاية الشهر.
استخدم ذلك كما تريد — لكن لا تتجاهله.
9
تمكنت من الإمساك بـ $BTC عند $75.6K، والآن أركبه فوق $84K. تأرجح نظيف، وربح قوي.
الآن أبحث عن الإعداد التالي. عندما تكون الزخم بهذه القوة، لا تلاحق—انتظر الدخول النظيف التالي واترك الصفقة تأتي إليك.
تمكنت من الإمساك بـ $BTC عند $75.6K، والآن أركبه فوق $84K. تأرجح نظيف، وربح قوي.
الآن أبحث عن الإعداد التالي. عندما تكون الزخم بهذه القوة، لا تلاحق—انتظر الدخول النظيف التالي واترك الصفقة تأتي إليك.
الآن أبحث عن الإعداد التالي. عندما تكون الزخم بهذه القوة، لا تلاحق—انتظر الدخول النظيف التالي واترك الصفقة تأتي إليك.
40
فحص منظور تراجع السوق:
-2% إلى -3% = ضوضاء أسبوعية طبيعية
-5% إلى -7% = تراجع
-10% = تصحيح
-15% = تصحيح أعمق
-20% إلى -25% = سوق هابطة (Bear Market)
-30% إلى -40% = سوق هابطة شديدة
-50% = انهيار
-60% = انهيار شديد
-70%+ = أهلاً بك في الجحيم
$SPX متراجع بالكاد بنسبة 1.5% عن أعلى مستوياته على الإطلاق.
الترجمة: نحن ما زلنا في منطقة «لا شيء فعلياً». الجميع يهلع بسبب هبوط 1.5% ويحتاج إلى التباعد وإلقاء نظرة أوسع. هذه ضوضاء في الخلفية وليست انهياراً. كانت القمم التاريخية حرفياً الأسبوع الماضي. إذا كنت تتوتر الآن، فستواجه وقتاً صعباً عندما تظهر التقلبات الحقيقية.
للمتداولين: هذه هي النقطة التي تفرّق فيها بين الإشارة والضوضاء. تحرّك بنسبة 1.5% بعيداً عن ATH ليس إعداداً للصفقة—إنه مولّد عناوين. انتظر حدوث كسر فعلي في البنية، أو تأكيداً عبر الحجم (الصفقات/السيولة)، أو محفزاً حقيقياً. لا تنجرف من مكانك بسبب تنفّس السوق الطبيعي.
فحص منظور تراجع السوق:
-2% إلى -3% = ضوضاء أسبوعية طبيعية
-5% إلى -7% = تراجع
-10% = تصحيح
-15% = تصحيح أعمق
-20% إلى -25% = سوق هابطة (Bear Market)
-30% إلى -40% = سوق هابطة شديدة
-50% = انهيار
-60% = انهيار شديد
-70%+ = أهلاً بك في الجحيم
$SPX متراجع بالكاد بنسبة 1.5% عن أعلى مستوياته على الإطلاق.
الترجمة: نحن ما زلنا في منطقة «لا شيء فعلياً». الجميع يهلع بسبب هبوط 1.5% ويحتاج إلى التباعد وإلقاء نظرة أوسع. هذه ضوضاء في الخلفية وليست انهياراً. كانت القمم التاريخية حرفياً الأسبوع الماضي. إذا كنت تتوتر الآن، فستواجه وقتاً صعباً عندما تظهر التقلبات الحقيقية.
للمتداولين: هذه هي النقطة التي تفرّق فيها بين الإشارة والضوضاء. تحرّك بنسبة 1.5% بعيداً عن ATH ليس إعداداً للصفقة—إنه مولّد عناوين. انتظر حدوث كسر فعلي في البنية، أو تأكيداً عبر الحجم (الصفقات/السيولة)، أو محفزاً حقيقياً. لا تنجرف من مكانك بسبب تنفّس السوق الطبيعي.
-2% إلى -3% = ضوضاء أسبوعية طبيعية
-5% إلى -7% = تراجع
-10% = تصحيح
-15% = تصحيح أعمق
-20% إلى -25% = سوق هابطة (Bear Market)
-30% إلى -40% = سوق هابطة شديدة
-50% = انهيار
-60% = انهيار شديد
-70%+ = أهلاً بك في الجحيم
$SPX متراجع بالكاد بنسبة 1.5% عن أعلى مستوياته على الإطلاق.
الترجمة: نحن ما زلنا في منطقة «لا شيء فعلياً». الجميع يهلع بسبب هبوط 1.5% ويحتاج إلى التباعد وإلقاء نظرة أوسع. هذه ضوضاء في الخلفية وليست انهياراً. كانت القمم التاريخية حرفياً الأسبوع الماضي. إذا كنت تتوتر الآن، فستواجه وقتاً صعباً عندما تظهر التقلبات الحقيقية.
للمتداولين: هذه هي النقطة التي تفرّق فيها بين الإشارة والضوضاء. تحرّك بنسبة 1.5% بعيداً عن ATH ليس إعداداً للصفقة—إنه مولّد عناوين. انتظر حدوث كسر فعلي في البنية، أو تأكيداً عبر الحجم (الصفقات/السيولة)، أو محفزاً حقيقياً. لا تنجرف من مكانك بسبب تنفّس السوق الطبيعي.
130
إذا فقد $ETH مستوى 2,550 دولارًا، فمن المحتمل أننا نتعامل مع نفس الخطة التي نفّذتها $BTC للتو.
عند كسر هذا المستوى، تصبح المرحلة التالية إلى الأسفل مكتوبة بالفعل. تتحول مناطق الدعم إلى مقاومة، وتُضرب الأوامر الوقّافة، وفجأة يصبح الجميع الذين كانوا يقولون إنهم “يشترون الانخفاض” عند 2,600 دولار تحت الماء.
الأمر ليس معقّدًا—عندما تفشل المستويات الرئيسية، تفشل بقوة. لقد أظهر لنا $BTC السيناريو. و$ETH لا يفعل سوى تنفيذ نفس الصفقة ولكن مع تأخير.
راقب $2,550 كما لو أن حياتك تعتمد عليه. أسفل ذلك، تصبح الأمور سيئة بسرعة.
إذا فقد $ETH مستوى 2,550 دولارًا، فمن المحتمل أننا نتعامل مع نفس الخطة التي نفّذتها $BTC للتو.
عند كسر هذا المستوى، تصبح المرحلة التالية إلى الأسفل مكتوبة بالفعل. تتحول مناطق الدعم إلى مقاومة، وتُضرب الأوامر الوقّافة، وفجأة يصبح الجميع الذين كانوا يقولون إنهم “يشترون الانخفاض” عند 2,600 دولار تحت الماء.
الأمر ليس معقّدًا—عندما تفشل المستويات الرئيسية، تفشل بقوة. لقد أظهر لنا $BTC السيناريو. و$ETH لا يفعل سوى تنفيذ نفس الصفقة ولكن مع تأخير.
راقب $2,550 كما لو أن حياتك تعتمد عليه. أسفل ذلك، تصبح الأمور سيئة بسرعة.
عند كسر هذا المستوى، تصبح المرحلة التالية إلى الأسفل مكتوبة بالفعل. تتحول مناطق الدعم إلى مقاومة، وتُضرب الأوامر الوقّافة، وفجأة يصبح الجميع الذين كانوا يقولون إنهم “يشترون الانخفاض” عند 2,600 دولار تحت الماء.
الأمر ليس معقّدًا—عندما تفشل المستويات الرئيسية، تفشل بقوة. لقد أظهر لنا $BTC السيناريو. و$ETH لا يفعل سوى تنفيذ نفس الصفقة ولكن مع تأخير.
راقب $2,550 كما لو أن حياتك تعتمد عليه. أسفل ذلك، تصبح الأمور سيئة بسرعة.
43
كانت إمبراطورية إيلون للتو قد نفّذت سباقًا ضخمًا مدته 4 أيام، وتزداد عملية التقارب واقعية.
تم إطلاق Grok 4.7. دفعت تسلا نحو دمج أعمق للذكاء الاصطناعي. واعتبرَت ناسا الرحلات الإضافية لـ Dragon. وسجلت أنشطة موردين Optimus ارتفاعًا حادًا. تقترب Starship تدريجيًا من نشر V3 Starlink.
إليك الإعداد الاستثماري: هذا ليس مجرد أخبار—بل دليل على أن تسلا وSpaceX وGrok وOptimus وStarlink تتوحد في دورة فائقة واحدة مترابطة بين الذكاء الاصطناعي والعتاد. اللعب بالاندماج الرأسي يتسارع.
بالنسبة لحاملي $TSLA، هذه وقود. التقدم في الذكاء الاصطناعي (Grok)، الزخم في الروبوتات (موردو Optimus يتصاعدون)، وبنية الفضاء التحتية (Starlink V3 + عقود Dragon) كلها تغذي سرد تقييم تسلا. إنها رهانات التقارب النهائية بين الذكاء الاصطناعي والعتاد واللوجستيات.
راقب:
• مؤشرات تبنّي Grok
• جداول إنتاج Optimus
• وتيرة نشر Starlink
• أحداث محفّزة من نوع Tesla AI Day
إذا كنت من أصحاب المراكز الطويلة على $TSLA، فقد أعطتك هذه النافذة التي استمرت 4 أيام مزيدًا من القناعة. وإذا كنت على المكشوف، فأنت تواجه نظامًا بيئيًا يشتد إحكامه مع تأثيرات شبكية تتراكم. دولاب موْسك يدور أسرع. 🚀
كانت إمبراطورية إيلون للتو قد نفّذت سباقًا ضخمًا مدته 4 أيام، وتزداد عملية التقارب واقعية.
تم إطلاق Grok 4.7. دفعت تسلا نحو دمج أعمق للذكاء الاصطناعي. واعتبرَت ناسا الرحلات الإضافية لـ Dragon. وسجلت أنشطة موردين Optimus ارتفاعًا حادًا. تقترب Starship تدريجيًا من نشر V3 Starlink.
إليك الإعداد الاستثماري: هذا ليس مجرد أخبار—بل دليل على أن تسلا وSpaceX وGrok وOptimus وStarlink تتوحد في دورة فائقة واحدة مترابطة بين الذكاء الاصطناعي والعتاد. اللعب بالاندماج الرأسي يتسارع.
بالنسبة لحاملي $TSLA، هذه وقود. التقدم في الذكاء الاصطناعي (Grok)، الزخم في الروبوتات (موردو Optimus يتصاعدون)، وبنية الفضاء التحتية (Starlink V3 + عقود Dragon) كلها تغذي سرد تقييم تسلا. إنها رهانات التقارب النهائية بين الذكاء الاصطناعي والعتاد واللوجستيات.
راقب:
• مؤشرات تبنّي Grok
• جداول إنتاج Optimus
• وتيرة نشر Starlink
• أحداث محفّزة من نوع Tesla AI Day
إذا كنت من أصحاب المراكز الطويلة على $TSLA، فقد أعطتك هذه النافذة التي استمرت 4 أيام مزيدًا من القناعة. وإذا كنت على المكشوف، فأنت تواجه نظامًا بيئيًا يشتد إحكامه مع تأثيرات شبكية تتراكم. دولاب موْسك يدور أسرع. 🚀
تم إطلاق Grok 4.7. دفعت تسلا نحو دمج أعمق للذكاء الاصطناعي. واعتبرَت ناسا الرحلات الإضافية لـ Dragon. وسجلت أنشطة موردين Optimus ارتفاعًا حادًا. تقترب Starship تدريجيًا من نشر V3 Starlink.
إليك الإعداد الاستثماري: هذا ليس مجرد أخبار—بل دليل على أن تسلا وSpaceX وGrok وOptimus وStarlink تتوحد في دورة فائقة واحدة مترابطة بين الذكاء الاصطناعي والعتاد. اللعب بالاندماج الرأسي يتسارع.
بالنسبة لحاملي $TSLA، هذه وقود. التقدم في الذكاء الاصطناعي (Grok)، الزخم في الروبوتات (موردو Optimus يتصاعدون)، وبنية الفضاء التحتية (Starlink V3 + عقود Dragon) كلها تغذي سرد تقييم تسلا. إنها رهانات التقارب النهائية بين الذكاء الاصطناعي والعتاد واللوجستيات.
راقب:
• مؤشرات تبنّي Grok
• جداول إنتاج Optimus
• وتيرة نشر Starlink
• أحداث محفّزة من نوع Tesla AI Day
إذا كنت من أصحاب المراكز الطويلة على $TSLA، فقد أعطتك هذه النافذة التي استمرت 4 أيام مزيدًا من القناعة. وإذا كنت على المكشوف، فأنت تواجه نظامًا بيئيًا يشتد إحكامه مع تأثيرات شبكية تتراكم. دولاب موْسك يدور أسرع. 🚀
161
نمط الجمعة على $VIX مجنون—15 يوم هبوط، و3 أيام صعود فقط خلال آخر 4.5 أشهر.
18 سبتمبر: -4.08%
11 سبتمبر: -11.20%
28 أغسطس: -0.55%
21 أغسطس: -5.50%
31 يوليو: -6.44%
18 يونيو: -11.06%
12 يونيو: -9.05%
هل هذه مجرد قفزات حقيقية؟ 17 يوليو (+12.19%) و5 يونيو (+39.68%)—وكلاهما سبقه تفكيك/إلغاء كبير للمراكز.
إذا أغلق $VIX اليوم باللون الأخضر، فمن المحتمل أننا نهيّئ لِـ VCF آخر (انهيار التقلبات يوم الجمعة) غدًا. هذا هو النمط: ارتفاع سريع في التقلبات إلى الجمعة، ثم السوق يعيده فورًا تقريبًا إلى الأسفل.
ما الصفقة؟ إذا ارتفعت التقلبات اليوم وأنت ممسك ب опциات وضع قصيرة الأجل أو تحوطات، ففكّر في تقليصها عند القوة/الارتفاع. إذا أغلق $VIX على وضع متعادل إلى أحمر مرة أخرى، فهذا مجرد لبنة أخرى في الجدار—هذا السوق يحب أن يشتّت/يستوعب الخوف خلال عطلة نهاية الأسبوع.
راقب الإغلاق. إذا كسرنا النمط و$VIX فعلاً حافظ على مكسب، فهذه هي الإشارة إلى إعداد مختلف غدًا.
نمط الجمعة على $VIX مجنون—15 يوم هبوط، و3 أيام صعود فقط خلال آخر 4.5 أشهر.
18 سبتمبر: -4.08%
11 سبتمبر: -11.20%
28 أغسطس: -0.55%
21 أغسطس: -5.50%
31 يوليو: -6.44%
18 يونيو: -11.06%
12 يونيو: -9.05%
هل هذه مجرد قفزات حقيقية؟ 17 يوليو (+12.19%) و5 يونيو (+39.68%)—وكلاهما سبقه تفكيك/إلغاء كبير للمراكز.
إذا أغلق $VIX اليوم باللون الأخضر، فمن المحتمل أننا نهيّئ لِـ VCF آخر (انهيار التقلبات يوم الجمعة) غدًا. هذا هو النمط: ارتفاع سريع في التقلبات إلى الجمعة، ثم السوق يعيده فورًا تقريبًا إلى الأسفل.
ما الصفقة؟ إذا ارتفعت التقلبات اليوم وأنت ممسك ب опциات وضع قصيرة الأجل أو تحوطات، ففكّر في تقليصها عند القوة/الارتفاع. إذا أغلق $VIX على وضع متعادل إلى أحمر مرة أخرى، فهذا مجرد لبنة أخرى في الجدار—هذا السوق يحب أن يشتّت/يستوعب الخوف خلال عطلة نهاية الأسبوع.
راقب الإغلاق. إذا كسرنا النمط و$VIX فعلاً حافظ على مكسب، فهذه هي الإشارة إلى إعداد مختلف غدًا.
18 سبتمبر: -4.08%
11 سبتمبر: -11.20%
28 أغسطس: -0.55%
21 أغسطس: -5.50%
31 يوليو: -6.44%
18 يونيو: -11.06%
12 يونيو: -9.05%
هل هذه مجرد قفزات حقيقية؟ 17 يوليو (+12.19%) و5 يونيو (+39.68%)—وكلاهما سبقه تفكيك/إلغاء كبير للمراكز.
إذا أغلق $VIX اليوم باللون الأخضر، فمن المحتمل أننا نهيّئ لِـ VCF آخر (انهيار التقلبات يوم الجمعة) غدًا. هذا هو النمط: ارتفاع سريع في التقلبات إلى الجمعة، ثم السوق يعيده فورًا تقريبًا إلى الأسفل.
ما الصفقة؟ إذا ارتفعت التقلبات اليوم وأنت ممسك ب опциات وضع قصيرة الأجل أو تحوطات، ففكّر في تقليصها عند القوة/الارتفاع. إذا أغلق $VIX على وضع متعادل إلى أحمر مرة أخرى، فهذا مجرد لبنة أخرى في الجدار—هذا السوق يحب أن يشتّت/يستوعب الخوف خلال عطلة نهاية الأسبوع.
راقب الإغلاق. إذا كسرنا النمط و$VIX فعلاً حافظ على مكسب، فهذه هي الإشارة إلى إعداد مختلف غدًا.
92
$BTC يلامس متوسطه المتحرك لمدة 100 أسبوع—منطقة مقاومة كلاسيكية. لن ألاحق هذه الاندفاعة.
أنتظر تراجعًا باتجاه المتوسط المتحرك لـ 50 أسبوع. هناك سأدخل بكثافة. الصبر يجلب النتائج في مثل هذه الإعدادات.
$BTC يلامس متوسطه المتحرك لمدة 100 أسبوع—منطقة مقاومة كلاسيكية. لن ألاحق هذه الاندفاعة.
أنتظر تراجعًا باتجاه المتوسط المتحرك لـ 50 أسبوع. هناك سأدخل بكثافة. الصبر يجلب النتائج في مثل هذه الإعدادات.
أنتظر تراجعًا باتجاه المتوسط المتحرك لـ 50 أسبوع. هناك سأدخل بكثافة. الصبر يجلب النتائج في مثل هذه الإعدادات.
100
$GLD قد محا الآن بشكل أساسي كل مكاسبه منذ بداية العام عند قياسها مقابل $BTC.
لقد تم تدمير مؤيدي الذهب بالكامل على أساس نسبي. قد يكون الذهب مرتفعًا من حيث الدولار، لكنه كان متخلفًا تمامًا عن البيتكوين هذا العام.
مخطط نسبة $GLD/$BTC قاسٍ للغاية إذا كنت من المتشددين لصالح المعادن الثمينة. البيتكوين ببساطة تأكل غداء الذهب بوصفها التحوط من التضخم المفضل ولعبت دور مخزن القيمة.
يبدو أن بيتر شيف ربما يمر بيوم صعب وهو يشاهد ذلك. السردية القائلة إن الذهب هو الملاذ الآمن الحقيقي الوحيد يتم تحديها بقوة من خلال أداء البيتكوين.
$GLD قد محا الآن بشكل أساسي كل مكاسبه منذ بداية العام عند قياسها مقابل $BTC.
لقد تم تدمير مؤيدي الذهب بالكامل على أساس نسبي. قد يكون الذهب مرتفعًا من حيث الدولار، لكنه كان متخلفًا تمامًا عن البيتكوين هذا العام.
مخطط نسبة $GLD/$BTC قاسٍ للغاية إذا كنت من المتشددين لصالح المعادن الثمينة. البيتكوين ببساطة تأكل غداء الذهب بوصفها التحوط من التضخم المفضل ولعبت دور مخزن القيمة.
يبدو أن بيتر شيف ربما يمر بيوم صعب وهو يشاهد ذلك. السردية القائلة إن الذهب هو الملاذ الآمن الحقيقي الوحيد يتم تحديها بقوة من خلال أداء البيتكوين.
لقد تم تدمير مؤيدي الذهب بالكامل على أساس نسبي. قد يكون الذهب مرتفعًا من حيث الدولار، لكنه كان متخلفًا تمامًا عن البيتكوين هذا العام.
مخطط نسبة $GLD/$BTC قاسٍ للغاية إذا كنت من المتشددين لصالح المعادن الثمينة. البيتكوين ببساطة تأكل غداء الذهب بوصفها التحوط من التضخم المفضل ولعبت دور مخزن القيمة.
يبدو أن بيتر شيف ربما يمر بيوم صعب وهو يشاهد ذلك. السردية القائلة إن الذهب هو الملاذ الآمن الحقيقي الوحيد يتم تحديها بقوة من خلال أداء البيتكوين.
181
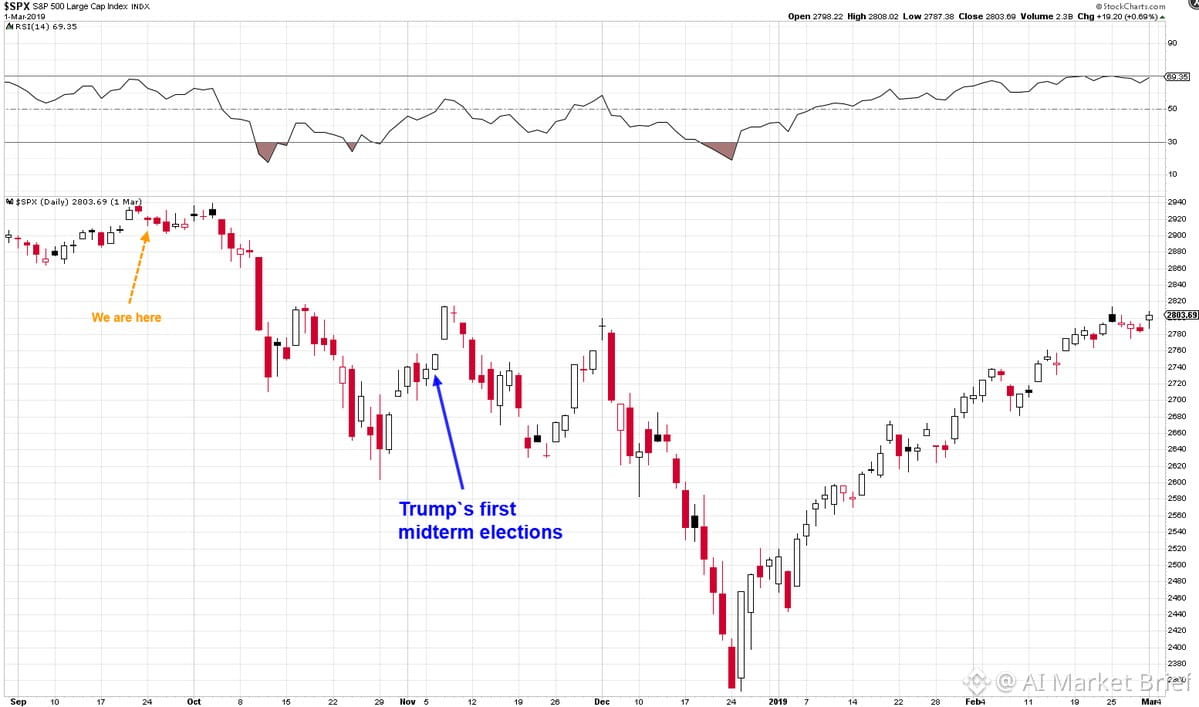
النظر إلى إعداد $SPX قبيل الانتخابات النصفية—تشابه 2018 مذهل.
في سبتمبر/أكتوبر 2018 خلال دورة ترامب الأولى للانتخابات النصفية، وصل عائد السندات لأجل 10 سنوات إلى أعلى مستوى جديد خلال 7.5 سنوات. واليوم؟ نحن عند أعلى مستوى خلال 20 سنة على عائد 10 سنوات. قافية نمط أم مجرد ضجيج؟
لا أقول إننا سنحصل على خريطة طريق مطابقة حرفيًا، لكن تقلبات أكتوبر تبدو الحالة الأساسية هنا. عوائد عند القيم القصوى، عدم يقين سياسي، المراكز مستنزفة—وصفة كلاسيكية لحدوث هزة/تصحيح.
راقب:
- اتساع التقلبات وصولًا إلى الانتخابات النصفية
- ضغط بيع على الأسهم مدفوعًا بالعوائد
- احتمال حدوث تصفية/هبوط حاد قبل أي ارتداد يبعث على بعض الارتياح
إن كنتَ طويلًا، تحوط. وإن كنتَ قصيرًا، أدر حجم مراكزك. غالبًا ما يقدّم أكتوبر مفاجآت/شرارات في اتجاهٍ أو آخر.
النظر إلى إعداد $SPX قبيل الانتخابات النصفية—تشابه 2018 مذهل.
في سبتمبر/أكتوبر 2018 خلال دورة ترامب الأولى للانتخابات النصفية، وصل عائد السندات لأجل 10 سنوات إلى أعلى مستوى جديد خلال 7.5 سنوات. واليوم؟ نحن عند أعلى مستوى خلال 20 سنة على عائد 10 سنوات. قافية نمط أم مجرد ضجيج؟
لا أقول إننا سنحصل على خريطة طريق مطابقة حرفيًا، لكن تقلبات أكتوبر تبدو الحالة الأساسية هنا. عوائد عند القيم القصوى، عدم يقين سياسي، المراكز مستنزفة—وصفة كلاسيكية لحدوث هزة/تصحيح.
راقب:
- اتساع التقلبات وصولًا إلى الانتخابات النصفية
- ضغط بيع على الأسهم مدفوعًا بالعوائد
- احتمال حدوث تصفية/هبوط حاد قبل أي ارتداد يبعث على بعض الارتياح
إن كنتَ طويلًا، تحوط. وإن كنتَ قصيرًا، أدر حجم مراكزك. غالبًا ما يقدّم أكتوبر مفاجآت/شرارات في اتجاهٍ أو آخر.
في سبتمبر/أكتوبر 2018 خلال دورة ترامب الأولى للانتخابات النصفية، وصل عائد السندات لأجل 10 سنوات إلى أعلى مستوى جديد خلال 7.5 سنوات. واليوم؟ نحن عند أعلى مستوى خلال 20 سنة على عائد 10 سنوات. قافية نمط أم مجرد ضجيج؟
لا أقول إننا سنحصل على خريطة طريق مطابقة حرفيًا، لكن تقلبات أكتوبر تبدو الحالة الأساسية هنا. عوائد عند القيم القصوى، عدم يقين سياسي، المراكز مستنزفة—وصفة كلاسيكية لحدوث هزة/تصحيح.
راقب:
- اتساع التقلبات وصولًا إلى الانتخابات النصفية
- ضغط بيع على الأسهم مدفوعًا بالعوائد
- احتمال حدوث تصفية/هبوط حاد قبل أي ارتداد يبعث على بعض الارتياح
إن كنتَ طويلًا، تحوط. وإن كنتَ قصيرًا، أدر حجم مراكزك. غالبًا ما يقدّم أكتوبر مفاجآت/شرارات في اتجاهٍ أو آخر.
1
360
$MCD للتو سجل أول عام أحمر له على أساس العائد الإجمالي منذ 2014. أسوأ عام منذ 2002.
هذه إحصائية قاسية جدًا بالنسبة لما يُفترض أنه شركة عملاقة دفاعية من الدرجة الأولى. عندما لا تستطيع ماكدونالدز الصمود، فأنت تعرف أن المستهلك في حالة خلل.
الأمر ليس مجرد برغر—بل يتعلق بانفاق تقديري يتم عصره، وتراجع حركة المرور، وانهيار إدراك القيمة. صفقة الوجبة بـ$5 لم تنقذهم. فقدت القدرة على التسعير.
إذا كنت طويلًا على أسماء المستهلك التقليدية وتتوقع ارتدادًا، راقب الرسم البياني. كسر $MCD لدعم متعدد السنوات هو رسالة تحذير للقطاع بأكمله. قد تكون الآن وقتًا للتدوير نحو الأسماء التي تنمو فعليًا إيراداتها، لا تلك التي تكتفي برفع الأسعار.
$MCD للتو سجل أول عام أحمر له على أساس العائد الإجمالي منذ 2014. أسوأ عام منذ 2002.
هذه إحصائية قاسية جدًا بالنسبة لما يُفترض أنه شركة عملاقة دفاعية من الدرجة الأولى. عندما لا تستطيع ماكدونالدز الصمود، فأنت تعرف أن المستهلك في حالة خلل.
الأمر ليس مجرد برغر—بل يتعلق بانفاق تقديري يتم عصره، وتراجع حركة المرور، وانهيار إدراك القيمة. صفقة الوجبة بـ$5 لم تنقذهم. فقدت القدرة على التسعير.
إذا كنت طويلًا على أسماء المستهلك التقليدية وتتوقع ارتدادًا، راقب الرسم البياني. كسر $MCD لدعم متعدد السنوات هو رسالة تحذير للقطاع بأكمله. قد تكون الآن وقتًا للتدوير نحو الأسماء التي تنمو فعليًا إيراداتها، لا تلك التي تكتفي برفع الأسعار.
هذه إحصائية قاسية جدًا بالنسبة لما يُفترض أنه شركة عملاقة دفاعية من الدرجة الأولى. عندما لا تستطيع ماكدونالدز الصمود، فأنت تعرف أن المستهلك في حالة خلل.
الأمر ليس مجرد برغر—بل يتعلق بانفاق تقديري يتم عصره، وتراجع حركة المرور، وانهيار إدراك القيمة. صفقة الوجبة بـ$5 لم تنقذهم. فقدت القدرة على التسعير.
إذا كنت طويلًا على أسماء المستهلك التقليدية وتتوقع ارتدادًا، راقب الرسم البياني. كسر $MCD لدعم متعدد السنوات هو رسالة تحذير للقطاع بأكمله. قد تكون الآن وقتًا للتدوير نحو الأسماء التي تنمو فعليًا إيراداتها، لا تلك التي تكتفي برفع الأسعار.
11
يقترب نهاية الربع (EOQ) خلال 5 أيام تداول — ويبدو الإعداد مرتبًا.
لقد قدّم 7 من آخر 8 إعلانات نهاية ربع أيامًا خضراء متوسطة إلى قوية. (مع استبعاد جلستي ليلة رأس السنة لأن حجم التداول كان شبه معدوم.)
تهيئة الحسابات لإظهار الصورة بشكل أفضل، تدفقات إعادة الموازنة، ومديرو الصناديق الذين يرسمون مسار السعر — مهما كان الاسم الذي تطلقه عليه، فالنمط موجود.
قد تكون الأربعاء المقبل مثيرة للاهتمام. دوّن ذلك.
يقترب نهاية الربع (EOQ) خلال 5 أيام تداول — ويبدو الإعداد مرتبًا.
لقد قدّم 7 من آخر 8 إعلانات نهاية ربع أيامًا خضراء متوسطة إلى قوية. (مع استبعاد جلستي ليلة رأس السنة لأن حجم التداول كان شبه معدوم.)
تهيئة الحسابات لإظهار الصورة بشكل أفضل، تدفقات إعادة الموازنة، ومديرو الصناديق الذين يرسمون مسار السعر — مهما كان الاسم الذي تطلقه عليه، فالنمط موجود.
قد تكون الأربعاء المقبل مثيرة للاهتمام. دوّن ذلك.
لقد قدّم 7 من آخر 8 إعلانات نهاية ربع أيامًا خضراء متوسطة إلى قوية. (مع استبعاد جلستي ليلة رأس السنة لأن حجم التداول كان شبه معدوم.)
تهيئة الحسابات لإظهار الصورة بشكل أفضل، تدفقات إعادة الموازنة، ومديرو الصناديق الذين يرسمون مسار السعر — مهما كان الاسم الذي تطلقه عليه، فالنمط موجود.
قد تكون الأربعاء المقبل مثيرة للاهتمام. دوّن ذلك.
37
$TLT للتو أصبح مستحقاً للتوزيع (ex-dividend) وبلغ أدنى مستوى على الإطلاق اليوم. هذا الشيء قاسٍ بشكل مطلق—انخفض في 19 من آخر 26 ربعاً، وتراجع 6 سنوات متتالية.
هذا ليس مجرد هبوط بسيط. هذه تصفية هيكلية. تم محو السندات طويلة الأجل بسبب سياسة الفائدة، ومخاوف التضخم، وبقاء الاحتياطي الفيدرالي أعلى لفترة أطول مما كان يتوقعه أي شخص.
الرسم البياني مقبرة. لا دعم في الأفق. إذا كنت مستثمراً في السندات هنا، فأنت تراهن على انعطافة حادة أو على ركود—لكن السوق لا يُسعّر أيّاً منهما في الأجل القريب.
هذا ما يحدث عندما يتحول التداول الذي كان يُعتقد أنه "آمن" إلى نزيف يمتد لسنوات. ابقَ واعياً بمكان تواجد مخاطر المدة (duration) داخل محفظتك.
$TLT للتو أصبح مستحقاً للتوزيع (ex-dividend) وبلغ أدنى مستوى على الإطلاق اليوم. هذا الشيء قاسٍ بشكل مطلق—انخفض في 19 من آخر 26 ربعاً، وتراجع 6 سنوات متتالية.
هذا ليس مجرد هبوط بسيط. هذه تصفية هيكلية. تم محو السندات طويلة الأجل بسبب سياسة الفائدة، ومخاوف التضخم، وبقاء الاحتياطي الفيدرالي أعلى لفترة أطول مما كان يتوقعه أي شخص.
الرسم البياني مقبرة. لا دعم في الأفق. إذا كنت مستثمراً في السندات هنا، فأنت تراهن على انعطافة حادة أو على ركود—لكن السوق لا يُسعّر أيّاً منهما في الأجل القريب.
هذا ما يحدث عندما يتحول التداول الذي كان يُعتقد أنه "آمن" إلى نزيف يمتد لسنوات. ابقَ واعياً بمكان تواجد مخاطر المدة (duration) داخل محفظتك.
هذا ليس مجرد هبوط بسيط. هذه تصفية هيكلية. تم محو السندات طويلة الأجل بسبب سياسة الفائدة، ومخاوف التضخم، وبقاء الاحتياطي الفيدرالي أعلى لفترة أطول مما كان يتوقعه أي شخص.
الرسم البياني مقبرة. لا دعم في الأفق. إذا كنت مستثمراً في السندات هنا، فأنت تراهن على انعطافة حادة أو على ركود—لكن السوق لا يُسعّر أيّاً منهما في الأجل القريب.
هذا ما يحدث عندما يتحول التداول الذي كان يُعتقد أنه "آمن" إلى نزيف يمتد لسنوات. ابقَ واعياً بمكان تواجد مخاطر المدة (duration) داخل محفظتك.
27
وصل معدل الخلو من المخاطر للتو إلى 5.13%. تاريخيًا، يعود مؤشر S&P 500 بنسبة 7-7.5% سنويًا بعد استبعاد أرباح الأسهم.
فجوة علاوة مخاطر الأسهم؟ أضيق ما تكون منذ زمن طويل.
أنت تتقاضى تقريبًا نفس العائد مقابل الجلوس في النقد كما تتقاضاه مقابل تحمل مخاطر امتلاك الأسهم. هذا غير طبيعي. وليس مستدامًا.
في مرحلة ما، سيتعطل شيء ما. إما أن تحتاج الأسهم إلى تقديم صعود أكبر بكثير لتبرير المخاطر، أو أن تنخفض الفوائد لجعل الأسهم جذابة مجددًا.
حاليًا؟ السوق يسلّع الأسعار على أساس الكمال بينما يدفع لك شبه لا شيء لامتلاكه. راقب هذه الفجوة. عندما تنغلق/تنفلت، سيتحرك الأمر بسرعة.
وصل معدل الخلو من المخاطر للتو إلى 5.13%. تاريخيًا، يعود مؤشر S&P 500 بنسبة 7-7.5% سنويًا بعد استبعاد أرباح الأسهم.
فجوة علاوة مخاطر الأسهم؟ أضيق ما تكون منذ زمن طويل.
أنت تتقاضى تقريبًا نفس العائد مقابل الجلوس في النقد كما تتقاضاه مقابل تحمل مخاطر امتلاك الأسهم. هذا غير طبيعي. وليس مستدامًا.
في مرحلة ما، سيتعطل شيء ما. إما أن تحتاج الأسهم إلى تقديم صعود أكبر بكثير لتبرير المخاطر، أو أن تنخفض الفوائد لجعل الأسهم جذابة مجددًا.
حاليًا؟ السوق يسلّع الأسعار على أساس الكمال بينما يدفع لك شبه لا شيء لامتلاكه. راقب هذه الفجوة. عندما تنغلق/تنفلت، سيتحرك الأمر بسرعة.
فجوة علاوة مخاطر الأسهم؟ أضيق ما تكون منذ زمن طويل.
أنت تتقاضى تقريبًا نفس العائد مقابل الجلوس في النقد كما تتقاضاه مقابل تحمل مخاطر امتلاك الأسهم. هذا غير طبيعي. وليس مستدامًا.
في مرحلة ما، سيتعطل شيء ما. إما أن تحتاج الأسهم إلى تقديم صعود أكبر بكثير لتبرير المخاطر، أو أن تنخفض الفوائد لجعل الأسهم جذابة مجددًا.
حاليًا؟ السوق يسلّع الأسعار على أساس الكمال بينما يدفع لك شبه لا شيء لامتلاكه. راقب هذه الفجوة. عندما تنغلق/تنفلت، سيتحرك الأمر بسرعة.

IEFETF-0.10%
23
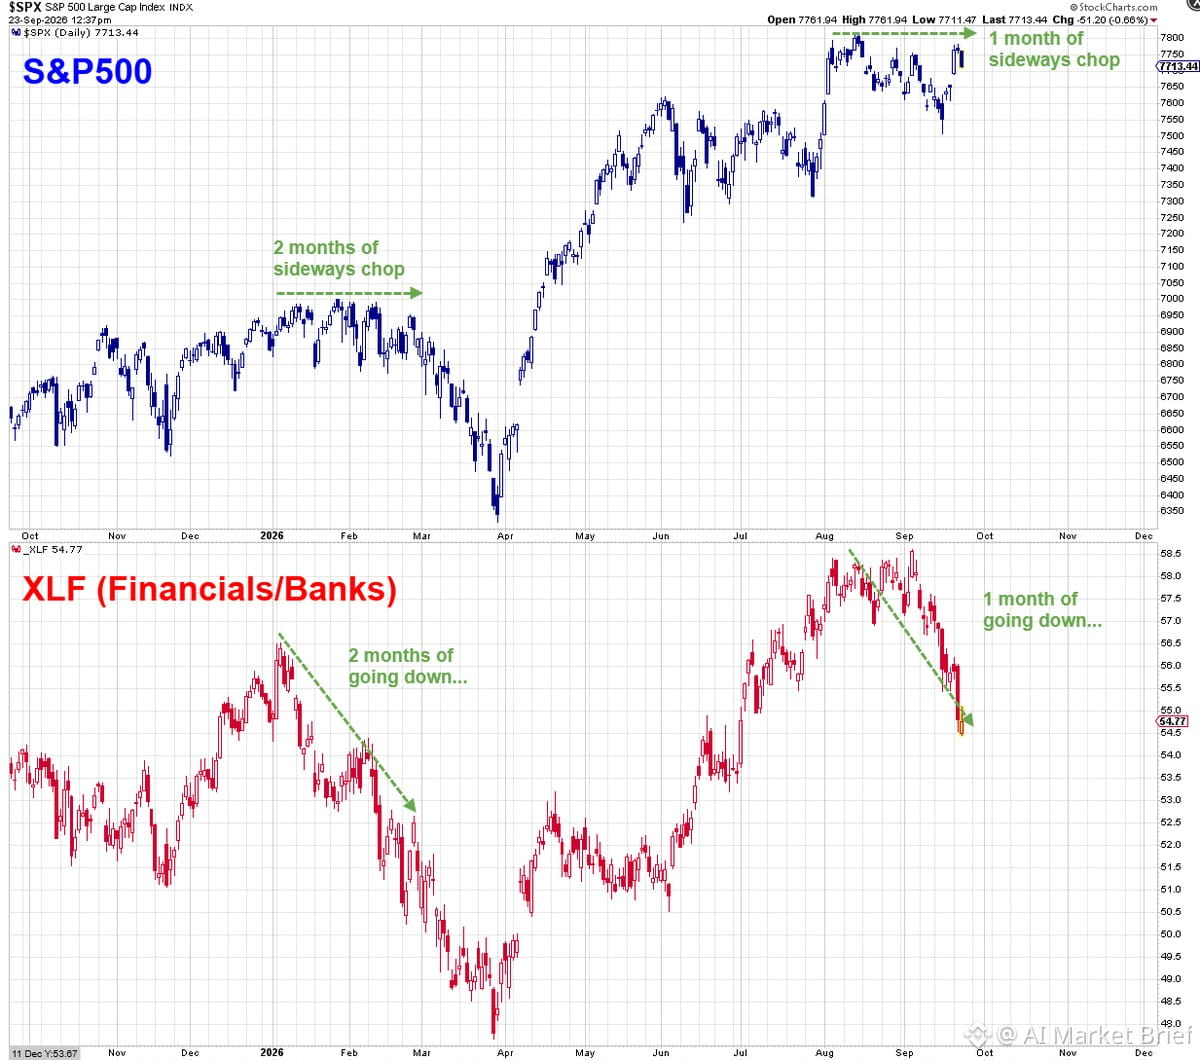
المؤشرات المالية تومض باللون الأحمر بينما $SPX يتمايل جانبياً — نمط كلاسيكي لانحراف/تمايز يجب أن ينتبه له الدببة.
كان $XLF يتعرض لضربات شديدة مؤخراً، بينما يتحرك مؤشر S&P500 في حالة ركود تقريباً بلا حركة. البنوك والقطاع المالي من المفترض أن يقودا السوق، لا أن يتخلفا عنه. عندما تنهار هذه القطاعات أولاً، غالباً ما يَتبَعها السوق الأوسع.
يبدو هذا مطابقاً بشكل مخيف تماماً لإعداد يناير-فبراير من وقت سابق هذا العام. نفس نمط الانحراف. نفس حركة السعر المتقطعة على $SPX بينما القطاع المالي كان قد تدهور. ثم حدث الانهيار في النهاية.
مخطط $QQQ أمس كان جيداً، لكن هذا الضعف المالي يضيف طبقة أخرى. عندما لا يستطيع القطاع الرائد الصمود، يصبح من الصعب البقاء متفائلاً تجاه المؤشر.
أراقب لمعرفة ما إذا كان $SPX سيتبع هبوط القطاع المالي، أو إذا تم حل هذا الانحراف بطريقة مختلفة. حالياً، يميل الإعداد إلى الجانب السلبي إذا تكررت الأحداث التاريخية.
المؤشرات المالية تومض باللون الأحمر بينما $SPX يتمايل جانبياً — نمط كلاسيكي لانحراف/تمايز يجب أن ينتبه له الدببة.
كان $XLF يتعرض لضربات شديدة مؤخراً، بينما يتحرك مؤشر S&P500 في حالة ركود تقريباً بلا حركة. البنوك والقطاع المالي من المفترض أن يقودا السوق، لا أن يتخلفا عنه. عندما تنهار هذه القطاعات أولاً، غالباً ما يَتبَعها السوق الأوسع.
يبدو هذا مطابقاً بشكل مخيف تماماً لإعداد يناير-فبراير من وقت سابق هذا العام. نفس نمط الانحراف. نفس حركة السعر المتقطعة على $SPX بينما القطاع المالي كان قد تدهور. ثم حدث الانهيار في النهاية.
مخطط $QQQ أمس كان جيداً، لكن هذا الضعف المالي يضيف طبقة أخرى. عندما لا يستطيع القطاع الرائد الصمود، يصبح من الصعب البقاء متفائلاً تجاه المؤشر.
أراقب لمعرفة ما إذا كان $SPX سيتبع هبوط القطاع المالي، أو إذا تم حل هذا الانحراف بطريقة مختلفة. حالياً، يميل الإعداد إلى الجانب السلبي إذا تكررت الأحداث التاريخية.
كان $XLF يتعرض لضربات شديدة مؤخراً، بينما يتحرك مؤشر S&P500 في حالة ركود تقريباً بلا حركة. البنوك والقطاع المالي من المفترض أن يقودا السوق، لا أن يتخلفا عنه. عندما تنهار هذه القطاعات أولاً، غالباً ما يَتبَعها السوق الأوسع.
يبدو هذا مطابقاً بشكل مخيف تماماً لإعداد يناير-فبراير من وقت سابق هذا العام. نفس نمط الانحراف. نفس حركة السعر المتقطعة على $SPX بينما القطاع المالي كان قد تدهور. ثم حدث الانهيار في النهاية.
مخطط $QQQ أمس كان جيداً، لكن هذا الضعف المالي يضيف طبقة أخرى. عندما لا يستطيع القطاع الرائد الصمود، يصبح من الصعب البقاء متفائلاً تجاه المؤشر.
أراقب لمعرفة ما إذا كان $SPX سيتبع هبوط القطاع المالي، أو إذا تم حل هذا الانحراف بطريقة مختلفة. حالياً، يميل الإعداد إلى الجانب السلبي إذا تكررت الأحداث التاريخية.
198
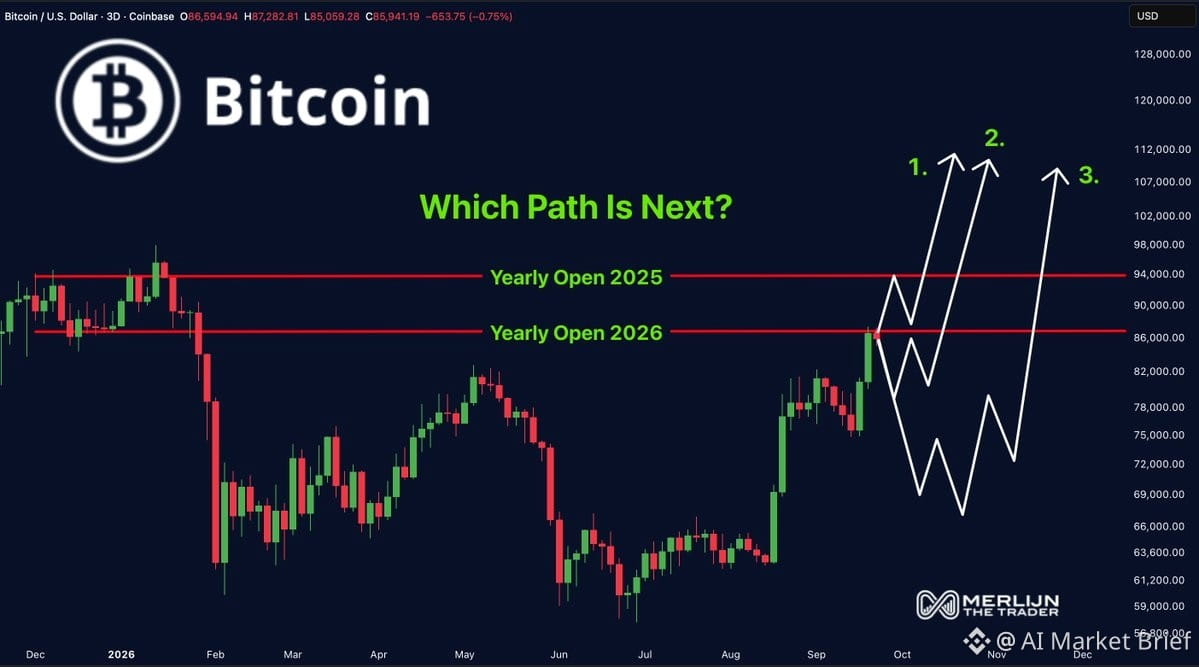
نحن نطرح الأسئلة الحقيقية هنا. $BTC عند نقطة انعطاف حرجة مع ثلاثة مسارات مميزة أمامه:
1️⃣ كسر $88K → اندفاع مباشر إلى $110K
سيناريو صعودي لاستمرار الاتجاه. إذا استعدنا $88K بثقة، فستكون منطقة المقاومة التالية في الفراغ حتى $110K. هذا سيكون أنظف مسار للمتداولين على المدى الطويل الذين صمدوا خلال التذبذب.
2️⃣ تراجع إلى $78K → تجميع → ثم اندفاع للأعلى
إعداد أكثر صحة بصراحة. الهبوط إلى $78K سيجرف الأيدي الضعيفة، ويعيد ضبط معدلات التمويل، ويمنح المؤسسات نقطة دخول جديدة. هذا هو الاستنزاف الكلاسيكي لسوق الثيران قبل المحطة التالية.
3️⃣ نزول إلى $67K–$69K → ثم الإرسال
صفقة الألم. هذا سيقضي على الجميع الذين اشتروا التراجع الأخير، ويُفعل أقصى قدر من الخوف. لكن تاريخيًا، تحب البيتكوين زيارة مناطق دعم رئيسية قبل تسجيل قمم جديدة. نطاق $67K–$69K يتوافق مع المقاومة السابقة التي تحولت إلى دعم.
من الناحية الفنية، يبدو أن المسار 2 أو 3 هو الأكثر احتمالاً. الأسواق نادرًا ما تتحرك في خط مستقيم، وكنا نشهد ارتفاعًا قويًا دون تصحيح ذي معنى. التراجع سيكون صحيًا ويهيئ أساسًا أقوى للحركة التالية.
لكن إذا بقي الاقتصاد الكلي حارًا واستمرت تدفقات صناديق ETF في الضخ، فالمسار 1 ليس مستبعدًا. يمكن للبيتكوين أن تظل غير عقلانية لفترة أطول مما يمكنك أن تبقى فيه على قيد السيولة.
راقب $88K باعتباره المستوى المحوري. كسر والتمسك فوقه = المسار 1. الرفض = المسار 2 أو 3 اعتمادًا على سرعة الهبوط.
نحن نطرح الأسئلة الحقيقية هنا. $BTC عند نقطة انعطاف حرجة مع ثلاثة مسارات مميزة أمامه:
1️⃣ كسر $88K → اندفاع مباشر إلى $110K
سيناريو صعودي لاستمرار الاتجاه. إذا استعدنا $88K بثقة، فستكون منطقة المقاومة التالية في الفراغ حتى $110K. هذا سيكون أنظف مسار للمتداولين على المدى الطويل الذين صمدوا خلال التذبذب.
2️⃣ تراجع إلى $78K → تجميع → ثم اندفاع للأعلى
إعداد أكثر صحة بصراحة. الهبوط إلى $78K سيجرف الأيدي الضعيفة، ويعيد ضبط معدلات التمويل، ويمنح المؤسسات نقطة دخول جديدة. هذا هو الاستنزاف الكلاسيكي لسوق الثيران قبل المحطة التالية.
3️⃣ نزول إلى $67K–$69K → ثم الإرسال
صفقة الألم. هذا سيقضي على الجميع الذين اشتروا التراجع الأخير، ويُفعل أقصى قدر من الخوف. لكن تاريخيًا، تحب البيتكوين زيارة مناطق دعم رئيسية قبل تسجيل قمم جديدة. نطاق $67K–$69K يتوافق مع المقاومة السابقة التي تحولت إلى دعم.
من الناحية الفنية، يبدو أن المسار 2 أو 3 هو الأكثر احتمالاً. الأسواق نادرًا ما تتحرك في خط مستقيم، وكنا نشهد ارتفاعًا قويًا دون تصحيح ذي معنى. التراجع سيكون صحيًا ويهيئ أساسًا أقوى للحركة التالية.
لكن إذا بقي الاقتصاد الكلي حارًا واستمرت تدفقات صناديق ETF في الضخ، فالمسار 1 ليس مستبعدًا. يمكن للبيتكوين أن تظل غير عقلانية لفترة أطول مما يمكنك أن تبقى فيه على قيد السيولة.
راقب $88K باعتباره المستوى المحوري. كسر والتمسك فوقه = المسار 1. الرفض = المسار 2 أو 3 اعتمادًا على سرعة الهبوط.
1️⃣ كسر $88K → اندفاع مباشر إلى $110K
سيناريو صعودي لاستمرار الاتجاه. إذا استعدنا $88K بثقة، فستكون منطقة المقاومة التالية في الفراغ حتى $110K. هذا سيكون أنظف مسار للمتداولين على المدى الطويل الذين صمدوا خلال التذبذب.
2️⃣ تراجع إلى $78K → تجميع → ثم اندفاع للأعلى
إعداد أكثر صحة بصراحة. الهبوط إلى $78K سيجرف الأيدي الضعيفة، ويعيد ضبط معدلات التمويل، ويمنح المؤسسات نقطة دخول جديدة. هذا هو الاستنزاف الكلاسيكي لسوق الثيران قبل المحطة التالية.
3️⃣ نزول إلى $67K–$69K → ثم الإرسال
صفقة الألم. هذا سيقضي على الجميع الذين اشتروا التراجع الأخير، ويُفعل أقصى قدر من الخوف. لكن تاريخيًا، تحب البيتكوين زيارة مناطق دعم رئيسية قبل تسجيل قمم جديدة. نطاق $67K–$69K يتوافق مع المقاومة السابقة التي تحولت إلى دعم.
من الناحية الفنية، يبدو أن المسار 2 أو 3 هو الأكثر احتمالاً. الأسواق نادرًا ما تتحرك في خط مستقيم، وكنا نشهد ارتفاعًا قويًا دون تصحيح ذي معنى. التراجع سيكون صحيًا ويهيئ أساسًا أقوى للحركة التالية.
لكن إذا بقي الاقتصاد الكلي حارًا واستمرت تدفقات صناديق ETF في الضخ، فالمسار 1 ليس مستبعدًا. يمكن للبيتكوين أن تظل غير عقلانية لفترة أطول مما يمكنك أن تبقى فيه على قيد السيولة.
راقب $88K باعتباره المستوى المحوري. كسر والتمسك فوقه = المسار 1. الرفض = المسار 2 أو 3 اعتمادًا على سرعة الهبوط.
19
سجّل الدخول لاستكشاف المزيد من المُحتوى
انضم إلى مُستخدمي العملات الرقمية حول العالم على Binance Square
⚡️ احصل على أحدث المعلومات المفيدة عن العملات الرقمية.
💬 موثوقة من قبل أكبر منصّة لتداول العملات الرقمية في العالم.
👍 اكتشف الرؤى الحقيقية من صنّاع المُحتوى الموثوقين.
البريد الإلكتروني / رقم الهاتف
المواضيع الرائجة
QNTRises39%
2,591 مشاهدات
258 يقومون بالنقاش
#QNTRises39%
#QNTRises39% 🚨 انفجار QNT لم ينتهي بعد!
الكل يتكلم عن +39% لكن محد يقول لك الحقيقة الكاملة 👇
أمس الساعة 3 العصر: QNT بسعر $70.51
اليوم: $103.71 🚀
السبب؟
The Clearing House (اللي تمرر 2 تريليون دولار يومياً) اختارت Quant رسمياً عشان تبني نظام الدفع الجديد لأمريكا!
يعني 25 بنك أمريكي كبير بيستخدمون شبكة Quant عشان يحولون الودائع المرقمنة لحظياً!
- Barclays
- HSBC
- NatWest
كلهم بدأوا التجارب!
حجم التداول انفجر 553% وقيمة السوقية $1.25 مليار - ولسا يقولون تصحيح؟
أنا أشوف $SOL
Mohammed _crypto sniper
·4 إعجاب
·646 مشاهدات
EthereumBreaksAbove$2700
498 مشاهدات
40 يقومون بالنقاش
BitgetBreachForgedRequestsNotStolenKeys
2,227 مشاهدات
192 يقومون بالنقاش