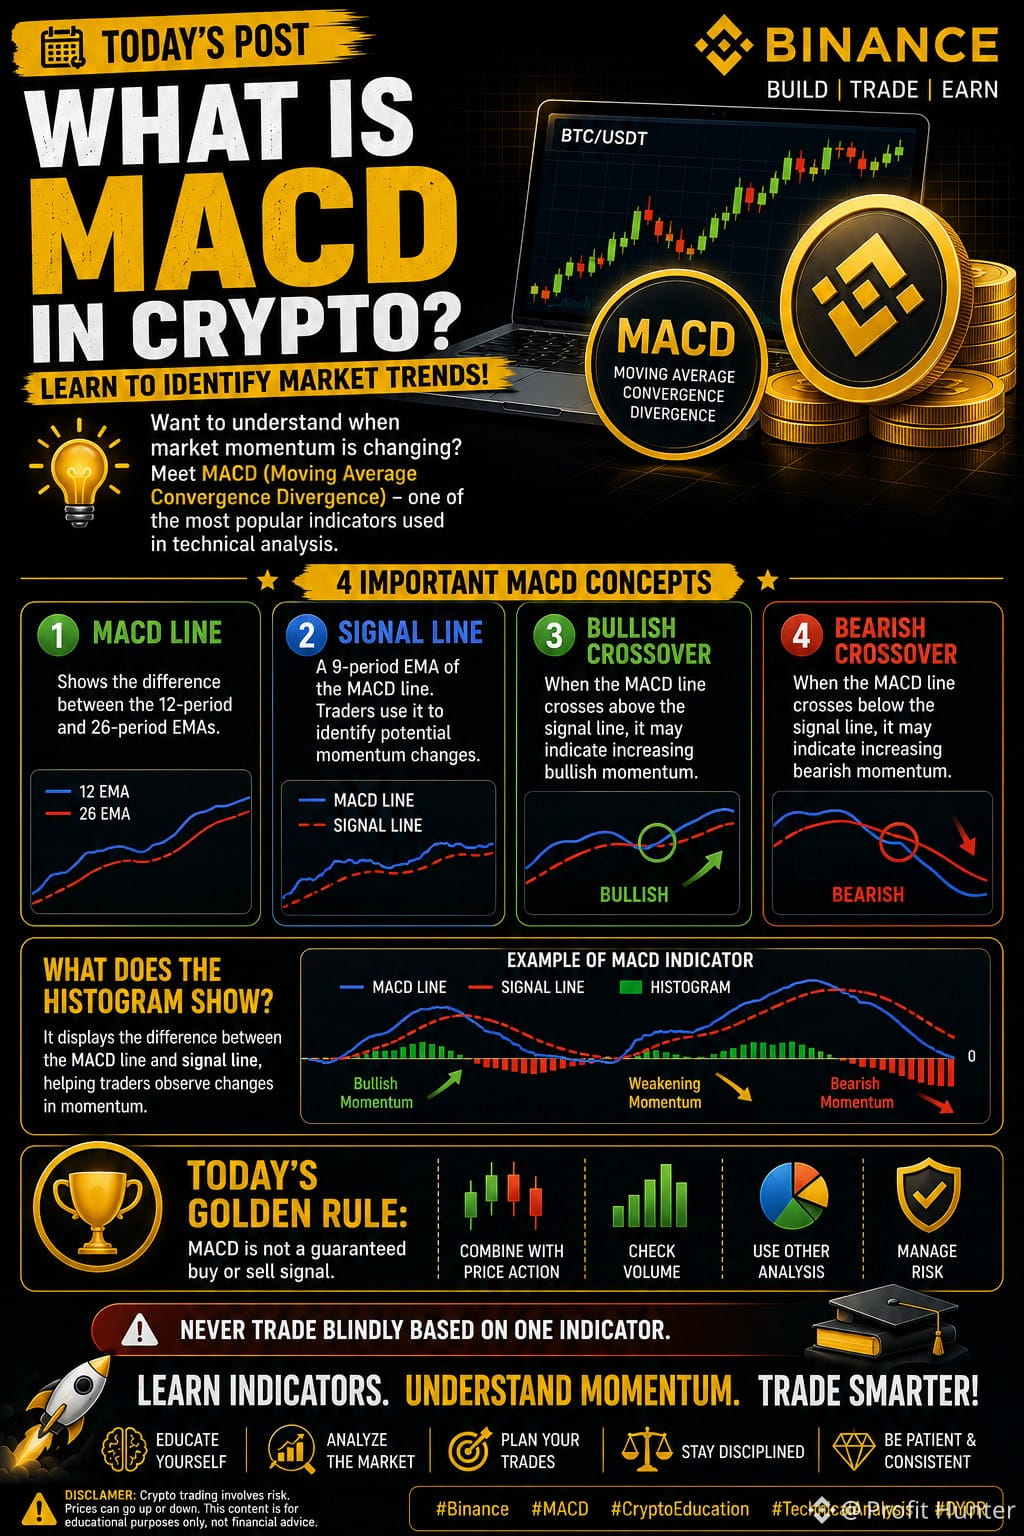
📈 WHAT IS MACD IN CRYPTO? LEARN TO IDENTIFY MARKET TRENDS!
Want to understand when market momentum is changing?
Meet MACD (Moving Average Convergence Divergence) — one of the most popular indicators used in technical analysis.
🔥 4 IMPORTANT MACD CONCEPTS:
🔹 1. MACD Line
Shows the difference between the 12-period and 26-period EMAs.
🔹 2. Signal Line
A 9-period EMA of the MACD line. Traders use it to identify potential momentum changes.
🔹 3. Bullish Crossover
When the MACD line crosses above the signal line, it may indicate increasing bullish momentum.
🔹 4. Bearish Crossover
When the MACD line crosses below the signal line, it may indicate increasing bearish momentum.
📊 WHAT DOES THE HISTOGRAM SHOW?
It displays the difference between the MACD line and signal line, helping traders observe changes in momentum.
💡 TODAY'S GOLDEN RULE:
MACD is not a guaranteed buy or sell signal. Always combine it with price action, volume, and other market analysis.
⚠️ Never trade blindly based on one indicator.
🚀 Learn Indicators. Understand Momentum. Trade Smarter!
#MACD #CryptoEducation #TechnicalAnalysise #tradingtips #learncrypto
Want to understand when market momentum is changing?
Meet MACD (Moving Average Convergence Divergence) — one of the most popular indicators used in technical analysis.
🔥 4 IMPORTANT MACD CONCEPTS:
🔹 1. MACD Line
Shows the difference between the 12-period and 26-period EMAs.
🔹 2. Signal Line
A 9-period EMA of the MACD line. Traders use it to identify potential momentum changes.
🔹 3. Bullish Crossover
When the MACD line crosses above the signal line, it may indicate increasing bullish momentum.
🔹 4. Bearish Crossover
When the MACD line crosses below the signal line, it may indicate increasing bearish momentum.
📊 WHAT DOES THE HISTOGRAM SHOW?
It displays the difference between the MACD line and signal line, helping traders observe changes in momentum.
💡 TODAY'S GOLDEN RULE:
MACD is not a guaranteed buy or sell signal. Always combine it with price action, volume, and other market analysis.
⚠️ Never trade blindly based on one indicator.
🚀 Learn Indicators. Understand Momentum. Trade Smarter!
#MACD #CryptoEducation #TechnicalAnalysise #tradingtips #learncrypto