
#BitcoinRejectedAt$81K50WeekMA
بيتكوين يصل إلى متوسطه المتحرك لـ 50 أسبوعًا بعد صعود بنسبة 29% — ماذا يحدث بعد ذلك؟
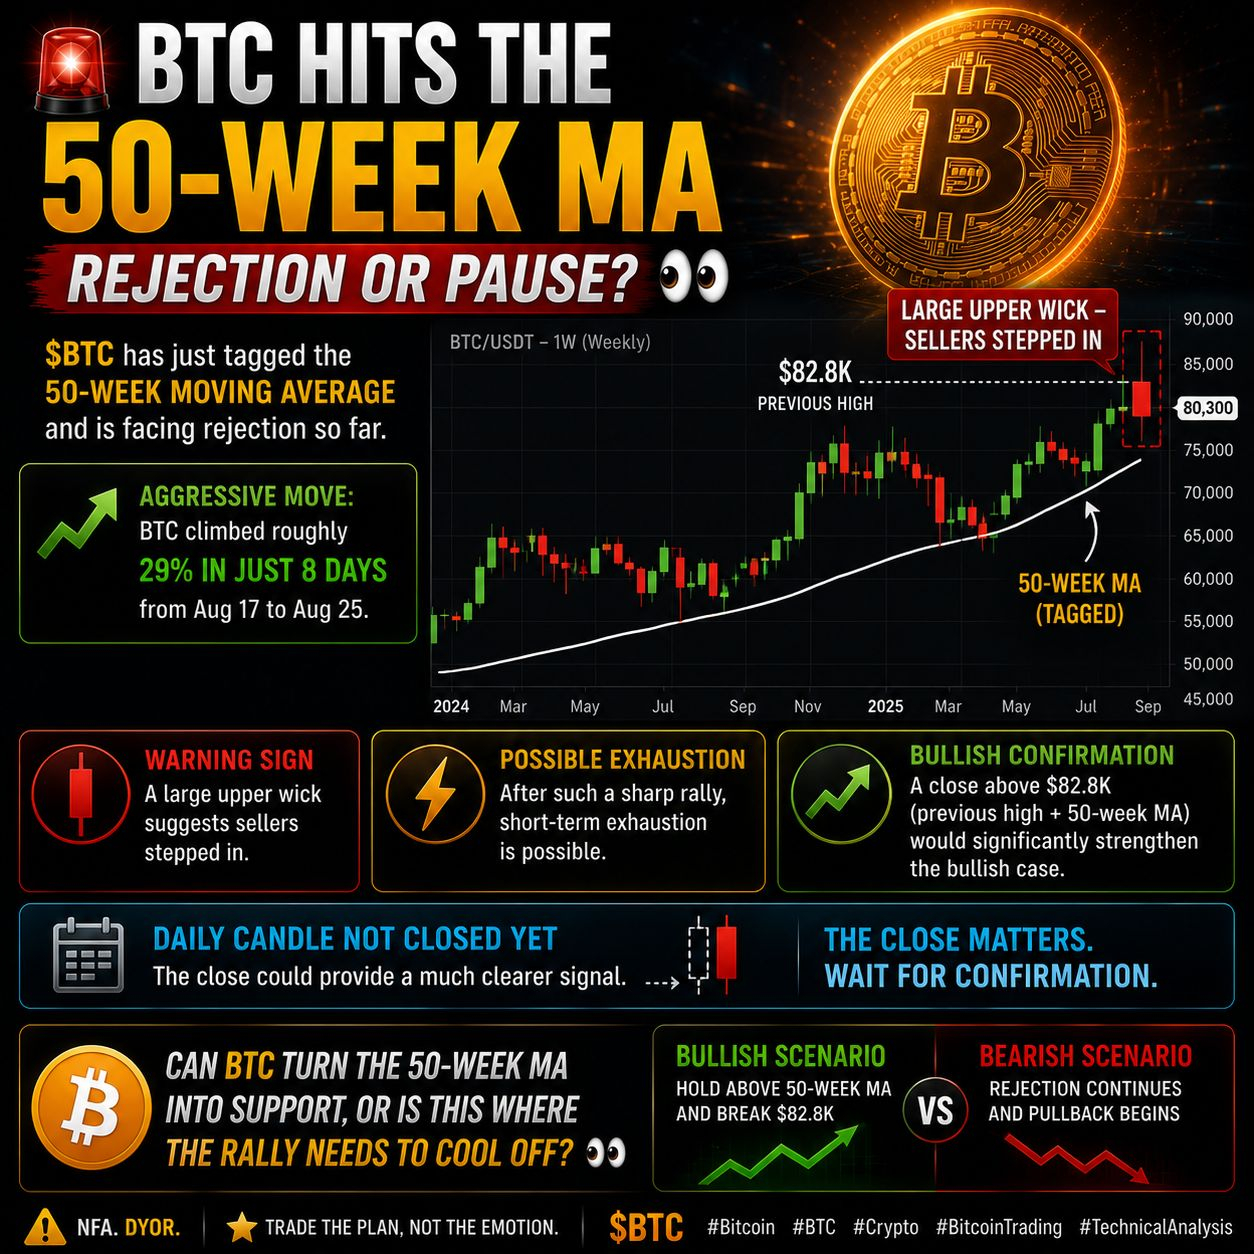
وصل البيتكوين إلى مستوى تقني مهم بعد صعود عدواني، حيث لامس $BTC متوسطه المتحرك لــ 50 أسبوعًا ويظهر علامات على الرفض حتى الآن.
كانت هذه الحركة قوية بشكل خاص، إذ ارتفع سعر البيتكوين بنحو 29% بين 17 أغسطس و25 أغسطس.
لقد أدّى هذا الارتفاع السريع الآن إلى دفع السوق لاختبار تقني مهم.
📊 إشارة تحذيرية على الرسم البياني
تشير الشمعة الأحدث إلى تشكل ذيل علوي كبير، مما يوحي بأن البائعين أصبحوا أكثر نشاطًا قرب متوسطه المتحرك لــ 50 أسبوعًا.
بعد مثل هذه الحركة الحادة في فترة قصيرة، لن يكون من المستغرب حدوث فترة تماسك أو تراجع قصير الأجل.
ومع ذلك، شمعة واحدة فقط لا تؤكد حدوث انعكاس.
🚀 مستوى 82.8 ألف دولار هو المفتاح
القمة السابقة قرب 82.8 ألف دولار أصبحت الآن مستوى مهمًا لثيران البيتكوين.
سيعزز الإغلاق الحاسم فوق كل من 82.8 ألف دولار ومتوسط 50 أسبوعًا حجة أن الاتجاه الأوسع لبيتكوين يتحسن.
حتى يحدث ذلك، يجب على المتداولين توخي الحذر من مطاردة حركة ممتدة.
👀 الإغلاق اليومي هو ما يهم
لم يتم إغلاق الشمعة اليومية الحالية بعد، ما يعني أن البنية النهائية لا تزال قد تتغير.
قد يؤدي الرفض إلى تماسك أو تراجع، بينما قد يشير الإغلاق القوي فوق مستويات المقاومة الرئيسية إلى أن المشترين مستعدون لدفع السعر للأعلى.
في الوقت الحالي، السؤال الرئيسي ليس فقط ما إذا كانت بيتكوين في اتجاه صاعد.
هل هذا الزخم الحالي مستدام بعد حركة بنسبة 29% خلال ثمانية أيام فقط.
هل يمكن لـ BTC استعادة متوسط 50 أسبوعًا والاختراق فوق 82.8 ألف دولار، أم أن السوق مهيأة لتهدئة قصيرة الأجل؟

#bitcoin #BTC #Crypto #BitcoinTrading #TechnicalAnalysis #CryptoMarket