

ChartScout
2.1k منشورات

ChartScout
إبلاغ
حظر المُستخدم
You cannot watch every chart, on every timeframe, 24/7. ChartScout can. Set up your watchers once and get instant alerts when patterns form across pairs.
5 تتابع
956 المتابعون
2.7K+ إعجاب
منشورات
الكل
مقاطع فيديو
PINNED
·
--
متعب من التحقق من مخططات العملات المشفرة واحدًا تلو الآخر؟
يساعد ChartScout المتداولين على مراقبة عدة مخططات، وتحديد فرص السوق، وتوفير وقت ثمين. شاهد الفيديو القصير لترى كيف يعمل.
#crypto #trading #ChartScout #CryptoCharts
متعب من التحقق من مخططات العملات المشفرة واحدًا تلو الآخر؟
يساعد ChartScout المتداولين على مراقبة عدة مخططات، وتحديد فرص السوق، وتوفير وقت ثمين. شاهد الفيديو القصير لترى كيف يعمل.
#crypto #trading #ChartScout #CryptoCharts
يساعد ChartScout المتداولين على مراقبة عدة مخططات، وتحديد فرص السوق، وتوفير وقت ثمين. شاهد الفيديو القصير لترى كيف يعمل.
#crypto #trading #ChartScout #CryptoCharts
1
240
·
--
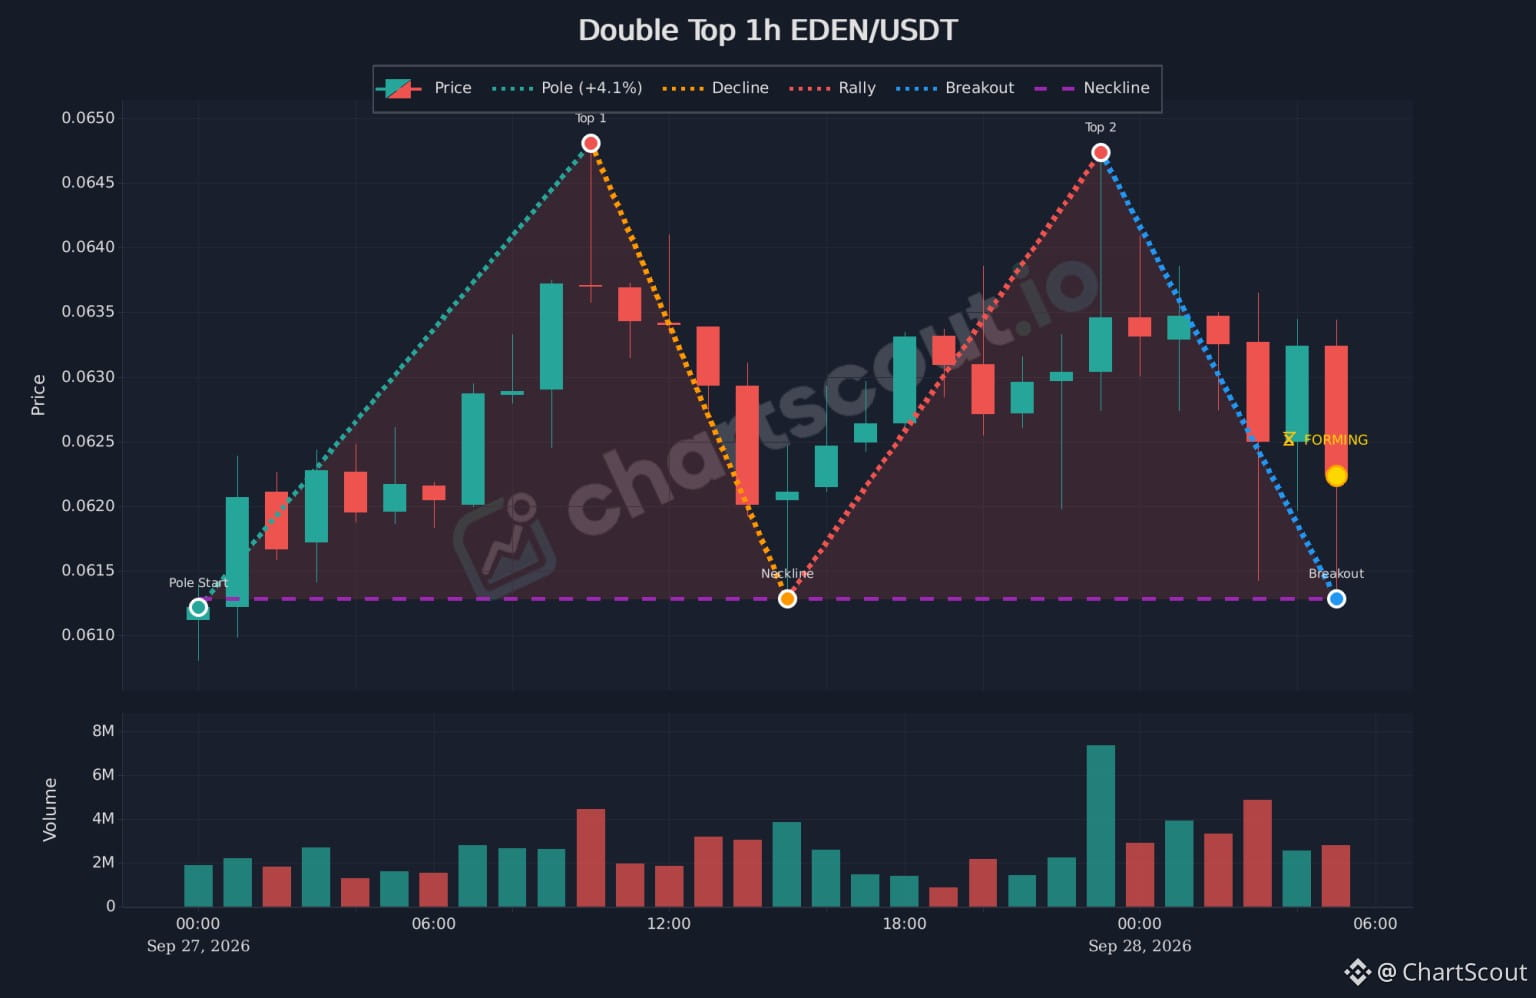
⚡ [إعداد ملف] EDEN/USDT (1h) - انعكاس القمة المزدوجة
يتكوّن إعداد Double Top عالي الاحتمالية على EDEN/USDT تم رصده بواسطة ChartScout.
[ مؤشرات هيكلية ]
• الإعداد : انعكاس القمة المزدوجة (إطار زمني 1h)
• اتساع الاندفاع : +4.1% قطب
• سقف المقاومة : 0.0647 - 0.0648 USDT (القمتان 1 و2)
• دعم خط العنق (الأرضية) : 0.06128 USDT
• السعر الحالي : 0.0622 USDT (الهبوط نشط)
[ أطروحة التنفيذ ]
لقد واجه EDEN رفضًا قويًا من البائعين مرتين بالقرب من 0.0648 قبل أن يتراجع. يتحرك السعر الآن باتجاه الأرضية الحاسمة لخط العنق عند 0.06128. راقب توسّع الحجم عند إغلاق شمعة على إطار 1h أسفل دعم خط العنق لتأكيد زخم احتمال انعكاس الاتجاه.
افحص إعدادات الخوارزميات المباشرة على ChartScout.
⚠️ راجع بنفسك (DYOR) - ليست نصيحة مالية.
#ChartScout #EDEN #BinanceSquare #cryptotrading
⚡ [إعداد ملف] EDEN/USDT (1h) - انعكاس القمة المزدوجة
يتكوّن إعداد Double Top عالي الاحتمالية على EDEN/USDT تم رصده بواسطة ChartScout.
[ مؤشرات هيكلية ]
• الإعداد : انعكاس القمة المزدوجة (إطار زمني 1h)
• اتساع الاندفاع : +4.1% قطب
• سقف المقاومة : 0.0647 - 0.0648 USDT (القمتان 1 و2)
• دعم خط العنق (الأرضية) : 0.06128 USDT
• السعر الحالي : 0.0622 USDT (الهبوط نشط)
[ أطروحة التنفيذ ]
لقد واجه EDEN رفضًا قويًا من البائعين مرتين بالقرب من 0.0648 قبل أن يتراجع. يتحرك السعر الآن باتجاه الأرضية الحاسمة لخط العنق عند 0.06128. راقب توسّع الحجم عند إغلاق شمعة على إطار 1h أسفل دعم خط العنق لتأكيد زخم احتمال انعكاس الاتجاه.
افحص إعدادات الخوارزميات المباشرة على ChartScout.
⚠️ راجع بنفسك (DYOR) - ليست نصيحة مالية.
#ChartScout #EDEN #BinanceSquare #cryptotrading
يتكوّن إعداد Double Top عالي الاحتمالية على EDEN/USDT تم رصده بواسطة ChartScout.
[ مؤشرات هيكلية ]
• الإعداد : انعكاس القمة المزدوجة (إطار زمني 1h)
• اتساع الاندفاع : +4.1% قطب
• سقف المقاومة : 0.0647 - 0.0648 USDT (القمتان 1 و2)
• دعم خط العنق (الأرضية) : 0.06128 USDT
• السعر الحالي : 0.0622 USDT (الهبوط نشط)
[ أطروحة التنفيذ ]
لقد واجه EDEN رفضًا قويًا من البائعين مرتين بالقرب من 0.0648 قبل أن يتراجع. يتحرك السعر الآن باتجاه الأرضية الحاسمة لخط العنق عند 0.06128. راقب توسّع الحجم عند إغلاق شمعة على إطار 1h أسفل دعم خط العنق لتأكيد زخم احتمال انعكاس الاتجاه.
افحص إعدادات الخوارزميات المباشرة على ChartScout.
⚠️ راجع بنفسك (DYOR) - ليست نصيحة مالية.
#ChartScout #EDEN #BinanceSquare #cryptotrading
253
·
--
🔻 ماسح القمم الثلاثية: مخططات حقيقية وإعداد التنبيه
تقدم شركة ChartScout درسًا جديدًا يشرح نمط القمة الثلاثية باستخدام مخططات سوق حقيقية.
تعلّم كيفية:
• التعرف على ثلاث محاولات فاشلة قرب مستوى المقاومة
• تحديد خط الرقبة ومستوى التأكيد
• مراجعة حركة السعر حول الانعكاس/الاختراق للأسفل
• التمييز بين الحركة المؤكدة والذيل/الفتيل المؤقت
• إعداد تنبيهات الماسح عبر الأسواق والآجال الزمنية المدعومة
إن اكتشاف نمط لا يعني نتيجة مضمونة أو توصية تداول.
#crypto #trading #TechnicalAnalysis #ChartScout
🔻 ماسح القمم الثلاثية: مخططات حقيقية وإعداد التنبيه
تقدم شركة ChartScout درسًا جديدًا يشرح نمط القمة الثلاثية باستخدام مخططات سوق حقيقية.
تعلّم كيفية:
• التعرف على ثلاث محاولات فاشلة قرب مستوى المقاومة
• تحديد خط الرقبة ومستوى التأكيد
• مراجعة حركة السعر حول الانعكاس/الاختراق للأسفل
• التمييز بين الحركة المؤكدة والذيل/الفتيل المؤقت
• إعداد تنبيهات الماسح عبر الأسواق والآجال الزمنية المدعومة
إن اكتشاف نمط لا يعني نتيجة مضمونة أو توصية تداول.
#crypto #trading #TechnicalAnalysis #ChartScout
تقدم شركة ChartScout درسًا جديدًا يشرح نمط القمة الثلاثية باستخدام مخططات سوق حقيقية.
تعلّم كيفية:
• التعرف على ثلاث محاولات فاشلة قرب مستوى المقاومة
• تحديد خط الرقبة ومستوى التأكيد
• مراجعة حركة السعر حول الانعكاس/الاختراق للأسفل
• التمييز بين الحركة المؤكدة والذيل/الفتيل المؤقت
• إعداد تنبيهات الماسح عبر الأسواق والآجال الزمنية المدعومة
إن اكتشاف نمط لا يعني نتيجة مضمونة أو توصية تداول.
#crypto #trading #TechnicalAnalysis #ChartScout
1
802
·
--
📊 دع المخططات تأتي إليك.
السوق لا يتوقف عن الحركة أبدًا، لكنك لا تحتاج إلى مراقبة كل مخطط يدويًا. يساعدك ChartScout على مسح الأسواق والفترات الزمنية المدعومة بحثًا عن الأنماط الفنية ومراجعة الإعدادات المحتملة عندما تظهر.
اكتشاف الأنماط هو أداة تحليلية، وليس ضمانًا أو توصية تداول.
#crypto #trading #TechnicalAnalysiss #ChartScout
📊 دع المخططات تأتي إليك.
السوق لا يتوقف عن الحركة أبدًا، لكنك لا تحتاج إلى مراقبة كل مخطط يدويًا. يساعدك ChartScout على مسح الأسواق والفترات الزمنية المدعومة بحثًا عن الأنماط الفنية ومراجعة الإعدادات المحتملة عندما تظهر.
اكتشاف الأنماط هو أداة تحليلية، وليس ضمانًا أو توصية تداول.
#crypto #trading #TechnicalAnalysiss #ChartScout
السوق لا يتوقف عن الحركة أبدًا، لكنك لا تحتاج إلى مراقبة كل مخطط يدويًا. يساعدك ChartScout على مسح الأسواق والفترات الزمنية المدعومة بحثًا عن الأنماط الفنية ومراجعة الإعدادات المحتملة عندما تظهر.
اكتشاف الأنماط هو أداة تحليلية، وليس ضمانًا أو توصية تداول.
#crypto #trading #TechnicalAnalysiss #ChartScout
147
·
--
━━━━━━━━━━━━━━━━━━━━━━━━━━━━
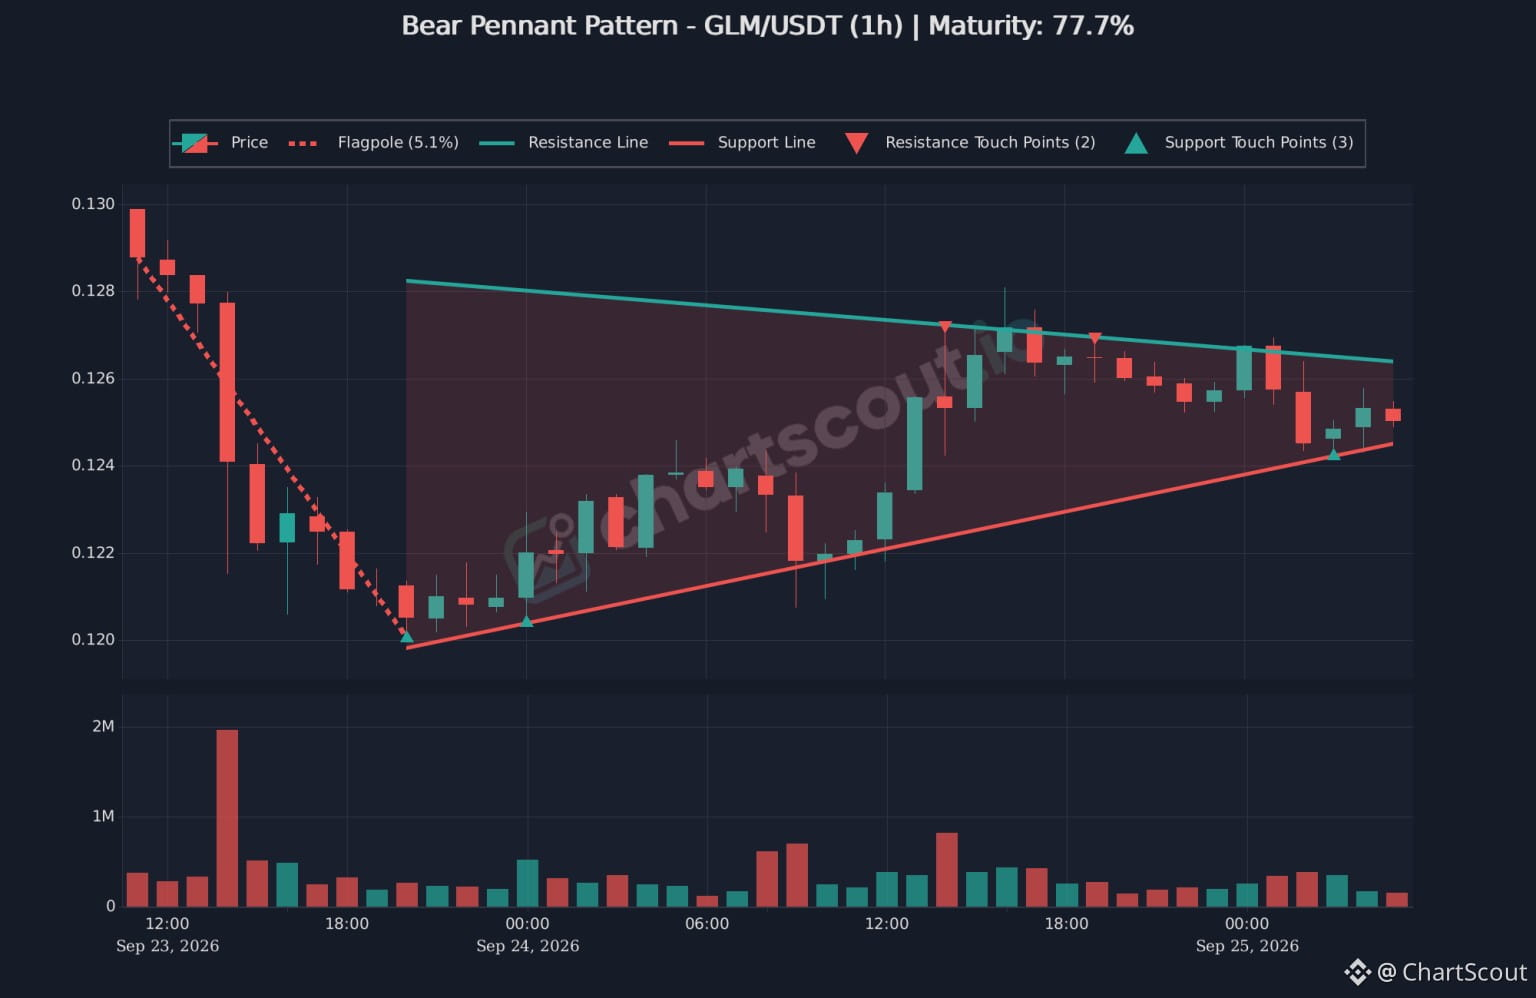
⚡ CHARTSCOUT رادار | GLM/USDT (1h)
━━━━━━━━━━━━━━━━━━━━━━━━━━━━
تم رصدِ تجمّع Bear Pennant (مستمر) يشتدّ عند 77.7% من النضج على جوْلم ($GLM) بواسطة ChartScout.
[ مصفوفة بنيوية ]
• الإعداد : Bear Pennant (إعداد استمرارية)
• هبوط الاندفاع : -5.1% Flagpole
• مقاومة علوية : $0.1264 USDT (لمستين)
• دعم صاعد : $0.1245 USDT (3 لمسات)
• الشريط الحالي : $0.1252 USDT
[ إطار الاختراق ]
بعد هبوط أولي بنسبة -5.1% إلى $0.1200، استقرت حركة السعر داخل خطوط اتجاه متقاربة. تمّ تثبيت الدعم الأدنى 3 مرات. راقب اتساع الحجم عند إغلاق شمعة 1h أسفل $0.1245 لتأكيد احتمال استمرار هبوطي.
اكتشف فحوصات أنماط آلية للتقنيات على ChartScout.
⚠️ DYOR - ليست نصيحة مالية.
#ChartScout #GLM #cryptotrading #GLM/USDT
━━━━━━━━━━━━━━━━━━━━━━━━━━━━
⚡ CHARTSCOUT رادار | GLM/USDT (1h)
━━━━━━━━━━━━━━━━━━━━━━━━━━━━
تم رصدِ تجمّع Bear Pennant (مستمر) يشتدّ عند 77.7% من النضج على جوْلم ($GLM) بواسطة ChartScout.
[ مصفوفة بنيوية ]
• الإعداد : Bear Pennant (إعداد استمرارية)
• هبوط الاندفاع : -5.1% Flagpole
• مقاومة علوية : $0.1264 USDT (لمستين)
• دعم صاعد : $0.1245 USDT (3 لمسات)
• الشريط الحالي : $0.1252 USDT
[ إطار الاختراق ]
بعد هبوط أولي بنسبة -5.1% إلى $0.1200، استقرت حركة السعر داخل خطوط اتجاه متقاربة. تمّ تثبيت الدعم الأدنى 3 مرات. راقب اتساع الحجم عند إغلاق شمعة 1h أسفل $0.1245 لتأكيد احتمال استمرار هبوطي.
اكتشف فحوصات أنماط آلية للتقنيات على ChartScout.
⚠️ DYOR - ليست نصيحة مالية.
#ChartScout #GLM #cryptotrading #GLM/USDT
⚡ CHARTSCOUT رادار | GLM/USDT (1h)
━━━━━━━━━━━━━━━━━━━━━━━━━━━━
تم رصدِ تجمّع Bear Pennant (مستمر) يشتدّ عند 77.7% من النضج على جوْلم ($GLM) بواسطة ChartScout.
[ مصفوفة بنيوية ]
• الإعداد : Bear Pennant (إعداد استمرارية)
• هبوط الاندفاع : -5.1% Flagpole
• مقاومة علوية : $0.1264 USDT (لمستين)
• دعم صاعد : $0.1245 USDT (3 لمسات)
• الشريط الحالي : $0.1252 USDT
[ إطار الاختراق ]
بعد هبوط أولي بنسبة -5.1% إلى $0.1200، استقرت حركة السعر داخل خطوط اتجاه متقاربة. تمّ تثبيت الدعم الأدنى 3 مرات. راقب اتساع الحجم عند إغلاق شمعة 1h أسفل $0.1245 لتأكيد احتمال استمرار هبوطي.
اكتشف فحوصات أنماط آلية للتقنيات على ChartScout.
⚠️ DYOR - ليست نصيحة مالية.
#ChartScout #GLM #cryptotrading #GLM/USDT
150
·
--
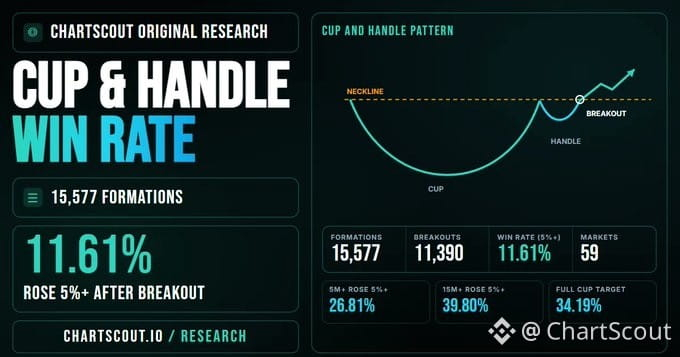
هل عمليات كسر النمط «كوب ومقبض» حقًا تعمل في العملات الرقمية؟
حللنا 15,577 تشكيلاً عبر 59 سوقًا على باينانس لقياس ما حدث بعد الاختراق، وليس ما تقوله الكتب المدرسية عن المفترض أن يحدث.
تختلف النتائج بشكل حاد حسب الإطار الزمني.
اقرأ الدراسة الكاملة والمنهجية والنتائج والقيود:
https://chartscout.io/cup-and-handle-win-rate-crypto-study
#cryptotrading #TechnicalAnalysis #chartpatterns
هل عمليات كسر النمط «كوب ومقبض» حقًا تعمل في العملات الرقمية؟
حللنا 15,577 تشكيلاً عبر 59 سوقًا على باينانس لقياس ما حدث بعد الاختراق، وليس ما تقوله الكتب المدرسية عن المفترض أن يحدث.
تختلف النتائج بشكل حاد حسب الإطار الزمني.
اقرأ الدراسة الكاملة والمنهجية والنتائج والقيود:
https://chartscout.io/cup-and-handle-win-rate-crypto-study
#cryptotrading #TechnicalAnalysis #chartpatterns
حللنا 15,577 تشكيلاً عبر 59 سوقًا على باينانس لقياس ما حدث بعد الاختراق، وليس ما تقوله الكتب المدرسية عن المفترض أن يحدث.
تختلف النتائج بشكل حاد حسب الإطار الزمني.
اقرأ الدراسة الكاملة والمنهجية والنتائج والقيود:
https://chartscout.io/cup-and-handle-win-rate-crypto-study
#cryptotrading #TechnicalAnalysis #chartpatterns
1
2
8.7k
·
--
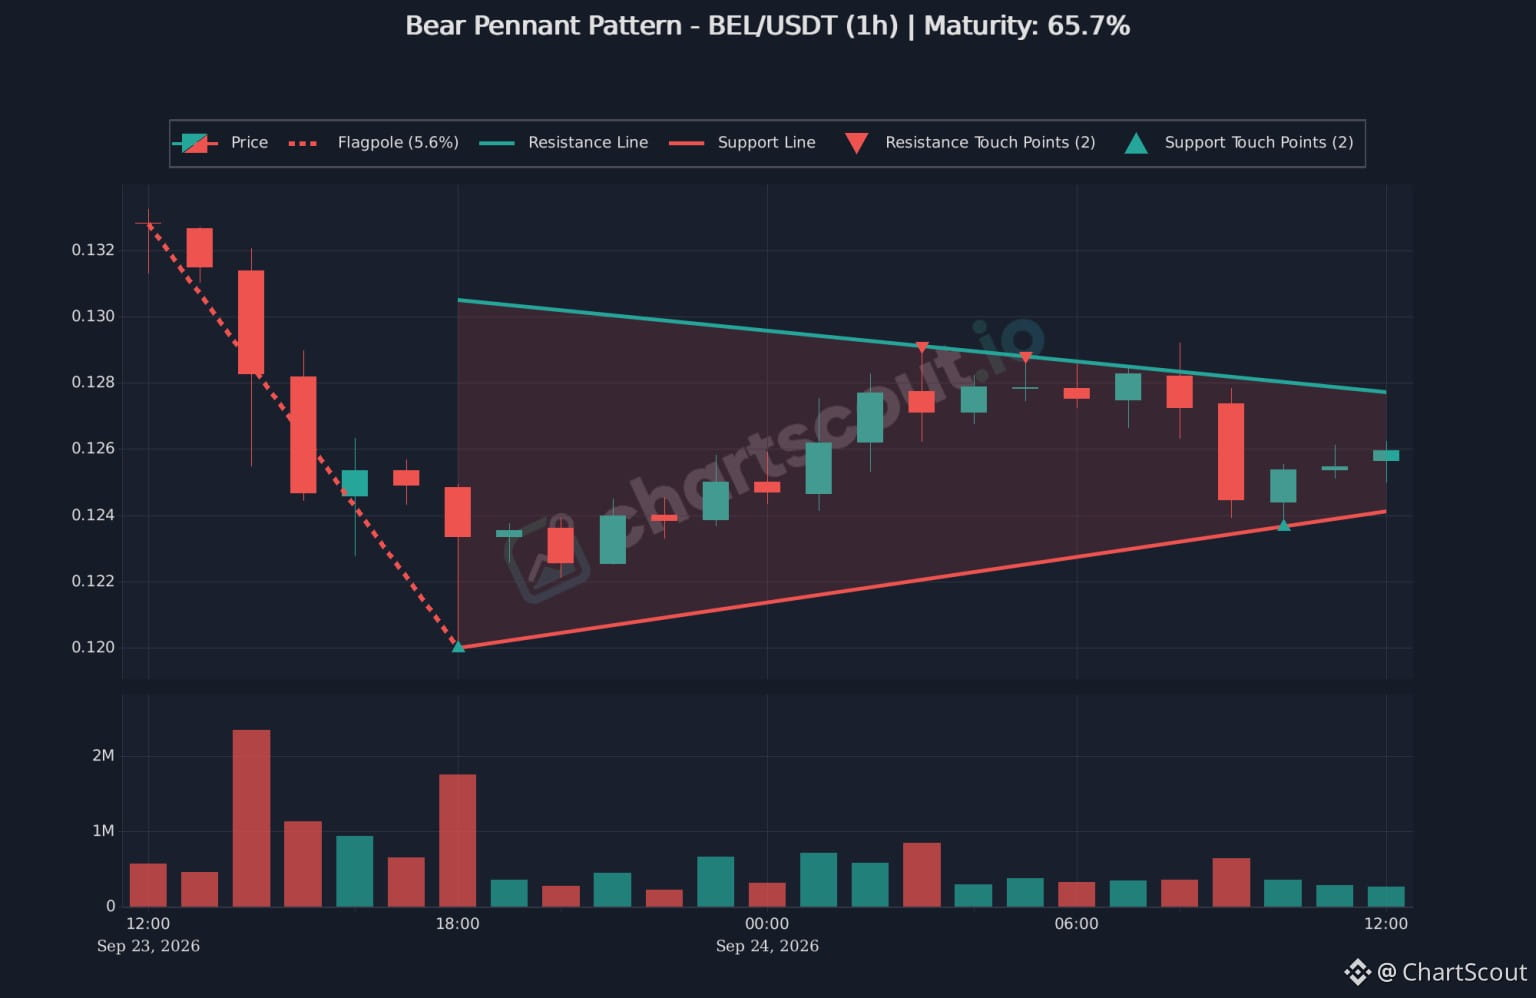
⚡ CHARTSCOUT RADAR | BEL/USDT (1h)
توجد عملية تجميع على شكل Bear Pennant (راية هابطة) نشطة على بروتوكول Bella Protocol ($BEL) بنسبة نضج 65.7% تم رصدها بواسطة ChartScout.
[ مصفوفة هيكلية ]
• الإعداد : Bear Pennant (إعداد استمراري)
• تراجع الاندفاع : -5.6% Flagpole
• مقاومة علوية : $0.1278 USDT (لمستين)
• دعم صاعد : $0.1240 USDT (لمستين)
• الشريط الحالي : $0.1258 USDT
[ إطار الاختراق ]
بعد هبوط بنسبة -5.6% إلى $0.1200، تم توطيد حركة السعر داخل خطوط اتجاه متقاربة. راقب زيادة الحجم عند إغلاق شمعة لمدة 1h أسفل دعم $0.1240 لتأكيد احتمال استمرار هبوطي.
اكتشف فحوصات أنماط تقنية آلية على ChartScout.
⚠️ DYOR - ليست نصيحة مالية.
#ChartScout #bel #BinanceSquare #cryptotrading
⚡ CHARTSCOUT RADAR | BEL/USDT (1h)
توجد عملية تجميع على شكل Bear Pennant (راية هابطة) نشطة على بروتوكول Bella Protocol ($BEL) بنسبة نضج 65.7% تم رصدها بواسطة ChartScout.
[ مصفوفة هيكلية ]
• الإعداد : Bear Pennant (إعداد استمراري)
• تراجع الاندفاع : -5.6% Flagpole
• مقاومة علوية : $0.1278 USDT (لمستين)
• دعم صاعد : $0.1240 USDT (لمستين)
• الشريط الحالي : $0.1258 USDT
[ إطار الاختراق ]
بعد هبوط بنسبة -5.6% إلى $0.1200، تم توطيد حركة السعر داخل خطوط اتجاه متقاربة. راقب زيادة الحجم عند إغلاق شمعة لمدة 1h أسفل دعم $0.1240 لتأكيد احتمال استمرار هبوطي.
اكتشف فحوصات أنماط تقنية آلية على ChartScout.
⚠️ DYOR - ليست نصيحة مالية.
#ChartScout #bel #BinanceSquare #cryptotrading
توجد عملية تجميع على شكل Bear Pennant (راية هابطة) نشطة على بروتوكول Bella Protocol ($BEL) بنسبة نضج 65.7% تم رصدها بواسطة ChartScout.
[ مصفوفة هيكلية ]
• الإعداد : Bear Pennant (إعداد استمراري)
• تراجع الاندفاع : -5.6% Flagpole
• مقاومة علوية : $0.1278 USDT (لمستين)
• دعم صاعد : $0.1240 USDT (لمستين)
• الشريط الحالي : $0.1258 USDT
[ إطار الاختراق ]
بعد هبوط بنسبة -5.6% إلى $0.1200، تم توطيد حركة السعر داخل خطوط اتجاه متقاربة. راقب زيادة الحجم عند إغلاق شمعة لمدة 1h أسفل دعم $0.1240 لتأكيد احتمال استمرار هبوطي.
اكتشف فحوصات أنماط تقنية آلية على ChartScout.
⚠️ DYOR - ليست نصيحة مالية.
#ChartScout #bel #BinanceSquare #cryptotrading
468
·
--
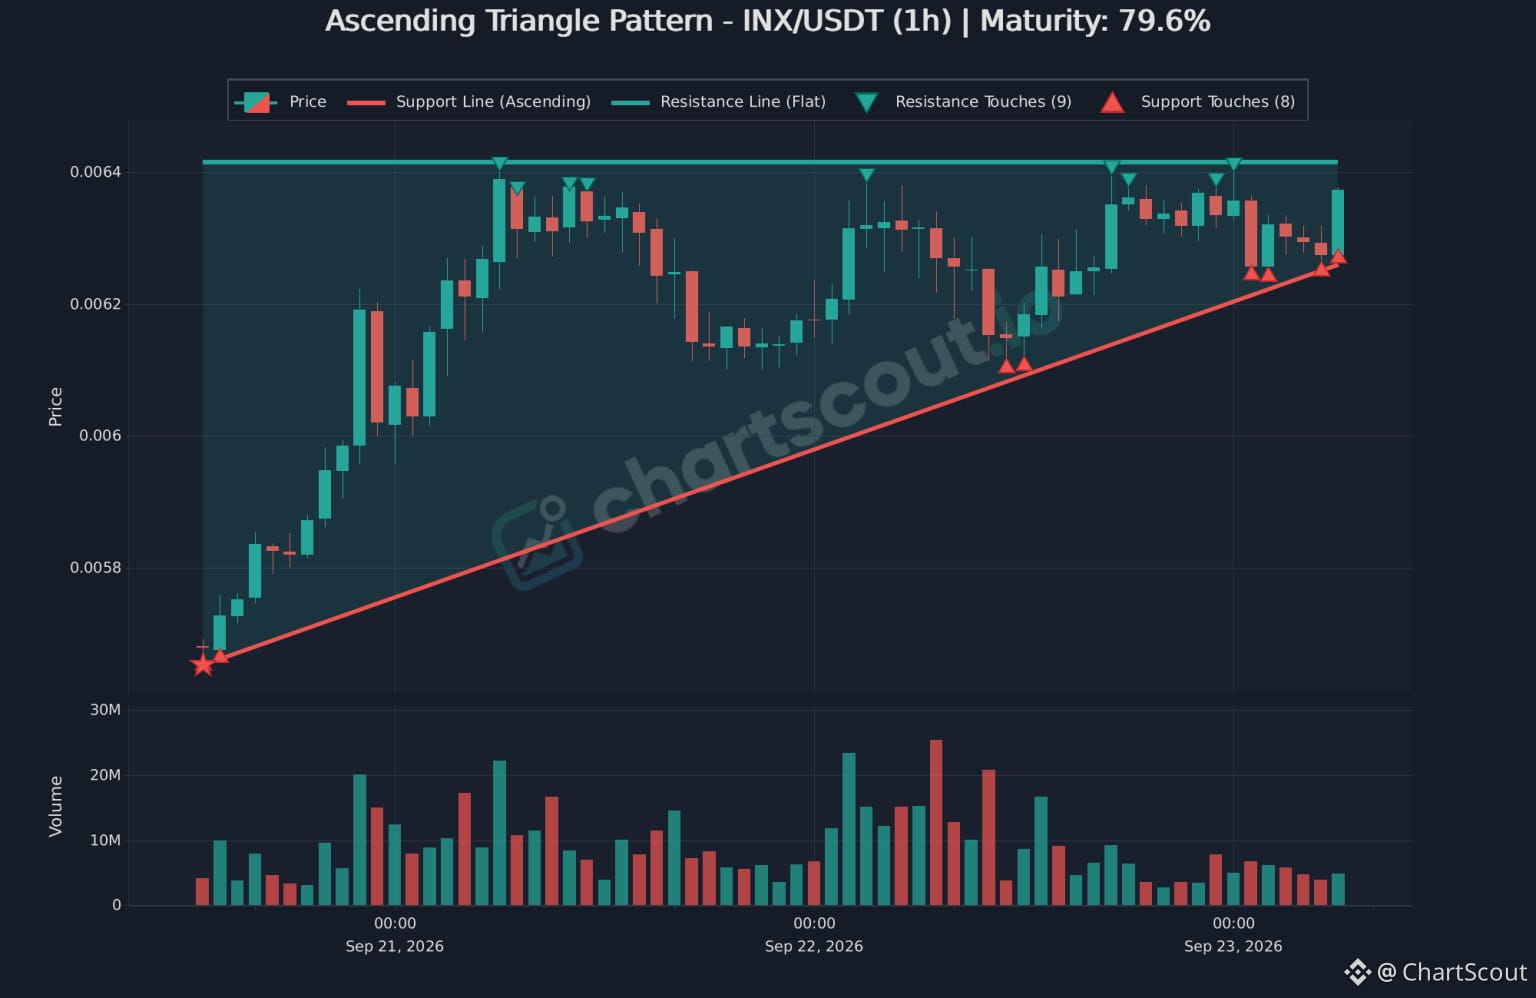
⚡ رادار CHARTSCOUT | INX/USDT (1h)
مثلث صاعد يضغط على مقاومة عند 79.6% من نضجه في INX/USDT تم رصده بواسطة ChartScout.
[ المصفوفة الهيكلية ]
• الإعداد : مثلث صاعد (تحيز صاعد)
• سقف مقاومة مسطّح : 0.00641 USDT (9 إعادة اختبارات)
• قاعدة دعم صاعدة : 0.00625 USDT (8 إعادة اختبارات)
• الشريط الحالي : 0.00637 USDT (انضغاط)
[ إطار الاختراق ]
قام المشترون بتكوين 8 قيعان أعلى متتالية أثناء اختبار سقف 0.00641 المرة 9 مرات. راقب اتساع الحجم عند إغلاق شمعة على إطار 1h فوق 0.00641 لتأكيد استمرار محتمل للاختراق.
اكتشف عمليات فحص تلقائي للأنماط الفنية على ChartScout.
⚠️ راجع بنفسك (DYOR) — ليست نصيحة مالية.
#ChartScout #INX #BinanceSquare #cryptotrading
⚡ رادار CHARTSCOUT | INX/USDT (1h)
مثلث صاعد يضغط على مقاومة عند 79.6% من نضجه في INX/USDT تم رصده بواسطة ChartScout.
[ المصفوفة الهيكلية ]
• الإعداد : مثلث صاعد (تحيز صاعد)
• سقف مقاومة مسطّح : 0.00641 USDT (9 إعادة اختبارات)
• قاعدة دعم صاعدة : 0.00625 USDT (8 إعادة اختبارات)
• الشريط الحالي : 0.00637 USDT (انضغاط)
[ إطار الاختراق ]
قام المشترون بتكوين 8 قيعان أعلى متتالية أثناء اختبار سقف 0.00641 المرة 9 مرات. راقب اتساع الحجم عند إغلاق شمعة على إطار 1h فوق 0.00641 لتأكيد استمرار محتمل للاختراق.
اكتشف عمليات فحص تلقائي للأنماط الفنية على ChartScout.
⚠️ راجع بنفسك (DYOR) — ليست نصيحة مالية.
#ChartScout #INX #BinanceSquare #cryptotrading
مثلث صاعد يضغط على مقاومة عند 79.6% من نضجه في INX/USDT تم رصده بواسطة ChartScout.
[ المصفوفة الهيكلية ]
• الإعداد : مثلث صاعد (تحيز صاعد)
• سقف مقاومة مسطّح : 0.00641 USDT (9 إعادة اختبارات)
• قاعدة دعم صاعدة : 0.00625 USDT (8 إعادة اختبارات)
• الشريط الحالي : 0.00637 USDT (انضغاط)
[ إطار الاختراق ]
قام المشترون بتكوين 8 قيعان أعلى متتالية أثناء اختبار سقف 0.00641 المرة 9 مرات. راقب اتساع الحجم عند إغلاق شمعة على إطار 1h فوق 0.00641 لتأكيد استمرار محتمل للاختراق.
اكتشف عمليات فحص تلقائي للأنماط الفنية على ChartScout.
⚠️ راجع بنفسك (DYOR) — ليست نصيحة مالية.
#ChartScout #INX #BinanceSquare #cryptotrading
298
·
--
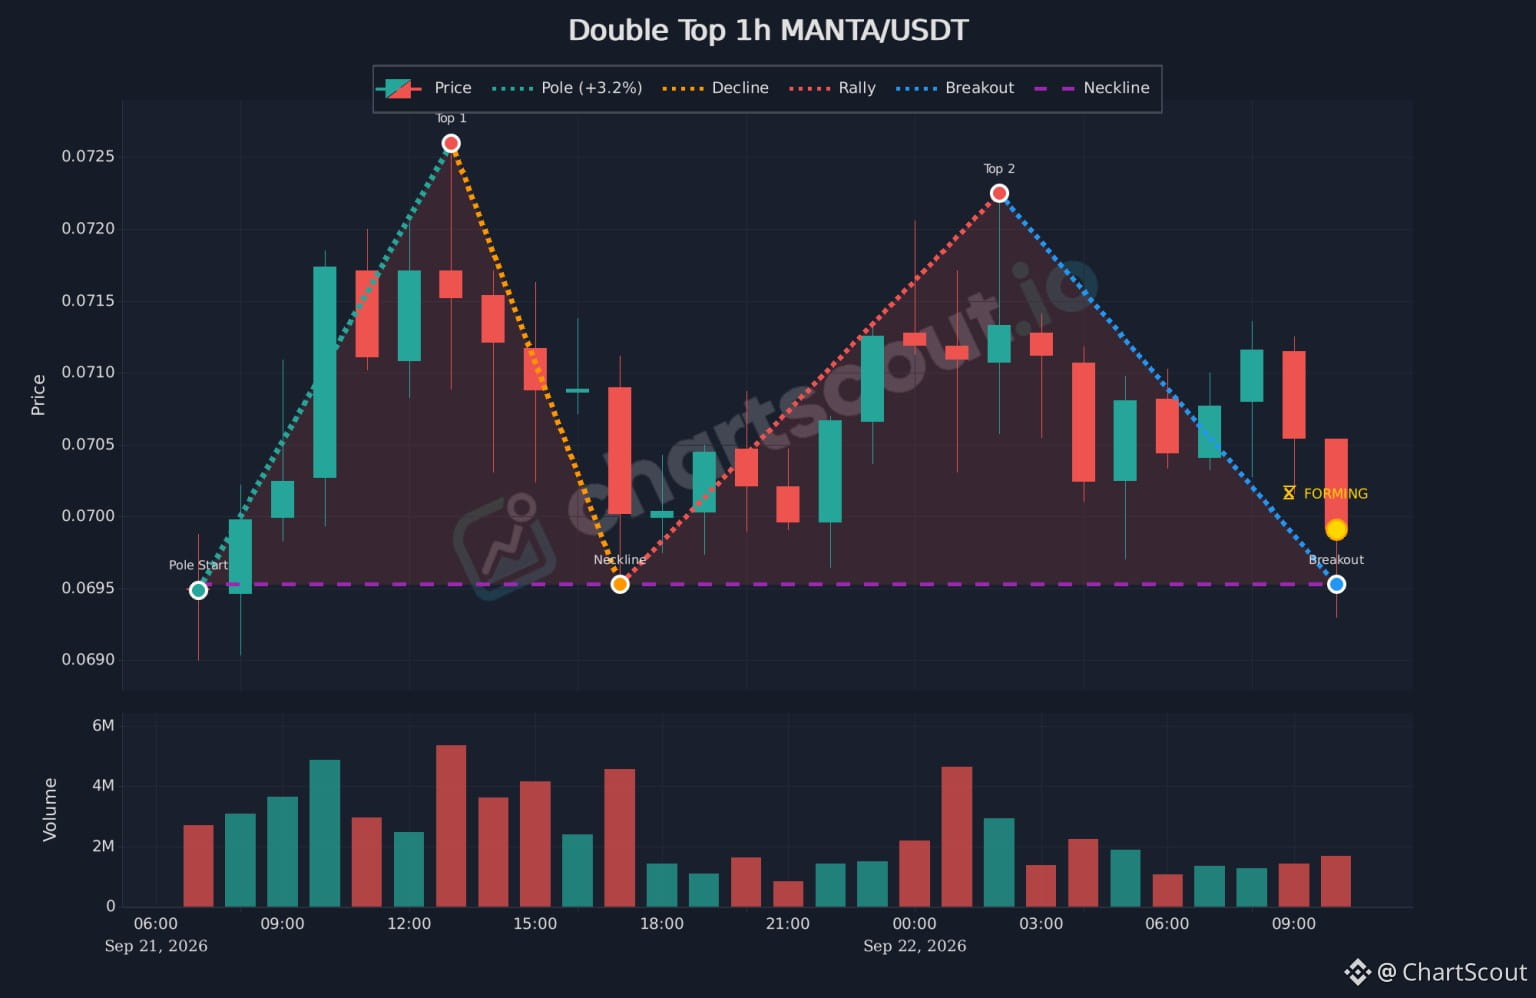
CHARTSCOUT ALPHA FEED // MANTA/USDT (1h)
يتم حاليًا تكوين تفصيل نمط القمة المزدوجة (Double Top) لمدة 1 ساعة على MANTA/USDT بواسطة ChartScout.
[ إحصائيات النمط ]
• الأصل : MANTA/USDT (1h)
• الإعداد : انعكاس القمة المزدوجة
• اندفاع/ارتفاع (Impulse Rally) : +3.2% (Pole)
• منطقة المقاومة : $0.0722 - $0.0726 USDT (القمتان 1 و2)
• دعم خط العنق (Neckline Support) : $0.0695 USDT
• الإجراء الحالي : تكوّن الاختراق الهبوطي (Breakdown Forming) ($0.0700 USDT)
[ الخطة ]
واجهت MANTA مقاومة قوية مرتين بالقرب من $0.0725 قبل أن تنعكس للأسفل. تتحرك الآن حركة السعر باتجاه أرضية خط العنق عند $0.0695. راقب إغلاق شمعة مؤكدة لمدة 1 ساعة تحت مستوى الدعم لتقييم المزيد من الزخم الهبوطي.
⚠️ راجع بنفسك (DYOR) - ليس نصيحة مالية.
#ChartScout #MANTA #DoubleTop #chartpattern
CHARTSCOUT ALPHA FEED // MANTA/USDT (1h)
يتم حاليًا تكوين تفصيل نمط القمة المزدوجة (Double Top) لمدة 1 ساعة على MANTA/USDT بواسطة ChartScout.
[ إحصائيات النمط ]
• الأصل : MANTA/USDT (1h)
• الإعداد : انعكاس القمة المزدوجة
• اندفاع/ارتفاع (Impulse Rally) : +3.2% (Pole)
• منطقة المقاومة : $0.0722 - $0.0726 USDT (القمتان 1 و2)
• دعم خط العنق (Neckline Support) : $0.0695 USDT
• الإجراء الحالي : تكوّن الاختراق الهبوطي (Breakdown Forming) ($0.0700 USDT)
[ الخطة ]
واجهت MANTA مقاومة قوية مرتين بالقرب من $0.0725 قبل أن تنعكس للأسفل. تتحرك الآن حركة السعر باتجاه أرضية خط العنق عند $0.0695. راقب إغلاق شمعة مؤكدة لمدة 1 ساعة تحت مستوى الدعم لتقييم المزيد من الزخم الهبوطي.
⚠️ راجع بنفسك (DYOR) - ليس نصيحة مالية.
#ChartScout #MANTA #DoubleTop #chartpattern
يتم حاليًا تكوين تفصيل نمط القمة المزدوجة (Double Top) لمدة 1 ساعة على MANTA/USDT بواسطة ChartScout.
[ إحصائيات النمط ]
• الأصل : MANTA/USDT (1h)
• الإعداد : انعكاس القمة المزدوجة
• اندفاع/ارتفاع (Impulse Rally) : +3.2% (Pole)
• منطقة المقاومة : $0.0722 - $0.0726 USDT (القمتان 1 و2)
• دعم خط العنق (Neckline Support) : $0.0695 USDT
• الإجراء الحالي : تكوّن الاختراق الهبوطي (Breakdown Forming) ($0.0700 USDT)
[ الخطة ]
واجهت MANTA مقاومة قوية مرتين بالقرب من $0.0725 قبل أن تنعكس للأسفل. تتحرك الآن حركة السعر باتجاه أرضية خط العنق عند $0.0695. راقب إغلاق شمعة مؤكدة لمدة 1 ساعة تحت مستوى الدعم لتقييم المزيد من الزخم الهبوطي.
⚠️ راجع بنفسك (DYOR) - ليس نصيحة مالية.
#ChartScout #MANTA #DoubleTop #chartpattern
358
·
--
🔁 فيديو جديد من ChartScout: ماسح الكوب والمقبض العكسي (Inverse Cup and Handle) — الرسوم البيانية الحقيقية وإعداد التنبيهات
تعرّف على كيفية تحديد الكوب والمقبض العكسي، راجع سياق السعر والحجم، وأكّد الاختراق، ثم اضبط تنبيهات لاكتشافات جديدة.
جرّب ChartScout: https://chartscout.io
محتوى تعليمي فقط. قد تفشل الأنماط والاختراقات.
#crypto #TechnicalAnalysis #chartpattern #InverseCupAndHandle
🔁 فيديو جديد من ChartScout: ماسح الكوب والمقبض العكسي (Inverse Cup and Handle) — الرسوم البيانية الحقيقية وإعداد التنبيهات
تعرّف على كيفية تحديد الكوب والمقبض العكسي، راجع سياق السعر والحجم، وأكّد الاختراق، ثم اضبط تنبيهات لاكتشافات جديدة.
جرّب ChartScout: https://chartscout.io
محتوى تعليمي فقط. قد تفشل الأنماط والاختراقات.
#crypto #TechnicalAnalysis #chartpattern #InverseCupAndHandle
تعرّف على كيفية تحديد الكوب والمقبض العكسي، راجع سياق السعر والحجم، وأكّد الاختراق، ثم اضبط تنبيهات لاكتشافات جديدة.
جرّب ChartScout: https://chartscout.io
محتوى تعليمي فقط. قد تفشل الأنماط والاختراقات.
#crypto #TechnicalAnalysis #chartpattern #InverseCupAndHandle
2
162
·
--
📊 ماسح نمط الكوب والهاـندل: مخططات حقيقية وإعداد التنبيهات
تشرح تعليميّة ChartScout الجديدة كيفية دراسة إعدادات الكوب والهاـندل باستخدام بيانات سوق حقيقية.
يتناول الشرح:
• تحديد بنية الكوب والهاـندل
• تحديد مستوى الاختراق ومنطقة الإبطال
• مراجعة مخططات السعر وحجم التداول
• التمييز بين الاختراق الفعلي وأثر الفتيل المؤقت
• إعداد تنبيهات لاكتشافات مستقبلية
عمليات الرصد التاريخية هي أمثلة تعليمية فقط. لا يُعدّ النمط اختراقًا مؤكدًا أو توصية تداول. قد تفشل الإعدادات.
📊 ماسح نمط الكوب والهاـندل: مخططات حقيقية وإعداد التنبيهات
تشرح تعليميّة ChartScout الجديدة كيفية دراسة إعدادات الكوب والهاـندل باستخدام بيانات سوق حقيقية.
يتناول الشرح:
• تحديد بنية الكوب والهاـندل
• تحديد مستوى الاختراق ومنطقة الإبطال
• مراجعة مخططات السعر وحجم التداول
• التمييز بين الاختراق الفعلي وأثر الفتيل المؤقت
• إعداد تنبيهات لاكتشافات مستقبلية
عمليات الرصد التاريخية هي أمثلة تعليمية فقط. لا يُعدّ النمط اختراقًا مؤكدًا أو توصية تداول. قد تفشل الإعدادات.
تشرح تعليميّة ChartScout الجديدة كيفية دراسة إعدادات الكوب والهاـندل باستخدام بيانات سوق حقيقية.
يتناول الشرح:
• تحديد بنية الكوب والهاـندل
• تحديد مستوى الاختراق ومنطقة الإبطال
• مراجعة مخططات السعر وحجم التداول
• التمييز بين الاختراق الفعلي وأثر الفتيل المؤقت
• إعداد تنبيهات لاكتشافات مستقبلية
عمليات الرصد التاريخية هي أمثلة تعليمية فقط. لا يُعدّ النمط اختراقًا مؤكدًا أو توصية تداول. قد تفشل الإعدادات.
2
280
·
--
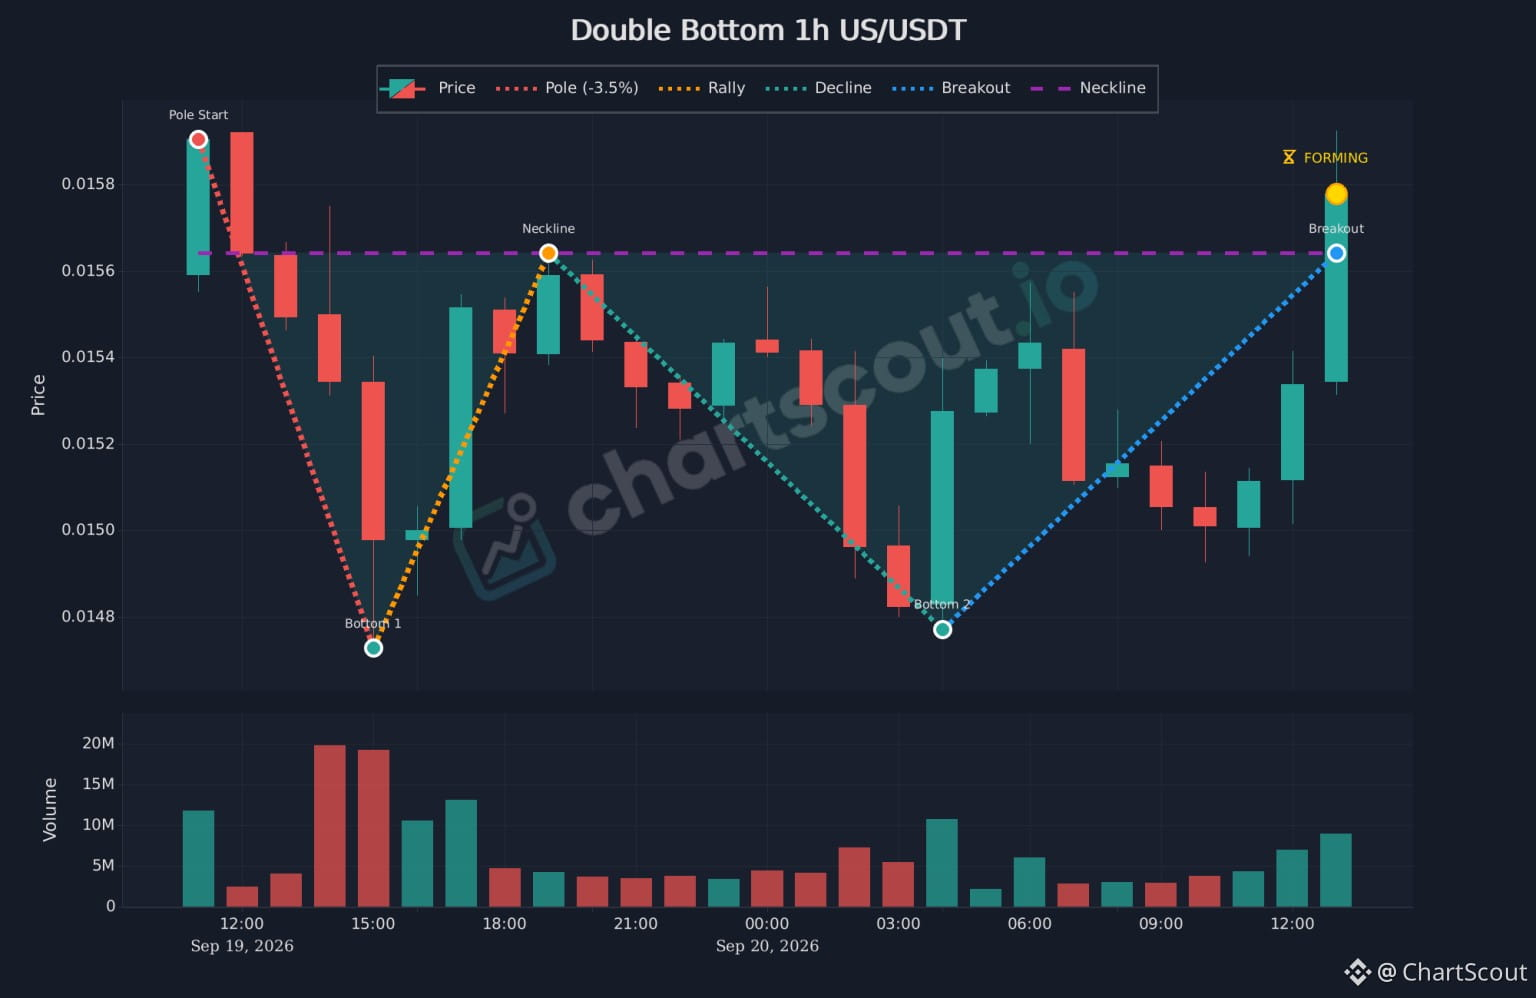
مخطط كشافة ألفا - الولايات المتحدة/USDT (1h)
يتم حاليًا تشكيل اختراق نمط القاع المزدوج على US/USDT بواسطة ChartScout.
[ إحصائيات النمط ]
• الأصل : US/USDT (1h)
• الإعداد : انعكاس القاع المزدوج
• هبوط الاندفاع : -3.5% (قطب)
• أرضية الدعم : 0.01473 - 0.01477 USDT (القاعين 1 و2)
• خط العنق الرئيسي : 0.01564 USDT
• الإجراء الحالي : اختراق ($0.01578 USDT)
[ الصفقة ]
تمسك السعر بالدعم مرتين بالقرب من 0.01475 قبل أن يتفوق المشترون ويتجاوزوا خط العنق 0.01564 بحجم أخضر قوي (9M). يشير إغلاق شمعة مؤكدة لمدة 1h فوق مستوى المقاومة إلى احتمال زخم انعكاس صعودي.
⚠️ اطلع على البحث بنفسك (DYOR) - ليس نصيحة مالية.
#ChartScout #US #BİNANCESQUARE #CryptoTradingTip
مخطط كشافة ألفا - الولايات المتحدة/USDT (1h)
يتم حاليًا تشكيل اختراق نمط القاع المزدوج على US/USDT بواسطة ChartScout.
[ إحصائيات النمط ]
• الأصل : US/USDT (1h)
• الإعداد : انعكاس القاع المزدوج
• هبوط الاندفاع : -3.5% (قطب)
• أرضية الدعم : 0.01473 - 0.01477 USDT (القاعين 1 و2)
• خط العنق الرئيسي : 0.01564 USDT
• الإجراء الحالي : اختراق ($0.01578 USDT)
[ الصفقة ]
تمسك السعر بالدعم مرتين بالقرب من 0.01475 قبل أن يتفوق المشترون ويتجاوزوا خط العنق 0.01564 بحجم أخضر قوي (9M). يشير إغلاق شمعة مؤكدة لمدة 1h فوق مستوى المقاومة إلى احتمال زخم انعكاس صعودي.
⚠️ اطلع على البحث بنفسك (DYOR) - ليس نصيحة مالية.
#ChartScout #US #BİNANCESQUARE #CryptoTradingTip
يتم حاليًا تشكيل اختراق نمط القاع المزدوج على US/USDT بواسطة ChartScout.
[ إحصائيات النمط ]
• الأصل : US/USDT (1h)
• الإعداد : انعكاس القاع المزدوج
• هبوط الاندفاع : -3.5% (قطب)
• أرضية الدعم : 0.01473 - 0.01477 USDT (القاعين 1 و2)
• خط العنق الرئيسي : 0.01564 USDT
• الإجراء الحالي : اختراق ($0.01578 USDT)
[ الصفقة ]
تمسك السعر بالدعم مرتين بالقرب من 0.01475 قبل أن يتفوق المشترون ويتجاوزوا خط العنق 0.01564 بحجم أخضر قوي (9M). يشير إغلاق شمعة مؤكدة لمدة 1h فوق مستوى المقاومة إلى احتمال زخم انعكاس صعودي.
⚠️ اطلع على البحث بنفسك (DYOR) - ليس نصيحة مالية.
#ChartScout #US #BİNANCESQUARE #CryptoTradingTip
2
269
·
--
🔄 فيديو جديد من ChartScout: ماسح انعكاس الرأس والكتفين
تعلّم كيفية التعرّف على الكتف الأيسر، والقاع/الرأس المنخفض، والكتف الأيمن الأعلى، وخط العنق على الرسوم البيانية الحقيقية. كما نتناول سياق السعر والحجم، وتأكيد الاختراق، والكشوفات التاريخية، وإعداد التنبيه.
جرّب ChartScout لمدة 7 أيام: https://chartscout.io
محتوى تعليمي فقط. قد تفشل الأنماط وعمليات الاختراق.
#crypto #TechnicalAnalysis #chartpatterns #inversehead&shoulder
🔄 فيديو جديد من ChartScout: ماسح انعكاس الرأس والكتفين
تعلّم كيفية التعرّف على الكتف الأيسر، والقاع/الرأس المنخفض، والكتف الأيمن الأعلى، وخط العنق على الرسوم البيانية الحقيقية. كما نتناول سياق السعر والحجم، وتأكيد الاختراق، والكشوفات التاريخية، وإعداد التنبيه.
جرّب ChartScout لمدة 7 أيام: https://chartscout.io
محتوى تعليمي فقط. قد تفشل الأنماط وعمليات الاختراق.
#crypto #TechnicalAnalysis #chartpatterns #inversehead&shoulder
تعلّم كيفية التعرّف على الكتف الأيسر، والقاع/الرأس المنخفض، والكتف الأيمن الأعلى، وخط العنق على الرسوم البيانية الحقيقية. كما نتناول سياق السعر والحجم، وتأكيد الاختراق، والكشوفات التاريخية، وإعداد التنبيه.
جرّب ChartScout لمدة 7 أيام: https://chartscout.io
محتوى تعليمي فقط. قد تفشل الأنماط وعمليات الاختراق.
#crypto #TechnicalAnalysis #chartpatterns #inversehead&shoulder
175
·
--
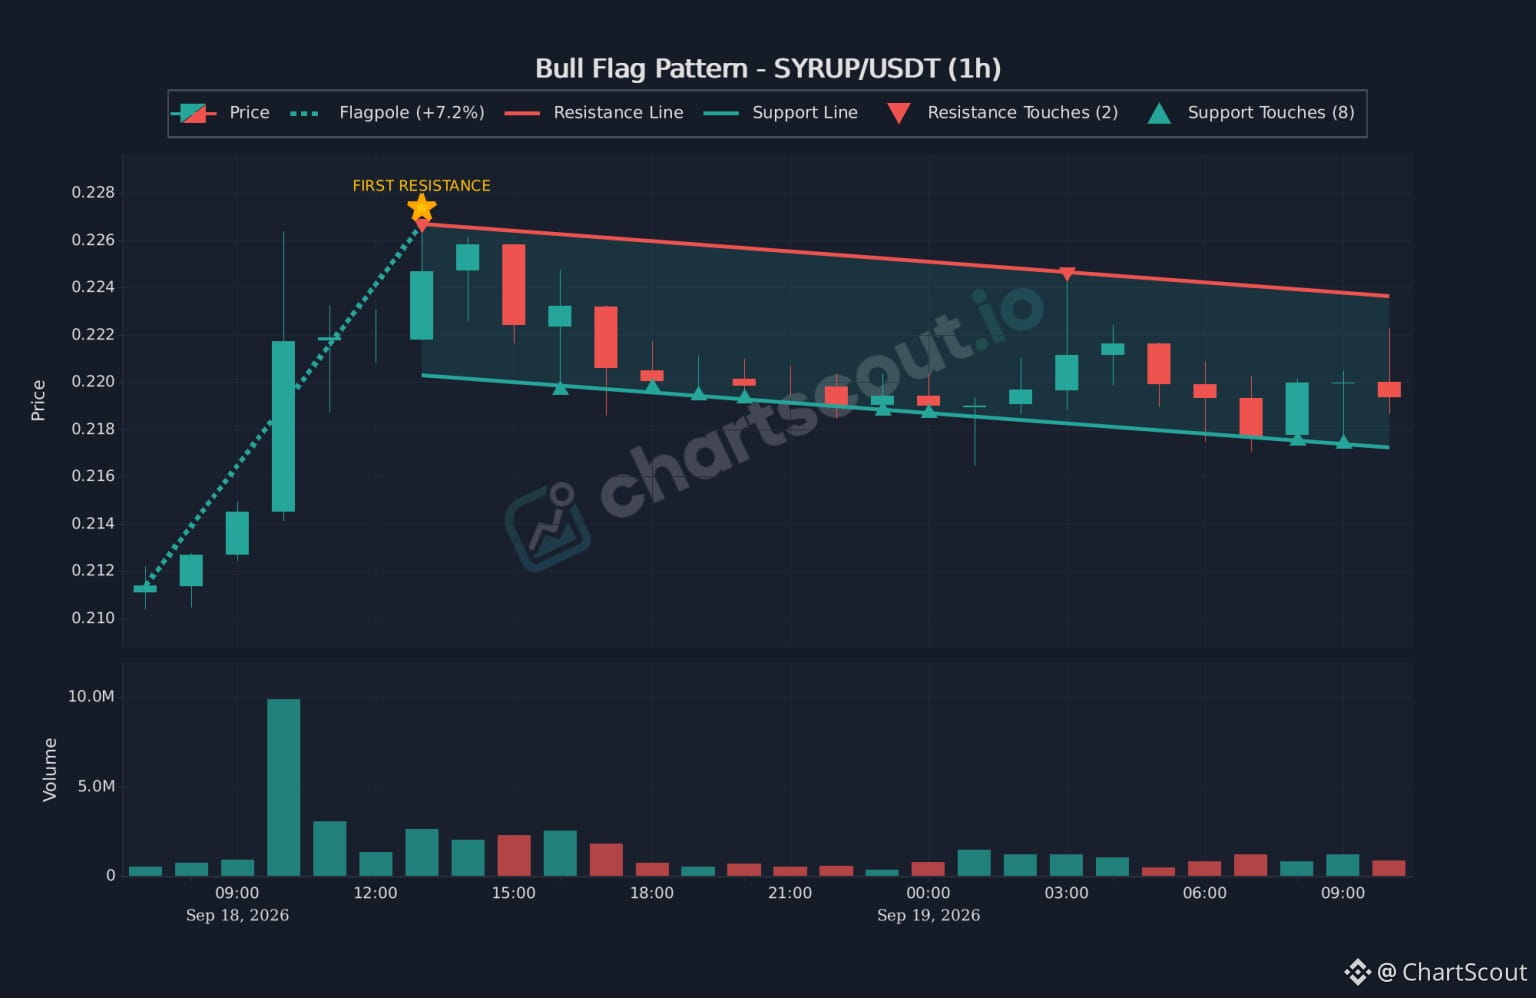
◆ رادار السوق | SYRUP/USDT (ساعة واحدة) ◆
يتشكل نمط علم ثور (Bull Flag) في SYRUP/USDT بعد رالي بنسبة +7.2% تم رصده بواسطة ChartScout!.
[ بيانات فنية أساسية ]
• إعداد النمط : علم ثور (نمط استمراري)
• الاندفاع الصاعد : +7.2% عمود العلم
• قاع الدعم : $0.2170 USDT (8 مرات لمس)
• سقف المقاومة : $0.2235 USDT (مرتا لمس)
• الشريط الحالي : $0.2195 USDT
[ أطروحة التداول ]
بعد تقدم أولي بنسبة +7.2% إلى $0.2268، تركزت حركة السعر داخل قناة علم هابطة الميل. تم الدفاع عن الدعم الأدنى 8 مرات. راقب زيادة أحجام التداول عند إغلاق شمعة لمدة 1h فوق مقاومة العلم العلوية لتأكيد احتمال استمرار الاتجاه.
استكشف التعرف الآلي على الأنماط مباشرة على ChartScout.
⚠️ DYOR - ليست نصيحة مالية.
#ChartScout #Syrup #BinanceSquare #cryptotrading
◆ رادار السوق | SYRUP/USDT (ساعة واحدة) ◆
يتشكل نمط علم ثور (Bull Flag) في SYRUP/USDT بعد رالي بنسبة +7.2% تم رصده بواسطة ChartScout!.
[ بيانات فنية أساسية ]
• إعداد النمط : علم ثور (نمط استمراري)
• الاندفاع الصاعد : +7.2% عمود العلم
• قاع الدعم : $0.2170 USDT (8 مرات لمس)
• سقف المقاومة : $0.2235 USDT (مرتا لمس)
• الشريط الحالي : $0.2195 USDT
[ أطروحة التداول ]
بعد تقدم أولي بنسبة +7.2% إلى $0.2268، تركزت حركة السعر داخل قناة علم هابطة الميل. تم الدفاع عن الدعم الأدنى 8 مرات. راقب زيادة أحجام التداول عند إغلاق شمعة لمدة 1h فوق مقاومة العلم العلوية لتأكيد احتمال استمرار الاتجاه.
استكشف التعرف الآلي على الأنماط مباشرة على ChartScout.
⚠️ DYOR - ليست نصيحة مالية.
#ChartScout #Syrup #BinanceSquare #cryptotrading
يتشكل نمط علم ثور (Bull Flag) في SYRUP/USDT بعد رالي بنسبة +7.2% تم رصده بواسطة ChartScout!.
[ بيانات فنية أساسية ]
• إعداد النمط : علم ثور (نمط استمراري)
• الاندفاع الصاعد : +7.2% عمود العلم
• قاع الدعم : $0.2170 USDT (8 مرات لمس)
• سقف المقاومة : $0.2235 USDT (مرتا لمس)
• الشريط الحالي : $0.2195 USDT
[ أطروحة التداول ]
بعد تقدم أولي بنسبة +7.2% إلى $0.2268، تركزت حركة السعر داخل قناة علم هابطة الميل. تم الدفاع عن الدعم الأدنى 8 مرات. راقب زيادة أحجام التداول عند إغلاق شمعة لمدة 1h فوق مقاومة العلم العلوية لتأكيد احتمال استمرار الاتجاه.
استكشف التعرف الآلي على الأنماط مباشرة على ChartScout.
⚠️ DYOR - ليست نصيحة مالية.
#ChartScout #Syrup #BinanceSquare #cryptotrading
226
·
--
📊 ماسح قمم وكتفين: رسوم بيانية حقيقية وإعداد التنبيهات
في هذا العرض، نوضح كيفية:
• تحديد الكتف الأيسر، والقمة الأعلى، والكتف الأيمن الأقل، وخط الرقبة
• مراجعة عمليات الكشف التاريخية الفعلية باستخدام مخططات السعر والحجم
• التمييز بين إغلاق الشمعة وبين الفتيل المؤقت
• إعداد التنبيهات عبر التطبيق والبريد الإلكتروني وTelegram وDiscord
ابدأ تجربتك المجانية لمدة 7 أيام في ChartScout
عمليات الكشف التاريخية أمثلة تعليمية فقط. لا يُعدّ النمط المكتشف اختراقًا مؤكدًا أو توصيةً للتداول.
#chartpattern #ChartScout #TechnicalAnalysis #headandshoulders
📊 ماسح قمم وكتفين: رسوم بيانية حقيقية وإعداد التنبيهات
في هذا العرض، نوضح كيفية:
• تحديد الكتف الأيسر، والقمة الأعلى، والكتف الأيمن الأقل، وخط الرقبة
• مراجعة عمليات الكشف التاريخية الفعلية باستخدام مخططات السعر والحجم
• التمييز بين إغلاق الشمعة وبين الفتيل المؤقت
• إعداد التنبيهات عبر التطبيق والبريد الإلكتروني وTelegram وDiscord
ابدأ تجربتك المجانية لمدة 7 أيام في ChartScout
عمليات الكشف التاريخية أمثلة تعليمية فقط. لا يُعدّ النمط المكتشف اختراقًا مؤكدًا أو توصيةً للتداول.
#chartpattern #ChartScout #TechnicalAnalysis #headandshoulders
في هذا العرض، نوضح كيفية:
• تحديد الكتف الأيسر، والقمة الأعلى، والكتف الأيمن الأقل، وخط الرقبة
• مراجعة عمليات الكشف التاريخية الفعلية باستخدام مخططات السعر والحجم
• التمييز بين إغلاق الشمعة وبين الفتيل المؤقت
• إعداد التنبيهات عبر التطبيق والبريد الإلكتروني وTelegram وDiscord
ابدأ تجربتك المجانية لمدة 7 أيام في ChartScout
عمليات الكشف التاريخية أمثلة تعليمية فقط. لا يُعدّ النمط المكتشف اختراقًا مؤكدًا أو توصيةً للتداول.
#chartpattern #ChartScout #TechnicalAnalysis #headandshoulders
131
·
--
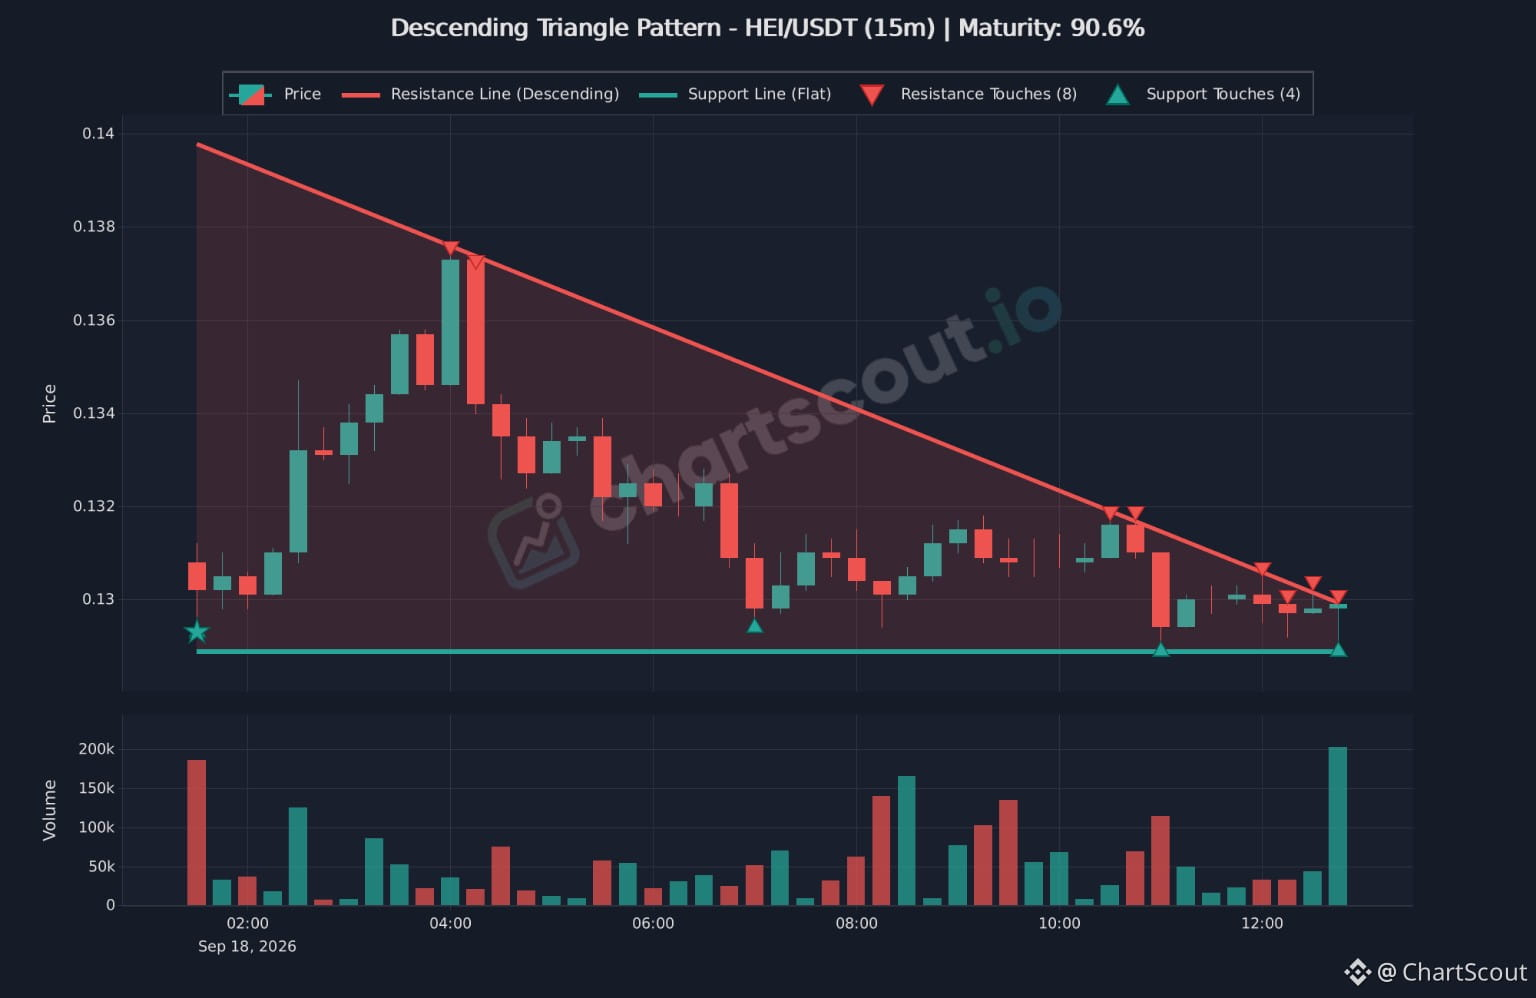
◆ رادار السوق | HEI/USDT (15m) ◆
يتم ضغط مثلث هابط ناضج بنسبة 90.6% عند القمة النهائية على HEI/USDT، كما تم رصده بواسطة ChartScout.
[ البيانات التقنية الرئيسية ]
• إعداد النمط : مثلث هابط (ناضج بنسبة 90.6%)
• قاع خط أساس مسطح : 0.1289$ USDT (4 مرات تماس دعم)
• ميل مقاومة علوي : 0.1302$ USDT (8 مرات تماس مقاومة)
• الشريط الحالي : 0.1298$ USDT (انضغاط عند القمة)
• حركة الحجم : اندفاع أخضر بقيمة 200k
[ أطروحة التداول ]
تم تثبيت السعر مباشرة داخل خط الأساس الأفقي عند 0.1289$ USDT عبر هيكل ممتد، وذلك بعد سلسلة من القمم الأوطأ. ومع نضج 90.6%، فإن الانضغاط بلغ حدّه الأقصى. راقب إغلاق شمعة 15m مدعومًا بالحجم خارج حدود المثلث لتحديد خطوة التوسع القادمة.
استكشف التعرف الآلي على الأنماط بشكل مباشر على ChartScout.
⚠️ DYOR - ليست نصيحة مالية.
#ChartScout #HEI #BinanceSquare #cryptotrading
◆ رادار السوق | HEI/USDT (15m) ◆
يتم ضغط مثلث هابط ناضج بنسبة 90.6% عند القمة النهائية على HEI/USDT، كما تم رصده بواسطة ChartScout.
[ البيانات التقنية الرئيسية ]
• إعداد النمط : مثلث هابط (ناضج بنسبة 90.6%)
• قاع خط أساس مسطح : 0.1289$ USDT (4 مرات تماس دعم)
• ميل مقاومة علوي : 0.1302$ USDT (8 مرات تماس مقاومة)
• الشريط الحالي : 0.1298$ USDT (انضغاط عند القمة)
• حركة الحجم : اندفاع أخضر بقيمة 200k
[ أطروحة التداول ]
تم تثبيت السعر مباشرة داخل خط الأساس الأفقي عند 0.1289$ USDT عبر هيكل ممتد، وذلك بعد سلسلة من القمم الأوطأ. ومع نضج 90.6%، فإن الانضغاط بلغ حدّه الأقصى. راقب إغلاق شمعة 15m مدعومًا بالحجم خارج حدود المثلث لتحديد خطوة التوسع القادمة.
استكشف التعرف الآلي على الأنماط بشكل مباشر على ChartScout.
⚠️ DYOR - ليست نصيحة مالية.
#ChartScout #HEI #BinanceSquare #cryptotrading
يتم ضغط مثلث هابط ناضج بنسبة 90.6% عند القمة النهائية على HEI/USDT، كما تم رصده بواسطة ChartScout.
[ البيانات التقنية الرئيسية ]
• إعداد النمط : مثلث هابط (ناضج بنسبة 90.6%)
• قاع خط أساس مسطح : 0.1289$ USDT (4 مرات تماس دعم)
• ميل مقاومة علوي : 0.1302$ USDT (8 مرات تماس مقاومة)
• الشريط الحالي : 0.1298$ USDT (انضغاط عند القمة)
• حركة الحجم : اندفاع أخضر بقيمة 200k
[ أطروحة التداول ]
تم تثبيت السعر مباشرة داخل خط الأساس الأفقي عند 0.1289$ USDT عبر هيكل ممتد، وذلك بعد سلسلة من القمم الأوطأ. ومع نضج 90.6%، فإن الانضغاط بلغ حدّه الأقصى. راقب إغلاق شمعة 15m مدعومًا بالحجم خارج حدود المثلث لتحديد خطوة التوسع القادمة.
استكشف التعرف الآلي على الأنماط بشكل مباشر على ChartScout.
⚠️ DYOR - ليست نصيحة مالية.
#ChartScout #HEI #BinanceSquare #cryptotrading
2
1
1.6k
·
--
كيف تحدد القاع المزدوج قبل الاختراق؟
يفصّل فيديو ChartScout الجديد لدينا خطوة بخطوة عن الحوضين (القاعين)، وخط العنق، وتأكيد الإغلاق بالشمعة، والحجم (الڤوليم)، والكشوفات الحقيقية، مع إعداد كامل لمُاسِح BTC/USDT.
#BinanceSquare #cryptotrading #bitcoin #DoubleBottom #ChartScout
كيف تحدد القاع المزدوج قبل الاختراق؟
يفصّل فيديو ChartScout الجديد لدينا خطوة بخطوة عن الحوضين (القاعين)، وخط العنق، وتأكيد الإغلاق بالشمعة، والحجم (الڤوليم)، والكشوفات الحقيقية، مع إعداد كامل لمُاسِح BTC/USDT.
#BinanceSquare #cryptotrading #bitcoin #DoubleBottom #ChartScout
يفصّل فيديو ChartScout الجديد لدينا خطوة بخطوة عن الحوضين (القاعين)، وخط العنق، وتأكيد الإغلاق بالشمعة، والحجم (الڤوليم)، والكشوفات الحقيقية، مع إعداد كامل لمُاسِح BTC/USDT.
#BinanceSquare #cryptotrading #bitcoin #DoubleBottom #ChartScout
117
·
--
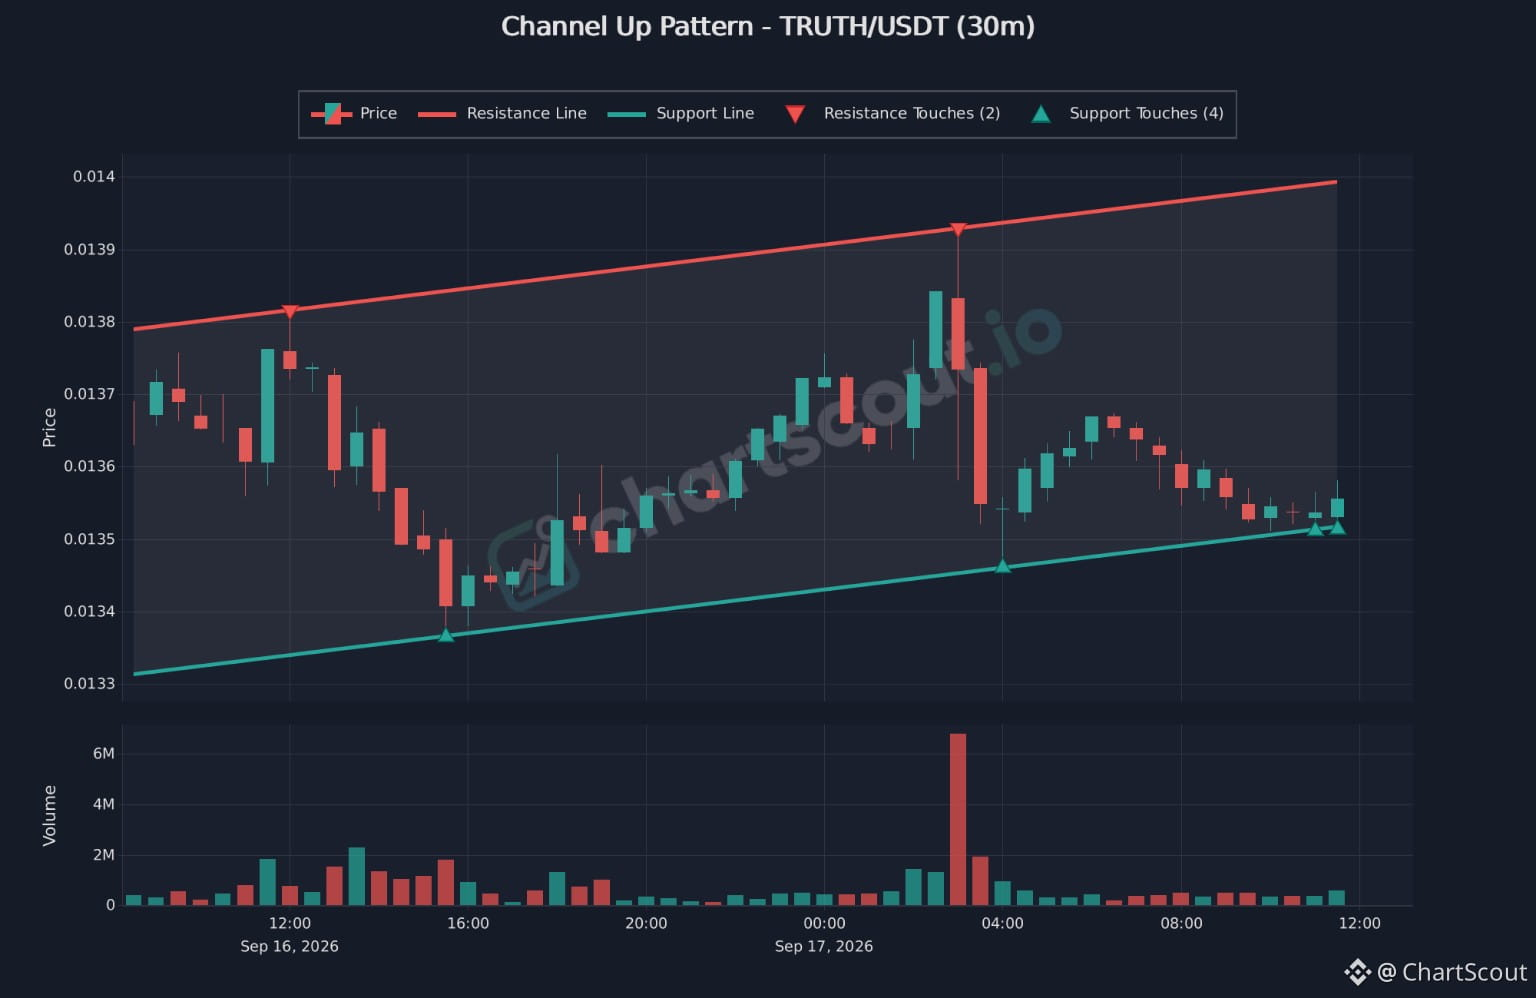
◆ مؤشر السوق | TRUTH/USDT (30m) ◆
يتم بنشاط الدفاع عن بنية قناة صاعدة (Channel Up) النظيفة لحاجز الدعم الأدنى في TRUTH/USDT، والذي تم رصده بواسطة ChartScout.
[ أهم البيانات الفنية ]
• إعداد النمط : قناة صاعدة (Channel Up / القناة الصاعدة)
• القاع الأساسي : 0.01351 USDT$ (4 مرات لمس للدعم)
• السقف العلوي : 0.01395 USDT$ (مرتا لمس للمقاومة)
• الشريط الحالي : 0.01355 USDT$ (الدفاع عن الدعم)
[ أطروحة التداول ]
لقد أنشأت حركة السعر قممًا/قيعانًا أدنى أعلى بشكل متسق على طول خط دعم القناة الصاعدة (تم اختباره 4 مرات). وبما أن المشترين يدافعون عن أرضية خط الاتجاه، فإن الحفاظ على هذا الدعم يضمن استمرار القناة الصاعدة نحو المقاومة العلوية، بينما يؤدي كسر مؤكد لمدة 30 دقيقة للأسفل إلى إلغاء الإعداد.
استكشف التعرف التلقائي على الأنماط مباشرة على ChartScout.
⚠️ DYOR - ليست نصيحة مالية.
#ChartScout #truth #BinanceSquare #cryptotrading
◆ مؤشر السوق | TRUTH/USDT (30m) ◆
يتم بنشاط الدفاع عن بنية قناة صاعدة (Channel Up) النظيفة لحاجز الدعم الأدنى في TRUTH/USDT، والذي تم رصده بواسطة ChartScout.
[ أهم البيانات الفنية ]
• إعداد النمط : قناة صاعدة (Channel Up / القناة الصاعدة)
• القاع الأساسي : 0.01351 USDT$ (4 مرات لمس للدعم)
• السقف العلوي : 0.01395 USDT$ (مرتا لمس للمقاومة)
• الشريط الحالي : 0.01355 USDT$ (الدفاع عن الدعم)
[ أطروحة التداول ]
لقد أنشأت حركة السعر قممًا/قيعانًا أدنى أعلى بشكل متسق على طول خط دعم القناة الصاعدة (تم اختباره 4 مرات). وبما أن المشترين يدافعون عن أرضية خط الاتجاه، فإن الحفاظ على هذا الدعم يضمن استمرار القناة الصاعدة نحو المقاومة العلوية، بينما يؤدي كسر مؤكد لمدة 30 دقيقة للأسفل إلى إلغاء الإعداد.
استكشف التعرف التلقائي على الأنماط مباشرة على ChartScout.
⚠️ DYOR - ليست نصيحة مالية.
#ChartScout #truth #BinanceSquare #cryptotrading
يتم بنشاط الدفاع عن بنية قناة صاعدة (Channel Up) النظيفة لحاجز الدعم الأدنى في TRUTH/USDT، والذي تم رصده بواسطة ChartScout.
[ أهم البيانات الفنية ]
• إعداد النمط : قناة صاعدة (Channel Up / القناة الصاعدة)
• القاع الأساسي : 0.01351 USDT$ (4 مرات لمس للدعم)
• السقف العلوي : 0.01395 USDT$ (مرتا لمس للمقاومة)
• الشريط الحالي : 0.01355 USDT$ (الدفاع عن الدعم)
[ أطروحة التداول ]
لقد أنشأت حركة السعر قممًا/قيعانًا أدنى أعلى بشكل متسق على طول خط دعم القناة الصاعدة (تم اختباره 4 مرات). وبما أن المشترين يدافعون عن أرضية خط الاتجاه، فإن الحفاظ على هذا الدعم يضمن استمرار القناة الصاعدة نحو المقاومة العلوية، بينما يؤدي كسر مؤكد لمدة 30 دقيقة للأسفل إلى إلغاء الإعداد.
استكشف التعرف التلقائي على الأنماط مباشرة على ChartScout.
⚠️ DYOR - ليست نصيحة مالية.
#ChartScout #truth #BinanceSquare #cryptotrading
233
·
--
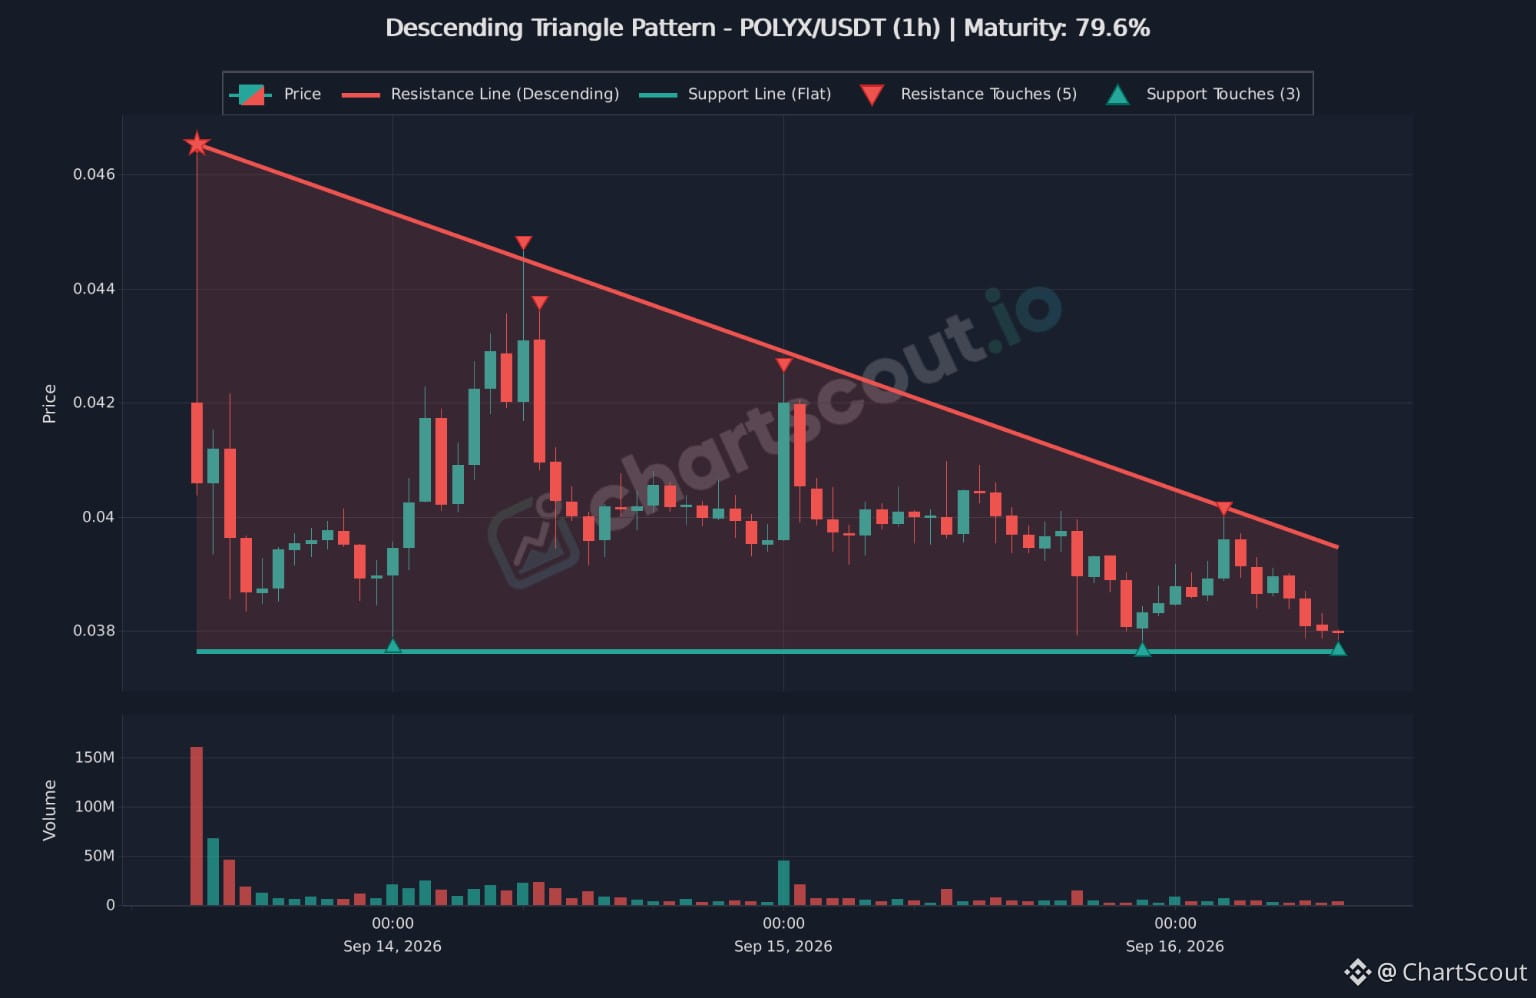
◆ رادار السوق | POLYX/USDT (1h) ◆
يبدأ Polymesh ($POLYX) في ضغط/انكماش حرج داخل مثلث هابط ناضج بنسبة 79.6% تم اكتشافه بواسطة ChartScout.
[ البيانات الفنية الرئيسية ]
• إعداد النمط : مثلث هابط (إطار زمني 1h)
• ميل/سقف المقاومة : 5 لمسات مقاومة (0.0395 USDT)
• قاع/خط الأساس : 3 لمسات دعم (0.0376 USDT)
• الشريط الحالي : 0.0378 USDT (يضغط عند خط الأساس)
[ أطروحة التداول ]
لقد قام البائعون بشكل منهجي بخفض القمم خلال تشكيل متعدد الأيام، مع تثبيت السعر مباشرةً مقابل خط الأرض الأفقي عند $0.0376. إن إغلاق شمعة 1h عالية الحجم أسفل الدعم يشير إلى احتمال استمرار/تواصل الانهيار، بينما يؤدي اختراق خط الاتجاه الهابط إلى إبطال النمط.
استكشف التعرف الآلي على الأنماط مباشرة على ChartScout.
⚠️ قم بإجراء بحثك الخاص - ليست نصيحة مالية.
#ChartScout #POLYX #POLYX/USDT #POLYX/USDT⚡️
◆ رادار السوق | POLYX/USDT (1h) ◆
يبدأ Polymesh ($POLYX) في ضغط/انكماش حرج داخل مثلث هابط ناضج بنسبة 79.6% تم اكتشافه بواسطة ChartScout.
[ البيانات الفنية الرئيسية ]
• إعداد النمط : مثلث هابط (إطار زمني 1h)
• ميل/سقف المقاومة : 5 لمسات مقاومة (0.0395 USDT)
• قاع/خط الأساس : 3 لمسات دعم (0.0376 USDT)
• الشريط الحالي : 0.0378 USDT (يضغط عند خط الأساس)
[ أطروحة التداول ]
لقد قام البائعون بشكل منهجي بخفض القمم خلال تشكيل متعدد الأيام، مع تثبيت السعر مباشرةً مقابل خط الأرض الأفقي عند $0.0376. إن إغلاق شمعة 1h عالية الحجم أسفل الدعم يشير إلى احتمال استمرار/تواصل الانهيار، بينما يؤدي اختراق خط الاتجاه الهابط إلى إبطال النمط.
استكشف التعرف الآلي على الأنماط مباشرة على ChartScout.
⚠️ قم بإجراء بحثك الخاص - ليست نصيحة مالية.
#ChartScout #POLYX #POLYX/USDT #POLYX/USDT⚡️
يبدأ Polymesh ($POLYX) في ضغط/انكماش حرج داخل مثلث هابط ناضج بنسبة 79.6% تم اكتشافه بواسطة ChartScout.
[ البيانات الفنية الرئيسية ]
• إعداد النمط : مثلث هابط (إطار زمني 1h)
• ميل/سقف المقاومة : 5 لمسات مقاومة (0.0395 USDT)
• قاع/خط الأساس : 3 لمسات دعم (0.0376 USDT)
• الشريط الحالي : 0.0378 USDT (يضغط عند خط الأساس)
[ أطروحة التداول ]
لقد قام البائعون بشكل منهجي بخفض القمم خلال تشكيل متعدد الأيام، مع تثبيت السعر مباشرةً مقابل خط الأرض الأفقي عند $0.0376. إن إغلاق شمعة 1h عالية الحجم أسفل الدعم يشير إلى احتمال استمرار/تواصل الانهيار، بينما يؤدي اختراق خط الاتجاه الهابط إلى إبطال النمط.
استكشف التعرف الآلي على الأنماط مباشرة على ChartScout.
⚠️ قم بإجراء بحثك الخاص - ليست نصيحة مالية.
#ChartScout #POLYX #POLYX/USDT #POLYX/USDT⚡️
374
·
--
📉 ماسح القمم المزدوجة: رسوم بيانية حقيقية وإعداد التنبيهات
يُعد نمط القمة المزدوجة أحد أكثر أنماط الانعكاس الهبوطية رصدًا في التحليل الفني. يمكنه أن يشير إلى أن المشترين يفقدون الزخم بعد محاولتين فاشلتين لاختراق القمة للأعلى، لكن تحديد النمط مبكرًا عبر أسواق متعددة قد يكون صعبًا عند فحص الرسوم يدويًا.
يعرض لك فيديو ChartScout الجديد كيفية عمل ماسح القمم المزدوجة باستخدام رسوم بيانية حقيقية للعملات الرقمية، كما يشرح كيفية إعداد تنبيهات لهياكل الانعكاس المحتملة.
#ChartScout #cryptotrading #DoubleTop #TechnicalAnalysis
📉 ماسح القمم المزدوجة: رسوم بيانية حقيقية وإعداد التنبيهات
يُعد نمط القمة المزدوجة أحد أكثر أنماط الانعكاس الهبوطية رصدًا في التحليل الفني. يمكنه أن يشير إلى أن المشترين يفقدون الزخم بعد محاولتين فاشلتين لاختراق القمة للأعلى، لكن تحديد النمط مبكرًا عبر أسواق متعددة قد يكون صعبًا عند فحص الرسوم يدويًا.
يعرض لك فيديو ChartScout الجديد كيفية عمل ماسح القمم المزدوجة باستخدام رسوم بيانية حقيقية للعملات الرقمية، كما يشرح كيفية إعداد تنبيهات لهياكل الانعكاس المحتملة.
#ChartScout #cryptotrading #DoubleTop #TechnicalAnalysis
يُعد نمط القمة المزدوجة أحد أكثر أنماط الانعكاس الهبوطية رصدًا في التحليل الفني. يمكنه أن يشير إلى أن المشترين يفقدون الزخم بعد محاولتين فاشلتين لاختراق القمة للأعلى، لكن تحديد النمط مبكرًا عبر أسواق متعددة قد يكون صعبًا عند فحص الرسوم يدويًا.
يعرض لك فيديو ChartScout الجديد كيفية عمل ماسح القمم المزدوجة باستخدام رسوم بيانية حقيقية للعملات الرقمية، كما يشرح كيفية إعداد تنبيهات لهياكل الانعكاس المحتملة.
#ChartScout #cryptotrading #DoubleTop #TechnicalAnalysis
100
سجّل الدخول لاستكشاف المزيد من المُحتوى
انضم إلى مُستخدمي العملات الرقمية حول العالم على Binance Square
⚡️ احصل على أحدث المعلومات المفيدة عن العملات الرقمية.
💬 موثوقة من قبل أكبر منصّة لتداول العملات الرقمية في العالم.
👍 اكتشف الرؤى الحقيقية من صنّاع المُحتوى الموثوقين.
البريد الإلكتروني / رقم الهاتف
المواضيع الرائجة
BitMineETHHoldingsTop6Million
1,737 مشاهدات
133 يقومون بالنقاش
#bitmineethholdingstop6million
🚨 تراكم مؤسسي: حيازات Bitmine من ETH تتصدر 6 ملايين!
تحديث السوق: تؤكد تقارير التتبع على السلسلة والاحتياطيات مدى إنجاز ضخم في تراكم الأصول الرقمية المؤسسي، إذ تجاوز إجمالي حيازات Bitmine من الإيثريوم رسميًا 6 ملايين ETH (بقيمة تزيد عن 6 مليارات دولار). ومع قيام الكيانات المؤسسية والشركات بتوسيع تعرض ميزانياتها إلى بنية إثبات الحصة بشكل عدواني، يواجه المعروض السائل في البورصات الرئيسية ضغطًا هبوطيًا مستمرًا. 📊
ماذا يعني ذلك للمتداولين:
يؤدي التراكم الضخم من خزانات الشركات إلى تضييق المعروض المتداول بشكل كبير ويؤثر على عمق السوق. يراقب المشاركون عن كثب أرصدة احتياطيات البورصات وعوائد التكديس ووضع المشتقات، حيث تقفل الحيازات واسعة النطاق أجزاء كبيرة من المعروض المتداول.
عملات قابلة للتداول بارزة تراقبها:
$ETH (Ethereum): الأصل الأساسي تحت التراكم المؤسسي؛ متابعة نمو المُتحققين، وتدفقات التكديس، ومقاييس امتصاص العرض.
$BTC (Bitcoin): مرساة السيولة على مستوى الاقتصاد الكلي؛ مراقبة اتجاهات تخصيص الأصول المؤسسية عبر أكبر مخازن القيمة الرقمية.
$SOL (Solana): معيار لشبكة عالية السرعة؛ مراقبة تدوير سيولة الطبقة-1 البديلة وتوسع حجم النظام البيئي.
كيف ترى تأثير خزائن الرموز المؤسسية متعددة الملايين على سيولة السوق على المدى الطويل والتقلب؟ لنتناقش في التعليقات أدناه! 👇
#ETH #InstitutionalCrypto #CryptoTreasury #blockchain
Axiom AlphA
·0 إعجاب
·1.5k مشاهدات
StrategyAdds1666BTCHoldingsReach847666
1,088 مشاهدات
96 يقومون بالنقاش
NvidiaApproves$150BBuyback
2,137 مشاهدات
54 يقومون بالنقاش