

Cas Abbé
12.7k منشورات

Cas Abbé
 تحقُّق Binance Square الإضافي
إبلاغ
حظر المُستخدم
Binance KOL & Crypto Mentor 🙌 X : @cas_abbe

Creator Awards 2024
1 تتابع
166.2K+ المتابعون
354.0K+ إعجاب
1 الشارات
منشورات
الكل
اقتباسات
مقاطع فيديو
PINNED
·
--
تمّ التحقق
مقالة
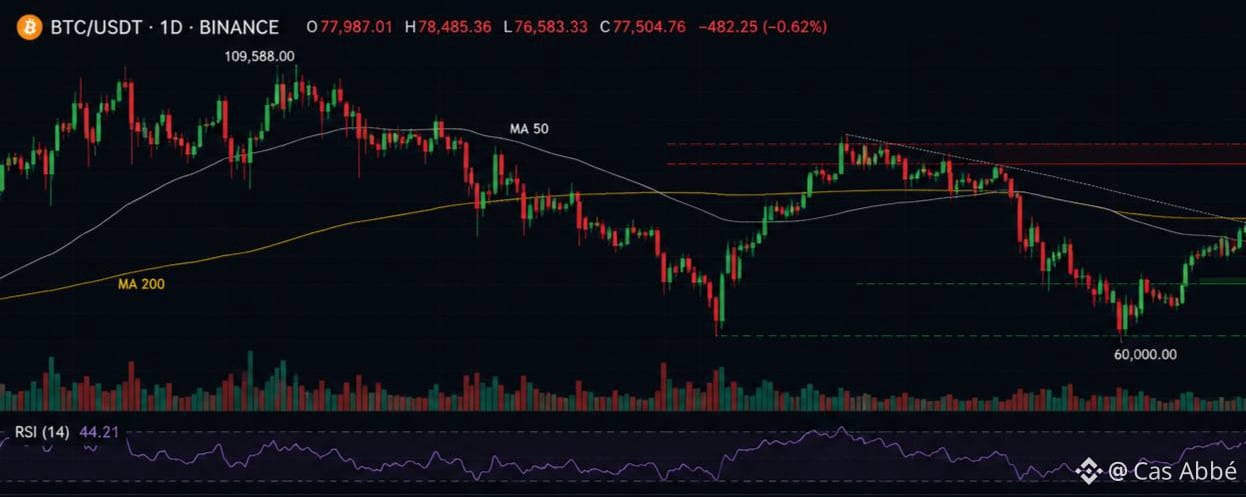
BTC و ETH الاثنين ينكسرون: حان الوقت أن السوق تتوقف عن التظاهرأنا أشوف الشارتات جنب بعض والرسالة تصير أصعب تجاهلها.
$BTC و $ETH كلهم يفقدون الهيكل في نفس الوقت.
مو بس شمعات حمراء عشوائية. مو بس حديث تصحيح صحي من ناس يحاولون يظهرون أذكياء على تويتر. أنا أتكلم عن هيكل سوق صار أضعف لأسابيع بينما الناس استمروا في اعتبار كل ارتداد هو القاع.
بيتكوين رفضت مرة ثانية قرب خط المقاومة العلوي، بعدين فقدت الزخم بسرعة. إيثيريوم سوت نفس الشي. نفس الهيكل الصاعد. نفس الإرهاق. نفس الفشل. هالنوع من الضعف المتزامن مهم لأن ETH عادةً تتبع BTC، لكن لما الاثنين يبدأون ينكسرون مع بعض، السيولة تترك السوق بالكامل.
BTC و ETH الاثنين ينكسرون: حان الوقت أن السوق تتوقف عن التظاهر
أنا أشوف الشارتات جنب بعض والرسالة تصير أصعب تجاهلها.
$BTC و $ETH كلهم يفقدون الهيكل في نفس الوقت.
مو بس شمعات حمراء عشوائية. مو بس حديث تصحيح صحي من ناس يحاولون يظهرون أذكياء على تويتر. أنا أتكلم عن هيكل سوق صار أضعف لأسابيع بينما الناس استمروا في اعتبار كل ارتداد هو القاع.
بيتكوين رفضت مرة ثانية قرب خط المقاومة العلوي، بعدين فقدت الزخم بسرعة. إيثيريوم سوت نفس الشي. نفس الهيكل الصاعد. نفس الإرهاق. نفس الفشل. هالنوع من الضعف المتزامن مهم لأن ETH عادةً تتبع BTC، لكن لما الاثنين يبدأون ينكسرون مع بعض، السيولة تترك السوق بالكامل.
$BTC و $ETH كلهم يفقدون الهيكل في نفس الوقت.
مو بس شمعات حمراء عشوائية. مو بس حديث تصحيح صحي من ناس يحاولون يظهرون أذكياء على تويتر. أنا أتكلم عن هيكل سوق صار أضعف لأسابيع بينما الناس استمروا في اعتبار كل ارتداد هو القاع.
بيتكوين رفضت مرة ثانية قرب خط المقاومة العلوي، بعدين فقدت الزخم بسرعة. إيثيريوم سوت نفس الشي. نفس الهيكل الصاعد. نفس الإرهاق. نفس الفشل. هالنوع من الضعف المتزامن مهم لأن ETH عادةً تتبع BTC، لكن لما الاثنين يبدأون ينكسرون مع بعض، السيولة تترك السوق بالكامل.
79
15
256
382k
PINNED
·
--
ثماني سنوات على منصة @Binance، وما زالت تُفاجئنا.
قدّمت منصة @Binance صندوق هدايا مميزًا... قميص، هودي، وبعض الهدايا الأخرى التي لاقت استحسانًا كبيرًا.
لقد مرّ وقت طويل على تأسيسها، وشهدت تحولها من شركة ناشئة إلى أكبر بورصة عملات رقمية في العالم:
• أكثر من 280 مليون مستخدم
• حجم تداول يصل إلى مئات التريليونات
• أكثر من 100 دولة تدعم المنصة
• أكثر من 1700 زوج تداول مُدرج
• أكثر من 30 مليون زيارة أسبوعية نشطة
تحية كبيرة لـ @blueshirt666 وفريق Binance Square @karin_veri، أنتم جميعًا تُبدعون شيئًا حقيقيًا هنا.
احترموا الاتساق والتركيز على المجتمع.
لنواصل البناء. #BinanceTurns8
ثماني سنوات على منصة @Binance، وما زالت تُفاجئنا.
قدّمت منصة @Binance صندوق هدايا مميزًا... قميص، هودي، وبعض الهدايا الأخرى التي لاقت استحسانًا كبيرًا.
لقد مرّ وقت طويل على تأسيسها، وشهدت تحولها من شركة ناشئة إلى أكبر بورصة عملات رقمية في العالم:
• أكثر من 280 مليون مستخدم
• حجم تداول يصل إلى مئات التريليونات
• أكثر من 100 دولة تدعم المنصة
• أكثر من 1700 زوج تداول مُدرج
• أكثر من 30 مليون زيارة أسبوعية نشطة
تحية كبيرة لـ @blueshirt666 وفريق Binance Square @karin_veri، أنتم جميعًا تُبدعون شيئًا حقيقيًا هنا.
احترموا الاتساق والتركيز على المجتمع.
لنواصل البناء. #BinanceTurns8
قدّمت منصة @Binance صندوق هدايا مميزًا... قميص، هودي، وبعض الهدايا الأخرى التي لاقت استحسانًا كبيرًا.
لقد مرّ وقت طويل على تأسيسها، وشهدت تحولها من شركة ناشئة إلى أكبر بورصة عملات رقمية في العالم:
• أكثر من 280 مليون مستخدم
• حجم تداول يصل إلى مئات التريليونات
• أكثر من 100 دولة تدعم المنصة
• أكثر من 1700 زوج تداول مُدرج
• أكثر من 30 مليون زيارة أسبوعية نشطة
تحية كبيرة لـ @blueshirt666 وفريق Binance Square @karin_veri، أنتم جميعًا تُبدعون شيئًا حقيقيًا هنا.
احترموا الاتساق والتركيز على المجتمع.
لنواصل البناء. #BinanceTurns8

28
8
165
7.9k
·
--
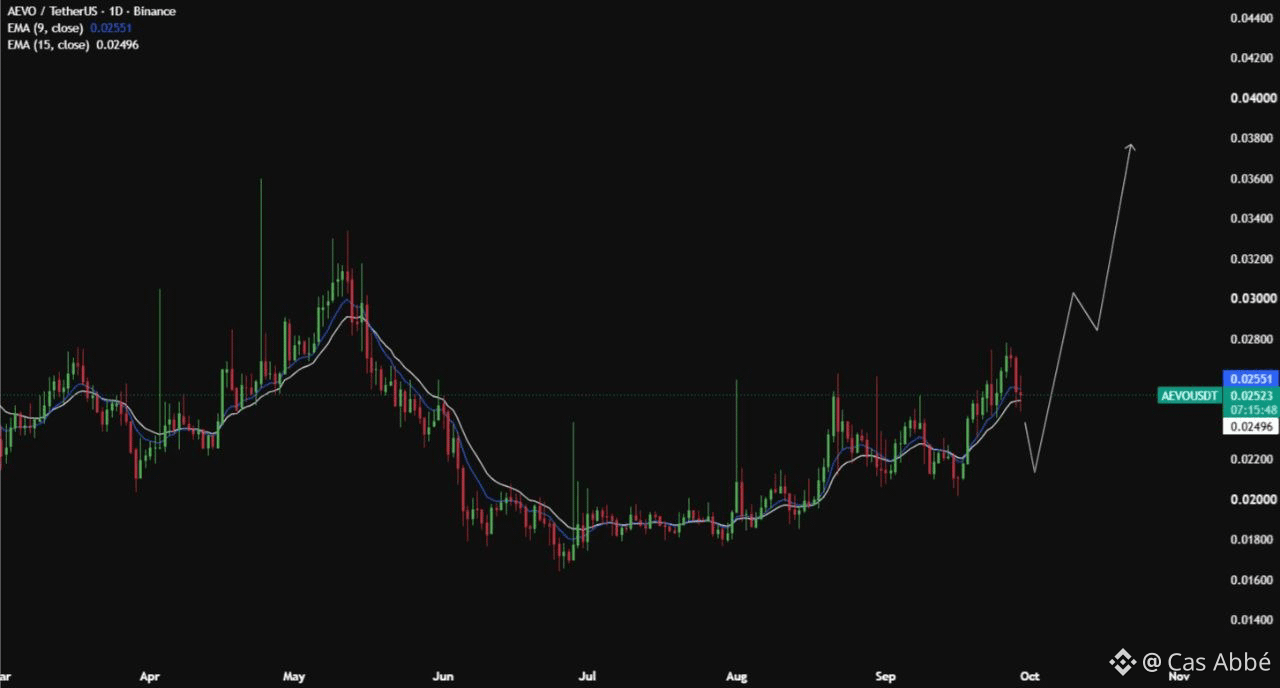
$AEVO يتداول حول 0.0252 دولار، ويقع بين المتوسطين 9 و15 على الرسم البياني اليومي.
استعادة نظيفة لمستوى 0.0255 دولار قد تفتح الباب باتجاه 0.0300 دولار، تليها 0.0380 دولار.
دعم رئيسي: 0.0240–0.0250 دولار
أصبح الهيكل مثيرًا للاهتمام. 👀
@Aevoxyz يقوم ببناء نظام أوسع لمشتقات التداول على السلسلة.
في حين أن $HYPE وGMX و$DYDX وJUP يتنافسون على متداولي المشتقات، فإن Aevo يجمع العقود الدائمة والخيارات ومنتجات أخرى مُهيكلة ضمن منصة واحدة.
الجزء المثير هو التركيز على منح المتداولين طرقًا أكثر لإدارة التعرض بدل الاعتماد على الرافعة البسيطة فقط.
ومع استمرار تطور المشتقات على السلسلة، ستصبح السيولة والتنفيذ وعمق المنتجات أهم من الضجيج.
AEVO ما زالت على راداري. 👀
ليس نصيحة مالية.
#btc
$AEVO يتداول حول 0.0252 دولار، ويقع بين المتوسطين 9 و15 على الرسم البياني اليومي.
استعادة نظيفة لمستوى 0.0255 دولار قد تفتح الباب باتجاه 0.0300 دولار، تليها 0.0380 دولار.
دعم رئيسي: 0.0240–0.0250 دولار
أصبح الهيكل مثيرًا للاهتمام. 👀
@Aevo يقوم ببناء نظام أوسع لمشتقات التداول على السلسلة.
في حين أن $HYPE وGMX و$DYDX وJUP يتنافسون على متداولي المشتقات، فإن Aevo يجمع العقود الدائمة والخيارات ومنتجات أخرى مُهيكلة ضمن منصة واحدة.
الجزء المثير هو التركيز على منح المتداولين طرقًا أكثر لإدارة التعرض بدل الاعتماد على الرافعة البسيطة فقط.
ومع استمرار تطور المشتقات على السلسلة، ستصبح السيولة والتنفيذ وعمق المنتجات أهم من الضجيج.
AEVO ما زالت على راداري. 👀
ليس نصيحة مالية.
#btc
استعادة نظيفة لمستوى 0.0255 دولار قد تفتح الباب باتجاه 0.0300 دولار، تليها 0.0380 دولار.
دعم رئيسي: 0.0240–0.0250 دولار
أصبح الهيكل مثيرًا للاهتمام. 👀
@Aevo يقوم ببناء نظام أوسع لمشتقات التداول على السلسلة.
في حين أن $HYPE وGMX و$DYDX وJUP يتنافسون على متداولي المشتقات، فإن Aevo يجمع العقود الدائمة والخيارات ومنتجات أخرى مُهيكلة ضمن منصة واحدة.
الجزء المثير هو التركيز على منح المتداولين طرقًا أكثر لإدارة التعرض بدل الاعتماد على الرافعة البسيطة فقط.
ومع استمرار تطور المشتقات على السلسلة، ستصبح السيولة والتنفيذ وعمق المنتجات أهم من الضجيج.
AEVO ما زالت على راداري. 👀
ليس نصيحة مالية.
#btc
19
20
421
·
--
مقالة
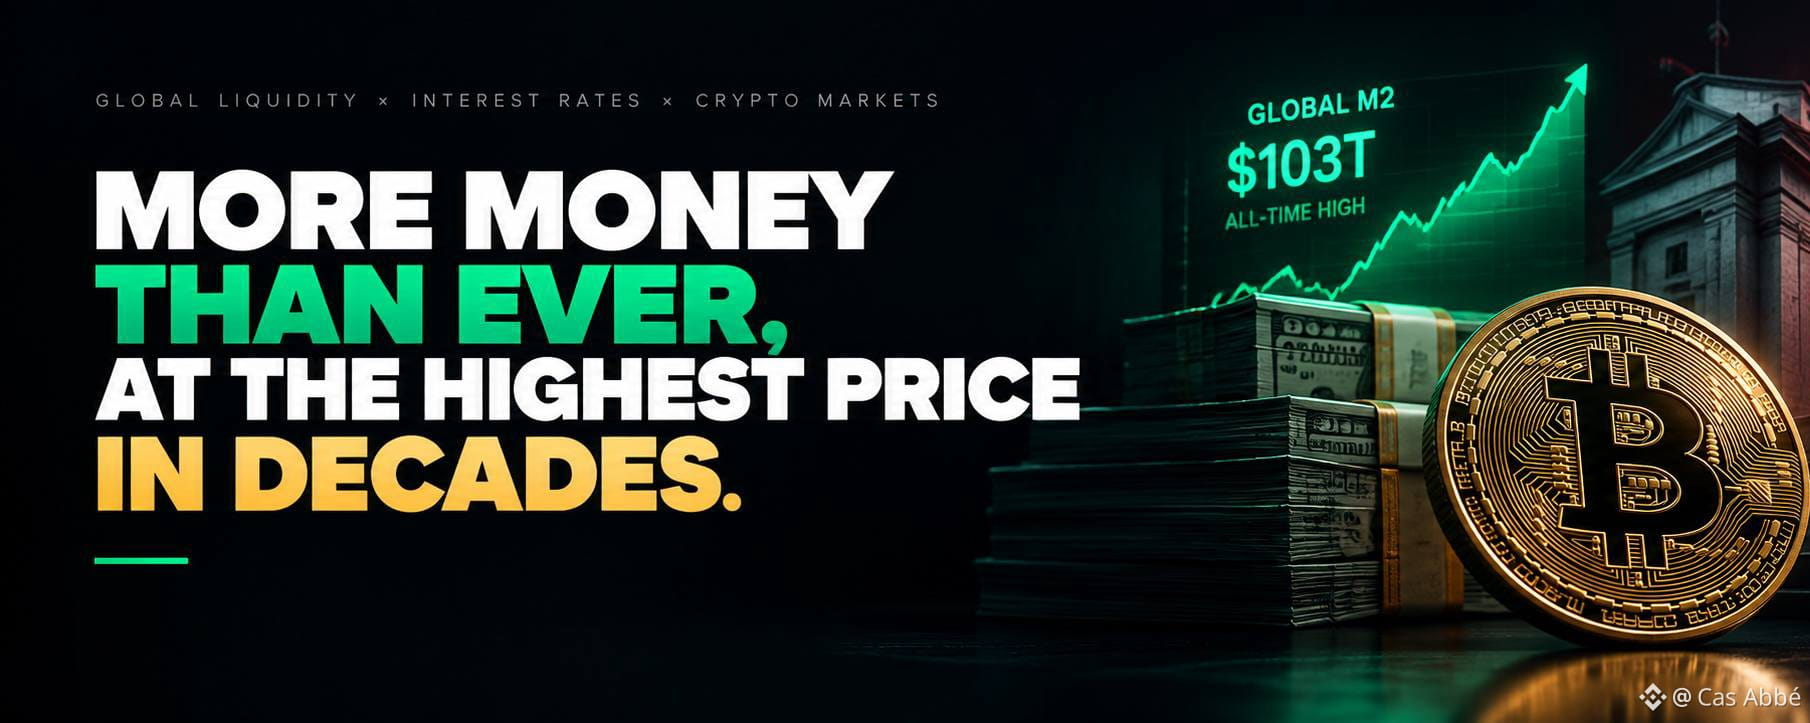
مزيد من الأموال من أي وقت مضى، بأعلى سعر منذ عقود!أكثر مخطط صعودًا وأكثر مخطط هبوطًا لهذا العام يجلسان على خطّي الزمني في نفس الوقت.
الصاعد هو مخطط السيولة العالمية (M2). وصل المعروض النقدي عبر الولايات المتحدة والصين ومنطقة اليورو واليابان إلى مستوى قياسي يقارب 103 تريليون دولار في أغسطس، بعد إضافة حوالي تريليون دولار في شهر واحد. وكان هذا هو الارتفاع الشهري العاشر على التوالي، وما زال البيتكوين يتداول بنحو 33% أقل من قمته. هذه هي النقطة التي أعود إليها دائمًا. صفقة السيولة ترتفع = البيتكوين يرتفع هي التي يعتمدها كل حساب كريبتو تقريبًا، وهذه المرة البيتكوين لا يتبع.
مزيد من الأموال من أي وقت مضى، بأعلى سعر منذ عقود!
أكثر مخطط صعودًا وأكثر مخطط هبوطًا لهذا العام يجلسان على خطّي الزمني في نفس الوقت.
الصاعد هو مخطط السيولة العالمية (M2). وصل المعروض النقدي عبر الولايات المتحدة والصين ومنطقة اليورو واليابان إلى مستوى قياسي يقارب 103 تريليون دولار في أغسطس، بعد إضافة حوالي تريليون دولار في شهر واحد. وكان هذا هو الارتفاع الشهري العاشر على التوالي، وما زال البيتكوين يتداول بنحو 33% أقل من قمته. هذه هي النقطة التي أعود إليها دائمًا. صفقة السيولة ترتفع = البيتكوين يرتفع هي التي يعتمدها كل حساب كريبتو تقريبًا، وهذه المرة البيتكوين لا يتبع.
الصاعد هو مخطط السيولة العالمية (M2). وصل المعروض النقدي عبر الولايات المتحدة والصين ومنطقة اليورو واليابان إلى مستوى قياسي يقارب 103 تريليون دولار في أغسطس، بعد إضافة حوالي تريليون دولار في شهر واحد. وكان هذا هو الارتفاع الشهري العاشر على التوالي، وما زال البيتكوين يتداول بنحو 33% أقل من قمته. هذه هي النقطة التي أعود إليها دائمًا. صفقة السيولة ترتفع = البيتكوين يرتفع هي التي يعتمدها كل حساب كريبتو تقريبًا، وهذه المرة البيتكوين لا يتبع.
44
47
7.6k
·
--
$QNT
الاختراق حقق أكثر بكثير مما كان متوقعًا.
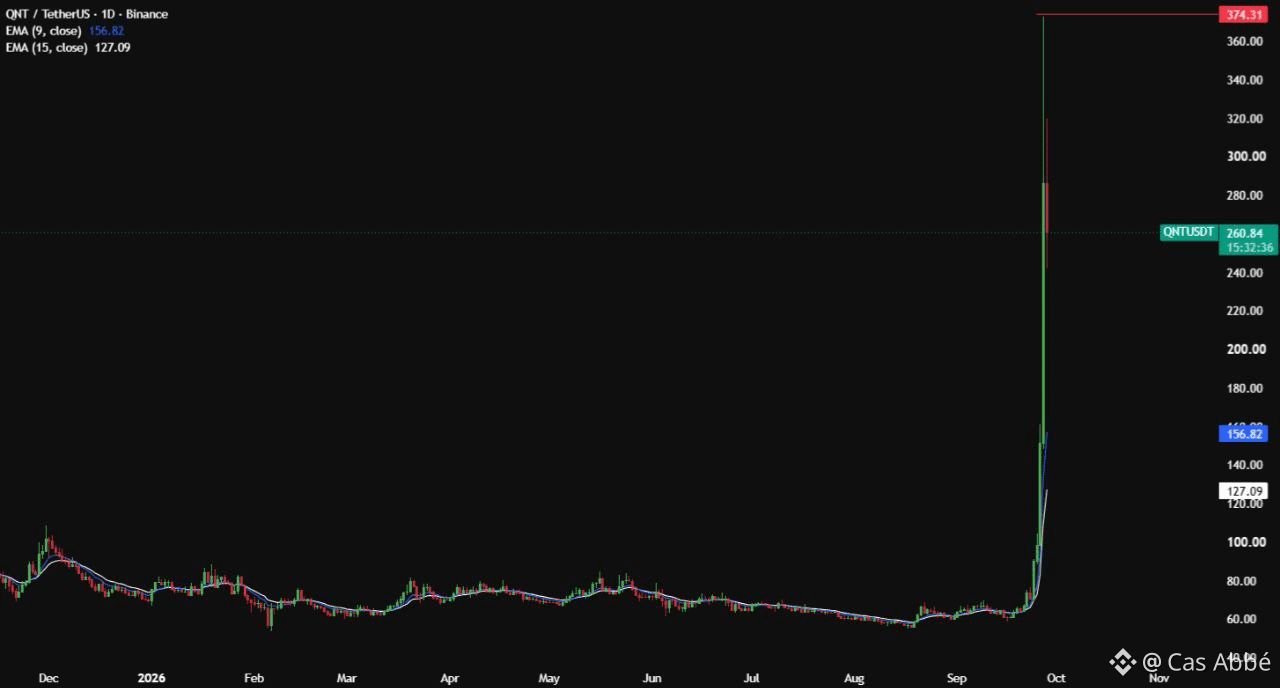
$QNT دفعت من حوالي 100 دولار إلى أكثر من 350 دولار، مع لمسٍ سريع لمنطقة 350–360 دولار، قبل أن تعود للانخفاض.
الآن المنطقة الرئيسية التي يجب مراقبتها هي 238–266 دولار كدعم، بينما تبقى منطقة 350–360 دولار هي منطقة المقاومة الرئيسية.
الزخم ما زال قويًا، لكن بعد هذه الحركة الحادة، قد تظل التقلبات مرتفعة.
#QNT #Quant #Crypto #BinanceSquare
$QNT
الاختراق حقق أكثر بكثير مما كان متوقعًا.
$QNT دفعت من حوالي 100 دولار إلى أكثر من 350 دولار، مع لمسٍ سريع لمنطقة 350–360 دولار، قبل أن تعود للانخفاض.
الآن المنطقة الرئيسية التي يجب مراقبتها هي 238–266 دولار كدعم، بينما تبقى منطقة 350–360 دولار هي منطقة المقاومة الرئيسية.
الزخم ما زال قويًا، لكن بعد هذه الحركة الحادة، قد تظل التقلبات مرتفعة.
#QNT #Quant #Crypto #BinanceSquare
الاختراق حقق أكثر بكثير مما كان متوقعًا.
$QNT دفعت من حوالي 100 دولار إلى أكثر من 350 دولار، مع لمسٍ سريع لمنطقة 350–360 دولار، قبل أن تعود للانخفاض.
الآن المنطقة الرئيسية التي يجب مراقبتها هي 238–266 دولار كدعم، بينما تبقى منطقة 350–360 دولار هي منطقة المقاومة الرئيسية.
الزخم ما زال قويًا، لكن بعد هذه الحركة الحادة، قد تظل التقلبات مرتفعة.
#QNT #Quant #Crypto #BinanceSquare
54
3
88
42.3k
·
--
#Polymarket ليس مجرد التنبؤ بالنتائج؛ بل يتعلق بتداول يغيّر الاحتمالات.
يمكن أن ينتقل السوق من 30¢ إلى 60¢ مع ورود معلومات جديدة، ما يمنح المتداولين رؤية في الوقت الفعلي لكيف تتبدّل درجة القناعة.
يمكنك شراء أو بيع المراكز قبل أن يتم حل الحدث، بينما يتم تحديد الأسعار بفعل العرض والطلب بين المشاركين في السوق.
وهذا يجعل الجزء المثير أقل متعلقًا بالتخمين مرة واحدة، وأكثر متعلقًا بمراقبة كيفية استجابة السوق للمعلومات.
أحداث مختلفة. آراء مختلفة. سوق حي واحد.
@polymarket
ليست نصيحة مالية.
#Polymarket ليس مجرد التنبؤ بالنتائج؛ بل يتعلق بتداول يغيّر الاحتمالات.
يمكن أن ينتقل السوق من 30¢ إلى 60¢ مع ورود معلومات جديدة، ما يمنح المتداولين رؤية في الوقت الفعلي لكيف تتبدّل درجة القناعة.
يمكنك شراء أو بيع المراكز قبل أن يتم حل الحدث، بينما يتم تحديد الأسعار بفعل العرض والطلب بين المشاركين في السوق.
وهذا يجعل الجزء المثير أقل متعلقًا بالتخمين مرة واحدة، وأكثر متعلقًا بمراقبة كيفية استجابة السوق للمعلومات.
أحداث مختلفة. آراء مختلفة. سوق حي واحد.
@Polymarket
ليست نصيحة مالية.
يمكن أن ينتقل السوق من 30¢ إلى 60¢ مع ورود معلومات جديدة، ما يمنح المتداولين رؤية في الوقت الفعلي لكيف تتبدّل درجة القناعة.
يمكنك شراء أو بيع المراكز قبل أن يتم حل الحدث، بينما يتم تحديد الأسعار بفعل العرض والطلب بين المشاركين في السوق.
وهذا يجعل الجزء المثير أقل متعلقًا بالتخمين مرة واحدة، وأكثر متعلقًا بمراقبة كيفية استجابة السوق للمعلومات.
أحداث مختلفة. آراء مختلفة. سوق حي واحد.
@Polymarket
ليست نصيحة مالية.
54
1
68
11.4k
·
--
تمّ التحقق
أضافت Acurast للتو طبقة أخرى من الشفافية إلى $ACU .
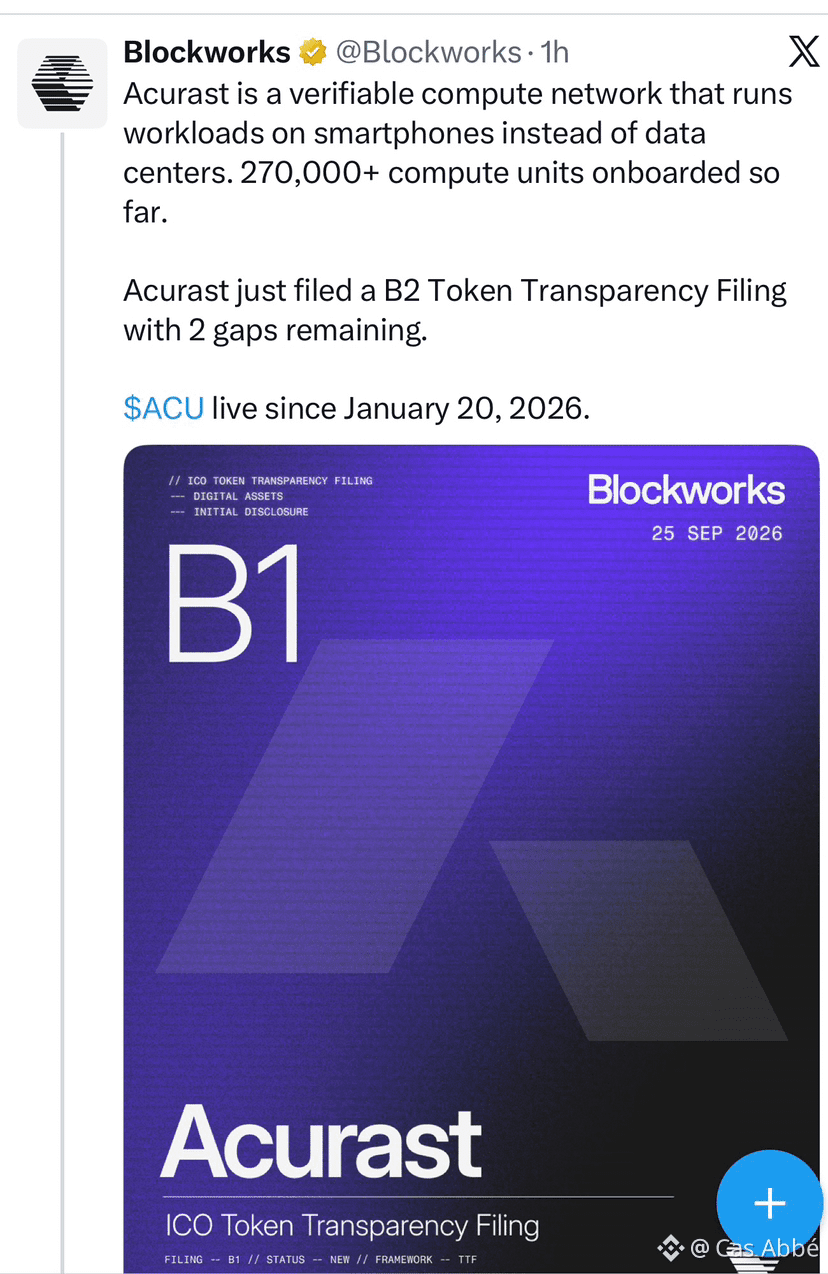
نشر الفريق وثيقة شفافية رمز ACU الخاصة به عبر إطار شفافية رموز Blockworks Token Transparency Framework، والتي تغطي تخصيص الرموز، والجدولة الزمنية للانقضاء (الاستحقاق)، والحوكمة، وضوابط الإدارة.
بالنسبة للمجتمع، فإن توفر هذه التفاصيل علنًا يجعل من السهل التحقق من بنية الرمز الأساسية بدلًا من الاعتماد فقط على السرديات.
لا تثق. تحقّق. 👀
المصدر: Acurast / Blockworks
أضافت Acurast للتو طبقة أخرى من الشفافية إلى $ACU .
نشر الفريق وثيقة شفافية رمز ACU الخاصة به عبر إطار شفافية رموز Blockworks Token Transparency Framework، والتي تغطي تخصيص الرموز، والجدولة الزمنية للانقضاء (الاستحقاق)، والحوكمة، وضوابط الإدارة.
بالنسبة للمجتمع، فإن توفر هذه التفاصيل علنًا يجعل من السهل التحقق من بنية الرمز الأساسية بدلًا من الاعتماد فقط على السرديات.
لا تثق. تحقّق. 👀
المصدر: Acurast / Blockworks
نشر الفريق وثيقة شفافية رمز ACU الخاصة به عبر إطار شفافية رموز Blockworks Token Transparency Framework، والتي تغطي تخصيص الرموز، والجدولة الزمنية للانقضاء (الاستحقاق)، والحوكمة، وضوابط الإدارة.
بالنسبة للمجتمع، فإن توفر هذه التفاصيل علنًا يجعل من السهل التحقق من بنية الرمز الأساسية بدلًا من الاعتماد فقط على السرديات.
لا تثق. تحقّق. 👀
المصدر: Acurast / Blockworks
50
1
47
9k
·
--
مقالة
BITCOIN JUST RECLAIMED $85K NOW I’M WATCHING OCTOBERبصراحة، أعتقد أن السوق بدأ يبدو مختلفاً جداً عما كان عليه قبل بضعة أسابيع.
عاد البيتكوين إلى ما فوق 85 ألف دولار بعد أن دفع لفترة وجيزة فوق 86 ألف دولار، بينما استعادت إيثريوم 2,700 دولار. ما لفت انتباهي هو أن بيتكوين تفعل ذلك بعد قضاء أسابيع في التعامل مع رفع أسعار الفائدة، وعدم اليقين التنظيمي، وضغط بيع قوي. دفعة الصعود الأخيرة أيضاً دفعت البيتكوين إلى أعلى مستوى خلال ثمانية أشهر.
لكن السعر هو نصف القصة فقط.
الأموال الداخلة إلى السوق تصبح الآن أصعب في تجاهلها. فقد سحبت صناديق بيتكوين الفورية الأمريكية 190.7 مليون دولار إضافية في 24 سبتمبر، بينما أضافت صناديق إيثريوم 66.1 مليون دولار. وقد سجلت صناديق البيتكوين الآن ست جلسات متتالية من التدفقات الداخلة، مع امتداد السلسلة إلى أكثر من 2.8 مليار دولار.
BITCOIN JUST RECLAIMED $85K NOW I’M WATCHING OCTOBER
بصراحة، أعتقد أن السوق بدأ يبدو مختلفاً جداً عما كان عليه قبل بضعة أسابيع.
عاد البيتكوين إلى ما فوق 85 ألف دولار بعد أن دفع لفترة وجيزة فوق 86 ألف دولار، بينما استعادت إيثريوم 2,700 دولار. ما لفت انتباهي هو أن بيتكوين تفعل ذلك بعد قضاء أسابيع في التعامل مع رفع أسعار الفائدة، وعدم اليقين التنظيمي، وضغط بيع قوي. دفعة الصعود الأخيرة أيضاً دفعت البيتكوين إلى أعلى مستوى خلال ثمانية أشهر.
لكن السعر هو نصف القصة فقط.
الأموال الداخلة إلى السوق تصبح الآن أصعب في تجاهلها. فقد سحبت صناديق بيتكوين الفورية الأمريكية 190.7 مليون دولار إضافية في 24 سبتمبر، بينما أضافت صناديق إيثريوم 66.1 مليون دولار. وقد سجلت صناديق البيتكوين الآن ست جلسات متتالية من التدفقات الداخلة، مع امتداد السلسلة إلى أكثر من 2.8 مليار دولار.
عاد البيتكوين إلى ما فوق 85 ألف دولار بعد أن دفع لفترة وجيزة فوق 86 ألف دولار، بينما استعادت إيثريوم 2,700 دولار. ما لفت انتباهي هو أن بيتكوين تفعل ذلك بعد قضاء أسابيع في التعامل مع رفع أسعار الفائدة، وعدم اليقين التنظيمي، وضغط بيع قوي. دفعة الصعود الأخيرة أيضاً دفعت البيتكوين إلى أعلى مستوى خلال ثمانية أشهر.
لكن السعر هو نصف القصة فقط.
الأموال الداخلة إلى السوق تصبح الآن أصعب في تجاهلها. فقد سحبت صناديق بيتكوين الفورية الأمريكية 190.7 مليون دولار إضافية في 24 سبتمبر، بينما أضافت صناديق إيثريوم 66.1 مليون دولار. وقد سجلت صناديق البيتكوين الآن ست جلسات متتالية من التدفقات الداخلة، مع امتداد السلسلة إلى أكثر من 2.8 مليار دولار.
42
47
7.6k
·
--
$CNPY
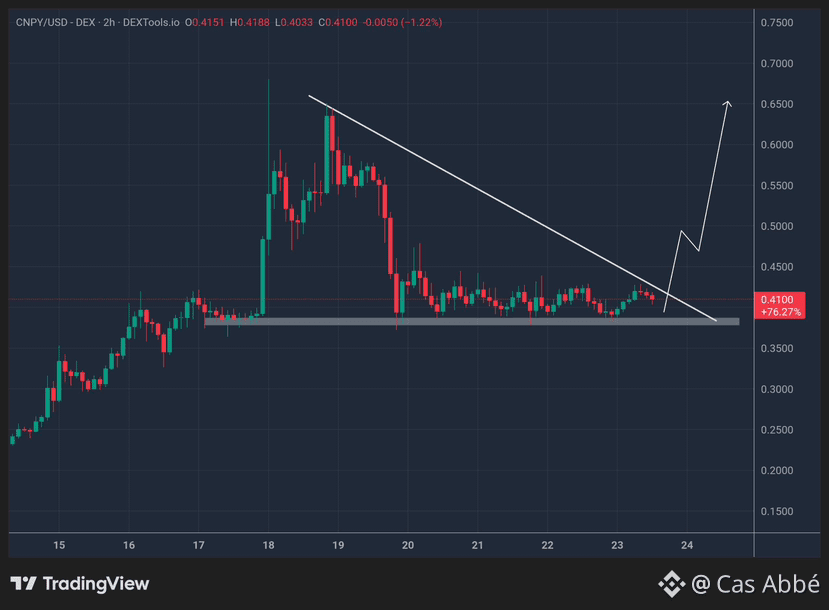
كنت أُلقِي نظرة على الرسم لمدة ساعتين (2h) في هذه الحالة، وبصراحة يبدو الأمر جيدًا.
خصم 76% عن أدنى مستوى مؤخرًا، ويتمّ عصره أكثر فأكثر باتجاه خط الاتجاه الذي يستقر حول 0.41.
يمكنك فقط أن ترى أن الملف يتجمّع.
ما يعجبني في التصحيح من 0.65 هو أنه لم يكن بيعًا هلعًا. قمم أقل، نعم، لكن القاعدة تتسطّح بشكل جميل. هذا غالبًا يعني أن البائعين نفدت منهم الذخيرة، وليس أن المزيد من الألم قادم.
سياق سريع لأي شخص يرى هذا الآن: تتيح شركة Canopy للمطورين تشغيل بلوكتشينهم الخاص في حوالي 200 سطر من الكود، دون الحاجة إلى تهيئة المُصدّقين (validators) من الصفر. الفريق لديه 8.5 مليون دولار خلفه (Arrington, Fenbushi, Borderless، وآخرون)، وهم بالفعل على Binance Alpha، وخطوتهم التالية هي mainnet.
هذا هو المحفّز الحقيقي هنا 👏🏻
إغلاق نظيف فوق خط الاتجاه، تقريبًا 0.45، وأعتقد أن هذا سيتحرك. إلى أن يحدث ذلك، لن أتعامل معه—مجرد متابعة.
DYOR
$CNPY
كنت أُلقِي نظرة على الرسم لمدة ساعتين (2h) في هذه الحالة، وبصراحة يبدو الأمر جيدًا.
خصم 76% عن أدنى مستوى مؤخرًا، ويتمّ عصره أكثر فأكثر باتجاه خط الاتجاه الذي يستقر حول 0.41.
يمكنك فقط أن ترى أن الملف يتجمّع.
ما يعجبني في التصحيح من 0.65 هو أنه لم يكن بيعًا هلعًا. قمم أقل، نعم، لكن القاعدة تتسطّح بشكل جميل. هذا غالبًا يعني أن البائعين نفدت منهم الذخيرة، وليس أن المزيد من الألم قادم.
سياق سريع لأي شخص يرى هذا الآن: تتيح شركة Canopy للمطورين تشغيل بلوكتشينهم الخاص في حوالي 200 سطر من الكود، دون الحاجة إلى تهيئة المُصدّقين (validators) من الصفر. الفريق لديه 8.5 مليون دولار خلفه (Arrington, Fenbushi, Borderless، وآخرون)، وهم بالفعل على Binance Alpha، وخطوتهم التالية هي mainnet.
هذا هو المحفّز الحقيقي هنا 👏🏻
إغلاق نظيف فوق خط الاتجاه، تقريبًا 0.45، وأعتقد أن هذا سيتحرك. إلى أن يحدث ذلك، لن أتعامل معه—مجرد متابعة.
DYOR
كنت أُلقِي نظرة على الرسم لمدة ساعتين (2h) في هذه الحالة، وبصراحة يبدو الأمر جيدًا.
خصم 76% عن أدنى مستوى مؤخرًا، ويتمّ عصره أكثر فأكثر باتجاه خط الاتجاه الذي يستقر حول 0.41.
يمكنك فقط أن ترى أن الملف يتجمّع.
ما يعجبني في التصحيح من 0.65 هو أنه لم يكن بيعًا هلعًا. قمم أقل، نعم، لكن القاعدة تتسطّح بشكل جميل. هذا غالبًا يعني أن البائعين نفدت منهم الذخيرة، وليس أن المزيد من الألم قادم.
سياق سريع لأي شخص يرى هذا الآن: تتيح شركة Canopy للمطورين تشغيل بلوكتشينهم الخاص في حوالي 200 سطر من الكود، دون الحاجة إلى تهيئة المُصدّقين (validators) من الصفر. الفريق لديه 8.5 مليون دولار خلفه (Arrington, Fenbushi, Borderless، وآخرون)، وهم بالفعل على Binance Alpha، وخطوتهم التالية هي mainnet.
هذا هو المحفّز الحقيقي هنا 👏🏻
إغلاق نظيف فوق خط الاتجاه، تقريبًا 0.45، وأعتقد أن هذا سيتحرك. إلى أن يحدث ذلك، لن أتعامل معه—مجرد متابعة.
DYOR
52
58
11.5k
·
--
#Polymarket من المثير للاهتمام لأن السوق نفسه يروي قصة.
بدلًا من انتظار العناوين الرئيسية، يمكنك مشاهدة المتداولين وهم يحددون أسعار سيناريوهات مختلفة باستمرار في الوقت الفعلي.
إن كانت صفقة YES تنتقل من 30¢ إلى 55¢، فهذا ليس مجرد رقم—بل يوضح تغيّر قناعة السوق.
الميزة الحقيقية هي مراقبة متى يتبدّل الشعور، وإلى أين تتحرك السيولة، ومدى سرعة استجابة السوق لمعلومات جديدة.
وهذا يجعل Polymarket أكثر من مجرد منصة للتنبؤات. إنها تتطور لتصبح مكانًا لتتبع القناعة في الوقت الفعلي عبر العملات المشفرة والماكرو والرياضة وغيرها.
يستحق أن تراقبه. 👀
ليس نصيحة مالية.
@polymarket
#btc
#Polymarket من المثير للاهتمام لأن السوق نفسه يروي قصة.
بدلًا من انتظار العناوين الرئيسية، يمكنك مشاهدة المتداولين وهم يحددون أسعار سيناريوهات مختلفة باستمرار في الوقت الفعلي.
إن كانت صفقة YES تنتقل من 30¢ إلى 55¢، فهذا ليس مجرد رقم—بل يوضح تغيّر قناعة السوق.
الميزة الحقيقية هي مراقبة متى يتبدّل الشعور، وإلى أين تتحرك السيولة، ومدى سرعة استجابة السوق لمعلومات جديدة.
وهذا يجعل Polymarket أكثر من مجرد منصة للتنبؤات. إنها تتطور لتصبح مكانًا لتتبع القناعة في الوقت الفعلي عبر العملات المشفرة والماكرو والرياضة وغيرها.
يستحق أن تراقبه. 👀
ليس نصيحة مالية.
@Polymarket
#btc
بدلًا من انتظار العناوين الرئيسية، يمكنك مشاهدة المتداولين وهم يحددون أسعار سيناريوهات مختلفة باستمرار في الوقت الفعلي.
إن كانت صفقة YES تنتقل من 30¢ إلى 55¢، فهذا ليس مجرد رقم—بل يوضح تغيّر قناعة السوق.
الميزة الحقيقية هي مراقبة متى يتبدّل الشعور، وإلى أين تتحرك السيولة، ومدى سرعة استجابة السوق لمعلومات جديدة.
وهذا يجعل Polymarket أكثر من مجرد منصة للتنبؤات. إنها تتطور لتصبح مكانًا لتتبع القناعة في الوقت الفعلي عبر العملات المشفرة والماكرو والرياضة وغيرها.
يستحق أن تراقبه. 👀
ليس نصيحة مالية.
@Polymarket
#btc
48
52
9.2k
·
--
$AEVO لا يزال اسمًا مثيرًا للاهتمام ضمن سباق المشتقات على السلسلة.
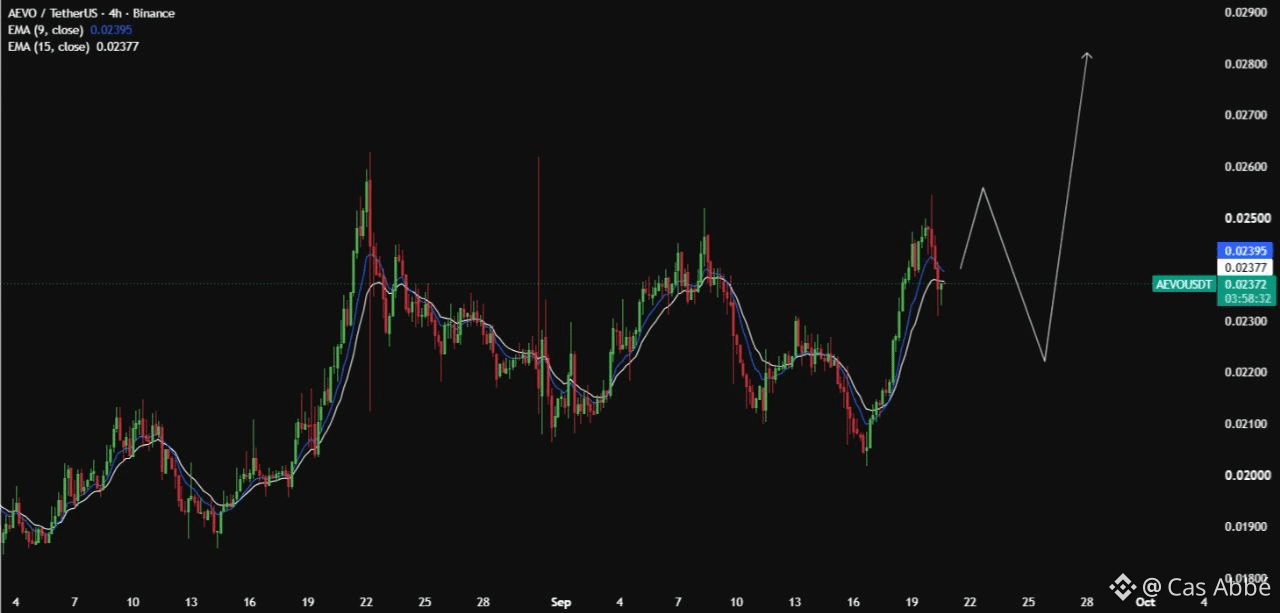
مع $HYPE ، وGMX، و$DYDX وJUP التي تتنافس على جذب المتداولين، تتخذ Aevo مسارًا مختلفًا عبر دمج العقود الدائمة والخيارات والمنتجات المهيكلة في نظام تداول واحد.
ما يعجبني في هذا الإعداد هو التركيز على تقديم تجربة تداول أكثر ألفة على السلسلة مع الحفاظ في الوقت نفسه على البنية التحتية الواسعة لمنظومة DeFi تحتها.
سوق المشتقات يصبح أكثر تنافسية، لذلك ستصبح عوامل التنفيذ والسيولة وعمق المنتجات أكثر أهمية من الضجيج.
@Aevoxyz بالتأكيد واحد سأبقيه ضمن دائرة الضوء. 👀
ليست نصيحة مالية.
#btc
$AEVO لا يزال اسمًا مثيرًا للاهتمام ضمن سباق المشتقات على السلسلة.
مع $HYPE ، وGMX، و$DYDX وJUP التي تتنافس على جذب المتداولين، تتخذ Aevo مسارًا مختلفًا عبر دمج العقود الدائمة والخيارات والمنتجات المهيكلة في نظام تداول واحد.
ما يعجبني في هذا الإعداد هو التركيز على تقديم تجربة تداول أكثر ألفة على السلسلة مع الحفاظ في الوقت نفسه على البنية التحتية الواسعة لمنظومة DeFi تحتها.
سوق المشتقات يصبح أكثر تنافسية، لذلك ستصبح عوامل التنفيذ والسيولة وعمق المنتجات أكثر أهمية من الضجيج.
@Aevo بالتأكيد واحد سأبقيه ضمن دائرة الضوء. 👀
ليست نصيحة مالية.
#btc
مع $HYPE ، وGMX، و$DYDX وJUP التي تتنافس على جذب المتداولين، تتخذ Aevo مسارًا مختلفًا عبر دمج العقود الدائمة والخيارات والمنتجات المهيكلة في نظام تداول واحد.
ما يعجبني في هذا الإعداد هو التركيز على تقديم تجربة تداول أكثر ألفة على السلسلة مع الحفاظ في الوقت نفسه على البنية التحتية الواسعة لمنظومة DeFi تحتها.
سوق المشتقات يصبح أكثر تنافسية، لذلك ستصبح عوامل التنفيذ والسيولة وعمق المنتجات أكثر أهمية من الضجيج.
@Aevo بالتأكيد واحد سأبقيه ضمن دائرة الضوء. 👀
ليست نصيحة مالية.
#btc
40
46
8.1k
·
--
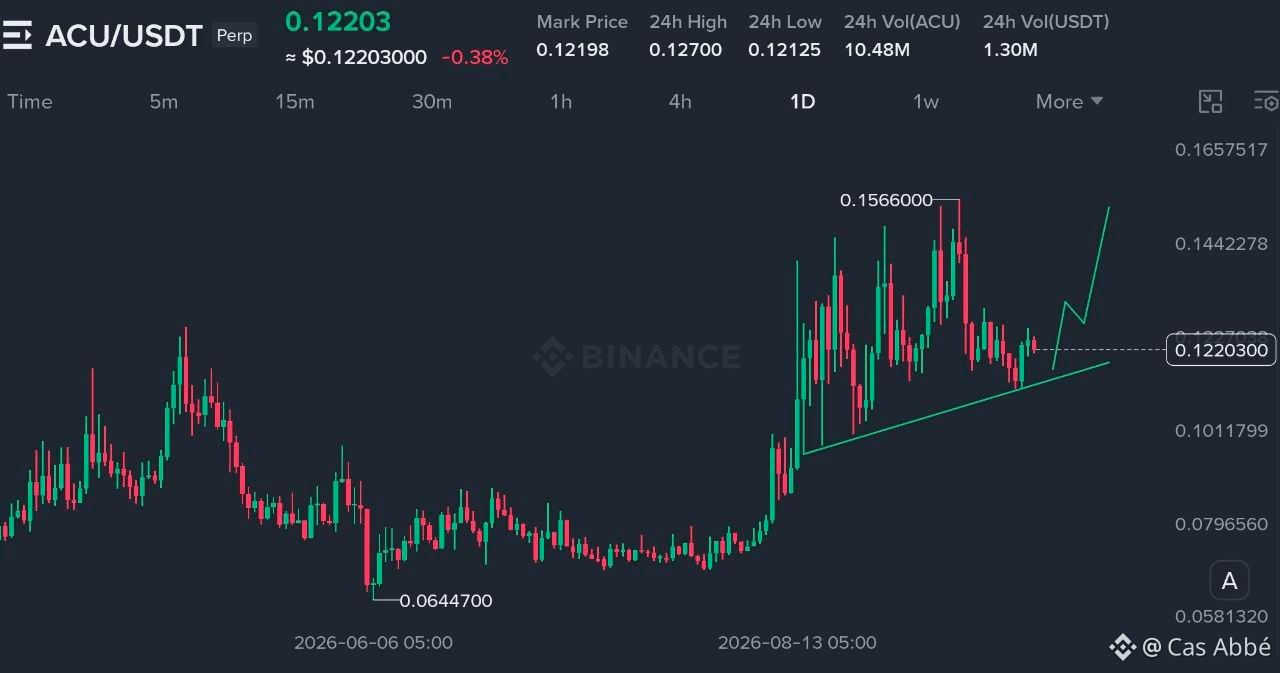
$ACU يعرض بنية سوق مثيرة للاهتمام.
يستمر السعر في التحرك فوق خط اتجاه دعم صاعد، مع اختبار متكرر لمنطقة المقاومة $0.127.
مستويات رئيسية للمراقبة:
• الدعم: $0.115–$0.120
• المقاومة: $0.127
• المقاومة الرئيسية: $0.145–$0.156
قد يؤدي اختراق مستمر فوق المقاومة إلى تغيير البنية قصيرة الأجل، بينما قد يشير الانخفاض تحت الدعم إلى الضعف.
انتظر دائمًا التأكيد بدلًا من مطاردة أول اختراق.
$ACU يعرض بنية سوق مثيرة للاهتمام.
يستمر السعر في التحرك فوق خط اتجاه دعم صاعد، مع اختبار متكرر لمنطقة المقاومة $0.127.
مستويات رئيسية للمراقبة:
• الدعم: $0.115–$0.120
• المقاومة: $0.127
• المقاومة الرئيسية: $0.145–$0.156
قد يؤدي اختراق مستمر فوق المقاومة إلى تغيير البنية قصيرة الأجل، بينما قد يشير الانخفاض تحت الدعم إلى الضعف.
انتظر دائمًا التأكيد بدلًا من مطاردة أول اختراق.
يستمر السعر في التحرك فوق خط اتجاه دعم صاعد، مع اختبار متكرر لمنطقة المقاومة $0.127.
مستويات رئيسية للمراقبة:
• الدعم: $0.115–$0.120
• المقاومة: $0.127
• المقاومة الرئيسية: $0.145–$0.156
قد يؤدي اختراق مستمر فوق المقاومة إلى تغيير البنية قصيرة الأجل، بينما قد يشير الانخفاض تحت الدعم إلى الضعف.
انتظر دائمًا التأكيد بدلًا من مطاردة أول اختراق.
39
48
7k
·
--
مقالة
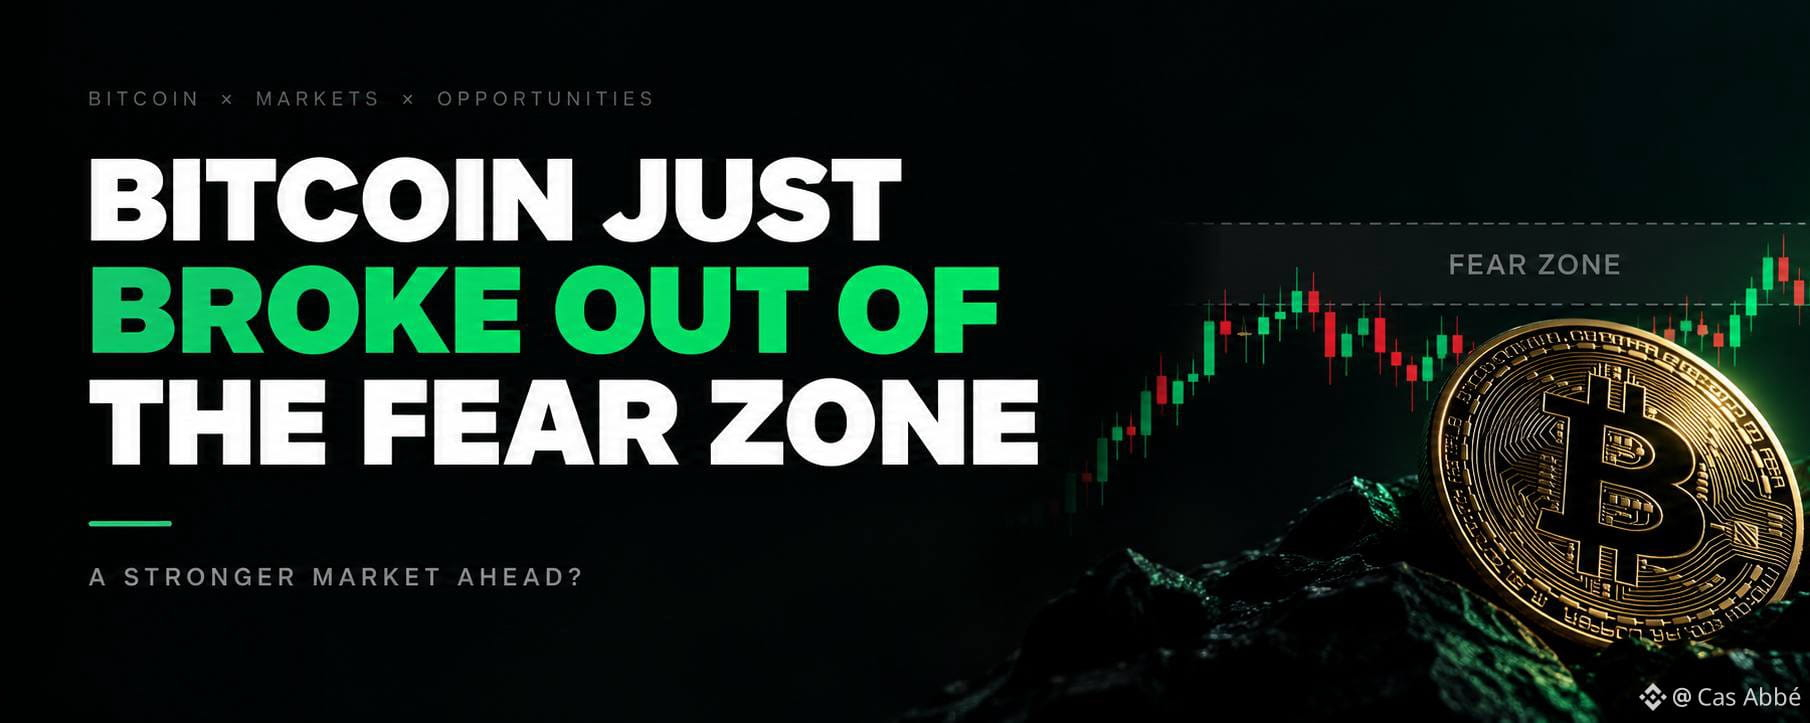
BITCOIN JUST BROKE OUT OF THE FEAR ZONEهذا النوع من التحركات يجعلني أُعير اهتمامًا.
قبل أيام قليلة، كان البيتكوين يتداول قرب 75 ألف دولار بعد فشل قانون CLARITY في مجلس الشيوخ، كما قدّمت الاحتياطي الفيدرالي أول زيادة في أسعار الفائدة له منذ 2023. واليوم، دفعت عملة البيتكوين عوائدها مرة أخرى نحو 81 ألف دولار، في حين صعدت SOL إلى ما فوق 110 آلاف دولار، وتحرك سوق العملات البديلة مجددًا فوق 220 مليار دولار.
ما الذي تغيّر؟
أدرك السوق أن قصة التنظيم لم تنتهِ مع قانون CLARITY.
لقد أرسلت هيئة تداول السلع الآجلة والعقود الآجلة (CFTC) الآن مسودتها لقواعد أسواق العملات المشفرة إلى البيت الأبيض للمراجعة، وواصلت عملية وضع القواعد حتى بعد تعثرها في مجلس الشيوخ. كما أدخلت هيئة الأوراق المالية والبورصات (SEC) إطار إعفاء لمدة خمس سنوات للمنصات التي تتداول أسهمًا مُرمّزة على البلوك تشين، مع اشتراط أن تحمل هذه الرموز الحقوق نفسها للمساهمين مثل الأسهم الأساسية.
BITCOIN JUST BROKE OUT OF THE FEAR ZONE
هذا النوع من التحركات يجعلني أُعير اهتمامًا.
قبل أيام قليلة، كان البيتكوين يتداول قرب 75 ألف دولار بعد فشل قانون CLARITY في مجلس الشيوخ، كما قدّمت الاحتياطي الفيدرالي أول زيادة في أسعار الفائدة له منذ 2023. واليوم، دفعت عملة البيتكوين عوائدها مرة أخرى نحو 81 ألف دولار، في حين صعدت SOL إلى ما فوق 110 آلاف دولار، وتحرك سوق العملات البديلة مجددًا فوق 220 مليار دولار.
ما الذي تغيّر؟
أدرك السوق أن قصة التنظيم لم تنتهِ مع قانون CLARITY.
لقد أرسلت هيئة تداول السلع الآجلة والعقود الآجلة (CFTC) الآن مسودتها لقواعد أسواق العملات المشفرة إلى البيت الأبيض للمراجعة، وواصلت عملية وضع القواعد حتى بعد تعثرها في مجلس الشيوخ. كما أدخلت هيئة الأوراق المالية والبورصات (SEC) إطار إعفاء لمدة خمس سنوات للمنصات التي تتداول أسهمًا مُرمّزة على البلوك تشين، مع اشتراط أن تحمل هذه الرموز الحقوق نفسها للمساهمين مثل الأسهم الأساسية.
قبل أيام قليلة، كان البيتكوين يتداول قرب 75 ألف دولار بعد فشل قانون CLARITY في مجلس الشيوخ، كما قدّمت الاحتياطي الفيدرالي أول زيادة في أسعار الفائدة له منذ 2023. واليوم، دفعت عملة البيتكوين عوائدها مرة أخرى نحو 81 ألف دولار، في حين صعدت SOL إلى ما فوق 110 آلاف دولار، وتحرك سوق العملات البديلة مجددًا فوق 220 مليار دولار.
ما الذي تغيّر؟
أدرك السوق أن قصة التنظيم لم تنتهِ مع قانون CLARITY.
لقد أرسلت هيئة تداول السلع الآجلة والعقود الآجلة (CFTC) الآن مسودتها لقواعد أسواق العملات المشفرة إلى البيت الأبيض للمراجعة، وواصلت عملية وضع القواعد حتى بعد تعثرها في مجلس الشيوخ. كما أدخلت هيئة الأوراق المالية والبورصات (SEC) إطار إعفاء لمدة خمس سنوات للمنصات التي تتداول أسهمًا مُرمّزة على البلوك تشين، مع اشتراط أن تحمل هذه الرموز الحقوق نفسها للمساهمين مثل الأسهم الأساسية.
35
40
6.9k
·
--
تمّ التحقق
@polymarket بدأ يبدو أقل كونه مجرد منصة تنبؤات وأكثر كونه سوق معلومات في الوقت الحقيقي.
في الوقت الحالي، يمكنك العثور على أسواق مباشرة حول مستويات سعر BTC، $ETH ، $SOL ، XRP، والبيانات الكلية والأحداث المالية الكبرى، مع تدفق ملايين الدولارات عبر أسواق فردية.
ما أراه مثيرًا للاهتمام هو السرعة التي تتفاعل بها هذه الاحتمالات.
تأتي معلومات جديدة → يعيد المتداولون التموضع → يتغير احتمال السوق.
والآن #Polymarket يتوسع خارج أسواق الأحداث مع صفقات Perps عبر العملات المشفرة والأسهم والمؤشرات والسلع، مما يضيف طبقة أخرى من التداول النشط إلى المنصة.
هذا المزيج من أسواق التنبؤات + التداول في الوقت الحقيقي يجعل #Polymarket إحدى المنصات التي أتابعها عن كثب.
ومع نمو قطاع #prediction ، يبقى السؤال الحقيقي: إلى أي مدى يمكن أن تنتقل معلومات السوق التقليدية في النهاية إلى السلسلة (on-chain).
ليس نصيحة مالية.
@Polymarket بدأ يبدو أقل كونه مجرد منصة تنبؤات وأكثر كونه سوق معلومات في الوقت الحقيقي.
في الوقت الحالي، يمكنك العثور على أسواق مباشرة حول مستويات سعر BTC، $ETH ، $SOL ، XRP، والبيانات الكلية والأحداث المالية الكبرى، مع تدفق ملايين الدولارات عبر أسواق فردية.
ما أراه مثيرًا للاهتمام هو السرعة التي تتفاعل بها هذه الاحتمالات.
تأتي معلومات جديدة → يعيد المتداولون التموضع → يتغير احتمال السوق.
والآن #Polymarket يتوسع خارج أسواق الأحداث مع صفقات Perps عبر العملات المشفرة والأسهم والمؤشرات والسلع، مما يضيف طبقة أخرى من التداول النشط إلى المنصة.
هذا المزيج من أسواق التنبؤات + التداول في الوقت الحقيقي يجعل #Polymarket إحدى المنصات التي أتابعها عن كثب.
ومع نمو قطاع #prediction ، يبقى السؤال الحقيقي: إلى أي مدى يمكن أن تنتقل معلومات السوق التقليدية في النهاية إلى السلسلة (on-chain).
ليس نصيحة مالية.
في الوقت الحالي، يمكنك العثور على أسواق مباشرة حول مستويات سعر BTC، $ETH ، $SOL ، XRP، والبيانات الكلية والأحداث المالية الكبرى، مع تدفق ملايين الدولارات عبر أسواق فردية.
ما أراه مثيرًا للاهتمام هو السرعة التي تتفاعل بها هذه الاحتمالات.
تأتي معلومات جديدة → يعيد المتداولون التموضع → يتغير احتمال السوق.
والآن #Polymarket يتوسع خارج أسواق الأحداث مع صفقات Perps عبر العملات المشفرة والأسهم والمؤشرات والسلع، مما يضيف طبقة أخرى من التداول النشط إلى المنصة.
هذا المزيج من أسواق التنبؤات + التداول في الوقت الحقيقي يجعل #Polymarket إحدى المنصات التي أتابعها عن كثب.
ومع نمو قطاع #prediction ، يبقى السؤال الحقيقي: إلى أي مدى يمكن أن تنتقل معلومات السوق التقليدية في النهاية إلى السلسلة (on-chain).
ليس نصيحة مالية.

29
36
5.8k
·
--
تمّ التحقق
لقد اعتقدت دائمًا أن أصعب جزء في تداول العملات منخفضة القيمة هو العثور على الخطوة التالية. اتضح أن الأمر يتعلق بمعرفة ما الذي تشتريه فعليًا.
Bubblemaps أطلق للتو تحديثًا شاملًا للمنصة، وليس مجرد تغيير شكلها الخارجي.
بل يغيّر طريقتي في البحث عن التوكنات. كنت أفتح خمس تبويبات: واحد للـ chart، واحد لخريطة الفقاعات، واحد للتحقق من الـ launchpad، واحد للتجسس على الحسابات الاجتماعية، وواحد للتبديل فعليًا. والآن… تبويب واحد فقط.
افتحت التغذية الجديدة/المتجهة Trending أولًا (Arc متاح عليها منذ اليوم الأول، مع السلاسل المعتادة) وبدأت التمرير فوق التوكنات قبل أن أنقر حتى. يعرض خريطة فقاعات فورية فورًا، دون تحميل صفحة، ودون تبويب منفصل. وحده هذا كان سيجنبني من توكنين اندفعت إليهما أعمى الشهر الماضي.
الجزء الذي أوقفني فعليًا: النقر على شمعة. أي شمعة. يعرض لك توزيع الحَمَلَة في تلك اللحظة بالضبط، ليس “الآن”، بل عند النقطة في الرسم البياني التي حدث فيها الضخ أو الهبوط. هذه هي الفروقات بين أن يكون الأمر مجرد “مجمّع شكليًا” وبين أن أرى المحافظ التي جمّعته.
ملخص سريع لما يوجد فعليًا هناك:
↳ درجة Bubblemaps، تحدد التجمعات الداخلية والمحافظ التي جُمّعت قبل أن تشتري
↳ فلاتر حسب السلسلة، وlaunchpad، والسعر، والحجم، والسيولة
↳ حسابات اجتماعية للمشاريع تم التحقق منها/مراجعتها، حتى لا تضطر للثقة برابط عشوائي
↳ تسميات المحافظ التي تمت مراجعتها بواسطة خبراء تحليل على السلسلة، وليست مجرد تخمين بخوارزمية
↳ تبديل مدمج بنسبة 0.5%، وهي أقل نسبة رأيتها في أي مكان
↳ تعزيز داخل التطبيق إذا كنت تريد أن يتم بالفعل اكتشاف التوكن
الفكرة كاملة هي أن تستطيع العثور على التوكنات وفحصها وشرائها دون مغادرة المنصة، مع فلترة الأشياء الخطرة قبل أن تشتريها حتى. بعد استخدامه لمدة ساعة، فهمت لماذا هذا أهم مما يبدو. كل تبويب إضافي تفتحه هو فرصة لتفويت الشيء الذي كان مهمًا.
أختبره بشكل صحيح هذا الأسبوع. إذا كنت ما زلت تجد التوكنات في تطبيق وتفحصها في تطبيق آخر، فأنت تقوم بذلك بالطريقة البطيئة.
@bubblemaps $BMT
لقد اعتقدت دائمًا أن أصعب جزء في تداول العملات منخفضة القيمة هو العثور على الخطوة التالية. اتضح أن الأمر يتعلق بمعرفة ما الذي تشتريه فعليًا.
Bubblemaps أطلق للتو تحديثًا شاملًا للمنصة، وليس مجرد تغيير شكلها الخارجي.
بل يغيّر طريقتي في البحث عن التوكنات. كنت أفتح خمس تبويبات: واحد للـ chart، واحد لخريطة الفقاعات، واحد للتحقق من الـ launchpad، واحد للتجسس على الحسابات الاجتماعية، وواحد للتبديل فعليًا. والآن… تبويب واحد فقط.
افتحت التغذية الجديدة/المتجهة Trending أولًا (Arc متاح عليها منذ اليوم الأول، مع السلاسل المعتادة) وبدأت التمرير فوق التوكنات قبل أن أنقر حتى. يعرض خريطة فقاعات فورية فورًا، دون تحميل صفحة، ودون تبويب منفصل. وحده هذا كان سيجنبني من توكنين اندفعت إليهما أعمى الشهر الماضي.
الجزء الذي أوقفني فعليًا: النقر على شمعة. أي شمعة. يعرض لك توزيع الحَمَلَة في تلك اللحظة بالضبط، ليس “الآن”، بل عند النقطة في الرسم البياني التي حدث فيها الضخ أو الهبوط. هذه هي الفروقات بين أن يكون الأمر مجرد “مجمّع شكليًا” وبين أن أرى المحافظ التي جمّعته.
ملخص سريع لما يوجد فعليًا هناك:
↳ درجة Bubblemaps، تحدد التجمعات الداخلية والمحافظ التي جُمّعت قبل أن تشتري
↳ فلاتر حسب السلسلة، وlaunchpad، والسعر، والحجم، والسيولة
↳ حسابات اجتماعية للمشاريع تم التحقق منها/مراجعتها، حتى لا تضطر للثقة برابط عشوائي
↳ تسميات المحافظ التي تمت مراجعتها بواسطة خبراء تحليل على السلسلة، وليست مجرد تخمين بخوارزمية
↳ تبديل مدمج بنسبة 0.5%، وهي أقل نسبة رأيتها في أي مكان
↳ تعزيز داخل التطبيق إذا كنت تريد أن يتم بالفعل اكتشاف التوكن
الفكرة كاملة هي أن تستطيع العثور على التوكنات وفحصها وشرائها دون مغادرة المنصة، مع فلترة الأشياء الخطرة قبل أن تشتريها حتى. بعد استخدامه لمدة ساعة، فهمت لماذا هذا أهم مما يبدو. كل تبويب إضافي تفتحه هو فرصة لتفويت الشيء الذي كان مهمًا.
أختبره بشكل صحيح هذا الأسبوع. إذا كنت ما زلت تجد التوكنات في تطبيق وتفحصها في تطبيق آخر، فأنت تقوم بذلك بالطريقة البطيئة.
@Bubblemaps.io $BMT
Bubblemaps أطلق للتو تحديثًا شاملًا للمنصة، وليس مجرد تغيير شكلها الخارجي.
بل يغيّر طريقتي في البحث عن التوكنات. كنت أفتح خمس تبويبات: واحد للـ chart، واحد لخريطة الفقاعات، واحد للتحقق من الـ launchpad، واحد للتجسس على الحسابات الاجتماعية، وواحد للتبديل فعليًا. والآن… تبويب واحد فقط.
افتحت التغذية الجديدة/المتجهة Trending أولًا (Arc متاح عليها منذ اليوم الأول، مع السلاسل المعتادة) وبدأت التمرير فوق التوكنات قبل أن أنقر حتى. يعرض خريطة فقاعات فورية فورًا، دون تحميل صفحة، ودون تبويب منفصل. وحده هذا كان سيجنبني من توكنين اندفعت إليهما أعمى الشهر الماضي.
الجزء الذي أوقفني فعليًا: النقر على شمعة. أي شمعة. يعرض لك توزيع الحَمَلَة في تلك اللحظة بالضبط، ليس “الآن”، بل عند النقطة في الرسم البياني التي حدث فيها الضخ أو الهبوط. هذه هي الفروقات بين أن يكون الأمر مجرد “مجمّع شكليًا” وبين أن أرى المحافظ التي جمّعته.
ملخص سريع لما يوجد فعليًا هناك:
↳ درجة Bubblemaps، تحدد التجمعات الداخلية والمحافظ التي جُمّعت قبل أن تشتري
↳ فلاتر حسب السلسلة، وlaunchpad، والسعر، والحجم، والسيولة
↳ حسابات اجتماعية للمشاريع تم التحقق منها/مراجعتها، حتى لا تضطر للثقة برابط عشوائي
↳ تسميات المحافظ التي تمت مراجعتها بواسطة خبراء تحليل على السلسلة، وليست مجرد تخمين بخوارزمية
↳ تبديل مدمج بنسبة 0.5%، وهي أقل نسبة رأيتها في أي مكان
↳ تعزيز داخل التطبيق إذا كنت تريد أن يتم بالفعل اكتشاف التوكن
الفكرة كاملة هي أن تستطيع العثور على التوكنات وفحصها وشرائها دون مغادرة المنصة، مع فلترة الأشياء الخطرة قبل أن تشتريها حتى. بعد استخدامه لمدة ساعة، فهمت لماذا هذا أهم مما يبدو. كل تبويب إضافي تفتحه هو فرصة لتفويت الشيء الذي كان مهمًا.
أختبره بشكل صحيح هذا الأسبوع. إذا كنت ما زلت تجد التوكنات في تطبيق وتفحصها في تطبيق آخر، فأنت تقوم بذلك بالطريقة البطيئة.
@Bubblemaps.io $BMT
47
47
12.5k
·
--
تمّ التحقق
مقالة
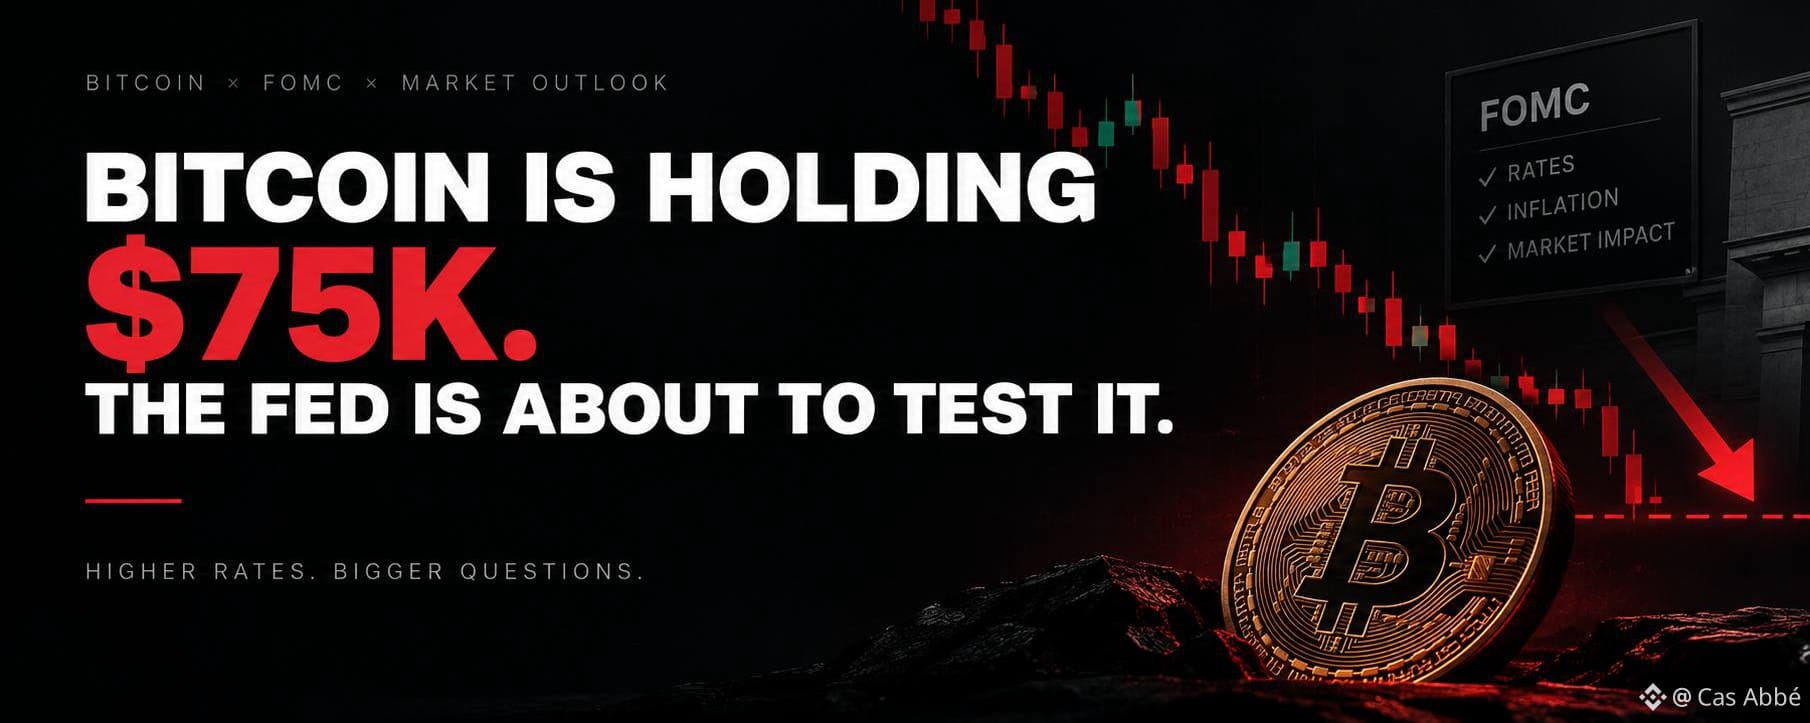
بيتكوين تحافظ على 75 ألف دولار و الاحتياطي الفيدرالي على وشك اختبار ذلكأعتقد أن هذه واحدة من تلك اللحظات التي يمكن للسوق أن يعاقب فيها كلاً من الصعوديين والهبطيين.
لا يزال بيتكوين يحوم حول منطقة 75 ألف دولار بعد أن فشل مجلس الشيوخ في إحراز تقدم بشأن قانون CLARITY. كانت النتيجة 49-50، أي أقل من 60 صوتًا اللازمة لتحريك مشروع القانون إلى الأمام. ثم تراجعت عملة البيتكوين باتجاه 75 ألف دولار، بينما تعرضت الإيثريوم وبقاء عدة عملات رقمية رئيسية لضربة أشد.
ما يثير اهتمامي هو أن بيتكوين لم تنهَر بشكل كامل رغم أنها فقدت واحدًا من أكبر المحفزات التنظيمية التي كان السوق يضعها في الحسبان.
بيتكوين تحافظ على 75 ألف دولار و الاحتياطي الفيدرالي على وشك اختبار ذلك
أعتقد أن هذه واحدة من تلك اللحظات التي يمكن للسوق أن يعاقب فيها كلاً من الصعوديين والهبطيين.
لا يزال بيتكوين يحوم حول منطقة 75 ألف دولار بعد أن فشل مجلس الشيوخ في إحراز تقدم بشأن قانون CLARITY. كانت النتيجة 49-50، أي أقل من 60 صوتًا اللازمة لتحريك مشروع القانون إلى الأمام. ثم تراجعت عملة البيتكوين باتجاه 75 ألف دولار، بينما تعرضت الإيثريوم وبقاء عدة عملات رقمية رئيسية لضربة أشد.
ما يثير اهتمامي هو أن بيتكوين لم تنهَر بشكل كامل رغم أنها فقدت واحدًا من أكبر المحفزات التنظيمية التي كان السوق يضعها في الحسبان.
لا يزال بيتكوين يحوم حول منطقة 75 ألف دولار بعد أن فشل مجلس الشيوخ في إحراز تقدم بشأن قانون CLARITY. كانت النتيجة 49-50، أي أقل من 60 صوتًا اللازمة لتحريك مشروع القانون إلى الأمام. ثم تراجعت عملة البيتكوين باتجاه 75 ألف دولار، بينما تعرضت الإيثريوم وبقاء عدة عملات رقمية رئيسية لضربة أشد.
ما يثير اهتمامي هو أن بيتكوين لم تنهَر بشكل كامل رغم أنها فقدت واحدًا من أكبر المحفزات التنظيمية التي كان السوق يضعها في الحسبان.
38
48
16.5k
·
--
تمّ التحقق
مقالة
بيتكوين عند مستوى مهم جدًا. هنا يتم اختبار سيناريو صعود السوق.أنا أراقب بيتكوين عن كثب هنا أكثر من أي وقت مضى، لأن السوق بدأ يبدو أقل “نظافة” مما كان عليه قبل بضعة أسابيع.
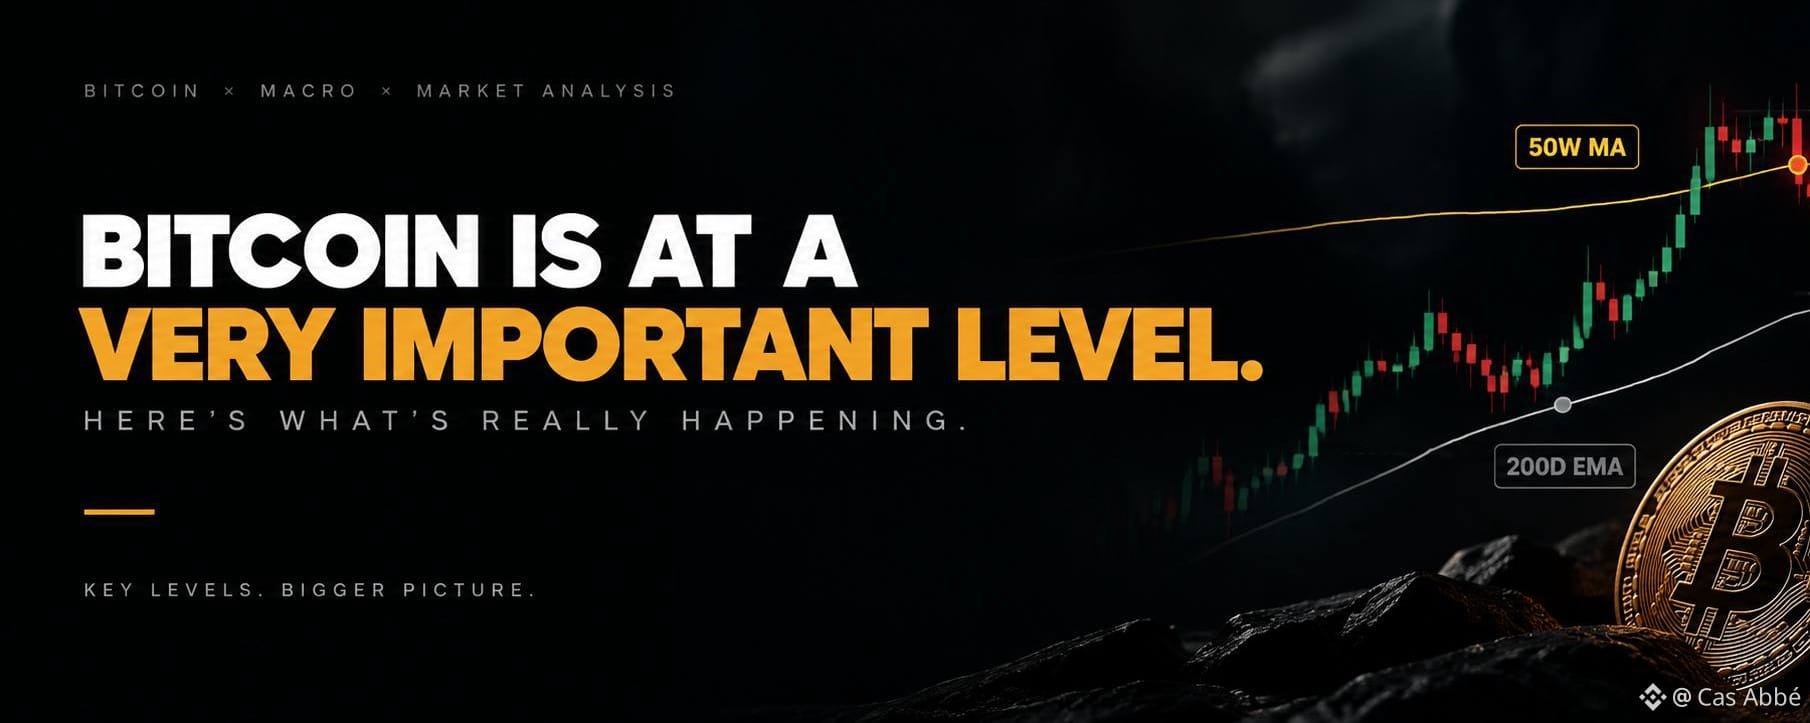
دفعت بيتكوين مؤخرًا فوق 82,000 دولار، لكن الحركة فقدت الزخم في حوالي متوسط 50 أسبوعًا. أصبح هذا المستوى بمثابة خط فاصل حقيقي. كانت Galaxy Research قد وضعت متوسط 50 أسبوعًا قرب 81,000 دولار في وقت سابق من هذا الشهر، بينما تراجعت بيتكوين منذ ذلك الحين باتجاه منطقة 77,000 دولار تقريبًا.
ما يجعل الأمر مثيرًا للاهتمام هو أن السوق قد أنجز بالفعل الكثير على الجانب الصعودي. لقد صعدت بيتكوين من حوالي 62,000 دولار إلى 82,000 دولار قبل ظهور التقاطع الذهبي الأخير. لذلك لا أريد أن أنظر إلى مؤشر صعودي واحد وأعلن فورًا عن بداية سوق ثور جديدة. التقاطع الذهبي مفيد، لكنه أيضًا إشارة متأخرة. تاريخيًا، كانت بيتكوين تتراجع بعد بعض التقاطعات الذهبية، بما في ذلك في 2021 و2023 و2024 و2025.
بيتكوين عند مستوى مهم جدًا. هنا يتم اختبار سيناريو صعود السوق.
أنا أراقب بيتكوين عن كثب هنا أكثر من أي وقت مضى، لأن السوق بدأ يبدو أقل “نظافة” مما كان عليه قبل بضعة أسابيع.
دفعت بيتكوين مؤخرًا فوق 82,000 دولار، لكن الحركة فقدت الزخم في حوالي متوسط 50 أسبوعًا. أصبح هذا المستوى بمثابة خط فاصل حقيقي. كانت Galaxy Research قد وضعت متوسط 50 أسبوعًا قرب 81,000 دولار في وقت سابق من هذا الشهر، بينما تراجعت بيتكوين منذ ذلك الحين باتجاه منطقة 77,000 دولار تقريبًا.
ما يجعل الأمر مثيرًا للاهتمام هو أن السوق قد أنجز بالفعل الكثير على الجانب الصعودي. لقد صعدت بيتكوين من حوالي 62,000 دولار إلى 82,000 دولار قبل ظهور التقاطع الذهبي الأخير. لذلك لا أريد أن أنظر إلى مؤشر صعودي واحد وأعلن فورًا عن بداية سوق ثور جديدة. التقاطع الذهبي مفيد، لكنه أيضًا إشارة متأخرة. تاريخيًا، كانت بيتكوين تتراجع بعد بعض التقاطعات الذهبية، بما في ذلك في 2021 و2023 و2024 و2025.
دفعت بيتكوين مؤخرًا فوق 82,000 دولار، لكن الحركة فقدت الزخم في حوالي متوسط 50 أسبوعًا. أصبح هذا المستوى بمثابة خط فاصل حقيقي. كانت Galaxy Research قد وضعت متوسط 50 أسبوعًا قرب 81,000 دولار في وقت سابق من هذا الشهر، بينما تراجعت بيتكوين منذ ذلك الحين باتجاه منطقة 77,000 دولار تقريبًا.
ما يجعل الأمر مثيرًا للاهتمام هو أن السوق قد أنجز بالفعل الكثير على الجانب الصعودي. لقد صعدت بيتكوين من حوالي 62,000 دولار إلى 82,000 دولار قبل ظهور التقاطع الذهبي الأخير. لذلك لا أريد أن أنظر إلى مؤشر صعودي واحد وأعلن فورًا عن بداية سوق ثور جديدة. التقاطع الذهبي مفيد، لكنه أيضًا إشارة متأخرة. تاريخيًا، كانت بيتكوين تتراجع بعد بعض التقاطعات الذهبية، بما في ذلك في 2021 و2023 و2024 و2025.
33
47
6k
·
--
#Polymarket is تصبح أكثر من مجرد منصة للتنبؤ.
ما يلفت انتباهي هو تنوع الأسواق من العملات المشفرة والاقتصاد الكلي إلى الرياضة والسياسة والأحداث العالمية الكبرى.
أنت لست فقط تقرأ آراءً؛ يمكنك مشاهدة احتمالات تتغير مع دخول معلومات جديدة إلى السوق.
ومع اكتساب أسواق التنبؤ زخمًا عبر العملات المشفرة، @polymarket remains تظل واحدة من أقوى المنتجات في القطاع.
طبقة المعلومات في الوقت الفعلي هي ما يجعلها مثيرة للاهتمام. 👀
#Polymarket #DeFi #Crypto
#Polymarket is تصبح أكثر من مجرد منصة للتنبؤ.
ما يلفت انتباهي هو تنوع الأسواق من العملات المشفرة والاقتصاد الكلي إلى الرياضة والسياسة والأحداث العالمية الكبرى.
أنت لست فقط تقرأ آراءً؛ يمكنك مشاهدة احتمالات تتغير مع دخول معلومات جديدة إلى السوق.
ومع اكتساب أسواق التنبؤ زخمًا عبر العملات المشفرة، @Polymarket remains تظل واحدة من أقوى المنتجات في القطاع.
طبقة المعلومات في الوقت الفعلي هي ما يجعلها مثيرة للاهتمام. 👀
#Polymarket #DeFi #Crypto
ما يلفت انتباهي هو تنوع الأسواق من العملات المشفرة والاقتصاد الكلي إلى الرياضة والسياسة والأحداث العالمية الكبرى.
أنت لست فقط تقرأ آراءً؛ يمكنك مشاهدة احتمالات تتغير مع دخول معلومات جديدة إلى السوق.
ومع اكتساب أسواق التنبؤ زخمًا عبر العملات المشفرة، @Polymarket remains تظل واحدة من أقوى المنتجات في القطاع.
طبقة المعلومات في الوقت الفعلي هي ما يجعلها مثيرة للاهتمام. 👀
#Polymarket #DeFi #Crypto
40
54
7.2k
·
--
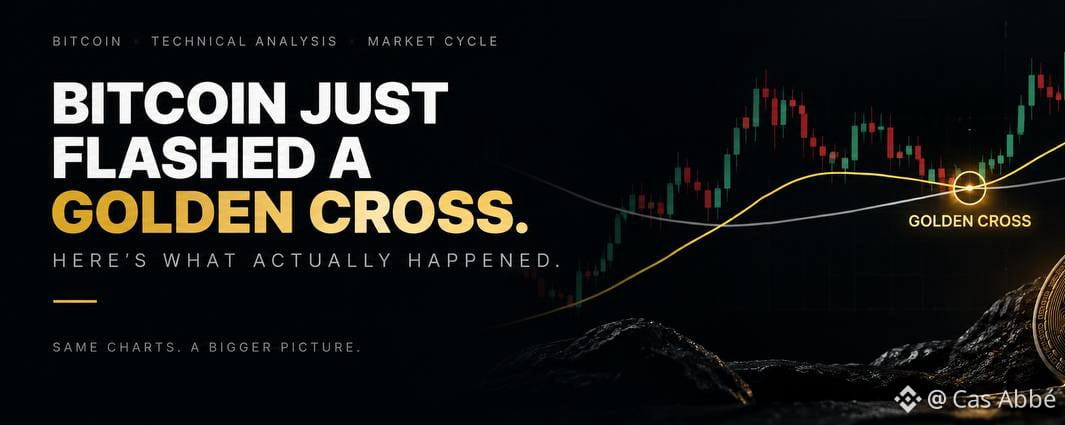
مقالة
البيتكوين أظهر تقاطعًا ذهبيًا سريعًا. لكني لست متأكدًا بعد من القاع.لقد أعطى البيتكوين المتداولين إشارة تستحوذ على انتباه الجميع: تحرّكت المتوسطات المتحركة لـ 50 يومًا فوق المتوسط المتحرك لـ 200 يوم، مما أدى إلى حدوث تقاطع ذهبي. إنها أول إشارة تقاطع ذهبي يومية منذ مايو 2025، بعد أن أمضى البيتكوين عدة أشهر في اتجاه هابط قاسٍ.
السبب الذي يجعل هذه الحالة مهمة هو المقارنة لعام 2023. في ذلك الوقت، شكّل البيتكوين تقاطعًا ذهبيًا في فبراير 2023 بعد أن كانت السوق الهابطة في 2022 قد ألحقت بالفعل معظم الضرر. كانت قيمة BTC آنذاك قرابة 23,000 دولار، وقد تلا ذلك التقاطع تعافٍ أقوى بكثير. تُظهر البيانات التاريخية أن تقاطع فبراير 2023 كان في النهاية متبوعًا بارتفاعات كبيرة في الاتجاه الصعودي.
البيتكوين أظهر تقاطعًا ذهبيًا سريعًا. لكني لست متأكدًا بعد من القاع.
لقد أعطى البيتكوين المتداولين إشارة تستحوذ على انتباه الجميع: تحرّكت المتوسطات المتحركة لـ 50 يومًا فوق المتوسط المتحرك لـ 200 يوم، مما أدى إلى حدوث تقاطع ذهبي. إنها أول إشارة تقاطع ذهبي يومية منذ مايو 2025، بعد أن أمضى البيتكوين عدة أشهر في اتجاه هابط قاسٍ.
السبب الذي يجعل هذه الحالة مهمة هو المقارنة لعام 2023. في ذلك الوقت، شكّل البيتكوين تقاطعًا ذهبيًا في فبراير 2023 بعد أن كانت السوق الهابطة في 2022 قد ألحقت بالفعل معظم الضرر. كانت قيمة BTC آنذاك قرابة 23,000 دولار، وقد تلا ذلك التقاطع تعافٍ أقوى بكثير. تُظهر البيانات التاريخية أن تقاطع فبراير 2023 كان في النهاية متبوعًا بارتفاعات كبيرة في الاتجاه الصعودي.
السبب الذي يجعل هذه الحالة مهمة هو المقارنة لعام 2023. في ذلك الوقت، شكّل البيتكوين تقاطعًا ذهبيًا في فبراير 2023 بعد أن كانت السوق الهابطة في 2022 قد ألحقت بالفعل معظم الضرر. كانت قيمة BTC آنذاك قرابة 23,000 دولار، وقد تلا ذلك التقاطع تعافٍ أقوى بكثير. تُظهر البيانات التاريخية أن تقاطع فبراير 2023 كان في النهاية متبوعًا بارتفاعات كبيرة في الاتجاه الصعودي.
41
43
14.1k
·
--
صحيح جزئيًا

مقالة
BITCOIN JUST MOVED $2,000 IN 20 MINUTES. HERE’S WHAT ACTUALLY HAPPENEDما هذا اللع*؟ تذبذب بقيمة 2,000 دولار خلال 20 دقيقة على مؤشر CPI. الرسم البياني قال كل شيء.
حسنًا، دعني أشرح ما الذي حدث فعليًا.
في كل شهر، تقوم حكومة الولايات المتحدة بإصدار شيء يُسمى تقرير CPI. CPI اختصار لـ Consumer Price Index، وهو يخبرنا في الأساس بمدى ارتفاع الأسعار، أو عدم ارتفاعها، بالنسبة للأشياء العادية التي يشتريها الناس. البقالة، البنزين، الإيجار، كل شيء. يتابع المتداولون هذا الرقم بترقب شديد لأنه يخبرهم بما قد يفعله الاحتياطي الفيدرالي بعد ذلك بشأن أسعار الفائدة.
صدر تقرير اليوم عند الساعة 8:30 صباحًا بتوقيت شرق الولايات المتحدة، وكانت الأرقام قريبة جدًا مما كان يتوقعه الناس. ارتفعت الأسعار بنسبة 0.4% لهذا الشهر، وبنسبة 3.4% خلال العام الماضي. لكن إذا استبعدت الغذاء والطاقة، وهي الأشياء التي تتأرجح كثيرًا، فإن الأسعار ارتفعت أكثر قليلًا مما كان مُتوقعًا. هذا الفرق الصغير كان مهمًا جدًا، لأن لدى الاحتياطي الفيدرالي اجتماعًا كبيرًا الأسبوع المقبل، وكان هذا في الأساس آخر نقطة بيانات كبيرة قبل أن يقرر ما الذي سيفعله بشأن أسعار الفائدة.
BITCOIN JUST MOVED $2,000 IN 20 MINUTES. HERE’S WHAT ACTUALLY HAPPENED
ما هذا اللع*؟ تذبذب بقيمة 2,000 دولار خلال 20 دقيقة على مؤشر CPI. الرسم البياني قال كل شيء.
حسنًا، دعني أشرح ما الذي حدث فعليًا.
في كل شهر، تقوم حكومة الولايات المتحدة بإصدار شيء يُسمى تقرير CPI. CPI اختصار لـ Consumer Price Index، وهو يخبرنا في الأساس بمدى ارتفاع الأسعار، أو عدم ارتفاعها، بالنسبة للأشياء العادية التي يشتريها الناس. البقالة، البنزين، الإيجار، كل شيء. يتابع المتداولون هذا الرقم بترقب شديد لأنه يخبرهم بما قد يفعله الاحتياطي الفيدرالي بعد ذلك بشأن أسعار الفائدة.
صدر تقرير اليوم عند الساعة 8:30 صباحًا بتوقيت شرق الولايات المتحدة، وكانت الأرقام قريبة جدًا مما كان يتوقعه الناس. ارتفعت الأسعار بنسبة 0.4% لهذا الشهر، وبنسبة 3.4% خلال العام الماضي. لكن إذا استبعدت الغذاء والطاقة، وهي الأشياء التي تتأرجح كثيرًا، فإن الأسعار ارتفعت أكثر قليلًا مما كان مُتوقعًا. هذا الفرق الصغير كان مهمًا جدًا، لأن لدى الاحتياطي الفيدرالي اجتماعًا كبيرًا الأسبوع المقبل، وكان هذا في الأساس آخر نقطة بيانات كبيرة قبل أن يقرر ما الذي سيفعله بشأن أسعار الفائدة.
حسنًا، دعني أشرح ما الذي حدث فعليًا.
في كل شهر، تقوم حكومة الولايات المتحدة بإصدار شيء يُسمى تقرير CPI. CPI اختصار لـ Consumer Price Index، وهو يخبرنا في الأساس بمدى ارتفاع الأسعار، أو عدم ارتفاعها، بالنسبة للأشياء العادية التي يشتريها الناس. البقالة، البنزين، الإيجار، كل شيء. يتابع المتداولون هذا الرقم بترقب شديد لأنه يخبرهم بما قد يفعله الاحتياطي الفيدرالي بعد ذلك بشأن أسعار الفائدة.
صدر تقرير اليوم عند الساعة 8:30 صباحًا بتوقيت شرق الولايات المتحدة، وكانت الأرقام قريبة جدًا مما كان يتوقعه الناس. ارتفعت الأسعار بنسبة 0.4% لهذا الشهر، وبنسبة 3.4% خلال العام الماضي. لكن إذا استبعدت الغذاء والطاقة، وهي الأشياء التي تتأرجح كثيرًا، فإن الأسعار ارتفعت أكثر قليلًا مما كان مُتوقعًا. هذا الفرق الصغير كان مهمًا جدًا، لأن لدى الاحتياطي الفيدرالي اجتماعًا كبيرًا الأسبوع المقبل، وكان هذا في الأساس آخر نقطة بيانات كبيرة قبل أن يقرر ما الذي سيفعله بشأن أسعار الفائدة.
40
1
55
21.2k
سجّل الدخول لاستكشاف المزيد من المُحتوى
انضم إلى مُستخدمي العملات الرقمية حول العالم على Binance Square
⚡️ احصل على أحدث المعلومات المفيدة عن العملات الرقمية.
💬 موثوقة من قبل أكبر منصّة لتداول العملات الرقمية في العالم.
👍 اكتشف الرؤى الحقيقية من صنّاع المُحتوى الموثوقين.
البريد الإلكتروني / رقم الهاتف
المواضيع الرائجة
EarningsSeason
197,371 مشاهدات
1,802 يقومون بالنقاش
موسم الأرباح: أرباح ميكرون للربع الرابع — صعودية أم هبوطية؟
Binance Square Official
·321 إعجاب
·601.3k مشاهدات
BitwiseLaunchesFirstSpotNEARETF
6,567 مشاهدات
255 يقومون بالنقاش
USJobOpeningsFallToFiveMonthLow
10,178 مشاهدات
193 يقومون بالنقاش