
pvrvnxiv-nba
6 貼文

pvrvnxiv-nba
20 關注
0 粉絲
0 點讚數
貼文
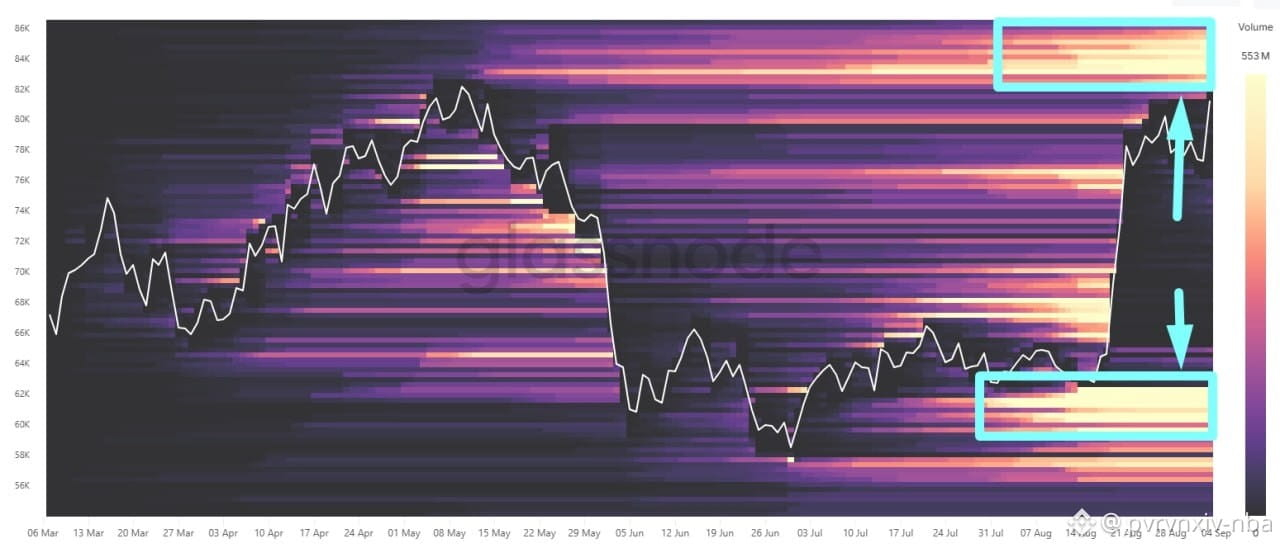
📌 BTC被夾在兩道清算“牆”之間
• 截圖展示了全交易所的潛在未來清算熱力圖。顏色越亮,意味着當對應價格被觸及時,越多的高槓杆倉位將被迫平倉。做空者在頂部;多頭倉位在底部
⠀
1)8月19日的拉昇把上漲途中相當一部分空頭清掉了,但價格從未觸及83,000–86,000美元區間內最大的清算集羣。此外,8月27日當BTC突破80,000美元后,遇到了賣壓並回撤至76,000美元,平掉了一部分在最初拉昇之後才入場的後期多頭
⠀
2)目前,BTC正再次逼近上方區域,而主要的做空者仍在那裏活躍。如果價格在下邊界附近約83,000美元找到支撐,強制買盤可能會迅速形成級聯,將其推升至85,000–86,000美元。——這與我對“前一篇覆盤中提到的橫盤之後會出現第二波上衝”的預期完全一致;但僅靠空頭倉位的清算並不能保證持續上漲——當流動性被吸收之後,動能可能會耗盡,市場將再一次需要常規的現貨買家。
3)還有一點同樣重要。下方在60,000–63,000美元區間仍存在一個阻力位,那裏已經累積了大量當下正在發生的多頭清算。它經受住了8月19日的拉昇以及隨後回撤,因此目前仍然完好。如果市場完全回吐近期漲幅,並開始回撤至夏季低點,這些倉位的平倉不但會加速拋售,同時以很高的概率會將市場打到最近一次低點58,000美元之下。即便這目前更像是一種壓力情景,而非主情景。
⠀
#onchain
• 截圖展示了全交易所的潛在未來清算熱力圖。顏色越亮,意味着當對應價格被觸及時,越多的高槓杆倉位將被迫平倉。做空者在頂部;多頭倉位在底部
⠀
1)8月19日的拉昇把上漲途中相當一部分空頭清掉了,但價格從未觸及83,000–86,000美元區間內最大的清算集羣。此外,8月27日當BTC突破80,000美元后,遇到了賣壓並回撤至76,000美元,平掉了一部分在最初拉昇之後才入場的後期多頭
⠀
2)目前,BTC正再次逼近上方區域,而主要的做空者仍在那裏活躍。如果價格在下邊界附近約83,000美元找到支撐,強制買盤可能會迅速形成級聯,將其推升至85,000–86,000美元。——這與我對“前一篇覆盤中提到的橫盤之後會出現第二波上衝”的預期完全一致;但僅靠空頭倉位的清算並不能保證持續上漲——當流動性被吸收之後,動能可能會耗盡,市場將再一次需要常規的現貨買家。
3)還有一點同樣重要。下方在60,000–63,000美元區間仍存在一個阻力位,那裏已經累積了大量當下正在發生的多頭清算。它經受住了8月19日的拉昇以及隨後回撤,因此目前仍然完好。如果市場完全回吐近期漲幅,並開始回撤至夏季低點,這些倉位的平倉不但會加速拋售,同時以很高的概率會將市場打到最近一次低點58,000美元之下。即便這目前更像是一種壓力情景,而非主情景。
⠀
#onchain
查看翻譯
🟢 Meanwhile, short-term holders have formed a new base for BTC
• The CBD-STH chart shows the distribution of short-term traders’ coins by average holding period. The brighter the zone, the more BTC was accumulated in that price range
1) At the end of 2025, the largest cluster was in the $84,000–$90,000 range, but the price failed to hold it. After the downward breakout, a significant portion of short-term holders found themselves in the red, and BTC quickly plummeted to the next major trading zone. Upon a rebound, this zone could become the strongest resistance, as some of the holders trapped at the top will try to dump their coins at break-even and forget about this market as if it were a bad dream. However, we’re dealing with a historic STH-CBD, and over time, some of the coins may have already moved into the LTH category (having held their BTC for more than 155 days) or been sold; therefore, I’ll verify the actual supply overhang separately using the overall BTC distribution map.
2) A new STH basis has now formed in the $62,000–$67,000 range, which roughly coincides with the accumulation zone during the prolonged downtrend in 2024. What’s most interesting is that both when the price fell to this zone in February 2026 and during the subsequent retest in June, short-term traders were in no hurry to accumulate BTC due to severe market panic. The heatmap shows that the main accumulation began only in late July–early August, which is where the hottest area appeared
—
🟣 Therefore, I think BTC will now trade within the upper range for some time, gradually pushing the average TVH of short-term traders higher. At the same time, a return to the lower cluster cannot be ruled out—the 62–67k area is becoming the main support for the latest rebound
As long as the price stays above it, the structure looks rather bullish, but only locally. Losing this zone would mean that the new base didn’t hold, and short-term traders will once again start exiting en masse at a loss
#onchain
• The CBD-STH chart shows the distribution of short-term traders’ coins by average holding period. The brighter the zone, the more BTC was accumulated in that price range
1) At the end of 2025, the largest cluster was in the $84,000–$90,000 range, but the price failed to hold it. After the downward breakout, a significant portion of short-term holders found themselves in the red, and BTC quickly plummeted to the next major trading zone. Upon a rebound, this zone could become the strongest resistance, as some of the holders trapped at the top will try to dump their coins at break-even and forget about this market as if it were a bad dream. However, we’re dealing with a historic STH-CBD, and over time, some of the coins may have already moved into the LTH category (having held their BTC for more than 155 days) or been sold; therefore, I’ll verify the actual supply overhang separately using the overall BTC distribution map.
2) A new STH basis has now formed in the $62,000–$67,000 range, which roughly coincides with the accumulation zone during the prolonged downtrend in 2024. What’s most interesting is that both when the price fell to this zone in February 2026 and during the subsequent retest in June, short-term traders were in no hurry to accumulate BTC due to severe market panic. The heatmap shows that the main accumulation began only in late July–early August, which is where the hottest area appeared
—
🟣 Therefore, I think BTC will now trade within the upper range for some time, gradually pushing the average TVH of short-term traders higher. At the same time, a return to the lower cluster cannot be ruled out—the 62–67k area is becoming the main support for the latest rebound
As long as the price stays above it, the structure looks rather bullish, but only locally. Losing this zone would mean that the new base didn’t hold, and short-term traders will once again start exiting en masse at a loss
#onchain
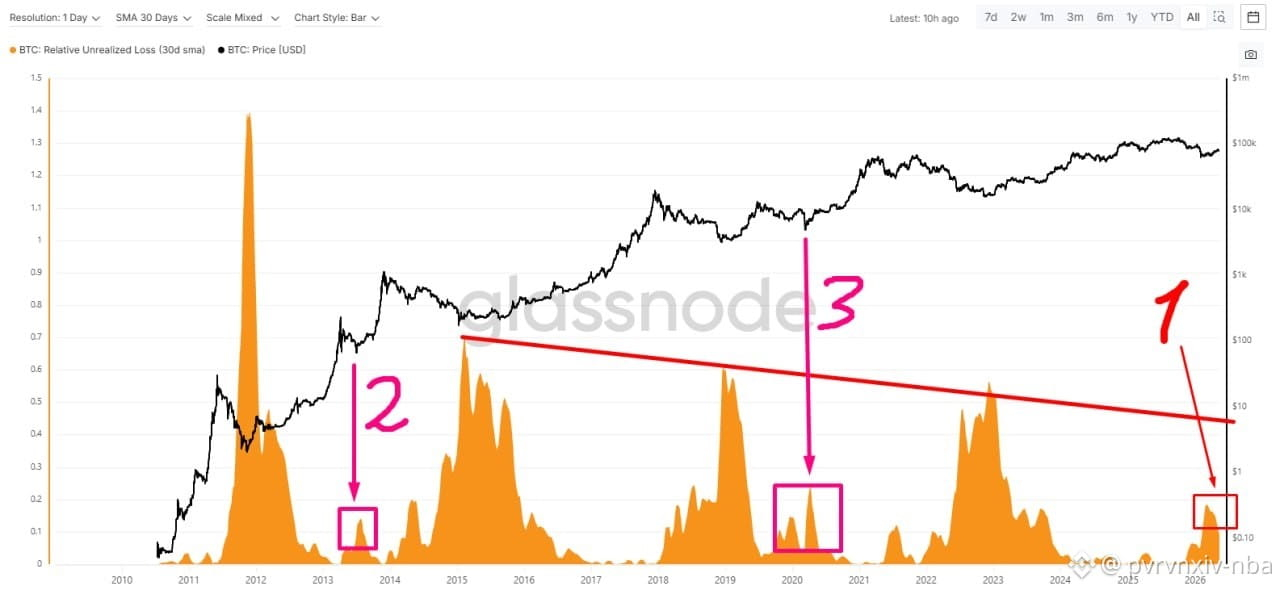
🟠 下面的圖表顯示了所有BTC持有者的未實現損失比率(NUPL),以USDT表示,佔總市值的百分比。在2月6日下跌的峯值時,NUPL比率躍升至25%。然而,考慮到我們在查看從2010年以來的整個歷史,平滑這些數據至至少30天的平均值是有意義的,這就是我所做的。因此,2月底至3月初的NUPL峯值平均達到約18%(點#1)
從視覺上看,每個新週期的特徵是未實現損失的份額減少,因此,如果當前的熊市底部達到的痛苦程度低於2022年,那也不奇怪。但即使如此,如果我們將第一個週期從方程中移除(由於其極端的波動性),並進行線性迴歸,我們可以看到當前週期的假設底部可能在每月平均未實現損失佔比達到約40%時到達。
這會是達到下一個ATH之前的“局部”重大損失嗎?有可能,就像在點#1(Mt. Gox事件)和點#2(疫情)時的情況一樣。然而,從視覺上看,它並不像以前那樣,因爲沒有明顯的不可抗力事件針對所有市場和加密貨幣(如2021年5月的中國禁令),而且時間已經拉得太長(不可抗力事件通常是明確且迅速發生的)。
—
• 因此,總體來說,我仍然更傾向於下跌。即使BTC的價格現在進一步上漲,關鍵的阻力位仍將保持在89,000美元至90,000美元左右,因爲這是領先加密資產結構性弱點開始轉變的點。
#onchain #BTC #ATH $BTC
從視覺上看,每個新週期的特徵是未實現損失的份額減少,因此,如果當前的熊市底部達到的痛苦程度低於2022年,那也不奇怪。但即使如此,如果我們將第一個週期從方程中移除(由於其極端的波動性),並進行線性迴歸,我們可以看到當前週期的假設底部可能在每月平均未實現損失佔比達到約40%時到達。
這會是達到下一個ATH之前的“局部”重大損失嗎?有可能,就像在點#1(Mt. Gox事件)和點#2(疫情)時的情況一樣。然而,從視覺上看,它並不像以前那樣,因爲沒有明顯的不可抗力事件針對所有市場和加密貨幣(如2021年5月的中國禁令),而且時間已經拉得太長(不可抗力事件通常是明確且迅速發生的)。
—
• 因此,總體來說,我仍然更傾向於下跌。即使BTC的價格現在進一步上漲,關鍵的阻力位仍將保持在89,000美元至90,000美元左右,因爲這是領先加密資產結構性弱點開始轉變的點。
#onchain #BTC #ATH $BTC
登入以探索更多內容