
Regimanuel
8 貼文

Regimanuel
舉報
封鎖用戶
實盤交易

BNB 持有者
低頻交易者
3.6 年
20 關注
30 粉絲
44 點讚數
貼文
投資組合

·
--
美元是否在跟隨英鎊的軌跡?!!?
儲備貨幣不會一夜之間崩潰。
它們會逐漸侵蝕。
當美國崛起時,英鎊並沒有消失。
它隨着債務的增加、戰爭成本的上升和經濟領導權的轉移而逐漸失去主導地位。
今天,美元仍然是全球貿易和儲備的基石。
但我們看到晚週期的信號:
* 創紀錄的主權債務
* 持續的財政赤字
* 日益加劇的地緣政治碎片化
* 增加的替代結算系統
這些都不意味着美元明天就會結束。
這意味着結構性主導地位慢慢面臨競爭。
貨幣過渡需要幾十年。
聰明的資本不會驚慌。
它會做好準備。
多元化並不是反美元。
而是支持風險管理。
問題不是“美元會崩潰嗎?”
而是:
"你如何在結構性轉變變得明顯之前進行定位?"
$BNB $BTC
{spot}(BTCUSDT)
美元是否在跟隨英鎊的軌跡?!!?
儲備貨幣不會一夜之間崩潰。
它們會逐漸侵蝕。
當美國崛起時,英鎊並沒有消失。
它隨着債務的增加、戰爭成本的上升和經濟領導權的轉移而逐漸失去主導地位。
今天,美元仍然是全球貿易和儲備的基石。
但我們看到晚週期的信號:
* 創紀錄的主權債務
* 持續的財政赤字
* 日益加劇的地緣政治碎片化
* 增加的替代結算系統
這些都不意味着美元明天就會結束。
這意味着結構性主導地位慢慢面臨競爭。
貨幣過渡需要幾十年。
聰明的資本不會驚慌。
它會做好準備。
多元化並不是反美元。
而是支持風險管理。
問題不是“美元會崩潰嗎?”
而是:
"你如何在結構性轉變變得明顯之前進行定位?"
$BNB $BTC
儲備貨幣不會一夜之間崩潰。
它們會逐漸侵蝕。
當美國崛起時,英鎊並沒有消失。
它隨着債務的增加、戰爭成本的上升和經濟領導權的轉移而逐漸失去主導地位。
今天,美元仍然是全球貿易和儲備的基石。
但我們看到晚週期的信號:
* 創紀錄的主權債務
* 持續的財政赤字
* 日益加劇的地緣政治碎片化
* 增加的替代結算系統
這些都不意味着美元明天就會結束。
這意味着結構性主導地位慢慢面臨競爭。
貨幣過渡需要幾十年。
聰明的資本不會驚慌。
它會做好準備。
多元化並不是反美元。
而是支持風險管理。
問題不是“美元會崩潰嗎?”
而是:
"你如何在結構性轉變變得明顯之前進行定位?"
$BNB $BTC
2
109
·
--
看跌
查看翻譯
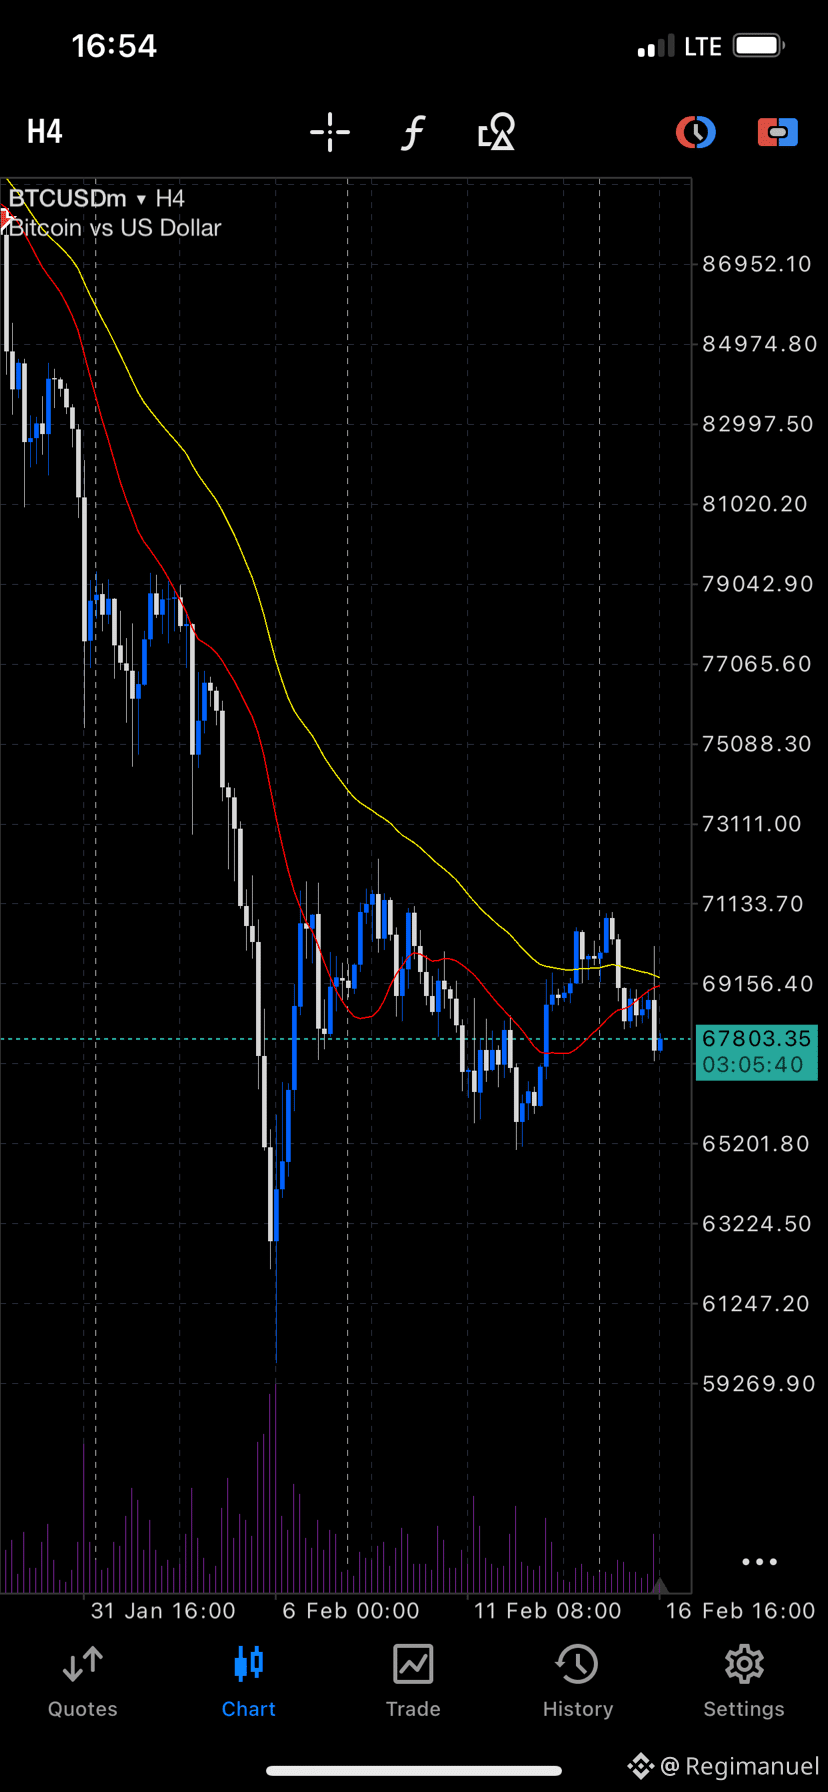
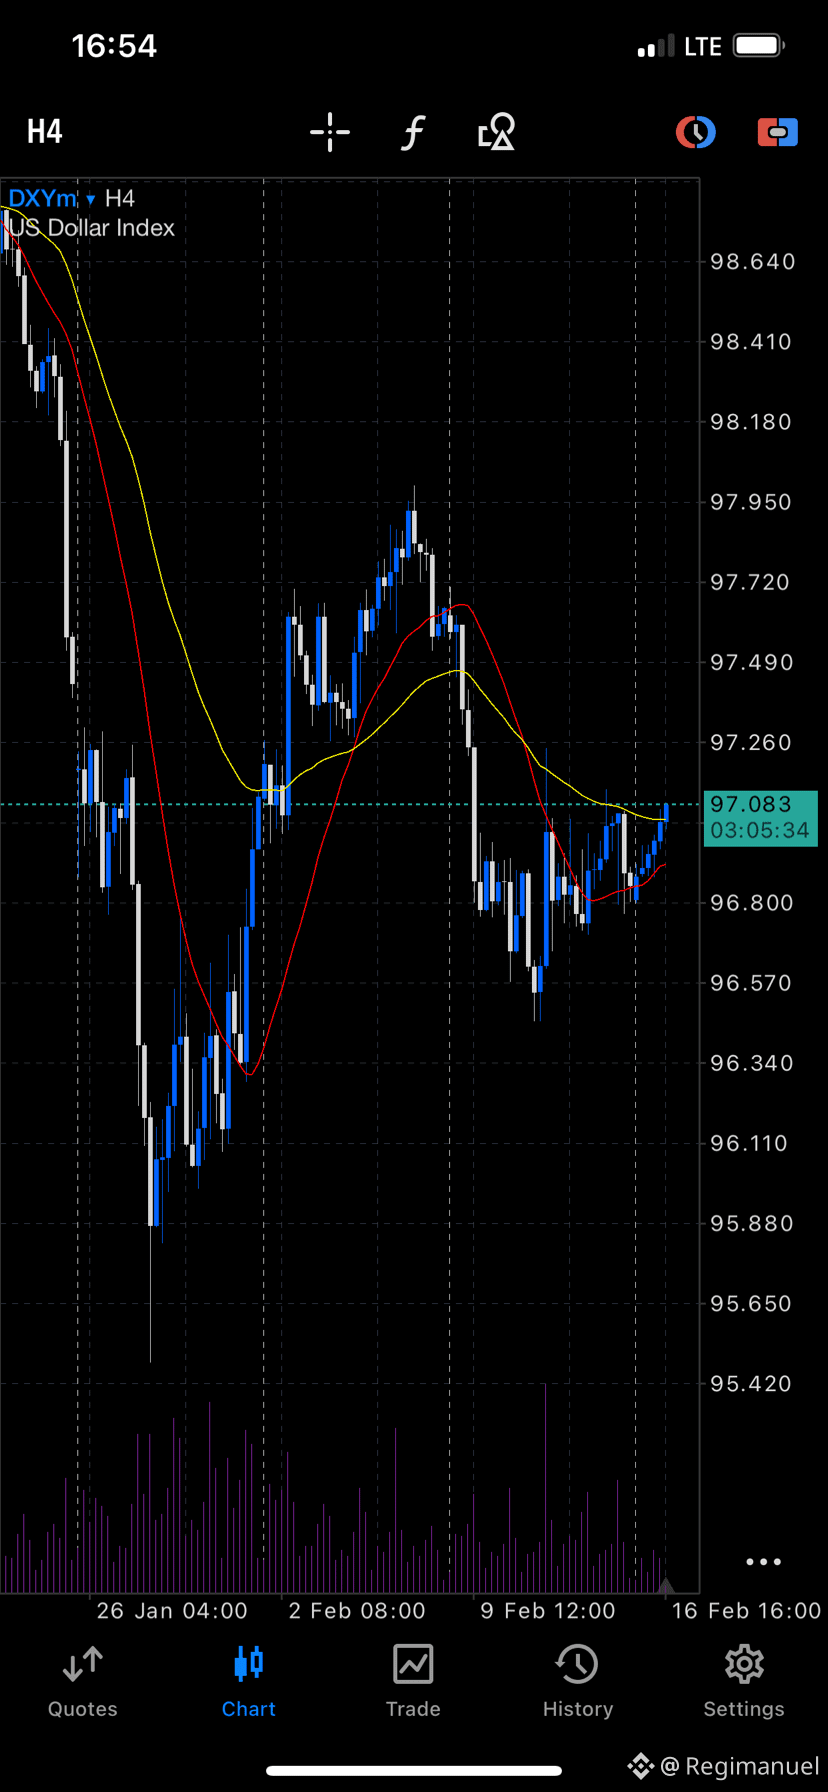
The correlation between dxy and btc.🥲❤️ You can simplify chart analysis by looking at what dxy is doing and relating it to other pairs. $BTC
{spot}(BTCUSDT)
The correlation between dxy and btc.🥲❤️ You can simplify chart analysis by looking at what dxy is doing and relating it to other pairs. $BTC
3
32
·
--
核截止日期比大多數投資者想象的更近
NASA計劃在2030年之前開發一個月球反應堆,這不是科幻小說。
這是一個採購時間表。
而時間表會改變供應鏈。
這裏是重要的內容:
核燃料週期從鈾礦開採到成品燃料組件需要18–24個月。
你不能在固定期限內宣佈反應堆,然後再考慮燃料。
合同先行,頭條新聞隨之而來。
現在再加上這一點:
美國的監管時間表正在被壓縮。
先進反應堆正在從提案轉向動員。
中國和俄羅斯正在積極擴大核能。
數據中心 + 人工智能正在推動基礎負荷電力需求。
這不是關於月球。
這是關於時間壓縮。
當政府加速基礎設施建設時,瓶頸!!$BTC
#DYOR🟢
核截止日期比大多數投資者想象的更近
NASA計劃在2030年之前開發一個月球反應堆,這不是科幻小說。
這是一個採購時間表。
而時間表會改變供應鏈。
這裏是重要的內容:
核燃料週期從鈾礦開採到成品燃料組件需要18–24個月。
你不能在固定期限內宣佈反應堆,然後再考慮燃料。
合同先行,頭條新聞隨之而來。
現在再加上這一點:
美國的監管時間表正在被壓縮。
先進反應堆正在從提案轉向動員。
中國和俄羅斯正在積極擴大核能。
數據中心 + 人工智能正在推動基礎負荷電力需求。
這不是關於月球。
這是關於時間壓縮。
當政府加速基礎設施建設時,瓶頸!!$BTC
#DYOR🟢
NASA計劃在2030年之前開發一個月球反應堆,這不是科幻小說。
這是一個採購時間表。
而時間表會改變供應鏈。
這裏是重要的內容:
核燃料週期從鈾礦開採到成品燃料組件需要18–24個月。
你不能在固定期限內宣佈反應堆,然後再考慮燃料。
合同先行,頭條新聞隨之而來。
現在再加上這一點:
美國的監管時間表正在被壓縮。
先進反應堆正在從提案轉向動員。
中國和俄羅斯正在積極擴大核能。
數據中心 + 人工智能正在推動基礎負荷電力需求。
這不是關於月球。
這是關於時間壓縮。
當政府加速基礎設施建設時,瓶頸!!$BTC
#DYOR🟢
13
122
·
--
看跌
查看翻譯
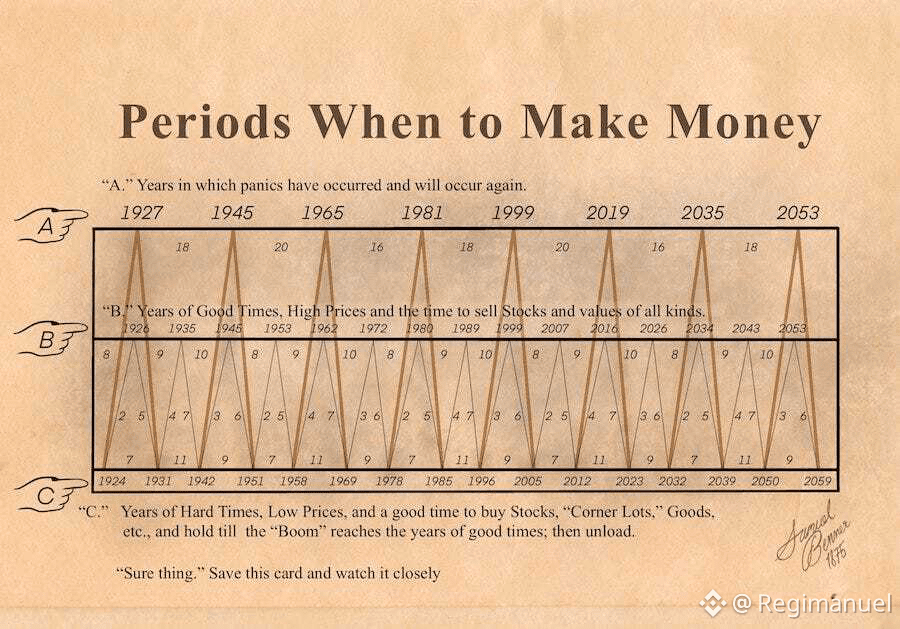
This vintage market timing card is attributed to W.D. Gann, a trader known for his cyclical market theories.
The chart divides market history into repeating phases:
* A – Panic Years**: Crisis periods that reset valuations
* B – Good Times / High Prices**: Distribution phases where smart money sells
* C – Hard Times / Low Prices**: Accumulation zones before the next expansion
Whether or not you believe in fixed-year cycles, the underlying principle remains powerful:
> Markets move in psychological and liquidity cycles; fear → recovery → euphoria → correction
I don’t treat historical cycle charts as deterministic forecasts. But they’re valuable reminders that:
* Extreme optimism often precedes corrections
* Deep pessimism often creates asymmetric opportunities
* Risk management matters more than prediction
In crypto markets especially, volatility compresses these cycles into shorter timeframes but human behavior doesn’t change.
The key isn’t predicting exact years.
It’s recognizing where we are in the cycle and positioning accordingly.
{spot}(BTCUSDT)
$BTC
This vintage market timing card is attributed to W.D. Gann, a trader known for his cyclical market theories.
The chart divides market history into repeating phases:
* A – Panic Years**: Crisis periods that reset valuations
* B – Good Times / High Prices**: Distribution phases where smart money sells
* C – Hard Times / Low Prices**: Accumulation zones before the next expansion
Whether or not you believe in fixed-year cycles, the underlying principle remains powerful:
> Markets move in psychological and liquidity cycles; fear → recovery → euphoria → correction
I don’t treat historical cycle charts as deterministic forecasts. But they’re valuable reminders that:
* Extreme optimism often precedes corrections
* Deep pessimism often creates asymmetric opportunities
* Risk management matters more than prediction
In crypto markets especially, volatility compresses these cycles into shorter timeframes but human behavior doesn’t change.
The key isn’t predicting exact years.
It’s recognizing where we are in the cycle and positioning accordingly.
$BTC
The chart divides market history into repeating phases:
* A – Panic Years**: Crisis periods that reset valuations
* B – Good Times / High Prices**: Distribution phases where smart money sells
* C – Hard Times / Low Prices**: Accumulation zones before the next expansion
Whether or not you believe in fixed-year cycles, the underlying principle remains powerful:
> Markets move in psychological and liquidity cycles; fear → recovery → euphoria → correction
I don’t treat historical cycle charts as deterministic forecasts. But they’re valuable reminders that:
* Extreme optimism often precedes corrections
* Deep pessimism often creates asymmetric opportunities
* Risk management matters more than prediction
In crypto markets especially, volatility compresses these cycles into shorter timeframes but human behavior doesn’t change.
The key isn’t predicting exact years.
It’s recognizing where we are in the cycle and positioning accordingly.
$BTC
13
210
·
--
#2025withBinance 開始您的加密貨幣故事,與@Binance一起回顧年度並分享您的亮點!#2025withBinance。
👉 使用我的鏈接註冊並獲得100美元獎勵! https://www.binance.com/year-in-review/2025-with-binance?ref=576553195
#2025withBinance 開始您的加密貨幣故事,與@Binance一起回顧年度並分享您的亮點!#2025withBinance。
👉 使用我的鏈接註冊並獲得100美元獎勵! https://www.binance.com/year-in-review/2025-with-binance?ref=576553195
👉 使用我的鏈接註冊並獲得100美元獎勵! https://www.binance.com/year-in-review/2025-with-binance?ref=576553195
8
8
登入以探索更多內容
加入幣安廣場中的全球加密貨幣用戶
⚡️ 獲取加密貨幣的最新和實用資訊。
💬 受到全球最大加密貨幣交易所的信任。
👍 發掘來自經過驗證創作者的真實見解。
電子郵件 / 電話號碼
熱門話題
比特币突破8万美元大关
90,294 次瀏覽
376 討論中
$BTC 這次BTC重新站上8萬美元,我反而更關注一個細節:利空這麼多,爲什麼跌不下去?
這周美聯儲加息、美國加密法案受挫,BTC一度跌到7.7萬美元附近,但隨後又快速收復8萬美元,9月18日一度漲到約8.12萬美元。:contentReference[oaicite:0]{index=0}
這說明短線市場的承接明顯增強。
現在我會重點看兩個位置:
8萬美元:從心理關口變成短線多空分界附近,如果回踩後還能站穩,說明買盤仍在。
7.65萬~7.7萬美元:前面的重要支撐區,如果再次跌回這裏,而且放量,就要防止這次反彈變成假突破。:contentReference[oaicite:1]{index=1}
另外,9月18日美國現貨BTC ETF重新出現約1.6億美元淨流入,也是值得關注的資金信號。:contentReference[oaicite:2]{index=2}
所以現在我不會因爲BTC漲了就直接追多。
真正值得觀察的是:BTC站穩8萬之後,資金會不會繼續流向ETH和山寨。
如果BTC強、山寨卻跟不上,反而要小心資金只是迴流BTC,而不是全面進入風險資產。#比特币突破8万美元大关
最後一把
·0 人按讚
·3.9k 次瀏覽
巴菲特转任伯克希尔荣誉董事长
14,347 次瀏覽
114 討論中
Zcash现货ETF月度净流入超2.3亿美元
51,099 次瀏覽
185 討論中