

Odunerd
54 貼文

Odunerd
舉報
封鎖用戶
BP-24948D0AD5FF
94 關注
432 粉絲
1.3K+ 點讚數
貼文
全部
引用
置頂
·
--
看漲
很多時候,我們忽視了我們的信念,而當事情發生時,你會大喊“哎呀”。
除了TA和FA
有一種東西叫情感分析
您對加密貨幣領域的特定敘述有何看法?您的看法對您有何影響?是好是壞?
我的意思是,無論是看漲還是看跌,重要的是你的心態,而不僅僅是圖表或 MM 發佈的內容。
保持專注🤳
代幣 我正在推動我對 rn 的信念
#memes
#L2s
#AI
#exchtokens
很多時候,我們忽視了我們的信念,而當事情發生時,你會大喊“哎呀”。
除了TA和FA
有一種東西叫情感分析
您對加密貨幣領域的特定敘述有何看法?您的看法對您有何影響?是好是壞?
我的意思是,無論是看漲還是看跌,重要的是你的心態,而不僅僅是圖表或 MM 發佈的內容。
保持專注🤳
代幣 我正在推動我對 rn 的信念
#memes
#L2s
#AI
#exchtokens
除了TA和FA
有一種東西叫情感分析
您對加密貨幣領域的特定敘述有何看法?您的看法對您有何影響?是好是壞?
我的意思是,無論是看漲還是看跌,重要的是你的心態,而不僅僅是圖表或 MM 發佈的內容。
保持專注🤳
代幣 我正在推動我對 rn 的信念
#memes
#L2s
#AI
#exchtokens

3
8
2.5k
·
--
一個代幣幾乎快要支撐不住了,又試圖重新站起來——對瑞波家族來說現在可不太妙……
#BitgetHackerMoves$83MStolenXRP
一個代幣幾乎快要支撐不住了,又試圖重新站起來——對瑞波家族來說現在可不太妙……
#BitgetHackerMoves$83MStolenXRP
#BitgetHackerMoves$83MStolenXRP
351
·
--
文章
查看翻譯
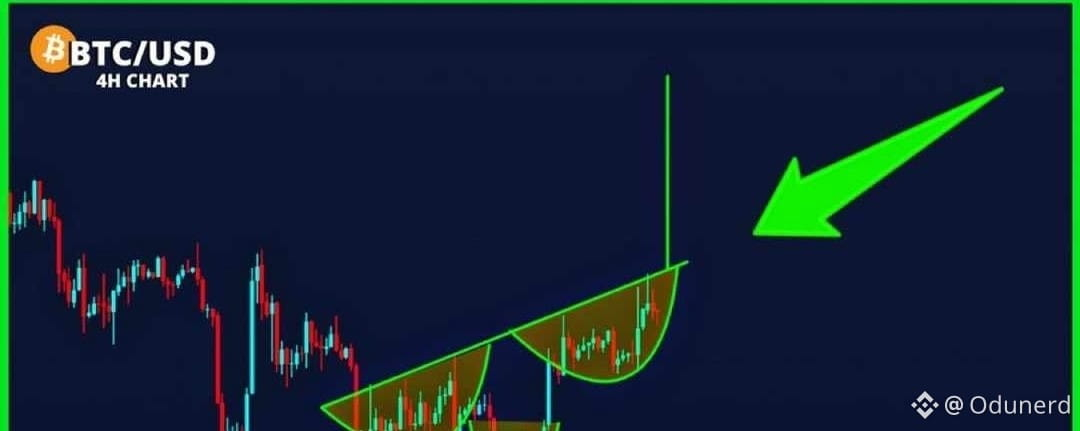
BITCOIN INCONSISTENCIES ANALYTICAL PROVEN..Was June 30, 2026 the Bitcoin Cycle Bottom?
One question has been sitting at the center of my Bitcoin analysis:
Did Bitcoin actually find its cycle bottom on June 30, 2026?
Rather than relying on the chart alone, I approached the question from two sides:
Market structure + on-chain and market data.
1. Starting With Price Action
I deliberately kept the technical analysis simple.
No complicated indicators.
Just price structure.
Bitcoin reached a low of approximately $58.53K on June 30.
Since then, the market has behaved differently from the downtrend that led into that low.
On the daily chart, $BTC moved away from the June low and entered a period of consolidation before beginning to form a sequence of higher highs and higher lows.
The weekly chart adds another important piece of context.
The June low has remained intact, while Bitcoin has recovered substantially from that level.
That is certainly worth paying attention to.
But there is an important distinction:
A strong recovery from a low does not, by itself, prove that the cycle bottom is in.
So I went deeper.
2. Looking Beneath the Chart
To test the June low from a data perspective, I built a framework around several metrics and historical comparisons:
- MVRV
- Bitcoin Realized Price
- ETF flows
- Historical cycle bottoms
- Peak-to-bottom drawdowns
- Post-bottom recovery behaviour
The objective wasn't to find one magic indicator.
Instead, I wanted to see whether multiple independent pieces of evidence were pointing toward the same conclusion.
Key numbers from the analysis
$58.53K — June 30 low
-53.11% — Peak-to-bottom drawdown
1.47 — Current MVRV
$53.19K — Realized Price
+30.52% — Recovery from the June low at the time of the analysis
When these figures are placed alongside historical Bitcoin cycle behaviour, the June 30 low starts to look increasingly significant.
3. What Does the Evidence Actually Tell Us?
The analysis suggests that June 30 is a credible candidate for the cycle bottom.
But there is an important caveat:
A candidate bottom is not the same thing as a confirmed cycle bottom.
Bitcoin has historically experienced significant recoveries that were later followed by another major move lower.
That's why I don't think one should look at the June low in isolation.
The more interesting observation is that both price structure and the underlying data are pointing toward a potential change in market behaviour around that period.
Price is showing a different structure.
The on-chain and market data provide additional evidence worth investigating.
But the higher-timeframe cycle still needs to prove itself.
4. Why Combine Technical Analysis With Data Analytics?
This is actually the bigger lesson behind the research.
The chart tells us what price is doing.
But data can help us investigate what may be happening underneath the price.
Instead of asking:
«"Does the chart look bullish?"»
The better analytical question becomes:
"Do multiple independent datasets support the same market hypothesis?"
That shift changes the way I approach crypto research.
Rather than relying on a single indicator or prediction, I want to combine:
Price → On-chain data → Historical behaviour → Market flows → Statistical context
Then let the evidence tell the story.
So, was June 30, 2026 the Bitcoin cycle bottom?
It is a credible candidate — but the data does not make it a confirmed fact yet.
For me, that's where the research becomes interesting.
The goal isn't to predict the market with certainty.
It's to identify important market events, collect the relevant data, test the hypothesis, and continue monitoring whether the evidence holds.
PS: I've put together the full research, dashboard, and methodology for anyone interested in going through the analysis from start to finish.
BITCOIN INCONSISTENCIES ANALYTICAL PROVEN..
Was June 30, 2026 the Bitcoin Cycle Bottom?
One question has been sitting at the center of my Bitcoin analysis:
Did Bitcoin actually find its cycle bottom on June 30, 2026?
Rather than relying on the chart alone, I approached the question from two sides:
Market structure + on-chain and market data.
1. Starting With Price Action
I deliberately kept the technical analysis simple.
No complicated indicators.
Just price structure.
Bitcoin reached a low of approximately $58.53K on June 30.
Since then, the market has behaved differently from the downtrend that led into that low.
On the daily chart, $BTC moved away from the June low and entered a period of consolidation before beginning to form a sequence of higher highs and higher lows.
The weekly chart adds another important piece of context.
The June low has remained intact, while Bitcoin has recovered substantially from that level.
That is certainly worth paying attention to.
But there is an important distinction:
A strong recovery from a low does not, by itself, prove that the cycle bottom is in.
So I went deeper.
2. Looking Beneath the Chart
To test the June low from a data perspective, I built a framework around several metrics and historical comparisons:
- MVRV
- Bitcoin Realized Price
- ETF flows
- Historical cycle bottoms
- Peak-to-bottom drawdowns
- Post-bottom recovery behaviour
The objective wasn't to find one magic indicator.
Instead, I wanted to see whether multiple independent pieces of evidence were pointing toward the same conclusion.
Key numbers from the analysis
$58.53K — June 30 low
-53.11% — Peak-to-bottom drawdown
1.47 — Current MVRV
$53.19K — Realized Price
+30.52% — Recovery from the June low at the time of the analysis
When these figures are placed alongside historical Bitcoin cycle behaviour, the June 30 low starts to look increasingly significant.
3. What Does the Evidence Actually Tell Us?
The analysis suggests that June 30 is a credible candidate for the cycle bottom.
But there is an important caveat:
A candidate bottom is not the same thing as a confirmed cycle bottom.
Bitcoin has historically experienced significant recoveries that were later followed by another major move lower.
That's why I don't think one should look at the June low in isolation.
The more interesting observation is that both price structure and the underlying data are pointing toward a potential change in market behaviour around that period.
Price is showing a different structure.
The on-chain and market data provide additional evidence worth investigating.
But the higher-timeframe cycle still needs to prove itself.
4. Why Combine Technical Analysis With Data Analytics?
This is actually the bigger lesson behind the research.
The chart tells us what price is doing.
But data can help us investigate what may be happening underneath the price.
Instead of asking:
«"Does the chart look bullish?"»
The better analytical question becomes:
"Do multiple independent datasets support the same market hypothesis?"
That shift changes the way I approach crypto research.
Rather than relying on a single indicator or prediction, I want to combine:
Price → On-chain data → Historical behaviour → Market flows → Statistical context
Then let the evidence tell the story.
So, was June 30, 2026 the Bitcoin cycle bottom?
It is a credible candidate — but the data does not make it a confirmed fact yet.
For me, that's where the research becomes interesting.
The goal isn't to predict the market with certainty.
It's to identify important market events, collect the relevant data, test the hypothesis, and continue monitoring whether the evidence holds.
PS: I've put together the full research, dashboard, and methodology for anyone interested in going through the analysis from start to finish.
One question has been sitting at the center of my Bitcoin analysis:
Did Bitcoin actually find its cycle bottom on June 30, 2026?
Rather than relying on the chart alone, I approached the question from two sides:
Market structure + on-chain and market data.
1. Starting With Price Action
I deliberately kept the technical analysis simple.
No complicated indicators.
Just price structure.
Bitcoin reached a low of approximately $58.53K on June 30.
Since then, the market has behaved differently from the downtrend that led into that low.
On the daily chart, $BTC moved away from the June low and entered a period of consolidation before beginning to form a sequence of higher highs and higher lows.
The weekly chart adds another important piece of context.
The June low has remained intact, while Bitcoin has recovered substantially from that level.
That is certainly worth paying attention to.
But there is an important distinction:
A strong recovery from a low does not, by itself, prove that the cycle bottom is in.
So I went deeper.
2. Looking Beneath the Chart
To test the June low from a data perspective, I built a framework around several metrics and historical comparisons:
- MVRV
- Bitcoin Realized Price
- ETF flows
- Historical cycle bottoms
- Peak-to-bottom drawdowns
- Post-bottom recovery behaviour
The objective wasn't to find one magic indicator.
Instead, I wanted to see whether multiple independent pieces of evidence were pointing toward the same conclusion.
Key numbers from the analysis
$58.53K — June 30 low
-53.11% — Peak-to-bottom drawdown
1.47 — Current MVRV
$53.19K — Realized Price
+30.52% — Recovery from the June low at the time of the analysis
When these figures are placed alongside historical Bitcoin cycle behaviour, the June 30 low starts to look increasingly significant.
3. What Does the Evidence Actually Tell Us?
The analysis suggests that June 30 is a credible candidate for the cycle bottom.
But there is an important caveat:
A candidate bottom is not the same thing as a confirmed cycle bottom.
Bitcoin has historically experienced significant recoveries that were later followed by another major move lower.
That's why I don't think one should look at the June low in isolation.
The more interesting observation is that both price structure and the underlying data are pointing toward a potential change in market behaviour around that period.
Price is showing a different structure.
The on-chain and market data provide additional evidence worth investigating.
But the higher-timeframe cycle still needs to prove itself.
4. Why Combine Technical Analysis With Data Analytics?
This is actually the bigger lesson behind the research.
The chart tells us what price is doing.
But data can help us investigate what may be happening underneath the price.
Instead of asking:
«"Does the chart look bullish?"»
The better analytical question becomes:
"Do multiple independent datasets support the same market hypothesis?"
That shift changes the way I approach crypto research.
Rather than relying on a single indicator or prediction, I want to combine:
Price → On-chain data → Historical behaviour → Market flows → Statistical context
Then let the evidence tell the story.
So, was June 30, 2026 the Bitcoin cycle bottom?
It is a credible candidate — but the data does not make it a confirmed fact yet.
For me, that's where the research becomes interesting.
The goal isn't to predict the market with certainty.
It's to identify important market events, collect the relevant data, test the hypothesis, and continue monitoring whether the evidence holds.
PS: I've put together the full research, dashboard, and methodology for anyone interested in going through the analysis from start to finish.
1
62
·
--
隨時隨地為我帶來黑暗模式,這對我來說真的很重要,因為光明模式造成的損害需要更多的關注。
隨時隨地為我帶來黑暗模式,這對我來說真的很重要,因為光明模式造成的損害需要更多的關注。

Odunerd
·
--
看漲作爲一名開發人員,在學習和編碼時,您喜歡在屏幕上顯示什麼屏幕。
▪︎亮屏
▪︎暗屏
讓我們談談。
▪︎亮屏
▪︎暗屏
讓我們談談。
1
6
·
--
#StockMarketCrash 戰爭的影響肯定會在我們現在所見的後果中展現出來,現在看到的只是個誘餌,目的是引誘人們進場。
#StockMarketCrash 戰爭的影響肯定會在我們現在所見的後果中展現出來,現在看到的只是個誘餌,目的是引誘人們進場。
1
53
·
--
看漲
比特幣達到73K美元並不是讓人感到滿足的基礎,現在市場飆升的原因是庫存中$BTC的數量,以及戰爭讓礦工分心。
比特幣達到73K美元並不是讓人感到滿足的基礎,現在市場飆升的原因是庫存中$BTC的數量,以及戰爭讓礦工分心。
1
65
·
--
他們把所有在這個位置上的人都打殘了
他們把所有在這個位置上的人都打殘了

Tyler Oliveira
·
--
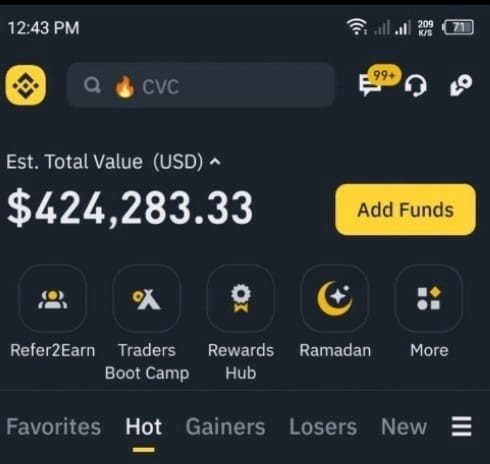
我幾小時前賬戶裏有120萬 💔😭
我在$POWER 中損失了近80萬,我該如何彌補這些損失??? 😰
我正在購買$RIVER 📈✅
我在$POWER 中損失了近80萬,我該如何彌補這些損失??? 😰
我正在購買$RIVER 📈✅

1
16
·
--
看漲
對於 $KAITO 這裡同樣看漲
對於 $KAITO 這裡同樣看漲


CoinQuest
·
--
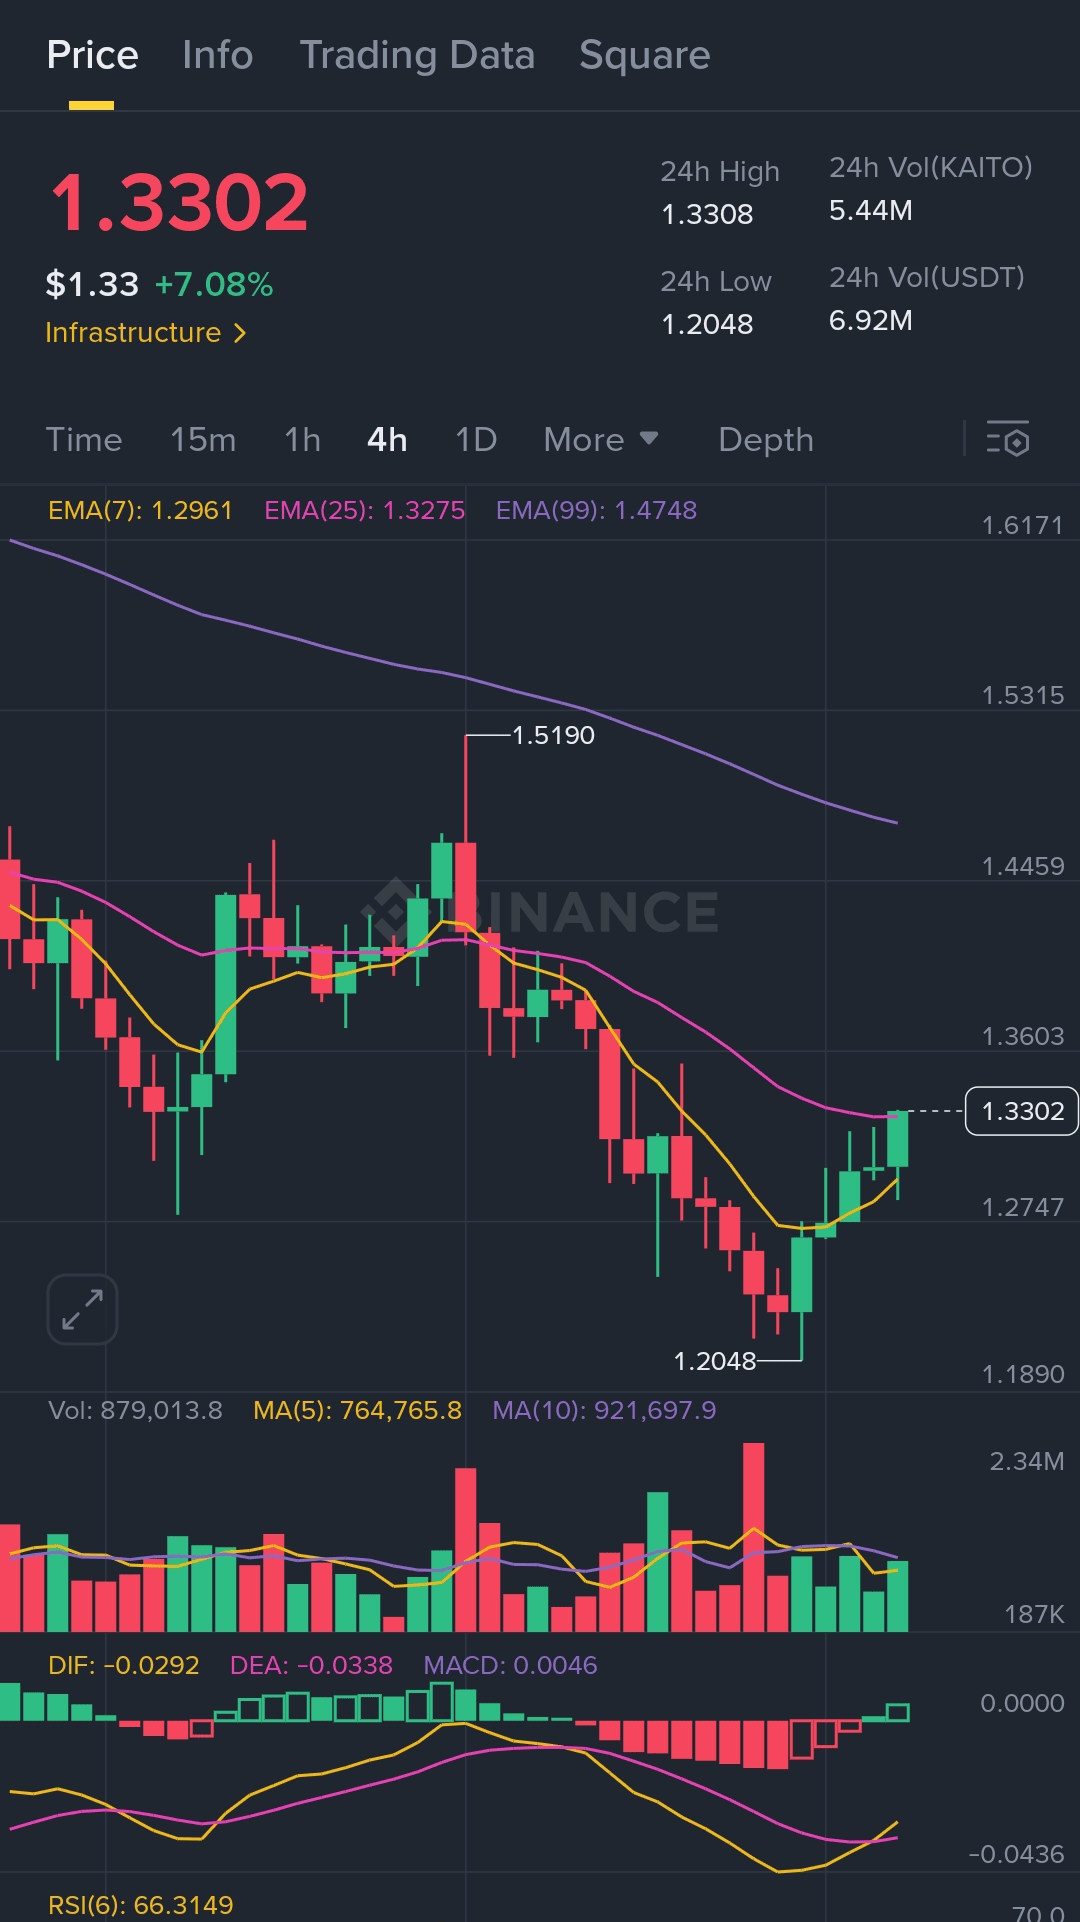
看漲$KAITO 突破結構動態 ✅
KAITO已用成交量確認翻轉阻力,並形成乾淨的更高低點,牛市重新掌控局面。
🎯 入場:$1.3300
目標:$1.3538 | $1.3850 | $1.4200(可選用於分批建倉)
🛡️ 止損:$1.2975
動能支持繼續上漲。突破交易者應關注$1.33以上的強勢,乾淨的佈局可用於向上延伸。
KAITO已用成交量確認翻轉阻力,並形成乾淨的更高低點,牛市重新掌控局面。
🎯 入場:$1.3300
目標:$1.3538 | $1.3850 | $1.4200(可選用於分批建倉)
🛡️ 止損:$1.2975
動能支持繼續上漲。突破交易者應關注$1.33以上的強勢,乾淨的佈局可用於向上延伸。
182


·
--
看跌
由於 Telegram 首席執行官被捕,開放網絡 (TON) 經歷突然深淵。
#PavelDurov
現在是時候對 Ton 區塊鏈上著名的 Memes 採取行動,以模仿並確保這個機會作爲購買投票。
#Fish
#Notcoin
#utyab
#Raff
Tpet
Durev
Tcandy
Tmonk。
您可以在 geckoterminal.com 上查看許多內容,或使用這些 dex 購買上市代幣。
Ston.fi
DeDust.io
由於 Telegram 首席執行官被捕,開放網絡 (TON) 經歷突然深淵。
#PavelDurov
現在是時候對 Ton 區塊鏈上著名的 Memes 採取行動,以模仿並確保這個機會作爲購買投票。
#Fish
#Notcoin
#utyab
#Raff
Tpet
Durev
Tcandy
Tmonk。
您可以在 geckoterminal.com 上查看許多內容,或使用這些 dex 購買上市代幣。
Ston.fi
DeDust.io
#PavelDurov
現在是時候對 Ton 區塊鏈上著名的 Memes 採取行動,以模仿並確保這個機會作爲購買投票。
#Fish
#Notcoin
#utyab
#Raff
Tpet
Durev
Tcandy
Tmonk。
您可以在 geckoterminal.com 上查看許多內容,或使用這些 dex 購買上市代幣。
Ston.fi
DeDust.io

4
720
·
--
看漲
教育的這一部分總是溫暖着我從幣安到全世界的心。
#BNB 💛
教育的這一部分總是溫暖着我從幣安到全世界的心。
#BNB 💛
#BNB 💛


Binance Square Official
·
--
如何在 Square 上寫一篇長篇文章
202
·
--
看漲
我對當今 DEFI 世界的想法是,讓我們擁抱更多的技術和創新,這樣加密領域就不會完全缺乏創意。
要有效率
要有聯繫
要有開放的心態
我對當今 DEFI 世界的想法是,讓我們擁抱更多的技術和創新,這樣加密領域就不會完全缺乏創意。
要有效率
要有聯繫
要有開放的心態
要有效率
要有聯繫
要有開放的心態
5
269
·
--
#MarketSentimentToday 我想說的是,市場目前處於十字星狀態,人們在做決定時需要極其小心。
#MarketSentimentToday 我想說的是,市場目前處於十字星狀態,人們在做決定時需要極其小心。
5
3k
·
--
看漲
作爲一名開發人員,在學習和編碼時,您喜歡在屏幕上顯示什麼屏幕。
▪︎亮屏
▪︎暗屏
讓我們談談。
作爲一名開發人員,在學習和編碼時,您喜歡在屏幕上顯示什麼屏幕。
▪︎亮屏
▪︎暗屏
讓我們談談。
▪︎亮屏
▪︎暗屏
讓我們談談。
1
2
5.5k
登入以探索更多內容
加入幣安廣場中的全球加密貨幣用戶
⚡️ 獲取加密貨幣的最新和實用資訊。
💬 受到全球最大加密貨幣交易所的信任。
👍 發掘來自經過驗證創作者的真實見解。
電子郵件 / 電話號碼
熱門話題
Anthropic招股书或估值超2万亿美元
24,158 次瀏覽
182 討論中
Anthropic 招股書曝光了,這家公司現在的賬,比外界想象得還要激進。
2025 年,Anthropic 營收 45.9 億美元,同比增長 1088%,但營業層面依然虧損超過 80 億美元。
更誇張的是未來支出。
截至去年底,Anthropic 手裏有 202.8 億美元現金、現金等價物和短期投資,但已經爲未來數年的雲計算、算力和基礎設施簽下了 5180 億美元的承諾。
差不多是現有現金的 25 倍,也是 2025 年全年營收的 113 倍。
這份招股書第一次把 Anthropic 的增長模式攤得這麼開。
一邊是極快的收入增長,另一邊是同樣驚人的算力投入。
而且收入本身也沒有想象中那麼穩。
去年接近四分之一營收來自兩家客戶,Anthropic 還專門在風險因素裏提醒,很多最大客戶都沒有籤長期合同,可以隨時削減甚至停止支出。
也就是說,它已經提前把幾千億美元的算力鎖下來了,但對應的收入,並沒有一起鎖下來。
過去幾年,一級市場願意爲 AI 的增長速度買單。現在公司真正進入公開市場,投資者終於可以把收入、虧損、客戶集中度和未來幾千億美元的算力承諾放在同一張表裏算。
Anthropic 要證明的已經不只是 Claude 能不能繼續增長。
還要證明今天簽下的這張鉅額算力賬單,未來真的有人來買單。
Sleepy
·6 人按讚
·11.4k 次瀏覽
黑客从DCENT钱包盗取超1240万枚XRP
11,155 次瀏覽
95 討論中
SEC称去中心化代币回购通常非投资合约
9,041 次瀏覽
80 討論中