

Haroon AG
8 貼文

Haroon AG
舉報
封鎖用戶
Crypto Trader | Market Analysis | Price Action & Technical Insights | Sharing setups, market updates & trading knowledge | Precision • Discipline • Consistency
0 關注
8 粉絲
18 點讚數
貼文
·
--
看漲
$ETH /
{spot}(ETHUSDT)
$USDT — 4H 分析
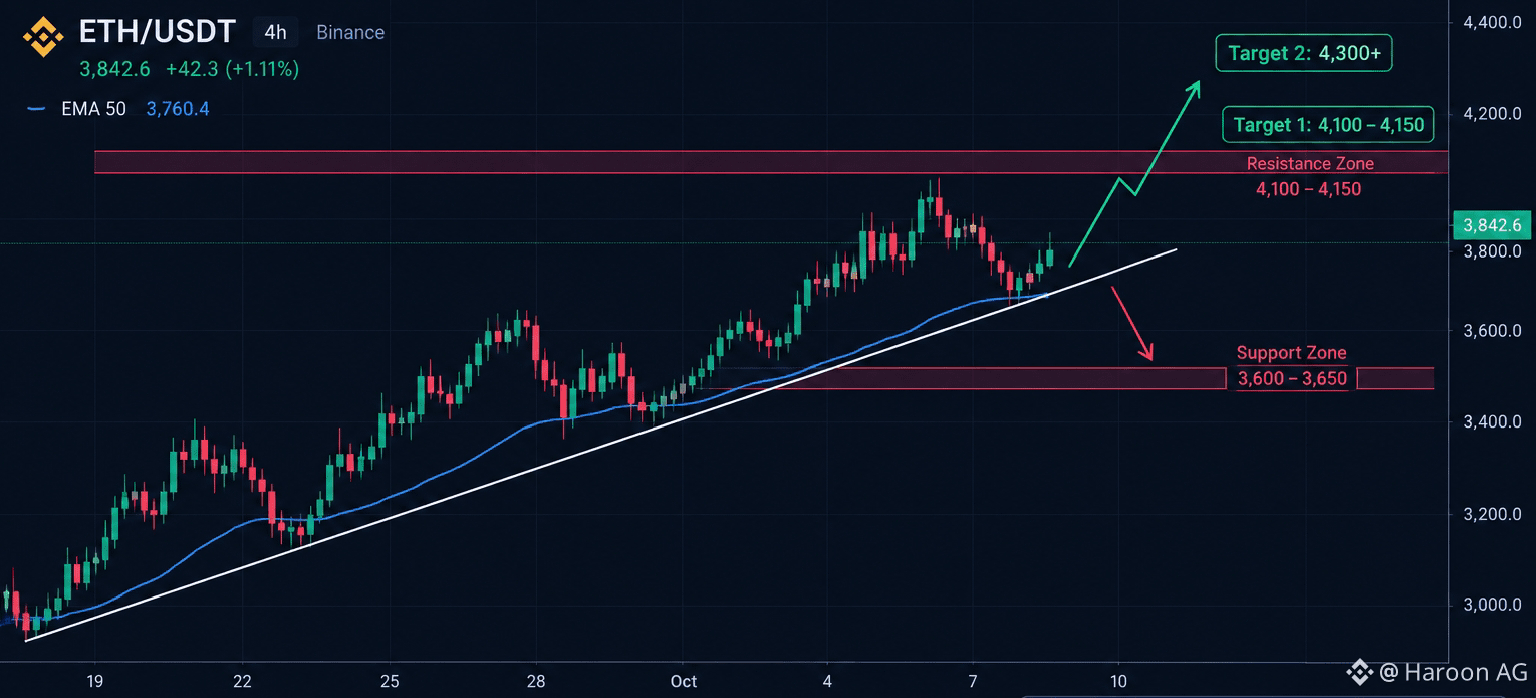
ETH目前站穩在3,760上方,該區域正作爲重要的趨勢支撐位,並且與上升趨勢線共同構成支撐。
看漲情景:如果ETH守在3,760之上並突破3,900,下一個阻力位在4,100–4,150。若能對該區間實現乾淨的突破,可能爲上看4,300+打開空間。
看跌情景:如果ETH跌破上升趨勢線以及3,760,價格可能向3,600–3,650的支撐區間運行。
關鍵位:
阻力:4,100–4,150
突破目標:4,300+
趨勢支撐:3,760
主要支撐:3,600–3,650
#ETH #cryptoAnylasis #ETH/USDT
$ETH /
$USDT — 4H 分析
ETH目前站穩在3,760上方,該區域正作爲重要的趨勢支撐位,並且與上升趨勢線共同構成支撐。
看漲情景:如果ETH守在3,760之上並突破3,900,下一個阻力位在4,100–4,150。若能對該區間實現乾淨的突破,可能爲上看4,300+打開空間。
看跌情景:如果ETH跌破上升趨勢線以及3,760,價格可能向3,600–3,650的支撐區間運行。
關鍵位:
阻力:4,100–4,150
突破目標:4,300+
趨勢支撐:3,760
主要支撐:3,600–3,650
#ETH #cryptoAnylasis #ETH/USDT
$USDT — 4H 分析
ETH目前站穩在3,760上方,該區域正作爲重要的趨勢支撐位,並且與上升趨勢線共同構成支撐。
看漲情景:如果ETH守在3,760之上並突破3,900,下一個阻力位在4,100–4,150。若能對該區間實現乾淨的突破,可能爲上看4,300+打開空間。
看跌情景:如果ETH跌破上升趨勢線以及3,760,價格可能向3,600–3,650的支撐區間運行。
關鍵位:
阻力:4,100–4,150
突破目標:4,300+
趨勢支撐:3,760
主要支撐:3,600–3,650
#ETH #cryptoAnylasis #ETH/USDT
65
·
--
$BTC
每週展望 | 9月28日 – 10月5日
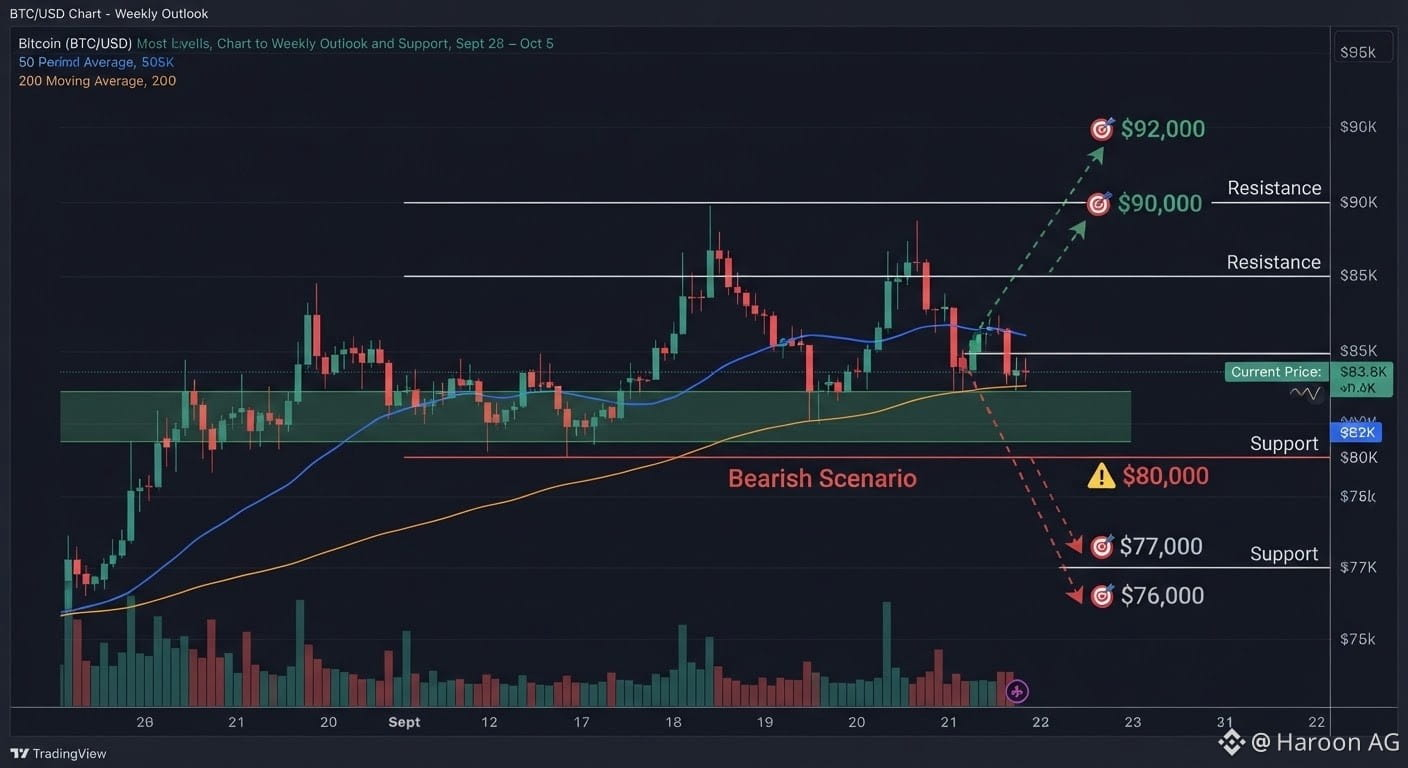
比特幣目前在$83.8K附近交易,此前曾在$87K阻力區域遭到回落。
關鍵市場情景
看漲情景:如果$82K至$81.5K的支撐區間守住,反彈仍將保持完整。若重新站上$85K,可能推動買盤瞄準$87K、$90K和$92K。若出現並完成每日收盤站上$87K,將進一步強化看漲延續的設置。
看跌情景:如果比特幣果斷跌破$81.5K,$80K將成爲關鍵支撐位。跌破$80K將使$77K至$76K區間重新進入關注範圍。
基本面展望
中期市場結構已得到改善,近期現貨ETF資金流入帶來強勁的機構需求支撐。不過,美國國債收益率偏高以及持續收緊預期,仍對風險偏好資產構成短期風險。
關鍵價位總結
阻力位:$85K | $87K | $90K
支撐位:$82K | $80K | $77K
接下來的主要市場走勢取決於比特幣能否重新奪回$85K並突破$87K,或是跌破$81.5K至$80K的支撐區間。
免責聲明:不構成投資建議。請始終管理好風險,並進行你自己的研究。
#BTC #bitcoin #crypto #BTCanalysis
$BTC
每週展望 | 9月28日 – 10月5日
比特幣目前在$83.8K附近交易,此前曾在$87K阻力區域遭到回落。
關鍵市場情景
看漲情景:如果$82K至$81.5K的支撐區間守住,反彈仍將保持完整。若重新站上$85K,可能推動買盤瞄準$87K、$90K和$92K。若出現並完成每日收盤站上$87K,將進一步強化看漲延續的設置。
看跌情景:如果比特幣果斷跌破$81.5K,$80K將成爲關鍵支撐位。跌破$80K將使$77K至$76K區間重新進入關注範圍。
基本面展望
中期市場結構已得到改善,近期現貨ETF資金流入帶來強勁的機構需求支撐。不過,美國國債收益率偏高以及持續收緊預期,仍對風險偏好資產構成短期風險。
關鍵價位總結
阻力位:$85K | $87K | $90K
支撐位:$82K | $80K | $77K
接下來的主要市場走勢取決於比特幣能否重新奪回$85K並突破$87K,或是跌破$81.5K至$80K的支撐區間。
免責聲明:不構成投資建議。請始終管理好風險,並進行你自己的研究。
#BTC #bitcoin #crypto #BTCanalysis
每週展望 | 9月28日 – 10月5日
比特幣目前在$83.8K附近交易,此前曾在$87K阻力區域遭到回落。
關鍵市場情景
看漲情景:如果$82K至$81.5K的支撐區間守住,反彈仍將保持完整。若重新站上$85K,可能推動買盤瞄準$87K、$90K和$92K。若出現並完成每日收盤站上$87K,將進一步強化看漲延續的設置。
看跌情景:如果比特幣果斷跌破$81.5K,$80K將成爲關鍵支撐位。跌破$80K將使$77K至$76K區間重新進入關注範圍。
基本面展望
中期市場結構已得到改善,近期現貨ETF資金流入帶來強勁的機構需求支撐。不過,美國國債收益率偏高以及持續收緊預期,仍對風險偏好資產構成短期風險。
關鍵價位總結
阻力位:$85K | $87K | $90K
支撐位:$82K | $80K | $77K
接下來的主要市場走勢取決於比特幣能否重新奪回$85K並突破$87K,或是跌破$81.5K至$80K的支撐區間。
免責聲明:不構成投資建議。請始終管理好風險,並進行你自己的研究。
#BTC #bitcoin #crypto #BTCanalysis
81
·
--
$BTC
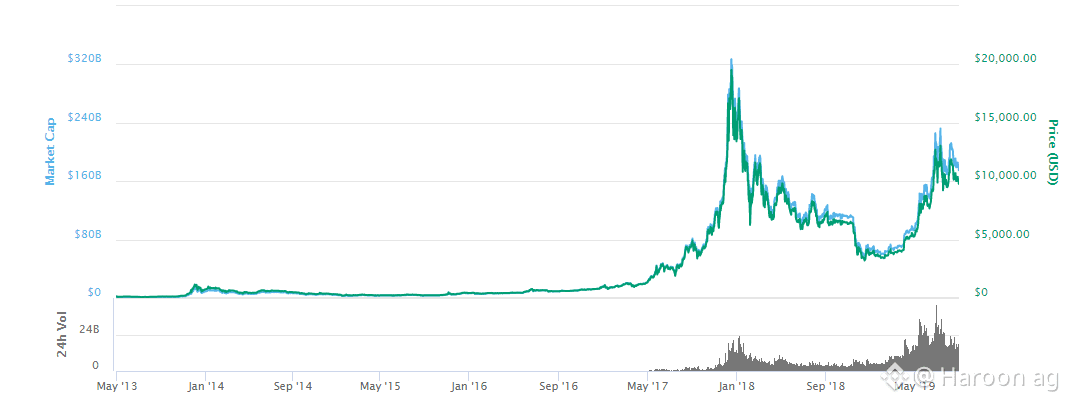
比特幣今天交易下跌,約在$87,000–$89,000區間,日內疲軟和近期賣壓。 這與宏觀新聞和清算驅動的更廣泛加密市場下跌一致。
市場情緒短期看跌:
比特幣已售出低於 ~$90,000,並且未能維持更高的水平。
強制清算和疲弱的宏觀信號(混合的就業數據 + 沒有明確的降息預期)正在壓制像加密貨幣這樣的風險資產。
技術水平關注
關鍵支撐水平
$86,000–$88,000 區域:當前本地支撐,買家近期已介入。
低支撐在 ~$85,000 附近 — 一旦突破可能加速下行。
關鍵阻力
$90,000 — 心理支點
$91,000–$92,000 區域 — 先前的阻力帶。
短期技術信號
相對強弱指數和布林帶指標顯示價格接近下軌/超賣至中性區域 — 可能的反彈區域,但需要確認。
收盤高於 $88,500–$90,000 將有助於將偏向略微轉向上行。
看漲與看跌情形
看漲(如確認):✔ 從支撐 ~$86k–$88k 反彈
✔ 日線收盤高於 ~~$90k
潛在上行至 $91k–$92k 然後更高的阻力。
看跌(如突破):✘ 清晰突破低於 $86k
如果賣方加速,可能看到延伸至 $80k–$82k 區間。
宏觀與情緒驅動因素
在更廣泛的風險規避條件下,加密市場疲軟,股票波動。
就業數據和美聯儲的溫和降息預期正在損害風險偏好。
大規模清算表明槓桿交易者的短期定位風險。
摘要
短期觀點:中立到略看跌,除非比特幣能夠重新奪回並收盤高於 $90k–$92k。
今天的關鍵水平:
支撐: ~$86k–$88k
阻力: ~$90k–$92k
#BinanceAlphaAlert #BinanceBlockchainWeek #TrumpTariffs #WriteToEarnUpgrade
{spot}(BTCUSDT)
---
$BTC
比特幣今天交易下跌,約在$87,000–$89,000區間,日內疲軟和近期賣壓。 這與宏觀新聞和清算驅動的更廣泛加密市場下跌一致。
市場情緒短期看跌:
比特幣已售出低於 ~$90,000,並且未能維持更高的水平。
強制清算和疲弱的宏觀信號(混合的就業數據 + 沒有明確的降息預期)正在壓制像加密貨幣這樣的風險資產。
技術水平關注
關鍵支撐水平
$86,000–$88,000 區域:當前本地支撐,買家近期已介入。
低支撐在 ~$85,000 附近 — 一旦突破可能加速下行。
關鍵阻力
$90,000 — 心理支點
$91,000–$92,000 區域 — 先前的阻力帶。
短期技術信號
相對強弱指數和布林帶指標顯示價格接近下軌/超賣至中性區域 — 可能的反彈區域,但需要確認。
收盤高於 $88,500–$90,000 將有助於將偏向略微轉向上行。
看漲與看跌情形
看漲(如確認):✔ 從支撐 ~$86k–$88k 反彈
✔ 日線收盤高於 ~~$90k
潛在上行至 $91k–$92k 然後更高的阻力。
看跌(如突破):✘ 清晰突破低於 $86k
如果賣方加速,可能看到延伸至 $80k–$82k 區間。
宏觀與情緒驅動因素
在更廣泛的風險規避條件下,加密市場疲軟,股票波動。
就業數據和美聯儲的溫和降息預期正在損害風險偏好。
大規模清算表明槓桿交易者的短期定位風險。
摘要
短期觀點:中立到略看跌,除非比特幣能夠重新奪回並收盤高於 $90k–$92k。
今天的關鍵水平:
支撐: ~$86k–$88k
阻力: ~$90k–$92k
#BinanceAlphaAlert #BinanceBlockchainWeek #TrumpTariffs #WriteToEarnUpgrade
---
比特幣今天交易下跌,約在$87,000–$89,000區間,日內疲軟和近期賣壓。 這與宏觀新聞和清算驅動的更廣泛加密市場下跌一致。
市場情緒短期看跌:
比特幣已售出低於 ~$90,000,並且未能維持更高的水平。
強制清算和疲弱的宏觀信號(混合的就業數據 + 沒有明確的降息預期)正在壓制像加密貨幣這樣的風險資產。
技術水平關注
關鍵支撐水平
$86,000–$88,000 區域:當前本地支撐,買家近期已介入。
低支撐在 ~$85,000 附近 — 一旦突破可能加速下行。
關鍵阻力
$90,000 — 心理支點
$91,000–$92,000 區域 — 先前的阻力帶。
短期技術信號
相對強弱指數和布林帶指標顯示價格接近下軌/超賣至中性區域 — 可能的反彈區域,但需要確認。
收盤高於 $88,500–$90,000 將有助於將偏向略微轉向上行。
看漲與看跌情形
看漲(如確認):✔ 從支撐 ~$86k–$88k 反彈
✔ 日線收盤高於 ~~$90k
潛在上行至 $91k–$92k 然後更高的阻力。
看跌(如突破):✘ 清晰突破低於 $86k
如果賣方加速,可能看到延伸至 $80k–$82k 區間。
宏觀與情緒驅動因素
在更廣泛的風險規避條件下,加密市場疲軟,股票波動。
就業數據和美聯儲的溫和降息預期正在損害風險偏好。
大規模清算表明槓桿交易者的短期定位風險。
摘要
短期觀點:中立到略看跌,除非比特幣能夠重新奪回並收盤高於 $90k–$92k。
今天的關鍵水平:
支撐: ~$86k–$88k
阻力: ~$90k–$92k
#BinanceAlphaAlert #BinanceBlockchainWeek #TrumpTariffs #WriteToEarnUpgrade
---
23
·
--
查看翻譯
$BTC
{spot}(BTCUSDT)
$BTC
Here’s the latest Bitcoin (BTC) price & market analysis including a live price chart, key technical levels, and short-term outlook:
Bitcoin (BTC)
$92,438.00
+$2,183.00(+2.42%)Today
1D5D1M6MYTD1Y5Ymax
6:25 AM
📌 Current Market Snapshot (Live BTC Price)
As of right now, Bitcoin (BTC) is trading around ~$92,400 USD, with intraday volatility between roughly ~$89,300 and ~$93,500.
This reflects a choppy market in the $90K–$95K zone recently.
Recent Price Action & News
Here’s what’s happening in the market right now:
Market Drivers
Volatility persists: BTC recently dipped below $90K with renewed risk-off sentiment in global markets. Reuters
Fed monetary outlook: After a rate cut, the cautious tone from the U.S. Federal Reserve tempered bullish expectations. Barron's
Institutional buying still happening: Strategy (MicroStrategy) has continued to accumulate significant BTC. Barron's
Mixed sentiment: Some sessions see rebounds above $92K–$94K as risk appetite returns. The Economic Times
Short-term sentiment: still mixed/neutral–slightly bearish to neutral until a clean breakout or breakdown occurs.
Key Technical Levels (Support & Resistance)
LevelImportance$95,000–$100,000Immediate upside zone & psychological target if BTC breaks higher (bullish) — resistance.
$92,000–$94,000Current trading range/resistance zone — needs solid breakout. $90,000Major psychological support zone — recent pivot
point.
Forbes$86,000–$88,000Stronger lower support — key breakdown line.$80,000–$85,000Deeper support in bear case.
Short-term structure: price has been trapped in a range, forming a symmetrical triangle pattern — typically a breakout signal is coming soon.
#BinanceAlphaAlert #TrumpTariffs $BTC #CPIWatch #WriteToEarnUpgrade
$BTC
$BTC
Here’s the latest Bitcoin (BTC) price & market analysis including a live price chart, key technical levels, and short-term outlook:
Bitcoin (BTC)
$92,438.00
+$2,183.00(+2.42%)Today
1D5D1M6MYTD1Y5Ymax
6:25 AM
📌 Current Market Snapshot (Live BTC Price)
As of right now, Bitcoin (BTC) is trading around ~$92,400 USD, with intraday volatility between roughly ~$89,300 and ~$93,500.
This reflects a choppy market in the $90K–$95K zone recently.
Recent Price Action & News
Here’s what’s happening in the market right now:
Market Drivers
Volatility persists: BTC recently dipped below $90K with renewed risk-off sentiment in global markets. Reuters
Fed monetary outlook: After a rate cut, the cautious tone from the U.S. Federal Reserve tempered bullish expectations. Barron's
Institutional buying still happening: Strategy (MicroStrategy) has continued to accumulate significant BTC. Barron's
Mixed sentiment: Some sessions see rebounds above $92K–$94K as risk appetite returns. The Economic Times
Short-term sentiment: still mixed/neutral–slightly bearish to neutral until a clean breakout or breakdown occurs.
Key Technical Levels (Support & Resistance)
LevelImportance$95,000–$100,000Immediate upside zone & psychological target if BTC breaks higher (bullish) — resistance.
$92,000–$94,000Current trading range/resistance zone — needs solid breakout. $90,000Major psychological support zone — recent pivot
point.
Forbes$86,000–$88,000Stronger lower support — key breakdown line.$80,000–$85,000Deeper support in bear case.
Short-term structure: price has been trapped in a range, forming a symmetrical triangle pattern — typically a breakout signal is coming soon.
#BinanceAlphaAlert #TrumpTariffs $BTC #CPIWatch #WriteToEarnUpgrade
$BTC
Here’s the latest Bitcoin (BTC) price & market analysis including a live price chart, key technical levels, and short-term outlook:
Bitcoin (BTC)
$92,438.00
+$2,183.00(+2.42%)Today
1D5D1M6MYTD1Y5Ymax
6:25 AM
📌 Current Market Snapshot (Live BTC Price)
As of right now, Bitcoin (BTC) is trading around ~$92,400 USD, with intraday volatility between roughly ~$89,300 and ~$93,500.
This reflects a choppy market in the $90K–$95K zone recently.
Recent Price Action & News
Here’s what’s happening in the market right now:
Market Drivers
Volatility persists: BTC recently dipped below $90K with renewed risk-off sentiment in global markets. Reuters
Fed monetary outlook: After a rate cut, the cautious tone from the U.S. Federal Reserve tempered bullish expectations. Barron's
Institutional buying still happening: Strategy (MicroStrategy) has continued to accumulate significant BTC. Barron's
Mixed sentiment: Some sessions see rebounds above $92K–$94K as risk appetite returns. The Economic Times
Short-term sentiment: still mixed/neutral–slightly bearish to neutral until a clean breakout or breakdown occurs.
Key Technical Levels (Support & Resistance)
LevelImportance$95,000–$100,000Immediate upside zone & psychological target if BTC breaks higher (bullish) — resistance.
$92,000–$94,000Current trading range/resistance zone — needs solid breakout. $90,000Major psychological support zone — recent pivot
point.
Forbes$86,000–$88,000Stronger lower support — key breakdown line.$80,000–$85,000Deeper support in bear case.
Short-term structure: price has been trapped in a range, forming a symmetrical triangle pattern — typically a breakout signal is coming soon.
#BinanceAlphaAlert #TrumpTariffs $BTC #CPIWatch #WriteToEarnUpgrade
7
·
--
查看翻譯
$BTC
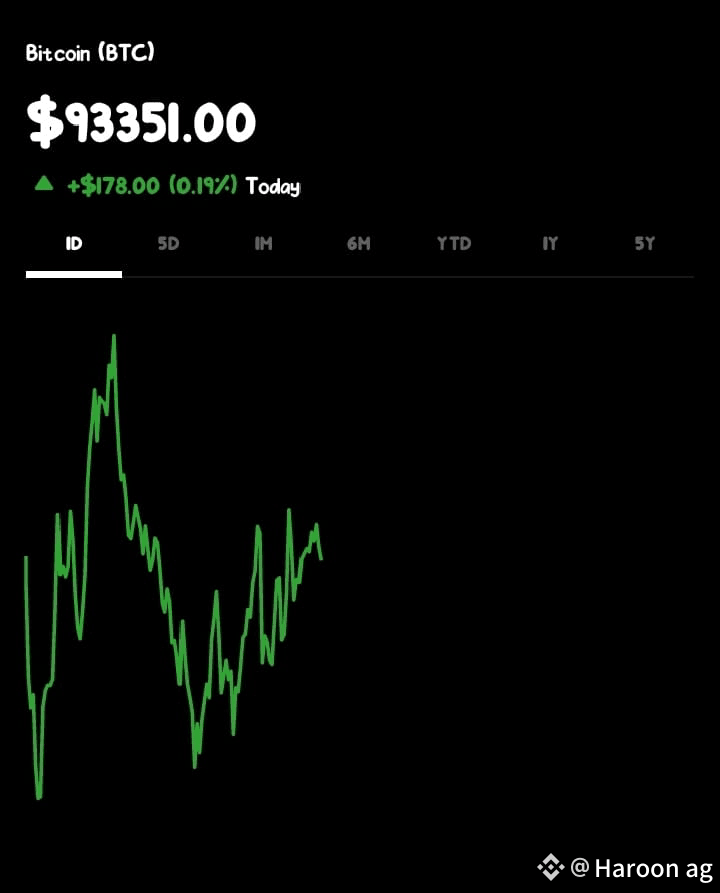
BTC recently jumped back above ~ $93,000, after dipping as low as ~$84,000.
According to technical-models and market commentary, BTC is hovering near its so-called "production cost" area (~ $92,300), which suggests the current price could reflect a local bottom or fair value zone.
Some analysts see a possible breakout rally: a decisive close above the ~$93,000–$94,000 zone could open room toward $96,000–$98,000 in short-term.
On the flip side: volatility remains high. There's risk of a pull-back if bearish pressure returns, especially if macroeconomic signals worsen or institutional inflows slow.
In medium-term view (next few weeks) many predictions place BTC's likely range between ~ $88,500 and $94,500 — unless a breakout triggers stronger momentum.
---
What this means for you as trader
If BTC holds above ~$92–93K and breaks toward ~$96–98K — could be a chance for short-term gains.
But given volatility, consider tight risk management if opening position now — as BTC could oscillate in wide range or drop before next rally.
For your style (you trade binary/short-term setups) — this rebound could offer setups, but only trade with strict stop-loss, and maybe wait for confirmation (price + volume + maybe a chart pattern) before entering.
If you like — I can prepare 3 chart-based BTC trade setups for next 48-72h (with entry, stop-loss, targets) similar to your strategy style. Want me to build them now for you?
{spot}(BTCUSDT)
#BinanceBlockchainWeek #BinanceAlphaAlert #TrumpTariffs
$BTC
BTC recently jumped back above ~ $93,000, after dipping as low as ~$84,000.
According to technical-models and market commentary, BTC is hovering near its so-called "production cost" area (~ $92,300), which suggests the current price could reflect a local bottom or fair value zone.
Some analysts see a possible breakout rally: a decisive close above the ~$93,000–$94,000 zone could open room toward $96,000–$98,000 in short-term.
On the flip side: volatility remains high. There's risk of a pull-back if bearish pressure returns, especially if macroeconomic signals worsen or institutional inflows slow.
In medium-term view (next few weeks) many predictions place BTC's likely range between ~ $88,500 and $94,500 — unless a breakout triggers stronger momentum.
---
What this means for you as trader
If BTC holds above ~$92–93K and breaks toward ~$96–98K — could be a chance for short-term gains.
But given volatility, consider tight risk management if opening position now — as BTC could oscillate in wide range or drop before next rally.
For your style (you trade binary/short-term setups) — this rebound could offer setups, but only trade with strict stop-loss, and maybe wait for confirmation (price + volume + maybe a chart pattern) before entering.
If you like — I can prepare 3 chart-based BTC trade setups for next 48-72h (with entry, stop-loss, targets) similar to your strategy style. Want me to build them now for you?
#BinanceBlockchainWeek #BinanceAlphaAlert #TrumpTariffs
BTC recently jumped back above ~ $93,000, after dipping as low as ~$84,000.
According to technical-models and market commentary, BTC is hovering near its so-called "production cost" area (~ $92,300), which suggests the current price could reflect a local bottom or fair value zone.
Some analysts see a possible breakout rally: a decisive close above the ~$93,000–$94,000 zone could open room toward $96,000–$98,000 in short-term.
On the flip side: volatility remains high. There's risk of a pull-back if bearish pressure returns, especially if macroeconomic signals worsen or institutional inflows slow.
In medium-term view (next few weeks) many predictions place BTC's likely range between ~ $88,500 and $94,500 — unless a breakout triggers stronger momentum.
---
What this means for you as trader
If BTC holds above ~$92–93K and breaks toward ~$96–98K — could be a chance for short-term gains.
But given volatility, consider tight risk management if opening position now — as BTC could oscillate in wide range or drop before next rally.
For your style (you trade binary/short-term setups) — this rebound could offer setups, but only trade with strict stop-loss, and maybe wait for confirmation (price + volume + maybe a chart pattern) before entering.
If you like — I can prepare 3 chart-based BTC trade setups for next 48-72h (with entry, stop-loss, targets) similar to your strategy style. Want me to build them now for you?
#BinanceBlockchainWeek #BinanceAlphaAlert #TrumpTariffs
21
·
--
看漲
查看翻譯
$BTC
BTC is trading around ≈ USD 93,300–93,500. CoinMarketCap+1
This marks a rebound after a recent pullback from 2025 highs. StatMuse+2YCharts+2
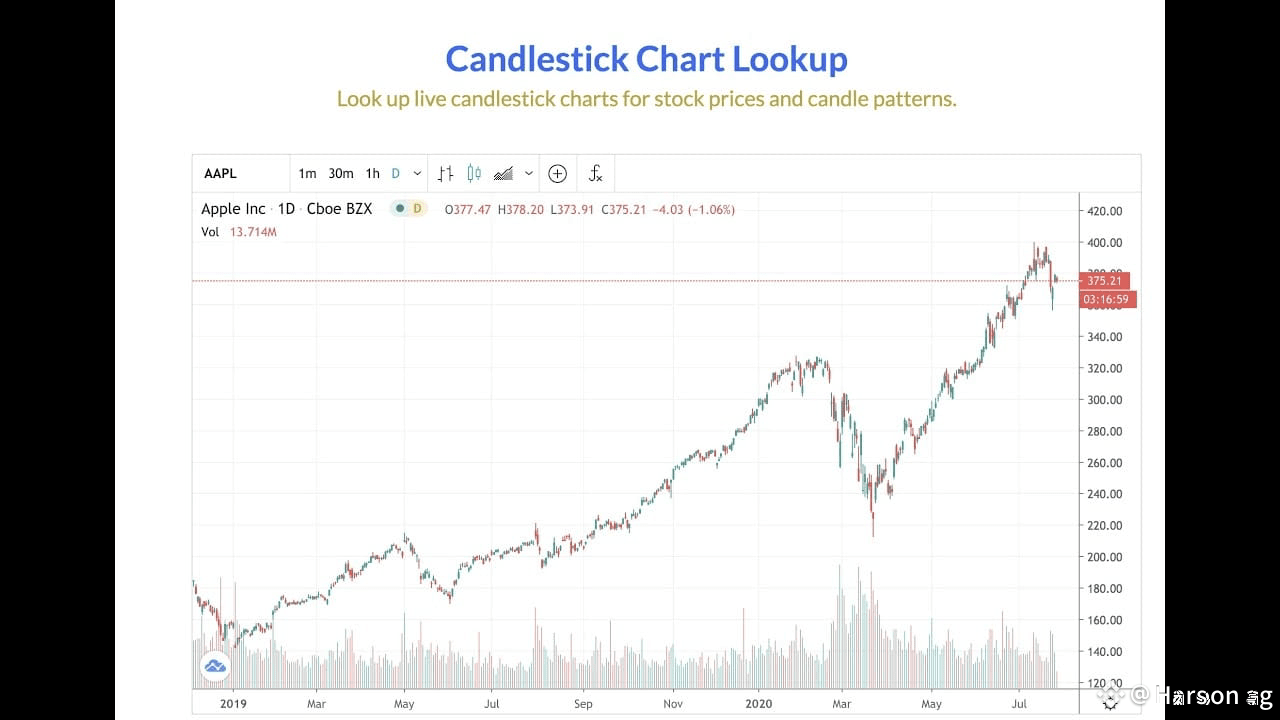
What the Candlesticks Show
Recent daily candlesticks show large green bodies — indicative of renewed buying pressure after consolidation. That hints at short-term bullish sentiment.
The bounce from near-support (around low-90Ks) forming higher lows suggests accumulation rather than panic selling.
However — given that BTC recently dropped from much higher levels (above 100 K) — the chart still warns of potential volatility; a strong reversal candle or a break below support could lead to deeper pullback.
What Looks Potentially Bullish
If BTC maintains support ~ USD 90,000–92,000 and closes daily candles above this zone, the bulls may try pushing toward USD 100,000+ again.
The recent rebound suggests market participants are re-entering — possibly viewing the dip as a buying opportunity.
Risks & What Could Go Wrong
A sharp macroeconomic shock or negative sentiment could easily reverse the current bounce — especially if BTC fails to hold above support.
Given the recent high volatility, false breakouts remain a real risk; traders should watch for confirmation before assuming a new uptrend.
{spot}(BTCUSDT)
$BTC #TrumpTariffs #BinanceAlphaAlert #BinanceAlphaAlert #BinanceBlockchainWeek
$BTC
BTC is trading around ≈ USD 93,300–93,500. CoinMarketCap+1
This marks a rebound after a recent pullback from 2025 highs. StatMuse+2YCharts+2
What the Candlesticks Show
Recent daily candlesticks show large green bodies — indicative of renewed buying pressure after consolidation. That hints at short-term bullish sentiment.
The bounce from near-support (around low-90Ks) forming higher lows suggests accumulation rather than panic selling.
However — given that BTC recently dropped from much higher levels (above 100 K) — the chart still warns of potential volatility; a strong reversal candle or a break below support could lead to deeper pullback.
What Looks Potentially Bullish
If BTC maintains support ~ USD 90,000–92,000 and closes daily candles above this zone, the bulls may try pushing toward USD 100,000+ again.
The recent rebound suggests market participants are re-entering — possibly viewing the dip as a buying opportunity.
Risks & What Could Go Wrong
A sharp macroeconomic shock or negative sentiment could easily reverse the current bounce — especially if BTC fails to hold above support.
Given the recent high volatility, false breakouts remain a real risk; traders should watch for confirmation before assuming a new uptrend.
$BTC #TrumpTariffs #BinanceAlphaAlert #BinanceAlphaAlert #BinanceBlockchainWeek
BTC is trading around ≈ USD 93,300–93,500. CoinMarketCap+1
This marks a rebound after a recent pullback from 2025 highs. StatMuse+2YCharts+2
What the Candlesticks Show
Recent daily candlesticks show large green bodies — indicative of renewed buying pressure after consolidation. That hints at short-term bullish sentiment.
The bounce from near-support (around low-90Ks) forming higher lows suggests accumulation rather than panic selling.
However — given that BTC recently dropped from much higher levels (above 100 K) — the chart still warns of potential volatility; a strong reversal candle or a break below support could lead to deeper pullback.
What Looks Potentially Bullish
If BTC maintains support ~ USD 90,000–92,000 and closes daily candles above this zone, the bulls may try pushing toward USD 100,000+ again.
The recent rebound suggests market participants are re-entering — possibly viewing the dip as a buying opportunity.
Risks & What Could Go Wrong
A sharp macroeconomic shock or negative sentiment could easily reverse the current bounce — especially if BTC fails to hold above support.
Given the recent high volatility, false breakouts remain a real risk; traders should watch for confirmation before assuming a new uptrend.
$BTC #TrumpTariffs #BinanceAlphaAlert #BinanceAlphaAlert #BinanceBlockchainWeek
1
13

·
--
查看翻譯
$BTC
$91,398.00
+$170.00(+0.19%)Today
4H
{spot}(BTCUSDT)
📊 Bitcoin —
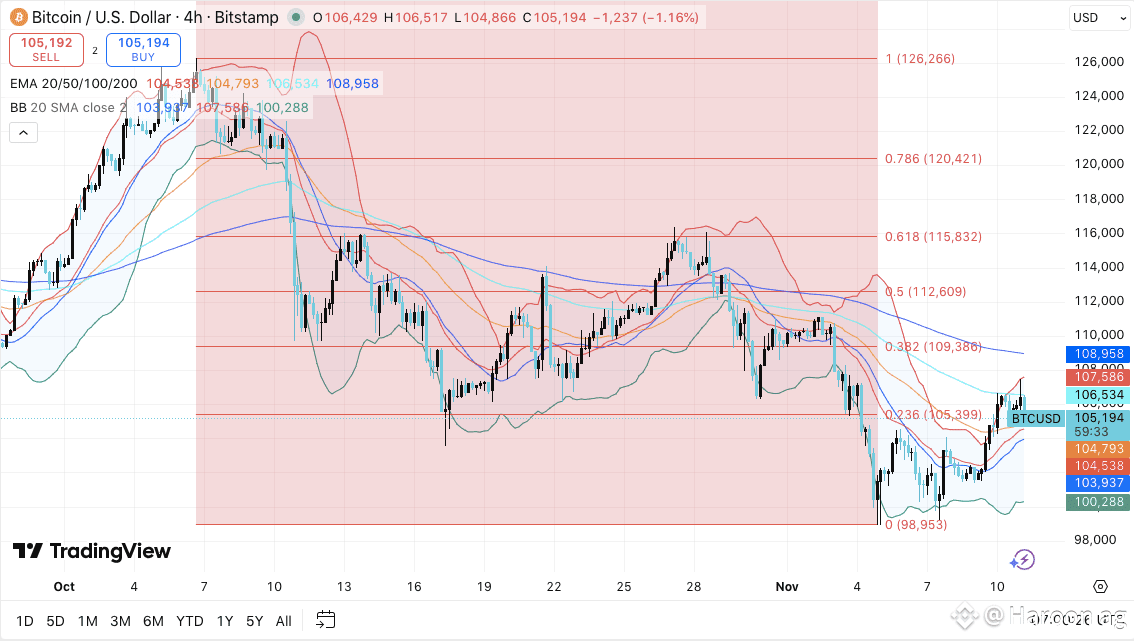
After peaking near ≈ $126,000 earlier in 2025, Bitcoin recently experienced a steep correction, dropping as much as ≈ 21% in November
The slump was driven by a mix of profit-taking from long-term holders, forced liquidations, and a broader shift toward risk-off sentiment globally — as some macroeconomic conditions (e.g. interest-rate uncertainty) dampened appetite for volatile assets.
Recently though, BTC has rebounded: it climbed back above $90,000+, signaling a possible stabilization or short-term bounce.
#BTCRebound90kNext? #BinanceHODLerAT #CPIWatch #ProjectCrypto
$BTC
$91,398.00
+$170.00(+0.19%)Today
4H
📊 Bitcoin —
After peaking near ≈ $126,000 earlier in 2025, Bitcoin recently experienced a steep correction, dropping as much as ≈ 21% in November
The slump was driven by a mix of profit-taking from long-term holders, forced liquidations, and a broader shift toward risk-off sentiment globally — as some macroeconomic conditions (e.g. interest-rate uncertainty) dampened appetite for volatile assets.
Recently though, BTC has rebounded: it climbed back above $90,000+, signaling a possible stabilization or short-term bounce.
#BTCRebound90kNext? #BinanceHODLerAT #CPIWatch #ProjectCrypto
$91,398.00
+$170.00(+0.19%)Today
4H
📊 Bitcoin —
After peaking near ≈ $126,000 earlier in 2025, Bitcoin recently experienced a steep correction, dropping as much as ≈ 21% in November
The slump was driven by a mix of profit-taking from long-term holders, forced liquidations, and a broader shift toward risk-off sentiment globally — as some macroeconomic conditions (e.g. interest-rate uncertainty) dampened appetite for volatile assets.
Recently though, BTC has rebounded: it climbed back above $90,000+, signaling a possible stabilization or short-term bounce.
#BTCRebound90kNext? #BinanceHODLerAT #CPIWatch #ProjectCrypto
8
8
登入以探索更多內容
加入幣安廣場中的全球加密貨幣用戶
⚡️ 獲取加密貨幣的最新和實用資訊。
💬 受到全球最大加密貨幣交易所的信任。
👍 發掘來自經過驗證創作者的真實見解。
電子郵件 / 電話號碼