Binance Square
Crypto Titan 1
32 貼文

Crypto Titan 1

#Bitcoin Alpha Hunter | DeFi | NFTs | Web3 Strategist https://t.me/x_CryptoTitan
0 關注
2 粉絲
2 點讚數
貼文
·
--
查看翻譯
Bitcoin’s bounce may be losing momentum. Price has made a lower high, while RSI has made a higher high. That’s a bearish divergence, showing stronger momentum underneath a weaker price structure. If $BTC loses $74K–$75K, the pullback could extend toward $61K. A strong daily close above $86K would invalidate the setup. The divergence is the warning. Price action confirms it.
Bitcoin’s bounce may be losing momentum.

Price has made a lower high, while RSI has made a higher high. That’s a bearish divergence, showing stronger momentum underneath a weaker price structure.

If $BTC loses $74K–$75K, the pullback could extend toward $61K.

A strong daily close above $86K would invalidate the setup.

The divergence is the warning. Price action confirms it.
查看翻譯
Bitcoin may be setting up for another massive cycle move. Twice before, similar monthly structures led to moves of 426% and 310%. BTC is now consolidating around the $60K–$79K zone after the latest cycle top. If this base holds and the range eventually breaks higher, the $200K–$280K area comes back into focus. History doesn’t have to repeat, but this structure is worth watching.
Bitcoin may be setting up for another massive cycle move.

Twice before, similar monthly structures led to moves of 426% and 310%.

BTC is now consolidating around the $60K–$79K zone after the latest cycle top.

If this base holds and the range eventually breaks higher, the $200K–$280K area comes back into focus.

History doesn’t have to repeat, but this structure is worth watching.
查看翻譯
Bitcoin just broke a trendline that held for 14 years. $BTC is sitting around $79.9K, right around the area that held through the 2017 and 2021 cycles. Now I’m watching $80K to $82K closely. Reclaim it on the monthly close and this could turn out to be a nasty fakeout. Fail to reclaim it, and I’d be much more cautious. Either way, this is one of those levels I wouldn’t ignore.
Bitcoin just broke a trendline that held for 14 years.

$BTC
is sitting around $79.9K, right around the area that held through the 2017 and 2021 cycles.

Now I’m watching $80K to $82K closely.

Reclaim it on the monthly close and this could turn out to be a nasty fakeout.

Fail to reclaim it, and I’d be much more cautious.

Either way, this is one of those levels I wouldn’t ignore.
查看翻譯
Bitcoin might be setting up for another shakeout. The last major bottom came when sentiment was extremely bearish and $BTC was sitting below its key moving averages. Now the opposite is happening. Sentiment is heavily bullish as BTC approaches the $82K to $83K resistance zone. If this becomes another trap, the EMA 20 around $71K is the first level I’d watch. Lose that, and the EMA 50 around $66K to $68K comes into play. But if the EMA 20 holds, the bullish structure remains intact and fresh highs become the next focus. The interesting part isn’t the sentiment. It’s whether price confirms it.
Bitcoin might be setting up for another shakeout.

The last major bottom came when sentiment was extremely bearish and
$BTC
was sitting below its key moving averages.

Now the opposite is happening.

Sentiment is heavily bullish as BTC approaches the $82K to $83K resistance zone.

If this becomes another trap, the EMA 20 around $71K is the first level I’d watch. Lose that, and the EMA 50 around $66K to $68K comes into play.

But if the EMA 20 holds, the bullish structure remains intact and fresh highs become the next focus.

The interesting part isn’t the sentiment.

It’s whether price confirms it.
查看翻譯
Bitcoin is back at the level that could decide the next move. $BTC is testing the same resistance that rejected it before and eventually sent price back toward the range lows. If this rejection repeats, I’d be watching $76K–$77K first, with $65K–$67K as the major support zone. A deeper breakdown could bring $60K back into play. But a strong weekly close above $82.3K would invalidate the bearish setup and shift the focus higher. For me, the reaction at $82K is what matters most right now.
Bitcoin is back at the level that could decide the next move.

$BTC
is testing the same resistance that rejected it before and eventually sent price back toward the range lows.

If this rejection repeats, I’d be watching $76K–$77K first, with $65K–$67K as the major support zone.

A deeper breakdown could bring $60K back into play.

But a strong weekly close above $82.3K would invalidate the bearish setup and shift the focus higher.

For me, the reaction at $82K is what matters most right now.
如果比特幣正在爲另一波 38% 的下跌做準備呢? 當前結構看起來與 1 月非常相似,當時 $BTC 在接近《Clarity Act》延遲消息的標題見頂後,下跌了 38%。 現在,$BTC 在另一條延遲消息之後,徘徊在 8 萬至 8.1 萬美元附近。 如果這種模式重演,7.45 萬美元是我首先關注的水平。 一旦失守,6.85 萬美元、6.45 萬美元,以及潛在的 5.2 萬至 5.65 萬美元區間都將成爲焦點。 這不是預測。 只是如果歷史再次押韻時的下行路線圖。
如果比特幣正在爲另一波 38% 的下跌做準備呢?

當前結構看起來與 1 月非常相似,當時
$BTC
在接近《Clarity Act》延遲消息的標題見頂後,下跌了 38%。

現在,$BTC
在另一條延遲消息之後,徘徊在 8 萬至 8.1 萬美元附近。

如果這種模式重演,7.45 萬美元是我首先關注的水平。

一旦失守,6.85 萬美元、6.45 萬美元,以及潛在的 5.2 萬至 5.65 萬美元區間都將成爲焦點。

這不是預測。

只是如果歷史再次押韻時的下行路線圖。
我正在密切觀察比特幣的一件事:循環結構。 自 2019 年以來的主要擴張,遵循了類似的架構。RSI 歸零(重置)、$BTC 建立底部、動能回歸,然後趨勢加速。 目前 RSI 在 59.36,BTC 約在 $80.7K。 如果歷史再次押韻,先是 $100K 到 $140K,接著才是 $200K,並可能達到 $280K。 這不是預測。只是我正在追蹤的路線圖。
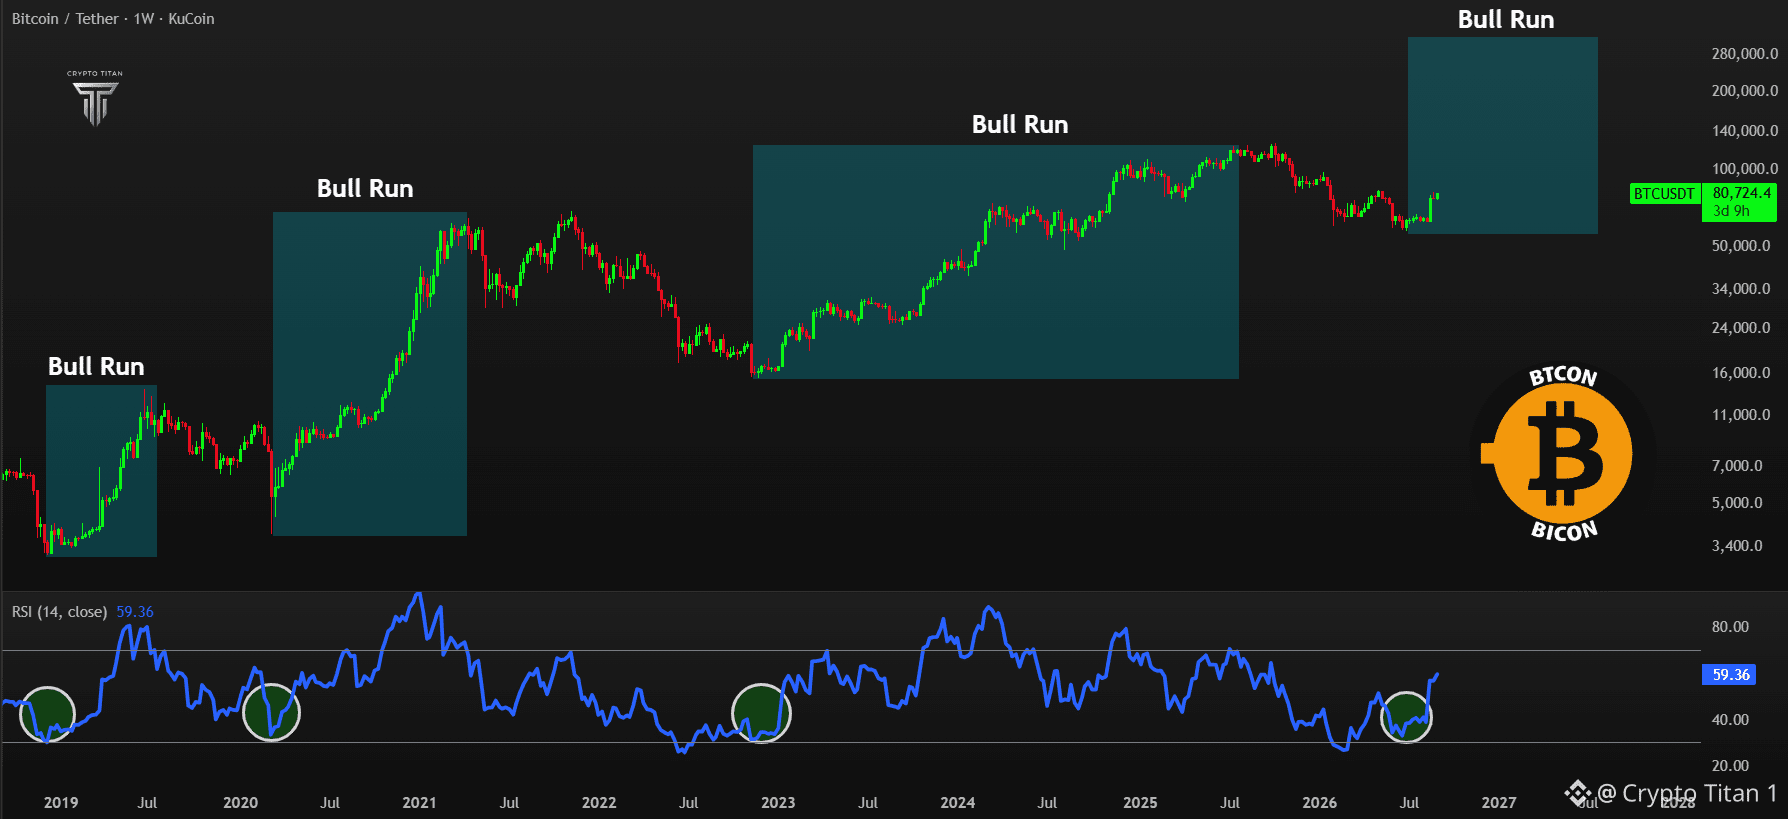
我正在密切觀察比特幣的一件事:循環結構。

自 2019 年以來的主要擴張,遵循了類似的架構。RSI 歸零(重置)、$BTC 建立底部、動能回歸,然後趨勢加速。

目前 RSI 在 59.36,BTC 約在 $80.7K。

如果歷史再次押韻,先是 $100K 到 $140K,接著才是 $200K,並可能達到 $280K。

這不是預測。只是我正在追蹤的路線圖。
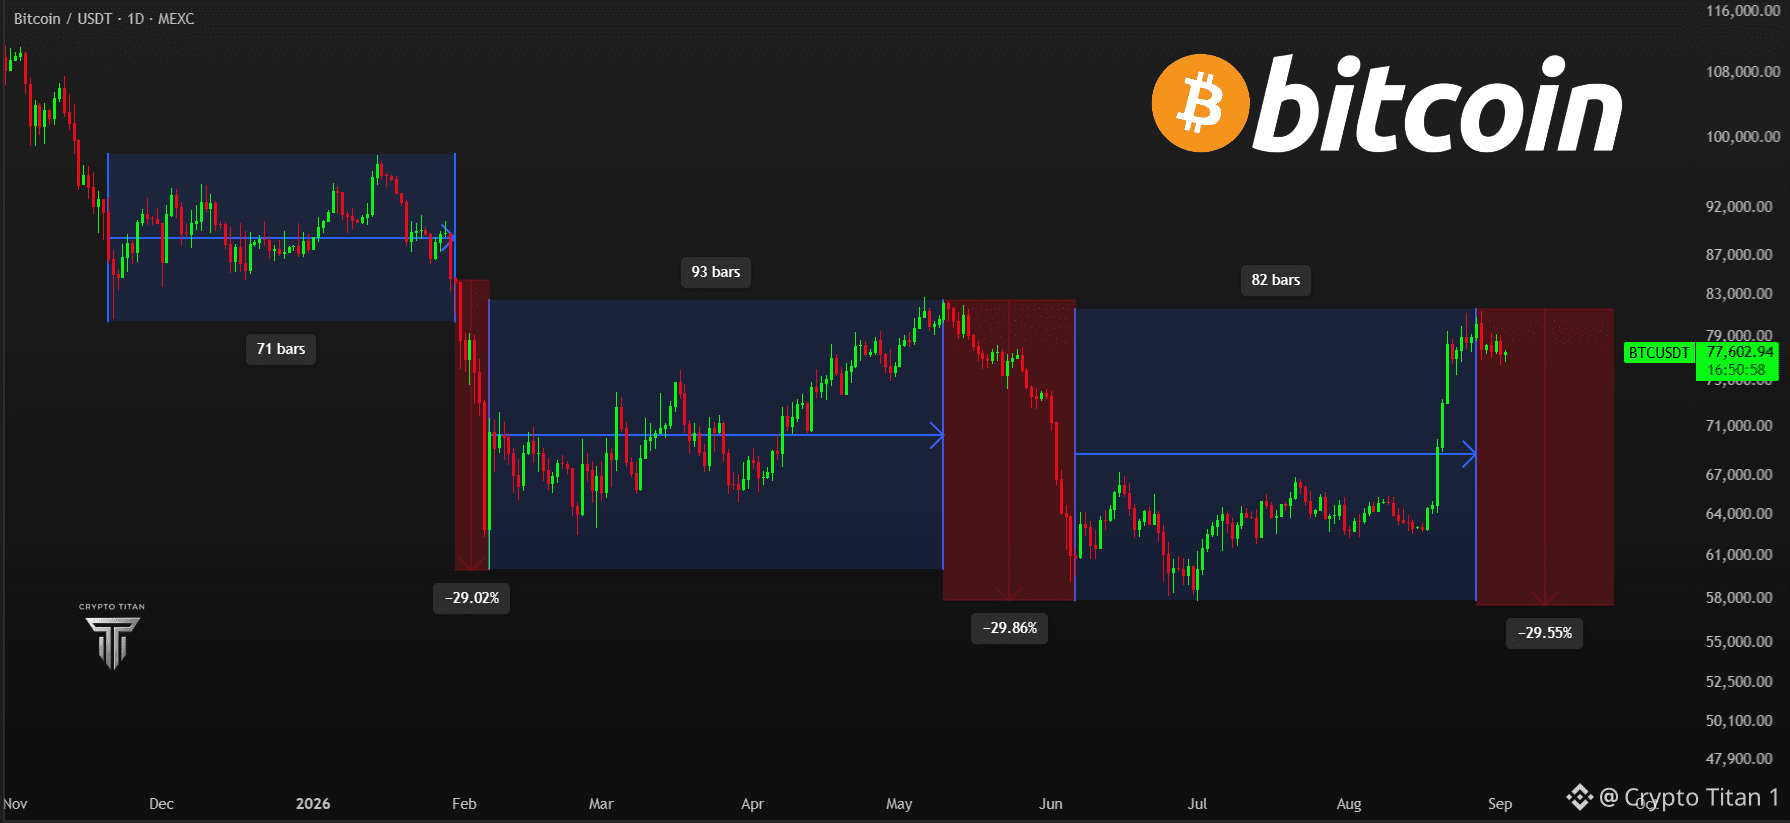
這張比特幣圖表值得你的關注。 $BTC 已經反覆呈現相同的節奏:長時間的盤整區間,隨後是急劇的 30% 回撤。 目前的區間如今已經成熟。 歷史走勢正在指向下一次重大修正。
這張比特幣圖表值得你的關注。

$BTC
已經反覆呈現相同的節奏:長時間的盤整區間,隨後是急劇的 30% 回撤。

目前的區間如今已經成熟。

歷史走勢正在指向下一次重大修正。
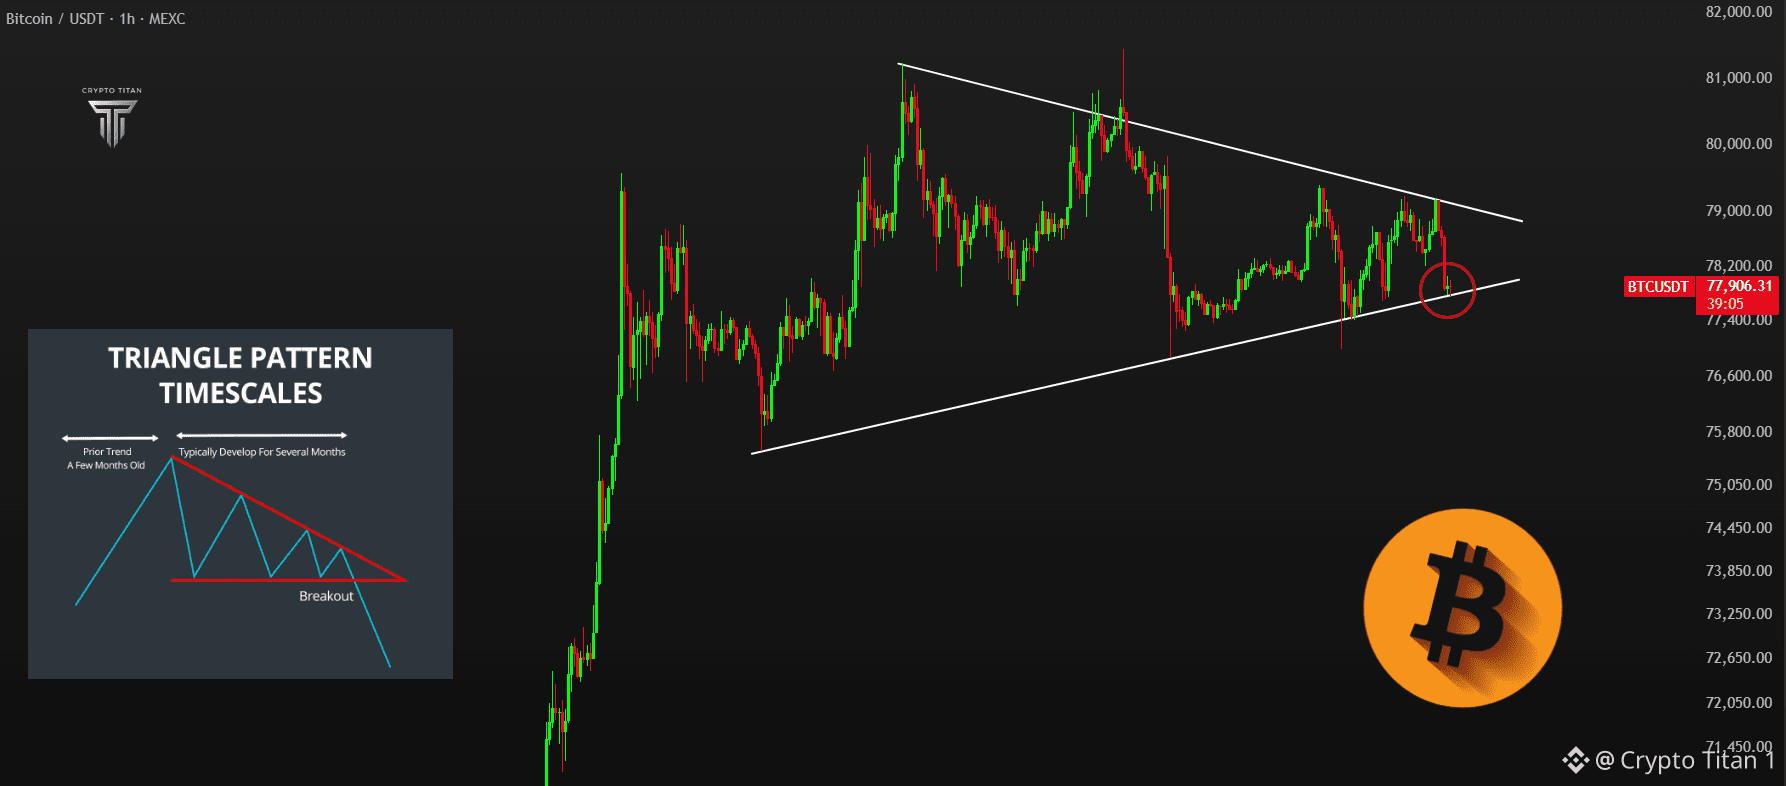
🚨 比特幣正在接近 78K 美元附近被擠壓。BTC 正在緊密的對稱三角形內壓縮,價格目前正在測試頂點。從這裡的突破可能會決定接下來短期走勢的基調。
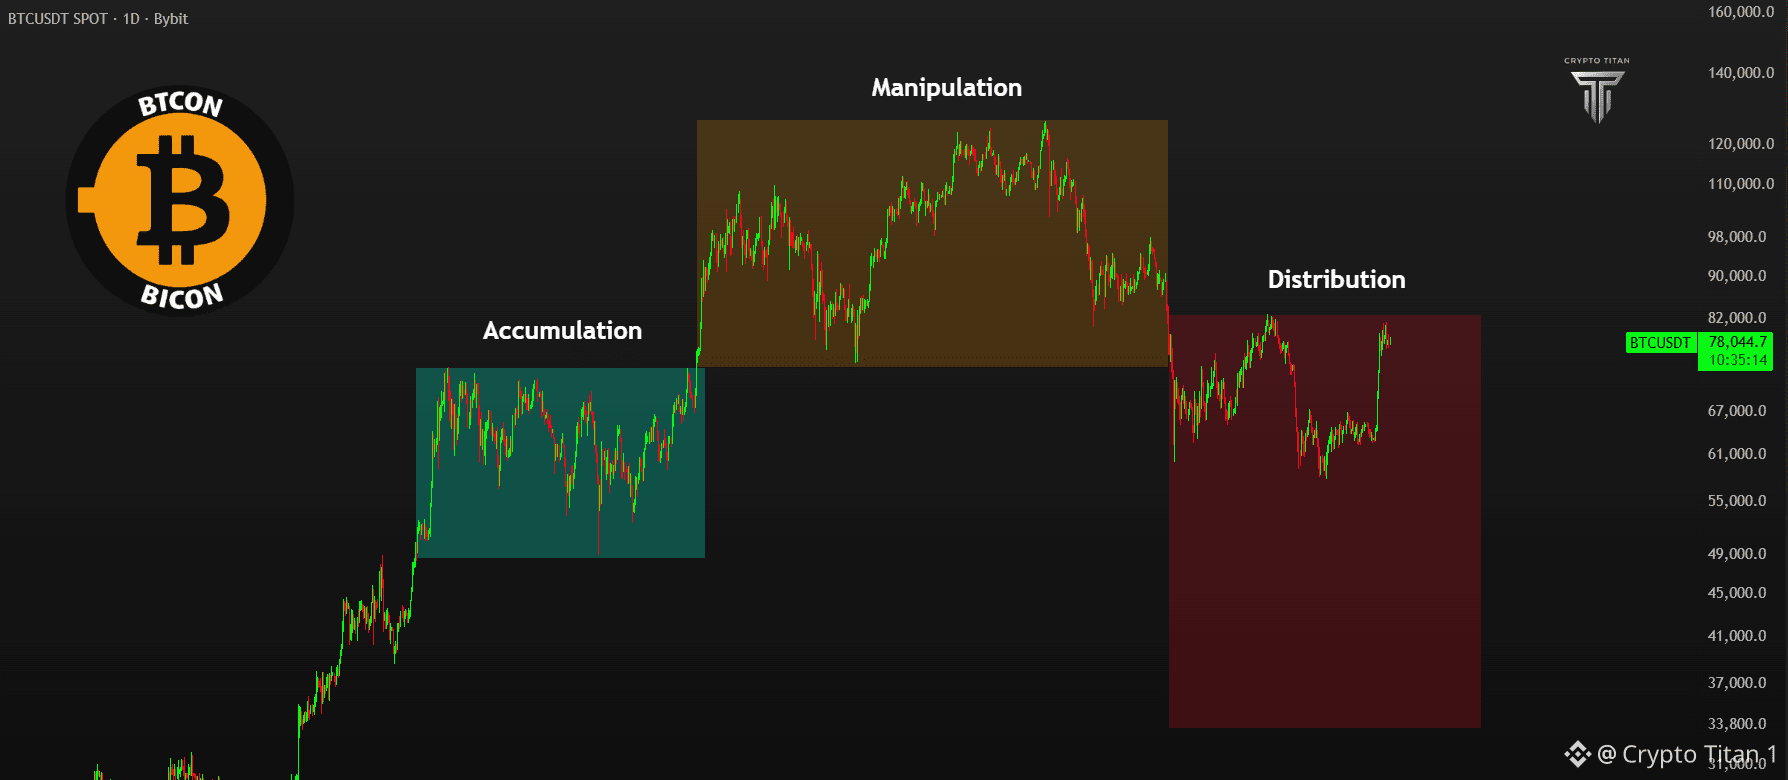
🚨 比特幣正進入分配階段。 $BTC 正在 $78K 附近盤整,而供給持續在上方堆積。 如果賣方在此持續拋售,下一個主要走勢可能會轉向下跌。 📉 請密切關注這個結構。
🚨 比特幣正進入分配階段。

$BTC
正在 $78K 附近盤整,而供給持續在上方堆積。

如果賣方在此持續拋售,下一個主要走勢可能會轉向下跌。 📉

請密切關注這個結構。
$ETH 正在 $2,445 附近閃現熟悉的警示。 日線 RSI 已推升至 **75** 之上,重演了此前在 $4,300 附近出現的超買回絕。 如果動能再次開始走弱,**較低的需求區可能會迅速成爲下一個磁鐵。📉
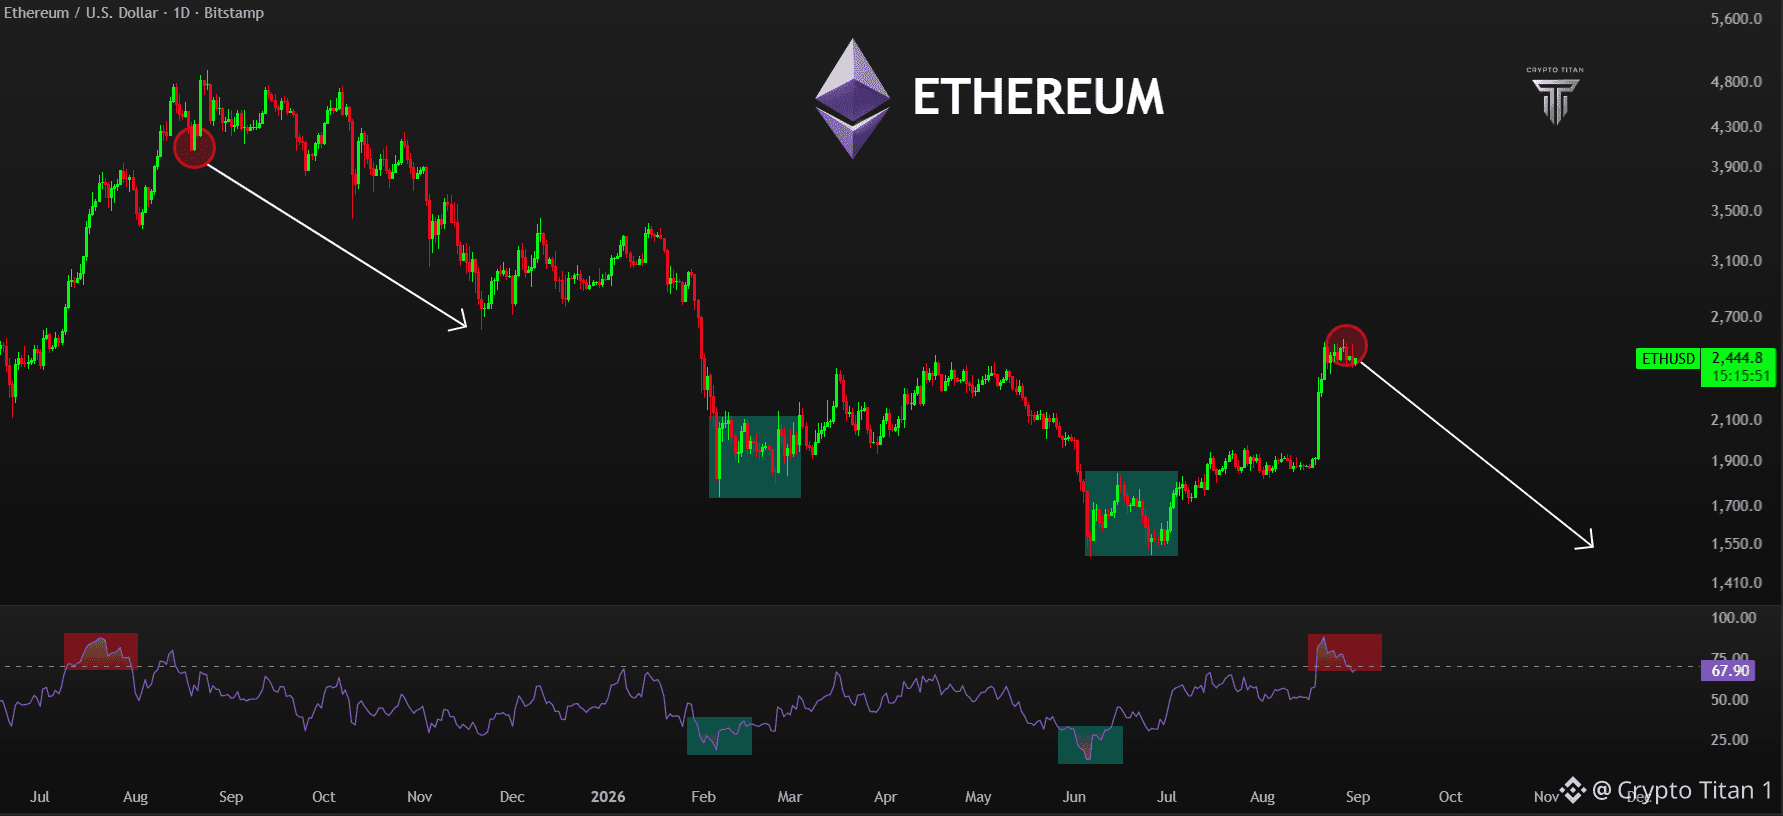
$ETH 正在 $2,445 附近閃現熟悉的警示。

日線 RSI 已推升至 **75** 之上,重演了此前在 $4,300 附近出現的超買回絕。

如果動能再次開始走弱,**較低的需求區可能會迅速成爲下一個磁鐵。📉
$BTC 正接近一個先前曾懲罰多頭的關鍵水準。 週線圖正在顯示,$77K 的 EMA50 區附近可能出現第三次潛在的多頭陷阱。 前兩次遭到拒絕後,分別帶來了 63% 與 69% 的回撤。 如果這個結構再次破裂,利空下行可能會在比特幣找到下一次明確的突破之前,變得非常猛烈。📉
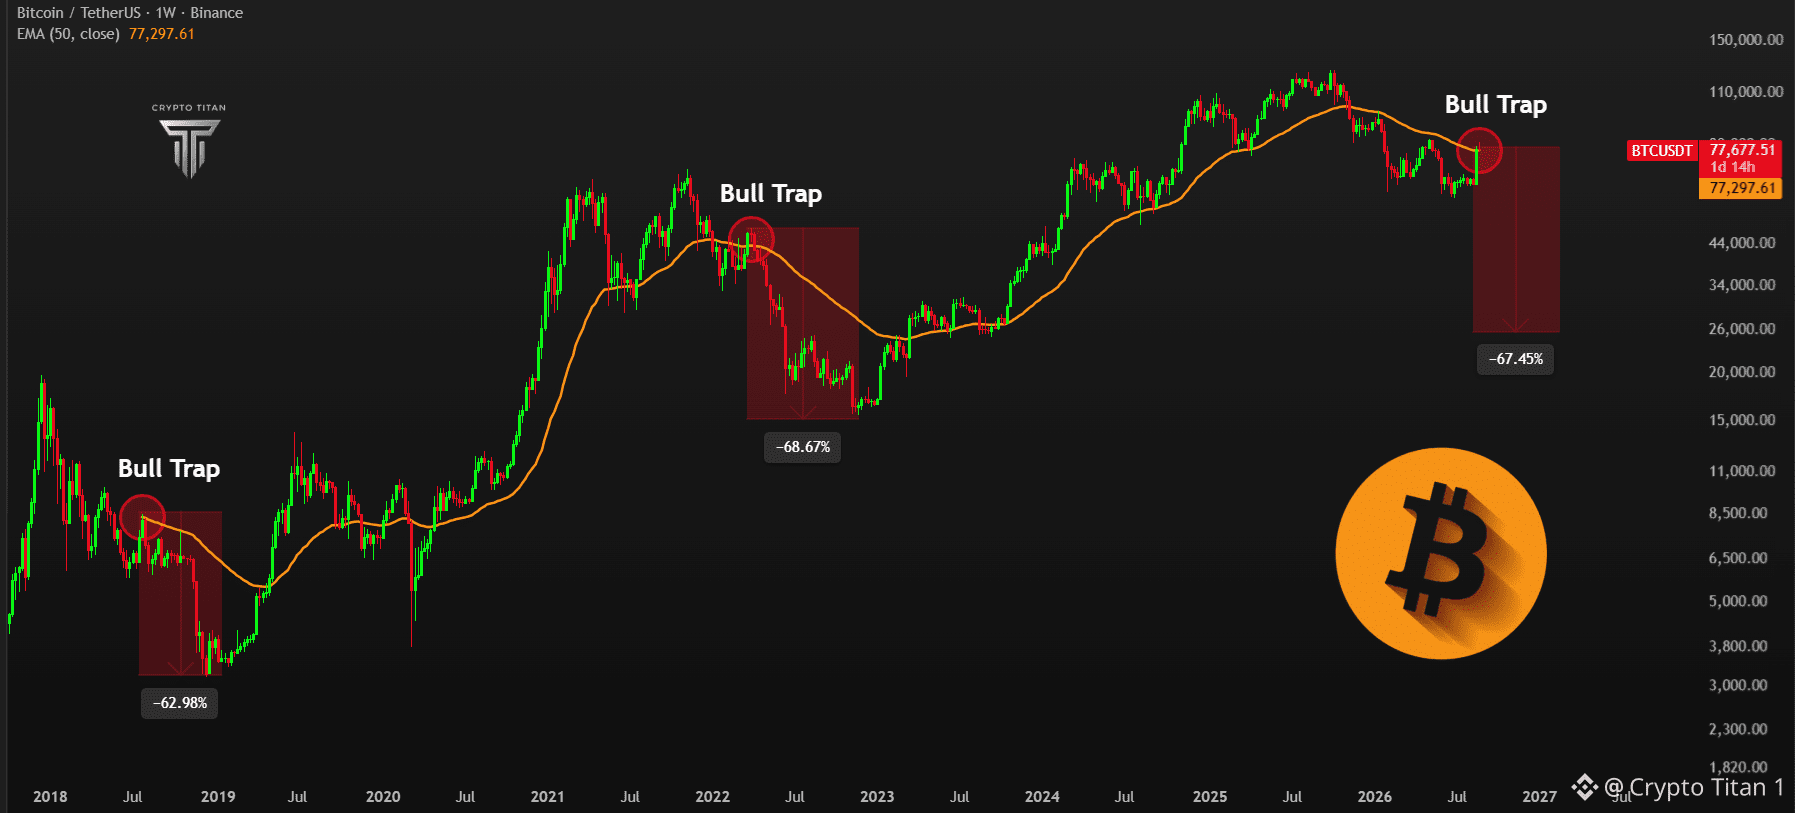
$BTC 正接近一個先前曾懲罰多頭的關鍵水準。

週線圖正在顯示,$77K 的 EMA50 區附近可能出現第三次潛在的多頭陷阱。

前兩次遭到拒絕後,分別帶來了 63% 與 69% 的回撤。

如果這個結構再次破裂,利空下行可能會在比特幣找到下一次明確的突破之前,變得非常猛烈。📉
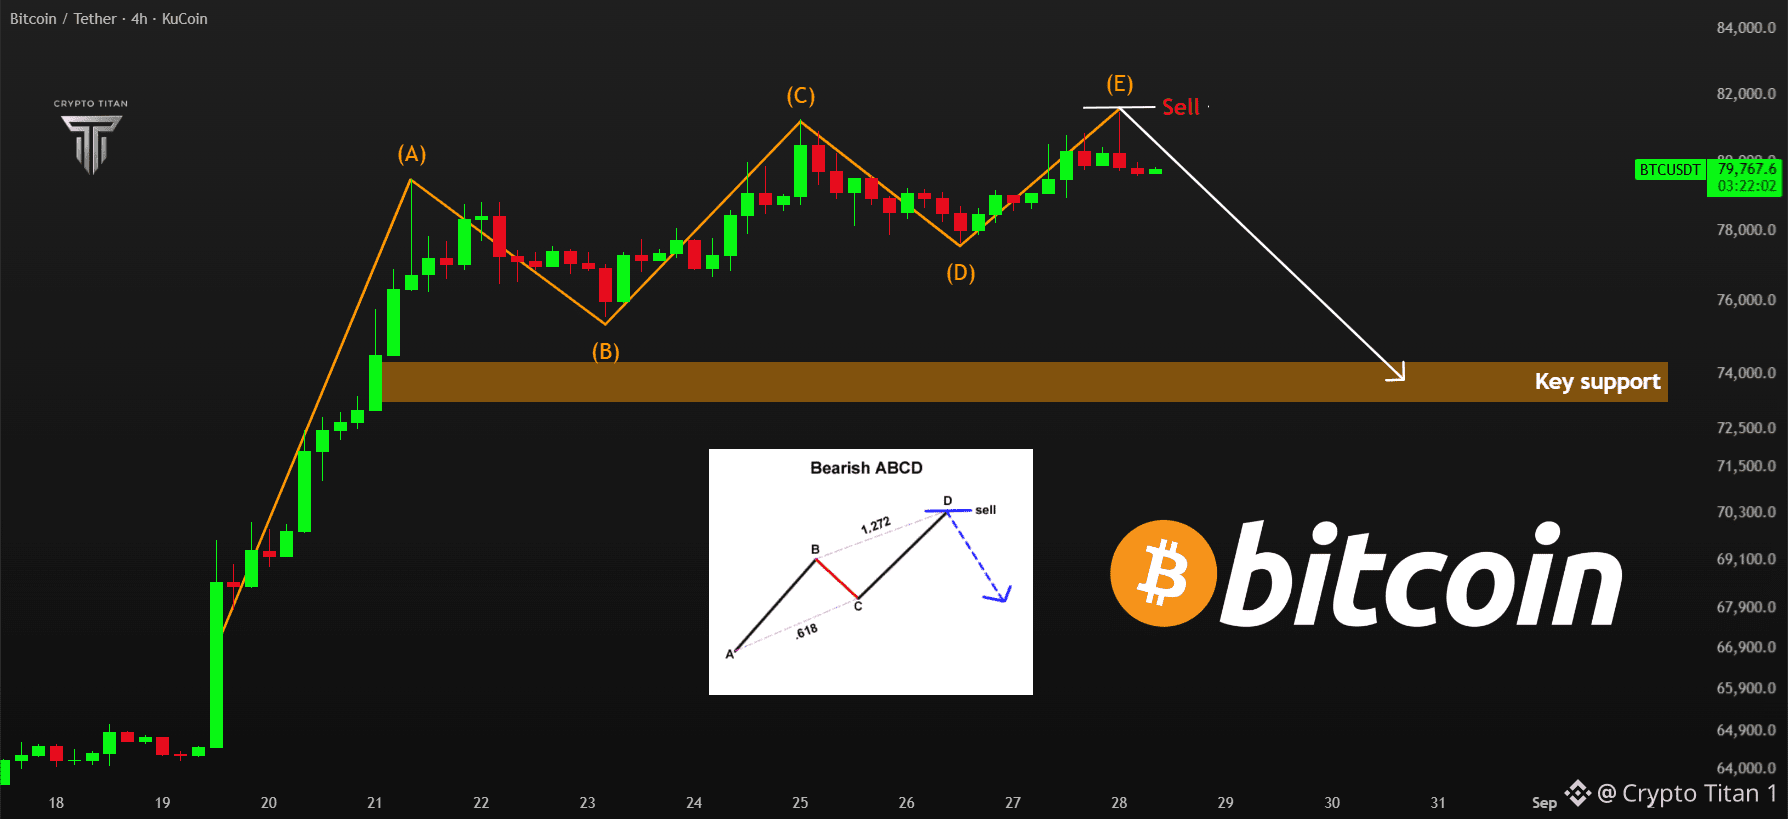
🚨 比特幣正接近一個關鍵決策點。4H 結構正在形成看跌的 ABCD 型態,最後一段將觸及 82K 美元的阻力區。若在此處遭到拒絕,可能會把 $BTC 再次推向 74K 美元的關鍵支撐。📉 這個位置可能會決定下一個重大走勢。
🚨 以太坊正在形成一個清晰的上升三角形。 我已經在我目前 $ETH 的進場位置,約在現階段的價格附近,而 $2,530 仍是關鍵阻力。 若能乾淨突破並站上它,可能會觸發下一波上漲走勢。
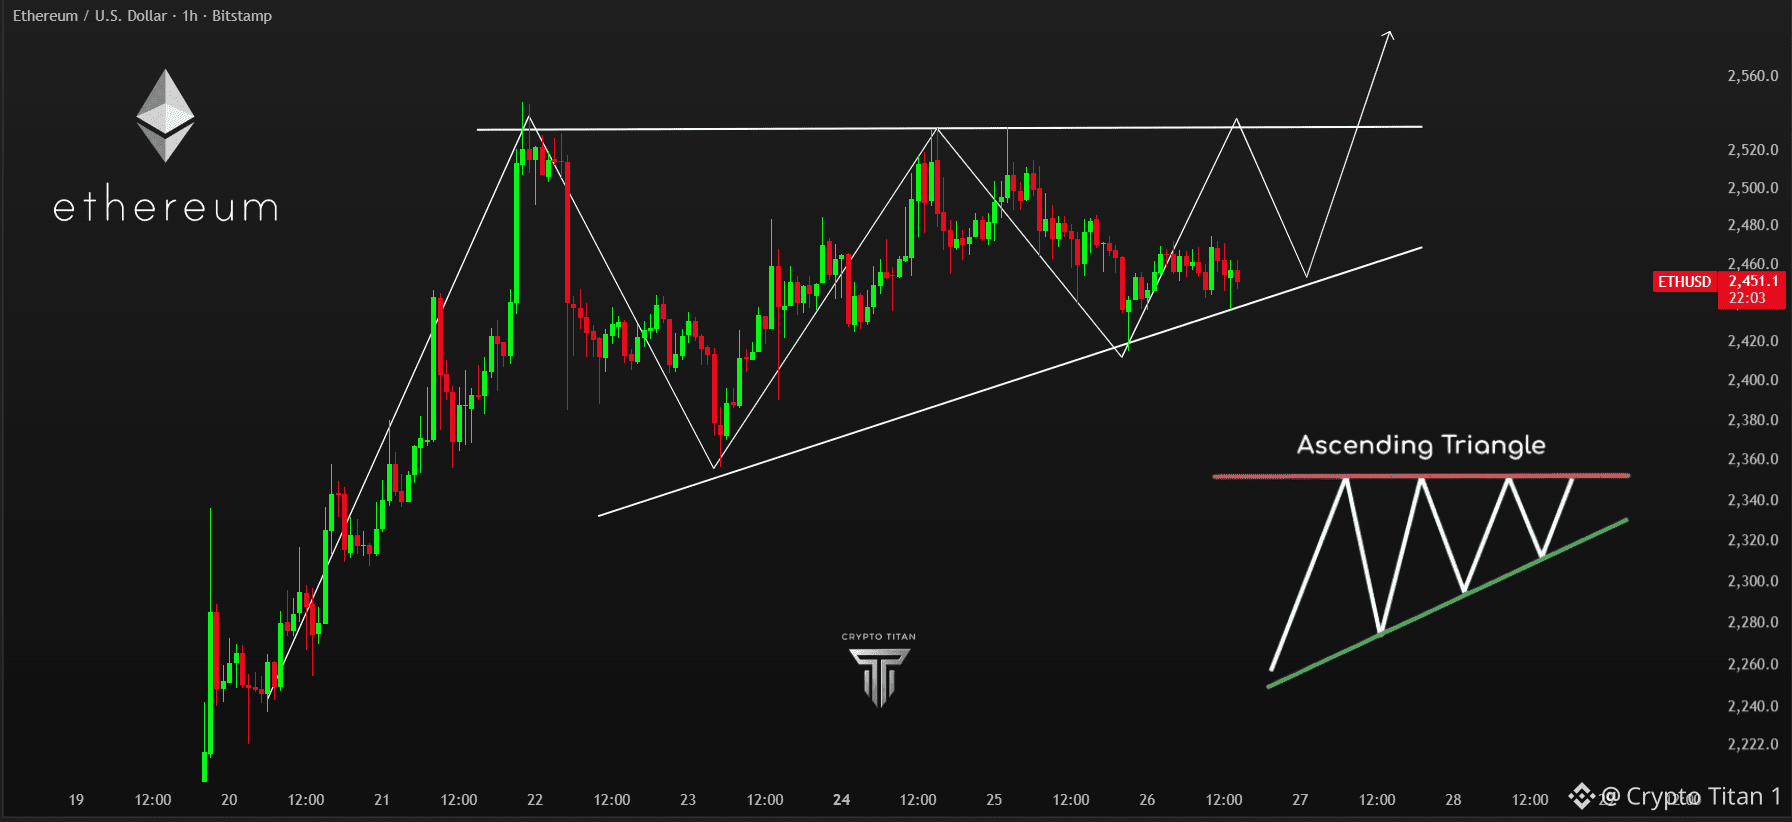
🚨 以太坊正在形成一個清晰的上升三角形。

我已經在我目前
$ETH
的進場位置,約在現階段的價格附近,而 $2,530 仍是關鍵阻力。

若能乾淨突破並站上它,可能會觸發下一波上漲走勢。
🚨 比特幣一再重複同樣的故事。 每一次 $BTC 主要週期的底部出現時,都伴隨着同樣的錯誤:“我們錯過了底部。” 而現在是 2026。 這個模式很清晰——在底部,市場很少給你信心。📈
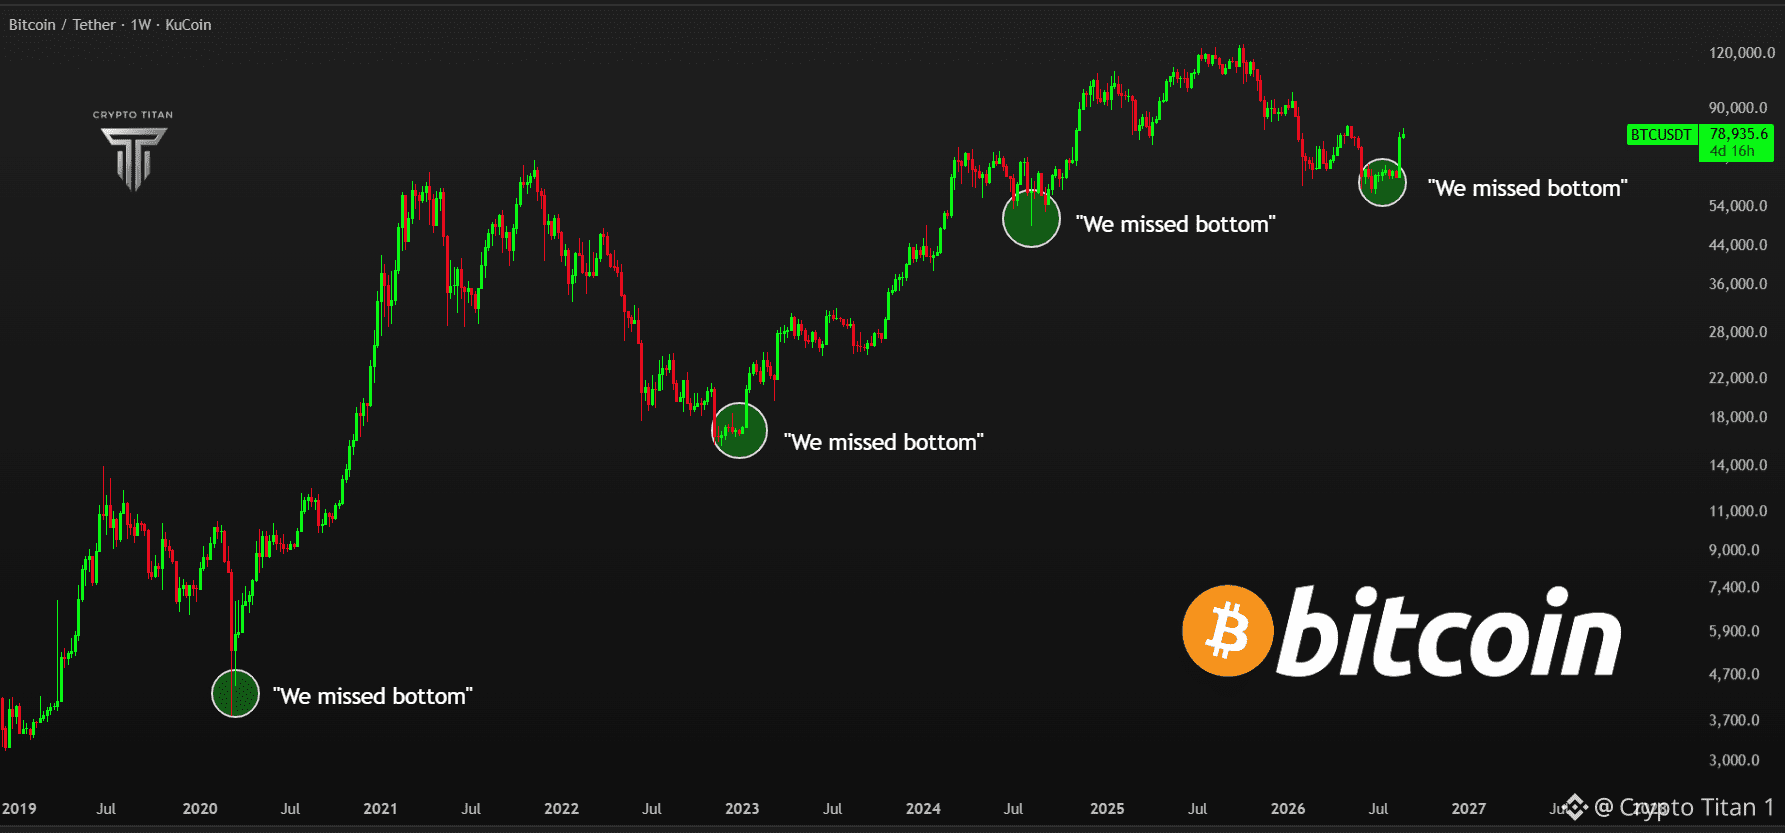
🚨 比特幣一再重複同樣的故事。

每一次 $BTC 主要週期的底部出現時,都伴隨着同樣的錯誤:“我們錯過了底部。”

而現在是 2026。

這個模式很清晰——在底部,市場很少給你信心。📈
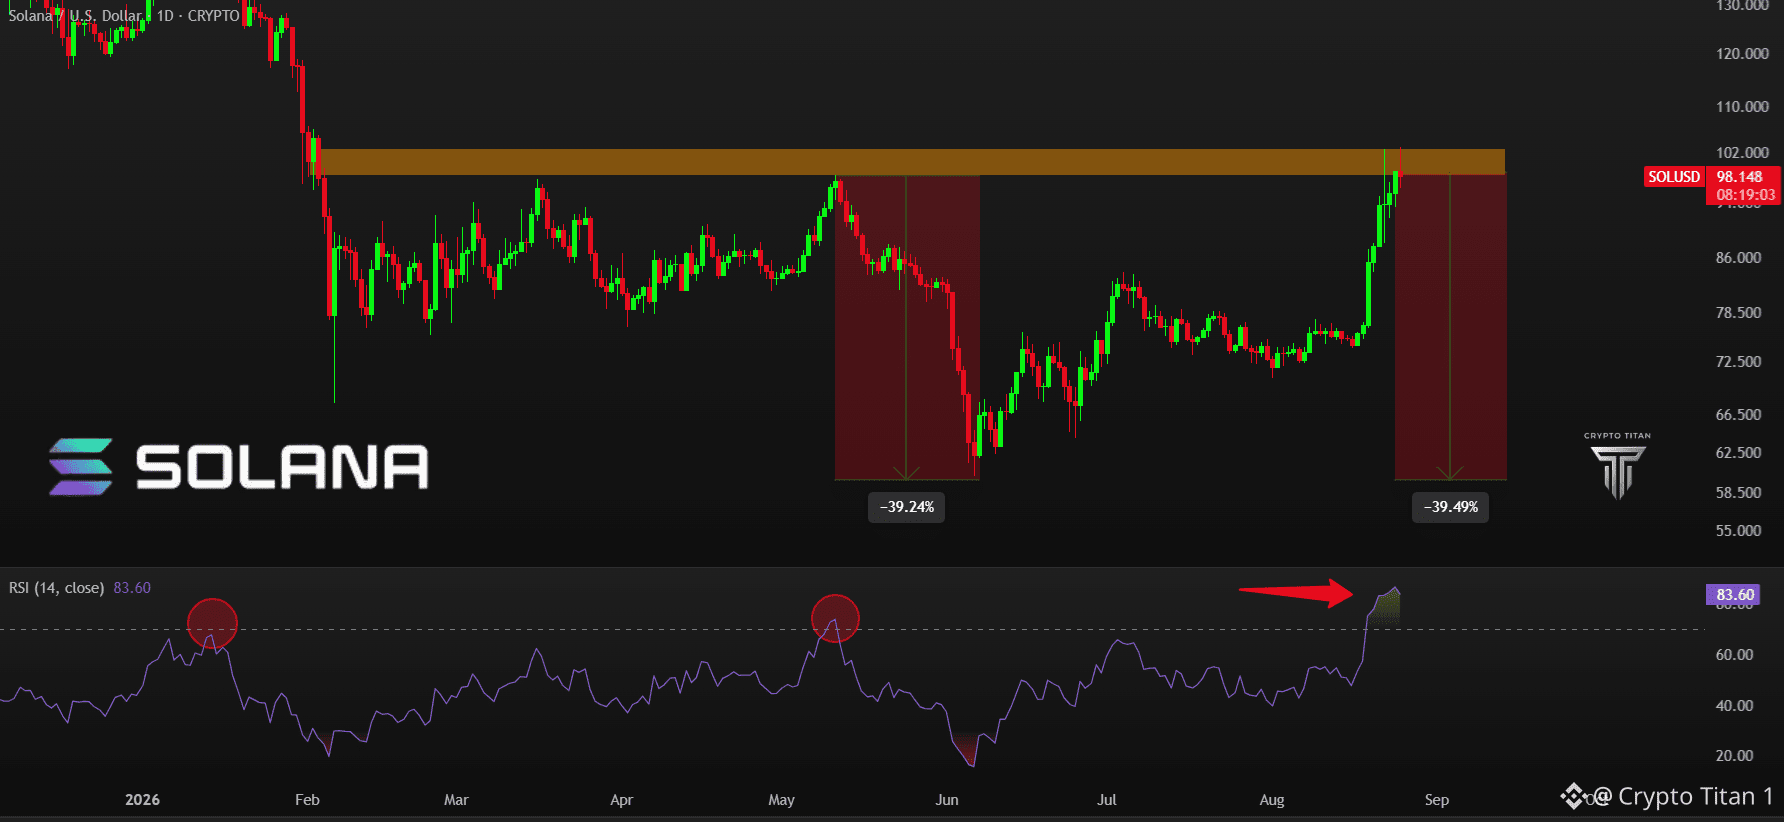
🚨 索拉納(Solana)回到相同的阻力區。過去兩次 RSI 到達這個水位時,$SOL SOL 隨後都下跌了將近 40%。現在 RSI 又回到 83 以上……我正密切關注這一波。👀
🚨 比特幣正在測試一個此前曾兩次拒絕價格的關鍵區間。 $BTC BTC 重新回到 $78K–$80K 區間的高點附近,而 RSI 也正在接近過去偏離時所出現的相同水準。 如果這個區間再次重演,下一步可能會變得很有意思。 👀
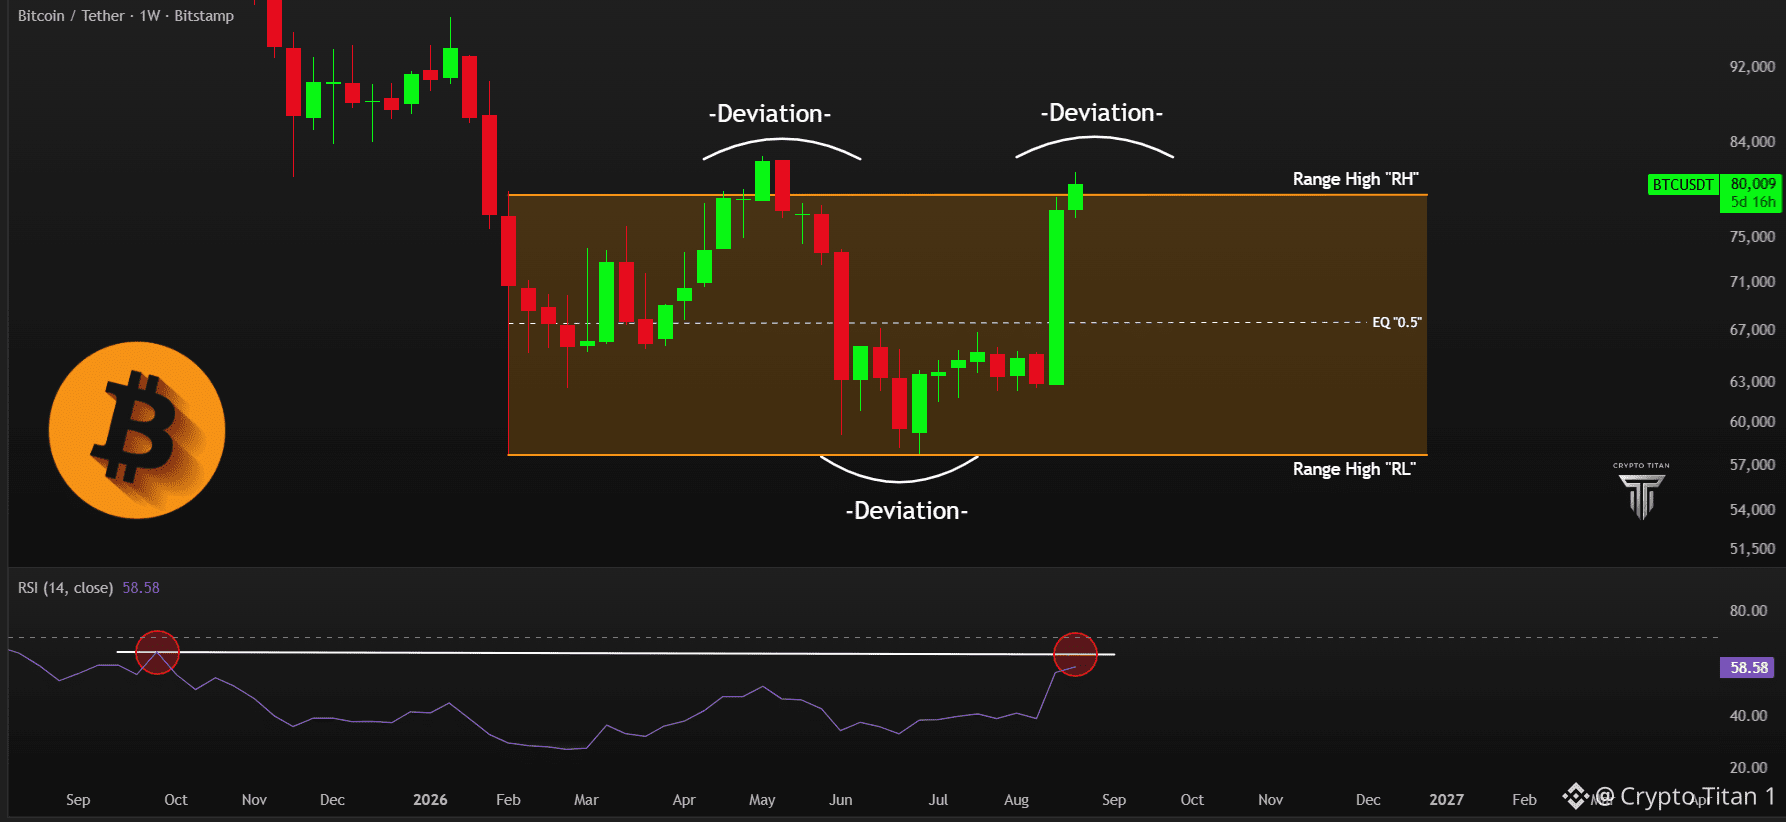
🚨 比特幣正在測試一個此前曾兩次拒絕價格的關鍵區間。

$BTC BTC 重新回到 $78K–$80K 區間的高點附近,而 RSI 也正在接近過去偏離時所出現的相同水準。

如果這個區間再次重演,下一步可能會變得很有意思。 👀
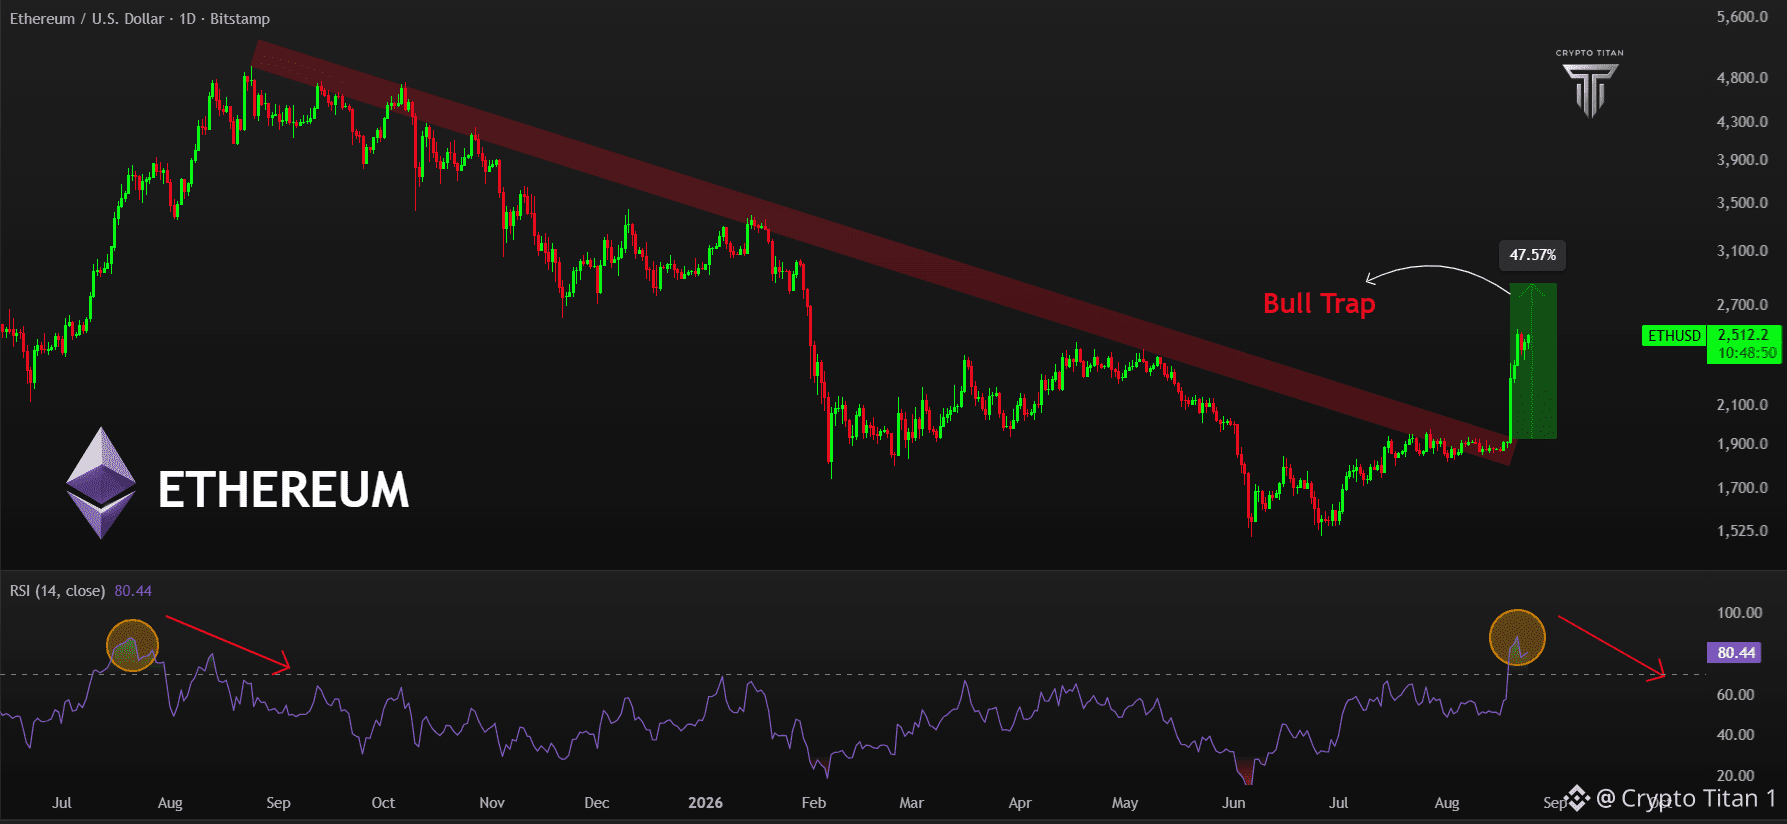
🚨 以太幣的該死牛市陷阱正在逼近。 $ETH 剛剛暴漲了 47.57%。 RSI 現在已達 80.44 — 對應的是相同的超買型態。
🚨 以太幣的該死牛市陷阱正在逼近。

$ETH
剛剛暴漲了 47.57%。

RSI 現在已達 80.44 —
對應的是相同的超買型態。
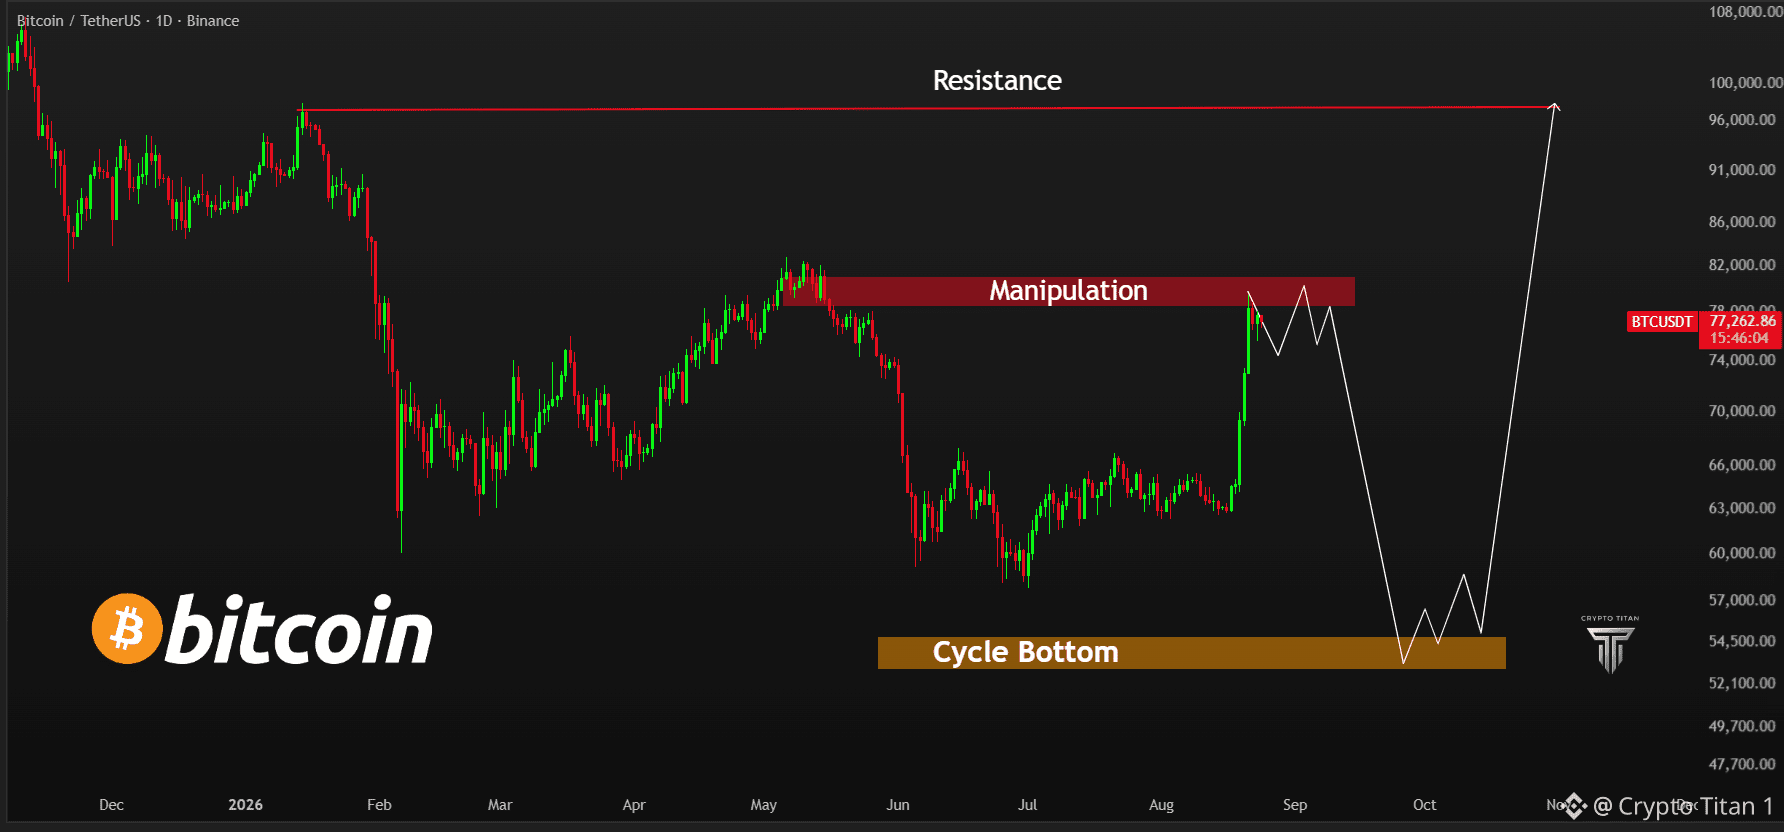
🚨 比特幣目前正處於關鍵水位。 $BTC 已被推入 $79K–$82K 的操控區間,走勢圖顯示可能會移向 $54K–$55K 的循環底部區域。 這個水位開始變得有趣了。
🚨 比特幣目前正處於關鍵水位。

$BTC
已被推入 $79K–$82K 的操控區間,走勢圖顯示可能會移向 $54K–$55K 的循環底部區域。

這個水位開始變得有趣了。
🚨 比特幣可能正在發出熟悉的信號。 動能指標剛剛形成了看漲交叉,這與 2024 年那次反彈期間出現的情況類似。 $BTC 也正在重新奪回關鍵阻力區。 這會是另一輪重大行情的起點嗎?📈
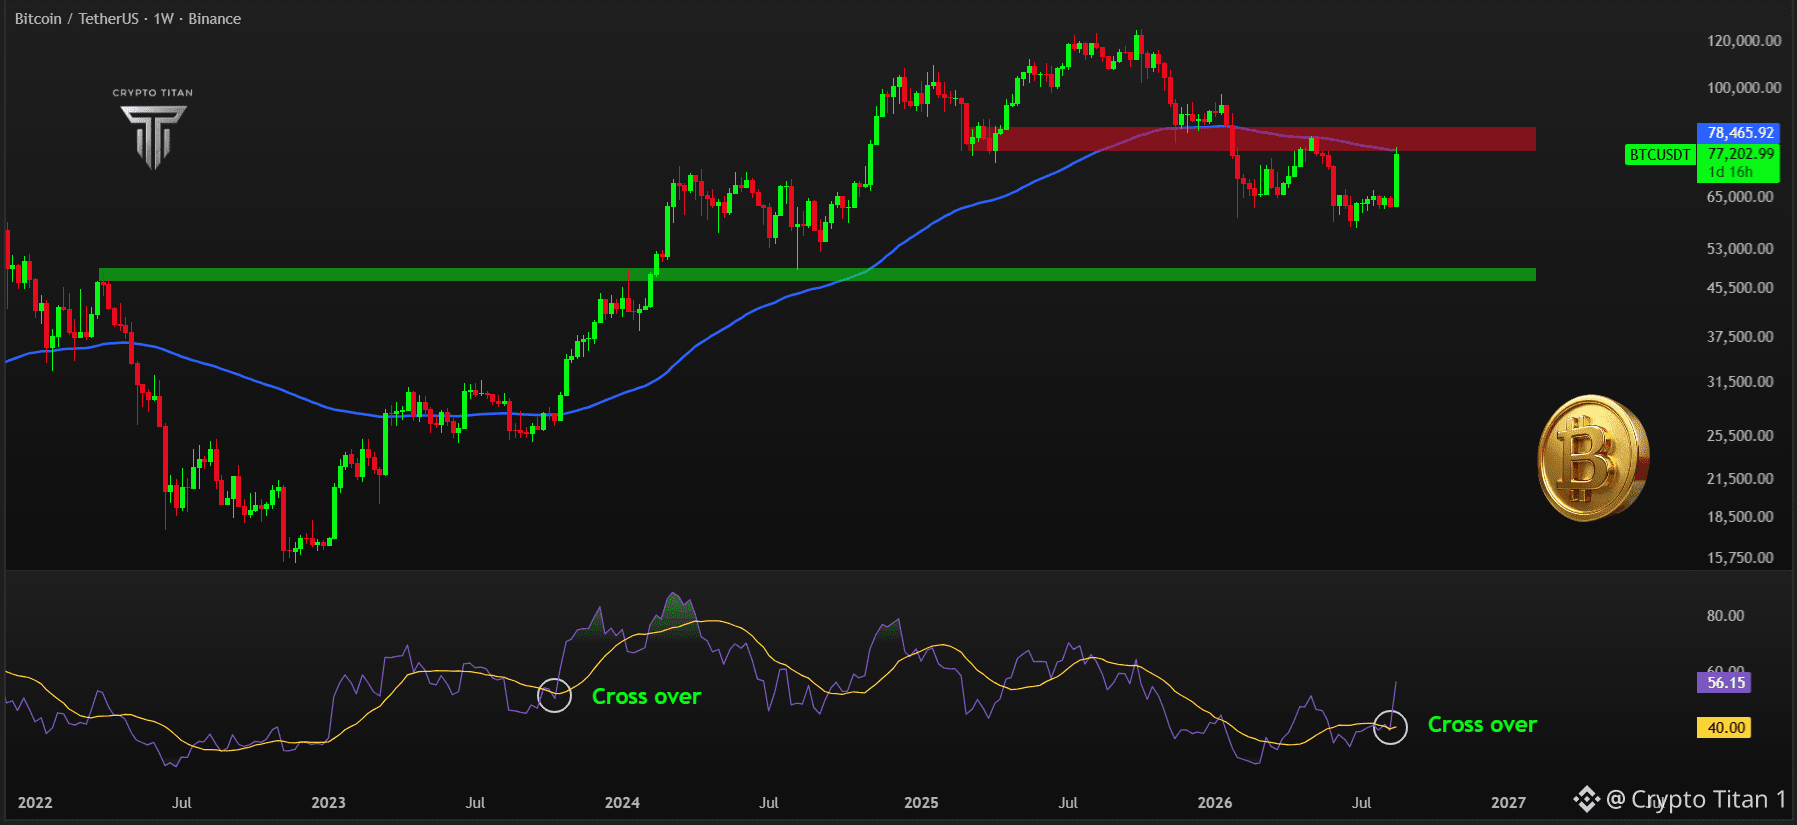
🚨 比特幣可能正在發出熟悉的信號。

動能指標剛剛形成了看漲交叉,這與 2024 年那次反彈期間出現的情況類似。

$BTC
也正在重新奪回關鍵阻力區。

這會是另一輪重大行情的起點嗎?📈
登入以探索更多內容
加入幣安廣場中的全球加密貨幣用戶
⚡️ 獲取加密貨幣的最新和實用資訊。
💬 受到全球最大加密貨幣交易所的信任。
👍 發掘來自經過驗證創作者的真實見解。
電子郵件 / 電話號碼
網站地圖
Cookie 偏好設定
平台條款